evaluating agri-environmental schemes – the marginal cost of ecosystem services johannes sauer and...
Post on 21-Dec-2015
215 views
TRANSCRIPT

Evaluating Agri-Environmental Evaluating Agri-Environmental Schemes – The Marginal Cost of Schemes – The Marginal Cost of
Ecosystem ServicesEcosystem Services
Johannes Sauer and Ada WossinkJohannes Sauer and Ada WossinkEconomicsEconomics, School of Social Sciences, , School of Social Sciences,
University of Manchester University of Manchester

2
What is the issue?
• Growing literature on the societal relevance and valuation of ecosystems services
• This knowledge is important but understanding and modelling the underlying processes leading to service provision is essential for predicting and managing change in ecosystem services (Nicholson et al., 2009).
• We address this issue in the context of agri-environmental agreements

3
Research Question
How to determine the cost of marginal ecosystem changes and the effectiveness of green payments based on a theoretical and empirical analysis of the bio-economic production relationships at the micro (farm) level.
supply curves should be estimated at a low level of aggregation accounting for biophysical and socio-economic variability
relationships between marketed output and non-marketed ES, and assessment of direct and opportunity costs at the margin

4
Approach/Contribution
• New theoretical approach based on generalized joint production model which allows complementary, substitutive and competitive relationships.
• We implement this theoretical framework empirically as a transformation function.
• Third, we include farm/farmer specific impacts and use panel data analysis.
• We apply our approach to UK data on the Environmental Stewardship Scheme (ESS) and the Hill Farm Allowance (HFA).

5
• Change in the supply of marketed output Y simultaneously affects the supply of non-marketed ecosystem service denoted by Z • Inputs contribute to both outputs and Z affects Y • Economies of scale and scope
ES-Dimension of Agricultural Production
Yield
ES positive
Z1ES negative
Z2
PPF1

6
Theoretical Model
• The two outputs are produced simultaneously but since these are multiple outputs a separate production function is used for each output.
• This leads to a generalised joint production model.
• This model allows for joint inputs and the possibility of varying the proportion of agricultural output and ES.

7
Theoretical Model
where Y = agricultural output Z = non-marketed ecosystem service X = input contributing to Y and Z D = site specific biotic and a-biotic environment.
YDZXF );,(
s.t.
cpXCMinX
ZDXG );(constraint on level of ecosystem service to establish marginal cost of trading-off Y for Z
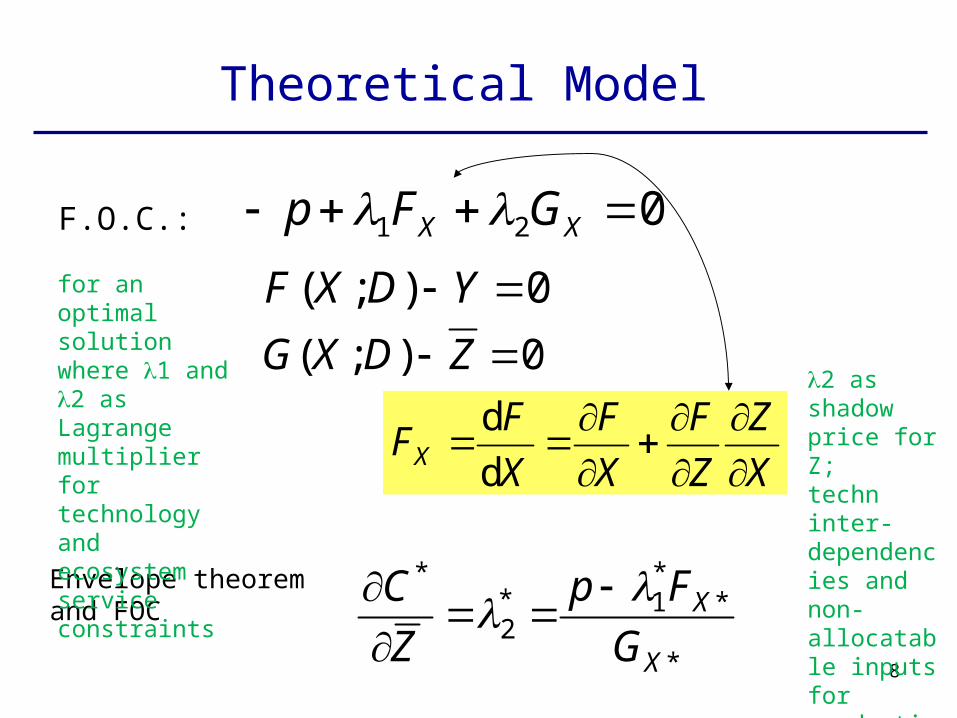
8
F.O.C.: 021 XX GFp
0);( YDXF
0);( ZDXG
*
**1*
2
*
X
X
G
Fp
Z
C
Envelope theorem and FOC:
Theoretical Model
X
Z
Z
F
X
F
X
FFX
dd
Envelope theorem and FOC:
for an optimal solutionwhere 1 and 2 as Lagrange multiplier for technology and ecosystem service constraints
2 as shadow price for Z;techn inter-dependencies and non-allocatable inputs for production of Z and Y

9
Three Cases
• Case 1: Complementary. The sum of the direct yield effect and the indirect yield effect of input use is positive (but decreasing) and the farmer can produce more Z while also increasing his commodity output Y. λ*2 = 0
• Case 2: Substitutive. Either the direct yield effect or the indirect yield effect, is non-positive but the net yield effect of the rearrangement of input X is positive. λ*2 = 0
• Case 3: Competitive. The direct yield effect of reallocating X is nil and there are yield losses caused by the required increase in Z needed to satisfy the constraint on the ecosystem services.
X
Z
Z
F
X
F
X
FFX
dd

10
Implementation
• Two schemes: the Environmental Stewardship Scheme (ESS) and the Hill Farm Allowance (HFA)

Implementation
11
Proportion of land under ESS Agro-env. payment per ha (ESS and other)

Implementation
12
• Panel data collected in England and Wales, 2005-2007
•Theoretical model implemented as a transformation function Y1= G(Y-1,X,T), where Y1 is agricultural output of the farms and Y-1 the vector of other outputs (Z payments and non-agricultural output YNAO).
• Generalized linear functional form, random effects specification.

13
Estimated Model
,euwithutyb
tzb tzbtxbttbtb
y xazxazxa
xxaxayaza za
x2ay2az2aza2ay
itiitititit NAO, NAOT
it5.0
it HFA, HFATit5.0
tiESS,ESSTit5.0
it
K
1k
kTitit Tit T
K
1k
5.0it AO,
5.0it k,kNAO
5.05.0it k,
K
1k
kHFA5.0
it ESS,5.0
it k,
K
1k
kESS
5.0it,
5.0it k,
K
1
k
K
1k
it k,kkit NAO, NAONAOit HFA,HFAHFA it ESS,ESSESS
K
1k
5.0it k,0k
5.0it NAO, 0NAO
5.0it HFA,0HFA
5.0it ESS,0ESS0it AO,
it HFA,

14
Results
Estimated Direct and Indirect Effects
Effect evaluated Mean Std. Dev. Min Max
dYAO/dX 173.978 259.197 -440.066 1591.110
dYAO/dZESS .372 2.887 -8.233 12.288
dYAO/dZHFA -2.529 6.310 -39.071 23.947
(dYAO/dZESS)(dZESS/dX) 0.065 0.032 0.006 0.192
(dYAO/dZHFA)(dZHFA/dX) 0.071 0.058 0.007 0.438
(dYAO/dZESS)(dZESS/dZHFA) -6.61e-04 5.61e-04 -0.004 -7.01e-05
(dYAO/dYNAO)(dYNAO/dZHFA) 9.03e-05 7.74E-05 1.21e-05 5.83e-04
(dYAO/dYNAO)(dYNAO/dZESS) -5.03e-05 3.09E-05 -2.24e-04 5.24e-06
(dYAO/dYNAO)(dYNAO/dX) -0.008 0.005 -0.043 -7.11e-04
15
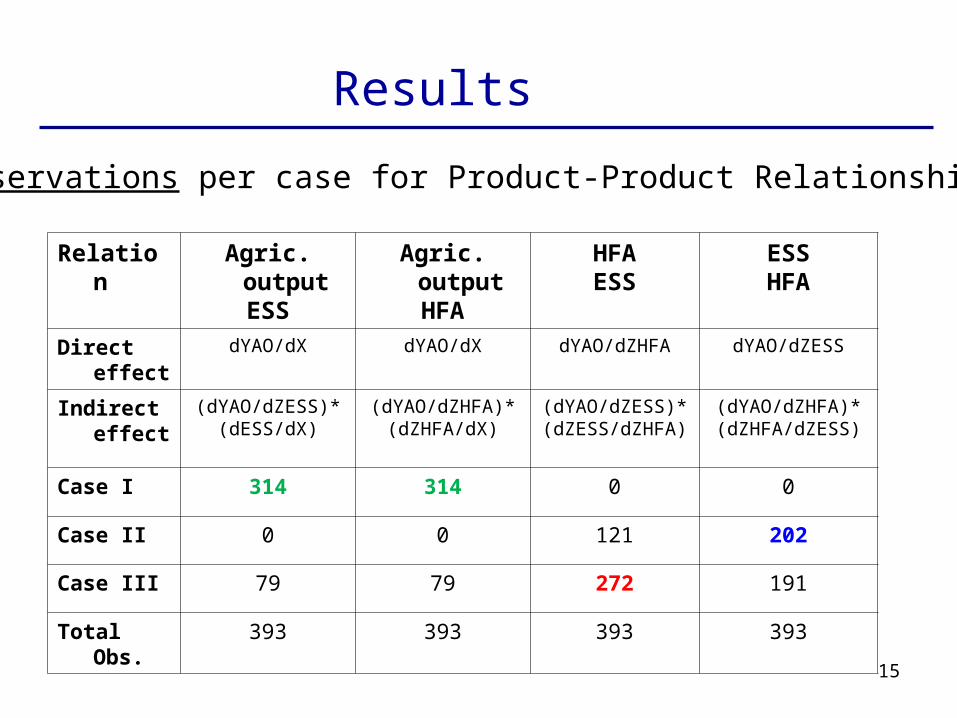
Results
# Observations per case for Product-Product Relationships
Relation Agric. outputESS
Agric. outputHFA
HFAESS
ESSHFA
Direct effect
dYAO/dX dYAO/dX dYAO/dZHFA dYAO/dZESS
Indirect effect
(dYAO/dZESS)*(dESS/dX)
(dYAO/dZHFA)*(dZHFA/dX)
(dYAO/dZESS)*(dZESS/dZHFA)
(dYAO/dZHFA)*(dZHFA/dZESS)
Case I 314 314 0 0
Case II 0 0 121 202
Case III 79 79 272 191
Total Obs. 393 393 393 393

04/18/23 vTI
Options for Efficient Reorganisation of Production
Y – Zrelationship
Case 1 –complementary
Case 2 –substitutive
Case 3 –competitive
AO - ESS+ agricultural output+ environm output
(314 farms)(79)
AO - HFA + agricultural output+ environm output
(314 )(79)
HFA - ESS (121) + environm output 2 (272)
ESS - HFA
+ environm output 1or+ environm output 2
(202)(191)
HFA - NAO(121)
+ non-agricultural output
(272)
ESS - NAO+ environm output 1or+ non-agricultural output (202) (191)
AO - NAO+ agricultural outputoder+ non-agricultural output (314) (79)

17
Conclusions - Empirics
The majority of farms produce agricultural output and ecosystem services in a complementary relationship (λ*2 = 0 )
Generation of multiple ecosystem services on the same farm showed either a substitutive or competitive relationship.
Changing the composition of the ecosystem services output (HFA, ESS) would have very different implications for individual farms.

18
Current / Further Work
• modelling issues:
• monetary payments vs. “service quantities”• correction for potential selection bias
• look at spatial patterns
• investigate significant characteristics of the farms being part of the classes I-III as estimated in our paper
• more sophisticated modelling approaches (dynamic panel data approach, mixed-effects logistic approach)