evaluating social programs - abdul latif jameel … presentations 2:30 – 3:00 coffee break coffee...
TRANSCRIPT

Evaluating Social Programs March 25 – 29, 2013
Executive Education at the Jameel Poverty Action Lab

Table of Contents Course Schedule...........................................................................................................................1 Maps and Directions to Venues...................................................................................................3 Course Objectives........................................................................................................................7
Biographies of J-PAL Lecturers.................................................................................................9
List of Participants.....................................................................................................................11
Groups........................................................................................................................................13
Wireless Instructions.................................................................................................................15
Course Material
Case Study 1: Women as Policymakers……...................................................................17
Case Study 2: Learn to Read Evaluations…..................................................................23
Case Study 3: Extra Teacher Program..........................................................................33
Case Study 4: Deworming in Kenya..............................................................................37
Exercise A: Random Sampling and Law of Large Numbers........................................45
Exercise B: Mechanics of Randomization ....................................................................47
Exercise C: Sample Size Estimation..............................................................................53
Group Presentation Guidelines.....................................................................................59
Checklist for Reviewing Randomized Evaluations of Social Programs....................................63
Impact Evaluation Glossary.......................................................................................................71


PROGRAM J-PAL Executive Education Course in Evaluating Social Programs, March 25 – 29, 2013
Massachusetts Institute of Technology
Monday
March 25, 2013
Tuesday
March 26, 2013
Wednesday
March 27, 2013
Thursday
March 28, 2013
Friday
March 29, 2013
8:30 – 9:00 Registration/Breakfast Breakfast Breakfast Breakfast Breakfast
9:00 – 10:30 Welcoming remarks and Expectations Survey
Lecture 1: What is Evaluation
(Marc Shotland, J-PAL)
Lecture 3: Why Randomize
(Dan Levy, HKS)
Lecture 5: Sampling and Sample Size
(Benjamin Olken, MIT)
Lecture 6: Threats and Analysis
(Shawn Cole, HBS)
Lecture 8: Cost-effectiveness Analysis and Scaling up
(Mary Ann Bates, J-PAL)
10:30 – 10:45 Coffee Break Coffee Break Coffee Break Coffee Break Coffee Break
10:45 – 12:00 Group work on case study 1: Theory of Change:
Women as Policymakers
Decision on group project
Group Exercise A: Random Sampling
Group work on presentation: Randomization Design
Group work on presentation:
Threats and Analysis
Feedback survey
12:00 – 1:00 Lunch Lunch Lunch Lunch Lunch
1:00 – 2:30 Lecture 2: Outcomes, Impact, and
Indicators
(Nava Ashraf, HBS)
Lecture 4: How to Randomize
(Sandip Sukhtankar, Dartmouth College)
Group Exercise C: Sample Size Estimation
Lecture 7: Project from Start to Finish
(Rachel Glennerster, J-PAL)
Group presentations
2:30 – 3:00 Coffee Break Coffee Break Coffee Break Coffee Break Coffee Break
3:00 – 4:00 Group work on presentation: Theory of change, research
question
Group Exercise B: Randomization Mechanics
Group work on presentation: Power and sample size
Group work on presentation
Finalize Presentation
Group presentations
Closing remarks
4:00 – 5:00 Group work on case study 2: Why Randomize: Learn to Read
Group work on presentation: Indicators
Group work on case study 3: How to Randomize: Extra Teacher
Program
Primer on Sample Size
Group work on case study 4: Threats and Analysis: Deworming in Kenya
7:00-9:00 Dinner: EVOO
1

2

Course Location The executive education course will be held in Building E51 (the Tang Center) on the east side of MIT’s campus (in the Kendall Square area) in Cambridge, MA. The Tang Center is located at the corner of Wadsworth Street and Amherst Street. Lectures will be held in room E51-395 on the third floor of the building.
Directions from the Boston/Logan airport to the Kendall Square area: By subway: Direct bus service from the airport to the subway system is located on the ground transportation level of the airport. Follow signs to Silver Line bus service, which takes you to South Station located on the red line. Take the outbound red line train to the Kendall/MIT station. Total one-way cost: $2.00 Alternatively, free shuttle bus service from the airport to the subway system is available on the ground transportation level of the airport. Follow signs for Massport Shuttle service, which takes you to the Airport station located on the blue line. Take the inbound blue line train to Government Center and switch to a green line train (B, C, D, or E). Take the green line train to the next stop, which is Park Street and switch to the red line, going outbound towards Alewife. Take the outbound red line train to the Kendall/MIT station. Total one-way cost: $2.00
3
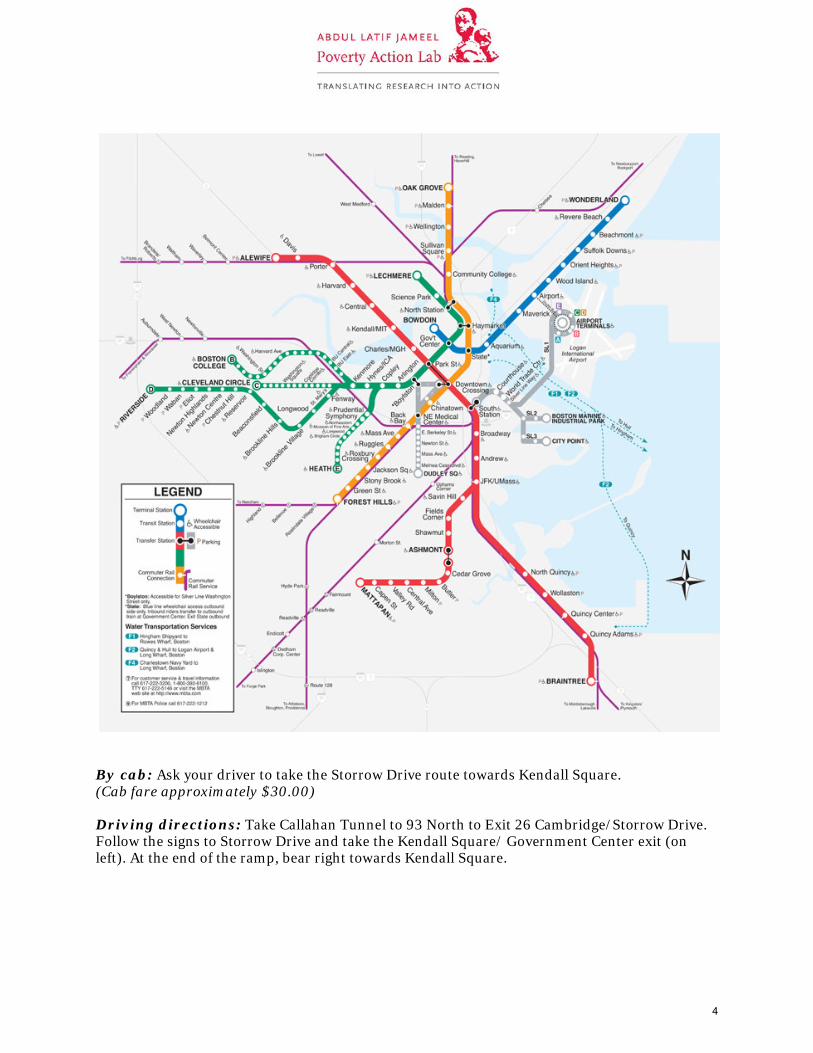
By cab: Ask your driver to take the Storrow Drive route towards Kendall Square. (Cab fare approximately $30.00) Driving directions: Take Callahan Tunnel to 93 North to Exit 26 Cambridge/Storrow Drive. Follow the signs to Storrow Drive and take the Kendall Square/ Government Center exit (on left). At the end of the ramp, bear right towards Kendall Square.
4
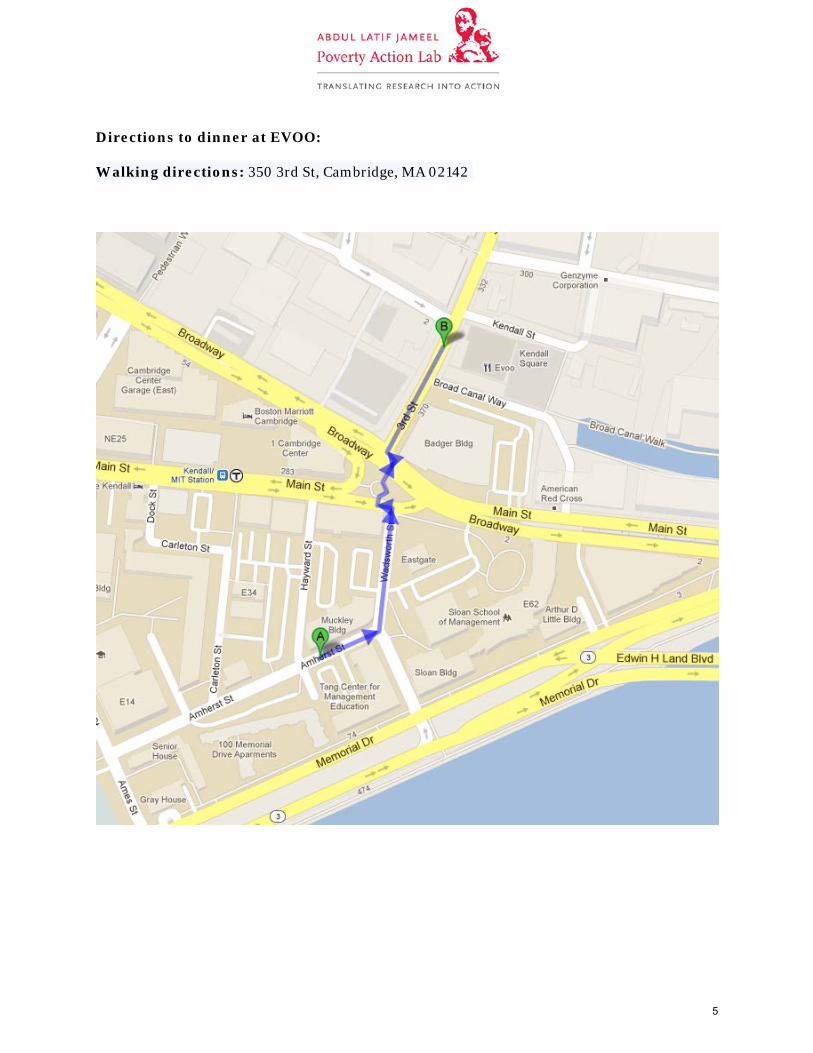
Directions to dinner at EVOO: Walking directions: 350 3rd St, Cambridge, MA 02142
5

6
Course Objectives Our executive training program is designed for people from a variety of backgrounds: managers and researchers from international development organisations, foundations, governments and non-governmental organisations from around the world, as well as trained economists looking to retool. The course is a full-time course. It is important for participants to attend all lectures and group work in order to successfully complete the course and receive the certificate of completion. Course Coverage The following key questions and concepts will be covered:
• Why and when is a rigorous evaluation of social impact needed? • The common pitfalls of evaluations, and how randomization can help. • The key components of a good randomized evaluation design • Alternative techniques for incorporating randomization into project design. • How do you determine the appropriate sample size, measure outcomes, and manage
data? • Guarding against threats that may undermine the integrity of the results. • Techniques for the analysis and interpretation of results. • How to maximise policy impact and test external validity.
The program will achieve these goals through a diverse set of integrated teaching methods. Expert researchers will provide both theoretical and example-based classes complemented by workshops where participants can apply key concepts to real world examples. By examining both successful and problematic evaluations, participants will better understand the significance of specific details of randomized evaluations. Furthermore, the program will offer extensive opportunities to apply these ideas ensuring that participants will leave with the knowledge, experience, and confidence necessary to conduct their own randomized evaluations.
7

8

J-PAL Lecturers Nava Ashraf Associate Professor of Business Administration Harvard Business School Nava Ashraf is an Associate Professor at Harvard Business School and a J-PAL affiliated professor. She has conducted randomized evaluations of many programs around the world, focused on innovations that can promote behavior change in microsavings, agriculture and health. Professor Ashraf has been working in Zambia since 2005 on several randomized evaluations in health services delivery and health technology adoption. Mary Ann Bates Policy Manager J-PAL Global Mary Ann Bates leads J-PAL’s work in creating publications that help communicate policy lessons from J-PAL’s evaluations to policymakers. She is also involved in working with governments, NGOs, foundations and international development organizations to disseminate the results from J-PAL’s work. Mary Ann is the lead staff for the Environment and Energy Program, where she is working with J-PAL’s affiliated professors to promote more randomized evaluations in that field and to disseminate the resulting policy lessons to answer questions at the intersection of environment, energy, and poverty reduction. Shawn Cole Associate Professor of Business Administration Harvard Business School Shawn Cole is an Associate Professor in the Finance Unit at Harvard Business School. His research examines corporate finance, banking, and consumer finance in developing countries, covering topics such as bank competition, government regulation, and household investment decisions. He has conducted randomized evaluations in education and financial literacy, as well as evaluations of market-based products to help farmers manage risk.
9

Rachel Glennerster Executive Director J-PAL Global Rachel Glennerster is Executive Director of J-PAL. Her current research includes randomized evaluations of community driven development and adoption of new agricultural technologies in Sierra Leone, empowerment of adolescent girls in Bangladesh, and health, education, and microfinance in India. She oversees J-PAL’s work to translate research findings into policy action and helped establish Deworm the World of which she is a board member. Dan Levy Lecturer in Public Policy Harvard Kennedy School of Government Dan Levy is a Lecturer in Public Policy at Harvard University's John F. Kennedy School of Government. He is currently involved in evaluations of a conditional cash transfer program in Jamaica and a set of education interventions in Burkina Faso. He also provides technical assistance and training to Mexico's Social Development Ministry on impact evaluations of social programs. Marc Shotland Director of Training and Senior Research Manager J-PAL Global Marc holds an MPA/International Development degree from Harvard University's Kennedy School of Government and a Bachelors degree in Economics from Williams College. He first joined Professors Duflo and Banerjee in the summer of 2002 to run randomized evaluations of education interventions as a field research associate in India. In 2004 he joined the Poverty Action Lab's Cambridge office as a research manager. He left in 2006 to earn his Masters at Harvard before rejoining J-PAL in 2008 in his current position. Sandip Sukhtankar Assisstant Porfessor of Economics Dartmouth College Sandip Sukhtankar is a Research Fellow in the Sustainability Science program at HKS and an Assistant Professor in the Department of Economics at Dartmouth College. His research interests lie at the intersection of development, political economy, and public economics, with a focus on corruption and governance issues. Most of his field work is based in India.
10
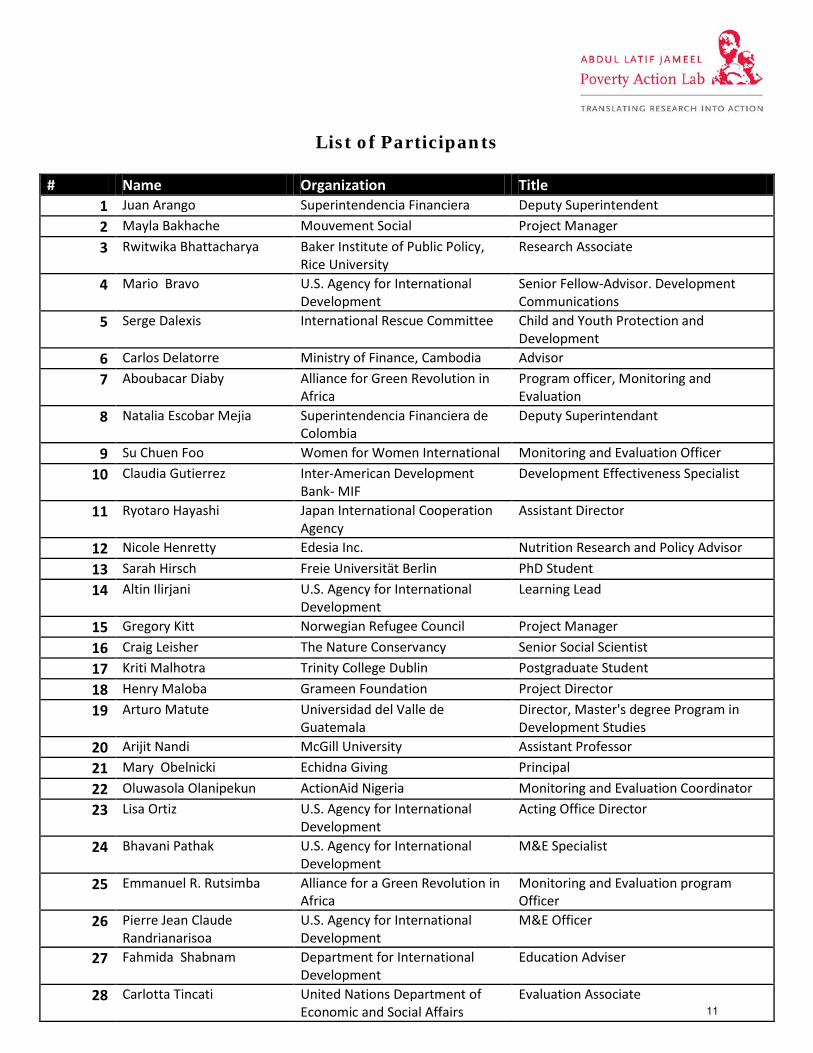
List of Participants
# Name Organization Title 1 Juan Arango Superintendencia Financiera Deputy Superintendent 2 Mayla Bakhache Mouvement Social Project Manager 3 Rwitwika Bhattacharya Baker Institute of Public Policy,
Rice University Research Associate
4 Mario Bravo U.S. Agency for International Development
Senior Fellow-Advisor. Development Communications
5 Serge Dalexis International Rescue Committee Child and Youth Protection and Development
6 Carlos Delatorre Ministry of Finance, Cambodia Advisor 7 Aboubacar Diaby Alliance for Green Revolution in
Africa Program officer, Monitoring and Evaluation
8 Natalia Escobar Mejia Superintendencia Financiera de Colombia
Deputy Superintendant
9 Su Chuen Foo Women for Women International Monitoring and Evaluation Officer 10 Claudia Gutierrez Inter-American Development
Bank- MIF Development Effectiveness Specialist
11 Ryotaro Hayashi Japan International Cooperation Agency
Assistant Director
12 Nicole Henretty Edesia Inc. Nutrition Research and Policy Advisor 13 Sarah Hirsch Freie Universität Berlin PhD Student 14 Altin Ilirjani U.S. Agency for International
Development Learning Lead
15 Gregory Kitt Norwegian Refugee Council Project Manager 16 Craig Leisher The Nature Conservancy Senior Social Scientist 17 Kriti Malhotra Trinity College Dublin Postgraduate Student 18 Henry Maloba Grameen Foundation Project Director 19 Arturo Matute Universidad del Valle de
Guatemala Director, Master's degree Program in Development Studies
20 Arijit Nandi McGill University Assistant Professor 21 Mary Obelnicki Echidna Giving Principal 22 Oluwasola Olanipekun ActionAid Nigeria Monitoring and Evaluation Coordinator 23 Lisa Ortiz U.S. Agency for International
Development Acting Office Director
24 Bhavani Pathak U.S. Agency for International Development
M&E Specialist
25 Emmanuel R. Rutsimba Alliance for a Green Revolution in Africa
Monitoring and Evaluation program Officer
26 Pierre Jean Claude Randrianarisoa
U.S. Agency for International Development
M&E Officer
27 Fahmida Shabnam Department for International Development
Education Adviser
28 Carlotta Tincati United Nations Department of Economic and Social Affairs
Evaluation Associate 11
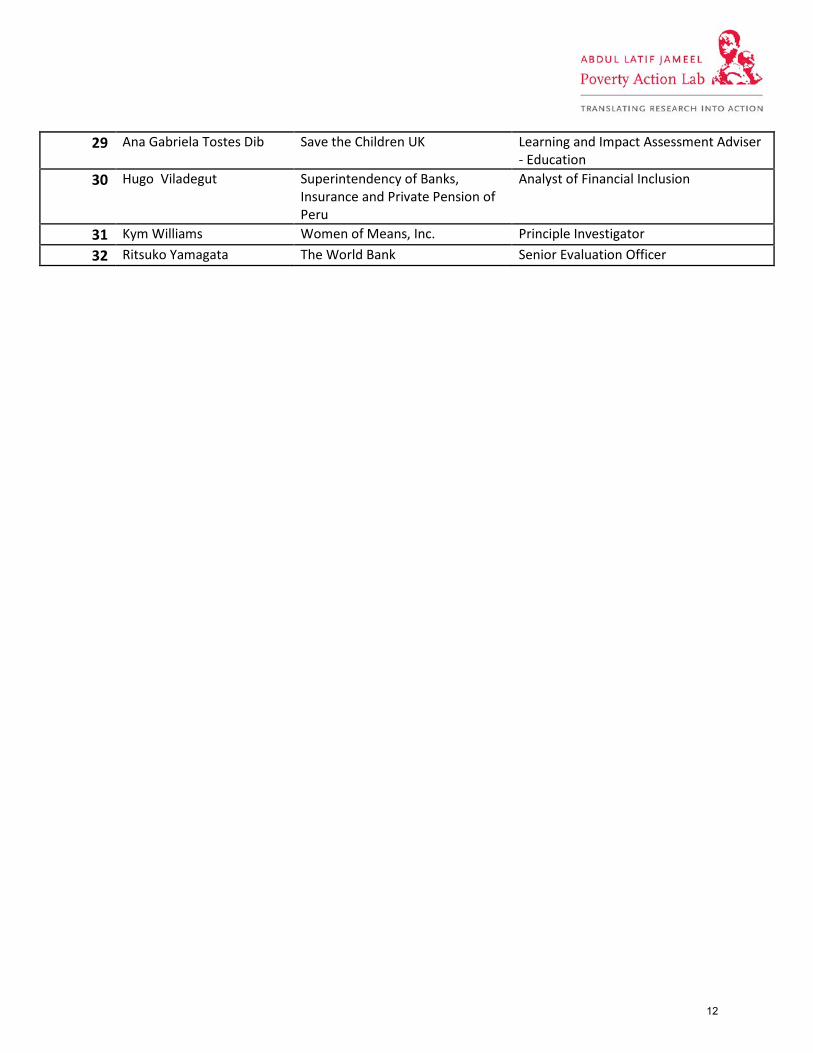
29 Ana Gabriela Tostes Dib Save the Children UK Learning and Impact Assessment Adviser - Education
30 Hugo Viladegut Superintendency of Banks, Insurance and Private Pension of Peru
Analyst of Financial Inclusion
31 Kym Williams Women of Means, Inc. Principle Investigator 32 Ritsuko Yamagata The World Bank Senior Evaluation Officer
12

Groups
Group 1 TA: Ben Jaques
Room: 335
Group 2 TA: Sandro Diez-Amigo
Room: 361
Aboubacar Diaby Mayla Bakhache
Kriti Malhotra Arturo Matute Henry Maloba Mary Obelnicki
Emmanuel R. Rutsimba Ana Gabriela Tostes Dib Pierre Jean Claude Randrianarisoa Hugo Viladegut
Group 3
TA: Richard McDowell Room: 376
Group 4 TA: Ashish Shenoy
Room: 385
Su Chuen Foo Juan Arango
Ryotaro Hayashi Carlos Delatorre Nicole Henretty Natalia Escobar Mejia
Altin Ilirjani Claudia Gutierrez Gregory Kitt Sarah Hirsch
Group 5
TA: Claire Walsh Room: 390
Group 6 TA: Angela Ambroz
Room: 393
Mario Bravo Fahmida Shabnam Serge Dalexis Arijit Nandi Craig Leisher Oluwasola Olanipekun
Bhavani Pathak Kym Williams
Group 7 TA: Meghan Mahoney
Room: 061
Rwitwika Bhattacharya Lisa Ortiz
Carlotta Tincati Ritsuko Yamagata
13

14
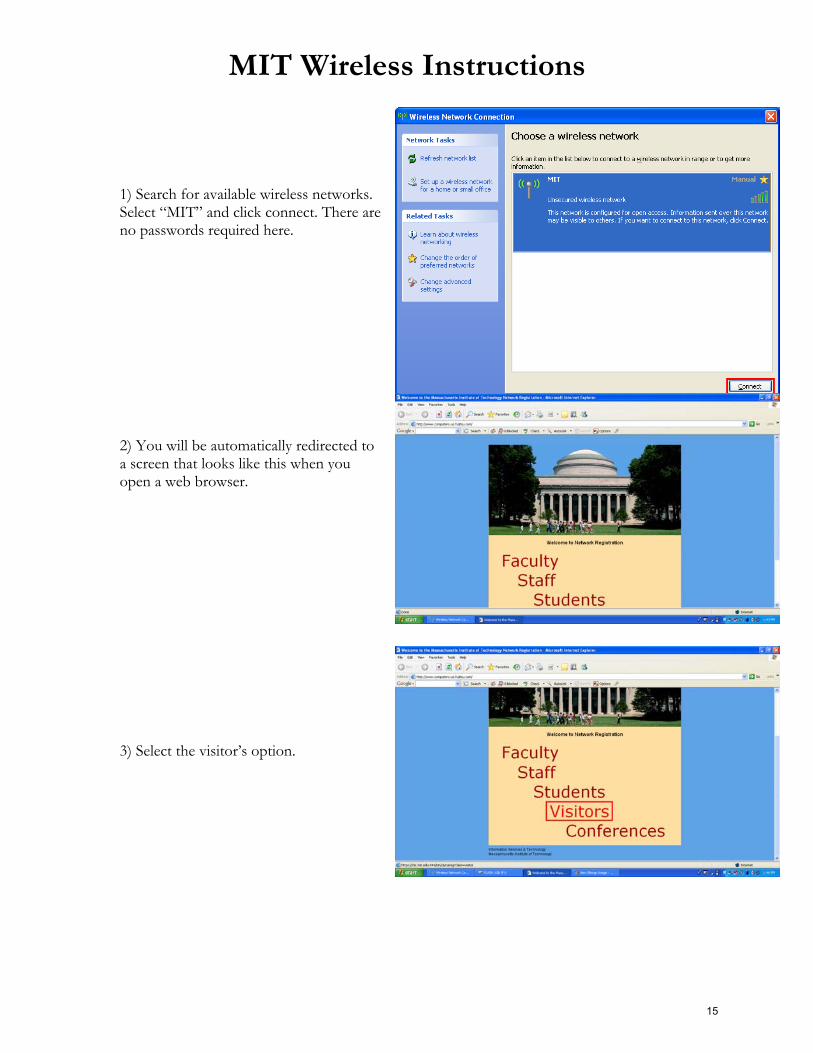
MIT Wireless Instructions 1) Search for available wireless networks. Select “MIT” and click connect. There are no passwords required here. 2) You will be automatically redirected to a screen that looks like this when you open a web browser. 3) Select the visitor’s option.
15
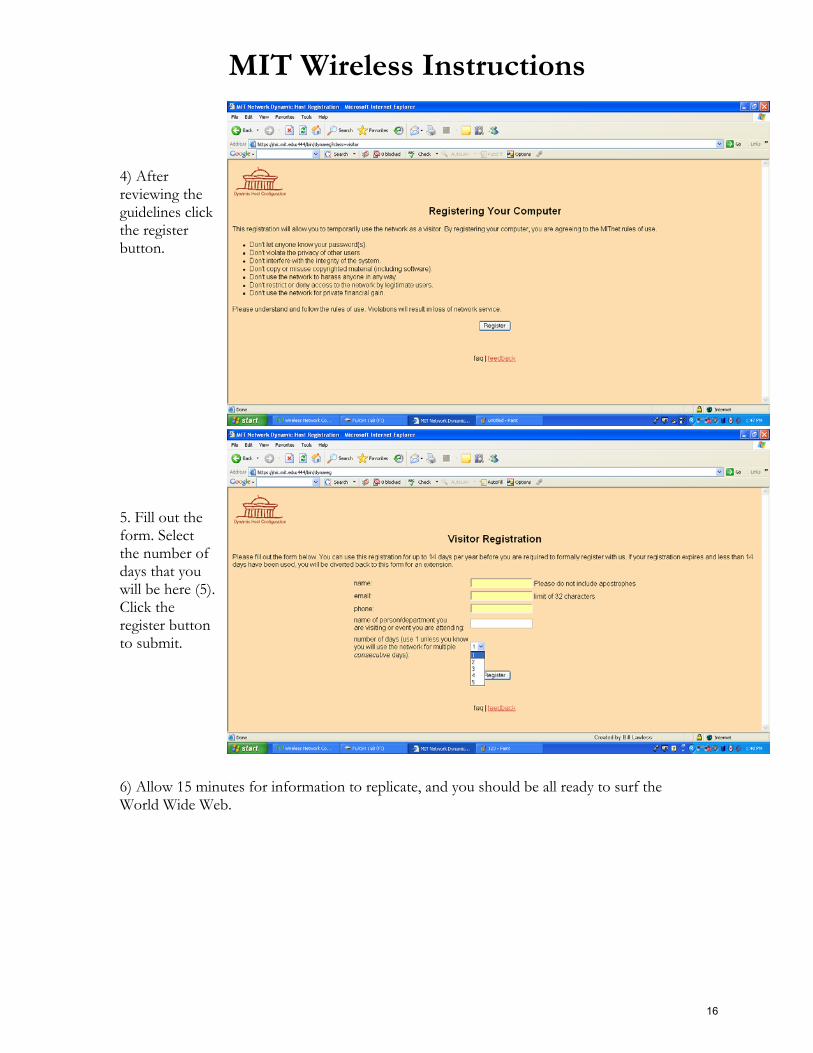
MIT Wireless Instructions 4) After reviewing the guidelines click the register button. 5. Fill out the form. Select the number of days that you will be here (5). Click the register button to submit. 6) Allow 15 minutes for information to replicate, and you should be all ready to surf the World Wide Web.
16
This case study is based on “Women as Policy Makers: Evidence from a Randomized Policy Experiment in India,” by Raghabendra Chattopadhyay and Esther Duflo (2004a), Econometrica 72(5), 1409-1443.
J-PAL thanks the authors for allowing us to use their paper
Case 3: Women as Policymakers
Measuring the effects of political reservations
Thinking about measurement and outcomes
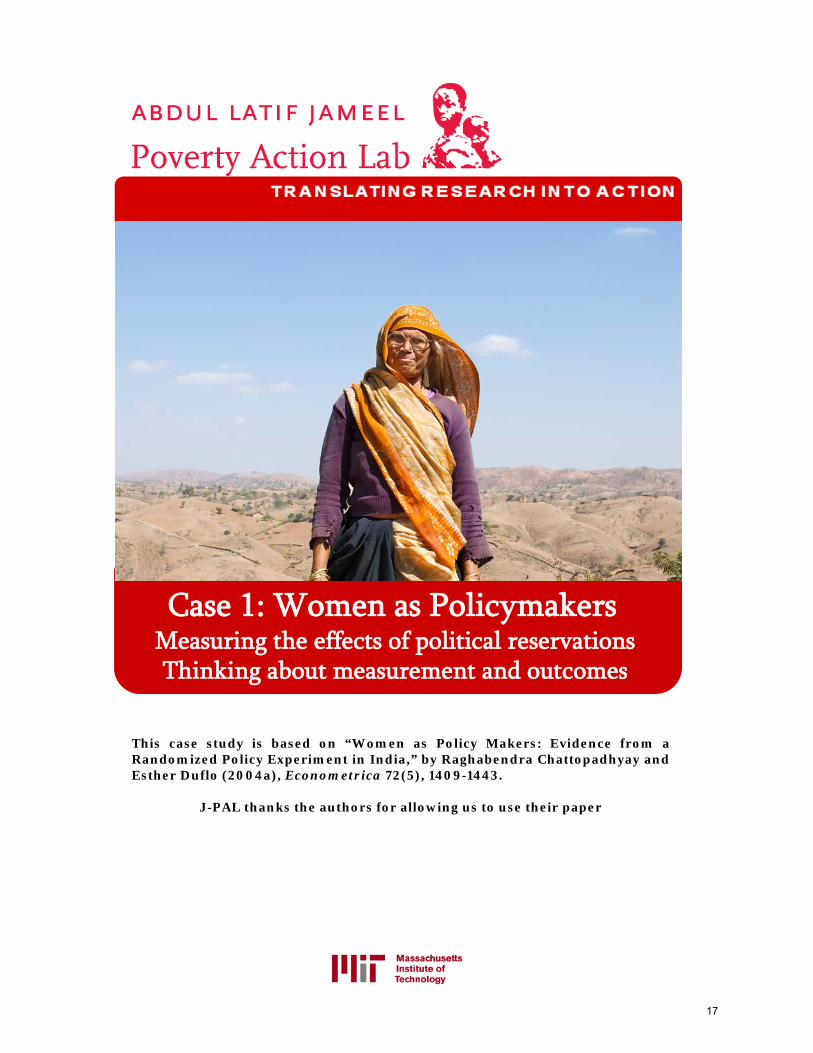
Case 1: Women as Policymakers
Measuring the effects of political reservations
Thinking about measurement and outcomes
17
J-PAL Executive Education Course Case Study 1: Women as Policymakers
Key Vocabulary
India amended its federal constitution in 1992, devolving power over local development programs from the states to rural councils, or Gram Panchayats (Village Councils). The Village Councils now choose what development programs to undertake and how much of the budget to invest in them. The states are also required to reserve a third of Village Council seats and Village Council chairperson positions for women. In most states, the schedule on which different villages must reserve seats and positions is determined randomly. This creates the opportunity to rigorously assess the impact of quotas on politics and government: Do the policies differ when there are more women in government? Do the policies chosen by women in power reflect the policy priorities of women? Since randomization was part of the Indian government program itself, the evaluation planning centered on collecting the data needed to measure impact. The researchers’ questions were what data to collect and what data collection instruments to use.
Empowering the Panchayati Raj Village Councils, known locally as Panchayats, have a long tradition in rural India. Originally, panchayats were assemblies (yat) of five (panch) elders, chosen by the community, convened to mediate disputes between people or villages. In modern times Village Councils have been formalized into institutions of local self-government, and are no longer limited to only “five elders”. This formalization came about through the constitution. In 1992, India enacted the 73rd amendment, which directed the states to establish a three-tier Panchayati Raj system. The Village Council is the grassroot unit1 of this system, each council consisting of councilors elected every five years. The councilors elect from among themselves a council chairperson called a Pradhan. Decisions are made by a majority vote and the chairperson has no veto power. But as the only councilor with a full-time appointment, the chairperson wields effective power. The 73rd amendment aimed to decentralize the delivery of public goods and services essential for development in rural areas. The states were directed to delegate the power to plan and implement local development programs to the Village Councils. Funds still come from the central government but are no longer earmarked for specific uses. Instead, the Village Council decides which programs to implement and 1 Village councils, called Gram Panchayats, form the basic units of the Panchayat Raj. Village council chairs, elected by the members of the village council, serve as members of the block—subdistrict—council (panchayat samiti). At the top of the system is the district council (zilla parishad) made up of the block council chairs.
1. Hypothesis: a proposed explanation of and for the effects of a given intervention. Hypotheses are intended to be made ex-ante, or prior to the implementation of the intervention. 2. Indicators: metrics used to quantify and measure specific short-term and long-term effects of a program. 3. Logical Framework: a management tool used to facilitate the design, execution, and evaluation of an intervention. It involves identifying strategic elements (inputs, outputs, outcomes and impact) and their causal relationships, indicators, and the assumptions and risks that may influence success and failure. 4. Theory of Change: describes a strategy or blueprint for achieving a given long-term goal. It identifies the preconditions, pathways and interventions necessary for an initiative's success.
18
J-PAL Executive Education Course Case Study 1: Women as Policymakers
how much to invest in them. As of 2005, Village Councils can chose programs from 29 specified areas, including welfare services (for example, public assistance for widows, care for the elderly, maternity care, antenatal care, and child health) and public works (for example, drinking water, roads, housing, community buildings, electricity, irrigation, and education).
Empowering women in the Panchayati Raj The population covered by a single Village Council can be large and diverse. In West Bengal, for example, each council represents up to 12 villages and up to 10,000 people, who can vary by religion, ethnicity, caste, and, of course, gender. Political voice varies by group identities drawn along these lines. If policy preferences vary by group identity and if the councilors’ identities influence policy choices, then groups underrepresented in politics and government could be shut out as Village Councils could ignore those groups’ policy priorities. There were fears that the newly empowered Village Councils would undermine the development priorities of traditionally marginalized groups, such as low-caste members or women. To remedy this, the 73rd amendment included two mandates to ensure that investments reflected the needs of everyone in the Village Council. The first mandate secures community input. If Village Council investments are to reflect a community’s priorities, the councilors must first know what those priorities are. Accordingly, Village Councils are required to hold a general assembly every six months or every year to report on activities in the preceding period and to submit the proposed budget to the community for ratification. In addition, the Chairpersons are required to set up regular office hours to allow constituents to formally request services and lodge complaints. Both requirements allow constituents to articulate their policy preferences. The second mandate secures representation in the council for women. States are required to reserve at least a third of all council seats and Chairperson positions for women. Furthermore, states must ensure that the seats reserved for women are “allotted by rotation to different constituencies in a Panchayat [Village Council]” and that the chairperson positions reserved for women are “allotted by rotation to different Panchayats [Village Councils].” In other words, they have to ensure that reserved seats and chairperson positions rotate evenly within and across the Village Councils. 2
2 There were also reserved quotas for disadvantaged castes. The formula to determine caste-based quotas was more complicated given the varying composition of castes in different villages. Simultaneous research on the impact of these caste-based quotas was conducted, but is not discussed here.
19
J-PAL Executive Education Course Case Study 1: Women as Policymakers
Randomized quotas in India: What can it teach us? Your evaluation team has been entrusted with the responsibility to estimate the impact of quotas for women in the Village Councils. Your evaluation should address all dimensions in which quotas for women are changing local communities in India. What could these dimensions be? What data will you collect? What instruments will you use? As a first step you want to understand all you can about the quota policy. What needs did it address? What are the pros and cons of the policy? What can we learn from it?
What data to collect, What questions to answer? First, you need to be very clear about the likely impact of the program. It is on those dimensions that you believe will be affected that you will try to collect data. What are the main areas in which the quota policy should be evaluated? In which areas do you expect to see a difference as a result of quotas? What are all the possible effects of quotas?
Discussion Topic 1: Gender quotas in the Village Councils
1. What were the main goals of the Village Councils? 2. Women are underrepresented in politics and government. Only 10 percent of
India’s national assembly members are women, compared to 17 percent worldwide. Does it matter that women are underrepresented? Why and why not?
3. What were the framers of the 73rd amendment trying to achieve when they introduced quotas for women?
Gender quotas have usually been followed by dramatic increases in the political representation of women. Rwanda, for example, jumped from 24th place in the “women in parliament” rankings to first place (49 percent) after the introduction of quotas in 1996. Similar changes have been seen in Argentina, Burundi, Costa Rica, Iraq, Mozambique, and South Africa. Indeed, as of 2005, 17 of the top 20 countries in the rankings have quotas. Imagine that your group is the national parliament of a country deciding whether to adopt quotas for women in the national parliament. Randomly divide your group into two parties, one against and one for quotas.
Discussion Topic 2: Using a logical framework to delineate your intermediate and final outcomes of interest
1. Brainstorm the possible effects of quotas, both positive and negative.
2. What evidence would you collect to strengthen the case of those who are for or against quotas? For each potential effect on your list, list also the indicator(s) you would use for that effect. For example, if you say that quotas will affect political participation of women, the indicator could be “number of women attending the General Assembly.”
20
J-PAL Executive Education Course Case Study 1: Women as Policymakers
Multiple outcomes are difficult to interpret, so define a hypothesis Quotas for women could produce a large number of outcomes in different directions. For example, it may improve the supply of drinking water and worsen the supply of irrigation. Without an ex-ante hypothesis on the direction in which these different variables should be affected by the quota policy, it will be very difficult to make sense of any result we find. Think of the following: if you take 500 villages and randomly assign them in your computer to a “treatment” group and a “control” group, and then run regressions to see whether the villages look different along 100 outcomes, would you expect to see some differences among them? Would it make sense to rationalize those results ex-post? The same applies to this case: if you just present your report in front of the commission who mandated you to evaluate this policy, explaining that the quota for women changed some variables and did not change others, what are they supposed to make of it? How will they know that these differences are not due to pure chance rather than the policy? You need to present them with a clear hypothesis of how quotas are supposed to change policymaking, which will lead you to make predictions about which outcomes are affected.
Use a logical framework to delineate intermediate and final outcomes A good way of figuring out the important outcomes is to lay out your theory of change; that is, to draw a logical framework linking the intervention, step by step, to the key final outcomes.
Discussion Topic 2 continued…:
3. What might be some examples of key hypotheses you would test? Pick one.
4. Which indicators or combinations of indicators would you use to test your key hypothesis?
Discussion Topic 2 continued…:
5. What are the steps or conditions that link quotas (the intervention) to the final outcomes?
6. Which indicators should you try to measure at each step in your logical framework?
7. Using the outcomes and conditions, draw a possible logical framework, linking the intervention and the final outcomes.
21

22
This case study is based on “Pitfalls of Participatory Programs: Evidence from a Randomized Evaluation in India,” by Abhijit Banerjee (MIT), Rukmini Banerjee (Pratham), Esther Duflo (MIT), Rachel Glennerster (J-PAL), and Stuti Khemani (The World Bank)
J-PAL thanks the authors for allowing us to use their paper
Case 2: Remedial Education in India
Evaluating the Balsakhi Program
Incorporating random assignment into the program
Case 2: Learn to Read Evaluations
Evaluating the Read India Campaign
How to Read and Evaluate Evaluations
23

J-PAL Executive Education Course Case Study 2: Learn to Read Evaluations
Key Vocabulary
Why Learn to Read (L2R)? In a large-scale survey conducted in 2004, Pratham discovered that only 39% of children (aged 7-14) in rural Uttar Pradesh1 could read and understand a simple story, and nearly 15% could not recognize even a letter. During this period, Pratham was developing the “Learn-to-Read” (L2R) module of its Read India campaign. L2R was an ambitious effort that combined mobilization and a new pedagogy: a grassroots organizing effort to recruit tens of thousands of volunteers willing to teach basic literacy skills to millions of children. This program allowed the community to get involved in children’s education more directly through village meetings where Pratham staff shared information on the status of literacy in the village and the rights of children to education. In these meetings, Pratham identified community members who were willing to teach. Volunteers attended a training session on the pedagogy, after which they could hold after-school reading classes for children, using materials designed and provided by Pratham. Pratham staff paid occasional visits to these camps to ensure that the classes were being held and to provide additional training as necessary.
Did the Learn to Read project work?
1 Uttar Pradesh, a state in north India, is the country’s most populous state, boasting nearly 200 million people, according to the 2011 census.
1. Counterfactual: what would have happened to the participants in a program had they not received the intervention. The counterfactual cannot be observed from the treatment group; can only be inferred from the comparison group. 2. Comparison Group: in an experimental design, a randomly assigned group from the same population that does not receive the intervention that is the subject of evaluation. Participants in the comparison group are used as a standard for comparison against the treated subjects in order to validate the results of the intervention. 3. Program Impact: estimated by measuring the difference in outcomes between comparison and treatment groups. The true impact of the program is the difference in outcomes between the treatment group and its counterfactual. 4. Baseline: data describing the characteristics of participants measured across both treatment and comparison groups prior to implementation of intervention. 5. Endline: data describing the characteristics of participants measured across both treatment and comparison groups after implementation of intervention. 6. Selection Bias: statistical bias yielding inaccurate impact estimates because individuals in the comparison and treatment groups are systematically different from each other. These can occur when the treatment and comparison groups are chosen in a non-random fashion so that they differ from each other by one or more factors that may affect the outcome of the study. 7. Omitted Variable Bias: statistical bias that occurs when certain variables/characteristics (often unobservable)—which both are correlated with a variable of interest (e.g. a variable denoting whether an individual was treated) and affect the measured outcome variable—are omitted from a regression analysis. Because they are not included as controls in the regression, one incorrectly attributes the measured impact solely to the program.
24

J-PAL Executive Education Course Case Study 2: Learn to Read Evaluations
Did Pratham’s “Learn to Read” (L2R) program work? What is required in order for us to measure whether a program worked, or whether it had impact? In general, to ask if a program works is to ask if the program achieves its goal of changing certain outcomes for its participants, and ensure that those changes are not caused by some other factors or events happening at the same time. To show that the program causes the observed changes, we need to simultaneously show that if the program had not been implemented, the observed changes would not have occurred (or would be different). But how do we know what would have happened? If the program happened, it happened. Measuring what would have happened requires entering an imaginary world in which the program was never given to these participants. The outcomes of the same participants in this imaginary world are referred to as the counterfactual. Since we cannot observe the true counterfactual, the best we can do is to estimate it by mimicking it.
The key challenge of program impact evaluation is constructing or mimicking the counterfactual. We typically do this by selecting a group of people that resemble the participants as much as possible but who did not participate in the program. This group is called the comparison group. Because we want to be able to say that it was the program and not some other factor that caused the changes in outcomes, it is important that the only difference between the comparison group and the participants is that the comparison group did not participate in the program. We then estimate “impact” as the difference observed at the end of the program between the outcomes of the comparison group and the outcomes of the program participants. The impact estimate is only as accurate as the comparison group is successful at mimicking the counterfactual. If the comparison group poorly represents the counterfactual, the impact is (in most circumstances) poorly estimated. Therefore the method used to select the comparison group is a key decision in the design of any impact evaluation.
That brings us back to our questions: Did the L2R project work? What was its impact on children’s reading levels? In this case, the intention of the program is to “improve children’s reading levels” and the reading level is the outcome measure. So, when we ask if the L2R project worked, we are asking if it improved children’s reading levels. The impact is the difference between reading levels after the children have taken the reading classes and what their reading level would have been if the reading classes had never existed. For reference, Reading Level is an indicator variable that takes value 0 if the child can read nothing, 1 if he knows the alphabet, 2 if he can recognize words, 3 if he can read a paragraph, and 4 if he can read a full story. What comparison groups can we use? The following experts illustrate different methods of evaluating impact. (Refer to the table on the last page of the case for a list of different evaluation methods).
Estimating the impact of the Learn to Read project
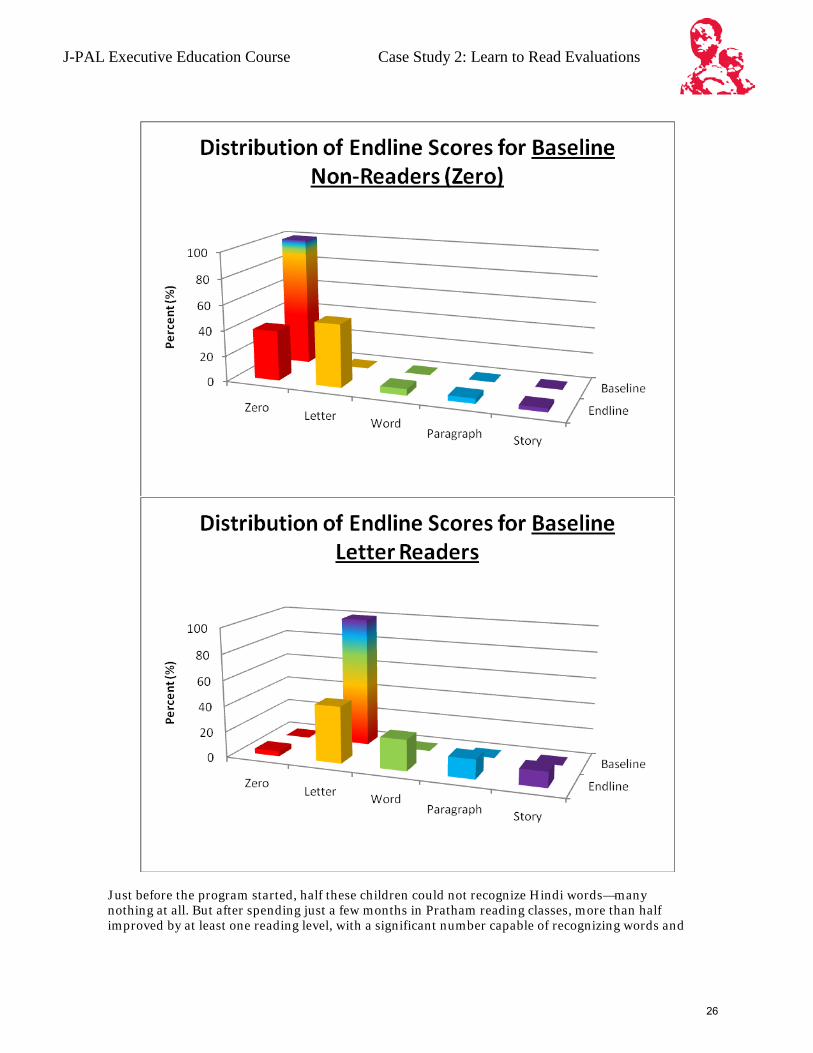
Method 1: News Release: Read India helps children Learn to Read. Pratham celebrates the success of its “Learn to Read” program—part of the Read India Initiative. It has made significant progress in its goal of improving children’s literacy rates through better learning materials, pedagogical methods, and most importantly, committed volunteers. The achievement of the “Learn to Read” (L2R) program demonstrates that a revised curriculum, galvanized by community mobilization, can produce significant gains. Massive government expenditures in mid-day meals and school construction have failed to achieve similar results. In less than a year, the reading levels of children who enrolled in the L2R camps improved considerably.
25
J-PAL Executive Education Course Case Study 2: Learn to Read Evaluations
Just before the program started, half these children could not recognize Hindi words—many nothing at all. But after spending just a few months in Pratham reading classes, more than half improved by at least one reading level, with a significant number capable of recognizing words and
26
J-PAL Executive Education Course Case Study 2: Learn to Read Evaluations
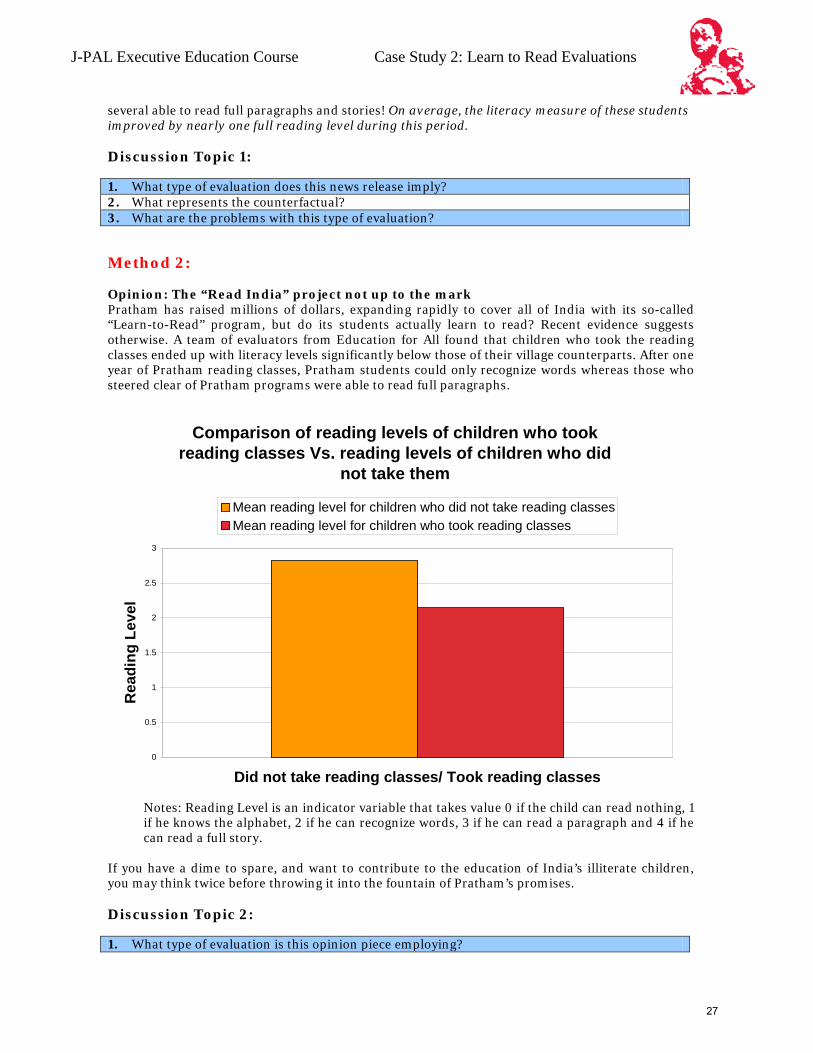
several able to read full paragraphs and stories! On average, the literacy measure of these students improved by nearly one full reading level during this period. Discussion Topic 1: 1. What type of evaluation does this news release imply? 2. What represents the counterfactual? 3. What are the problems with this type of evaluation? Method 2: Opinion: The “Read India” project not up to the mark Pratham has raised millions of dollars, expanding rapidly to cover all of India with its so-called “Learn-to-Read” program, but do its students actually learn to read? Recent evidence suggests otherwise. A team of evaluators from Education for All found that children who took the reading classes ended up with literacy levels significantly below those of their village counterparts. After one year of Pratham reading classes, Pratham students could only recognize words whereas those who steered clear of Pratham programs were able to read full paragraphs.
Comparison of reading levels of children who took reading classes Vs. reading levels of children who did
not take them
0
0.5
1
1.5
2
2.5
3
Did not take reading classes/ Took reading classes
Rea
ding
Lev
el
Mean reading level for children who did not take reading classesMean reading level for children who took reading classes
Notes: Reading Level is an indicator variable that takes value 0 if the child can read nothing, 1 if he knows the alphabet, 2 if he can recognize words, 3 if he can read a paragraph and 4 if he can read a full story.
If you have a dime to spare, and want to contribute to the education of India’s illiterate children, you may think twice before throwing it into the fountain of Pratham’s promises. Discussion Topic 2: 1. What type of evaluation is this opinion piece employing?
27
J-PAL Executive Education Course Case Study 2: Learn to Read Evaluations
2. What represents the counterfactual? 3. What are the problems with this type of evaluation? Method 3: Letter to the Editor: EFA should consider Evaluating Fairly and Accurately There have been several unfair reports in the press concerning programs implemented by the NGO Pratham. A recent article by a former Education for All bureaucrat claims that Pratham is actually hurting the children it recruits into its ‘Learn-to-Read’ camps. However, the EFA analysis uses the wrong metric to measure impact. It compares the reading levels of Pratham students with other children in the village—not taking into account the fact that Pratham targets those whose literacy levels are particularly poor at the beginning. If Pratham simply recruited the most literate children into their programs, and compared them to their poorer counterparts, they could claim success without conducting a single class. But Pratham does not do this. And realistically, Pratham does not expect its illiterate children to overtake the stronger students in the village. It simply tries to initiate improvement over the current state. Therefore the metric should be improvement in reading levels—not the final level. When we repeated EFA’s analysis using the more-appropriate outcome measure, the Pratham kids improved at twice the rate of the non-Pratham kids (0.6 reading level increase compared to 0.3). This difference is statistically very significant. Had the EFA evaluators thought to look at the more appropriate outcome, they would recognize the incredible success of Read India. Perhaps they should enroll in some Pratham classes themselves. Discussion Topic 3: 1. What type of evaluation is this letter using? 2. What represents the counterfactual? 3. What are the problems with this type of evaluation? Method 4: The numbers don’t lie, unless your statisticians are asleep Pratham celebrates victory, opponents cry foul. A closer look shows that, as usual, the truth is somewhere in between. There has been a war in the press between Pratham’s supporters and detractors. Pratham and its advocates assert that the Read India campaign has resulted in large increases in child literacy. Several detractors claim that Pratham programs, by pulling attention away from the schools, are in fact causing significant harm to the students. Unfortunately, this battle is being waged using instruments of analysis that are seriously flawed. The ultimate victim is the public who is looking for an answer to the question: is Pratham helping its intended beneficiaries? This report uses sophisticated statistical methods to measure the true impact of Pratham programs. We were concerned about other variables confounding previous results. We therefore conducted a survey in these villages to collect information on child age, grade-level, and parents’ education level, and used those to predict child test scores.
28
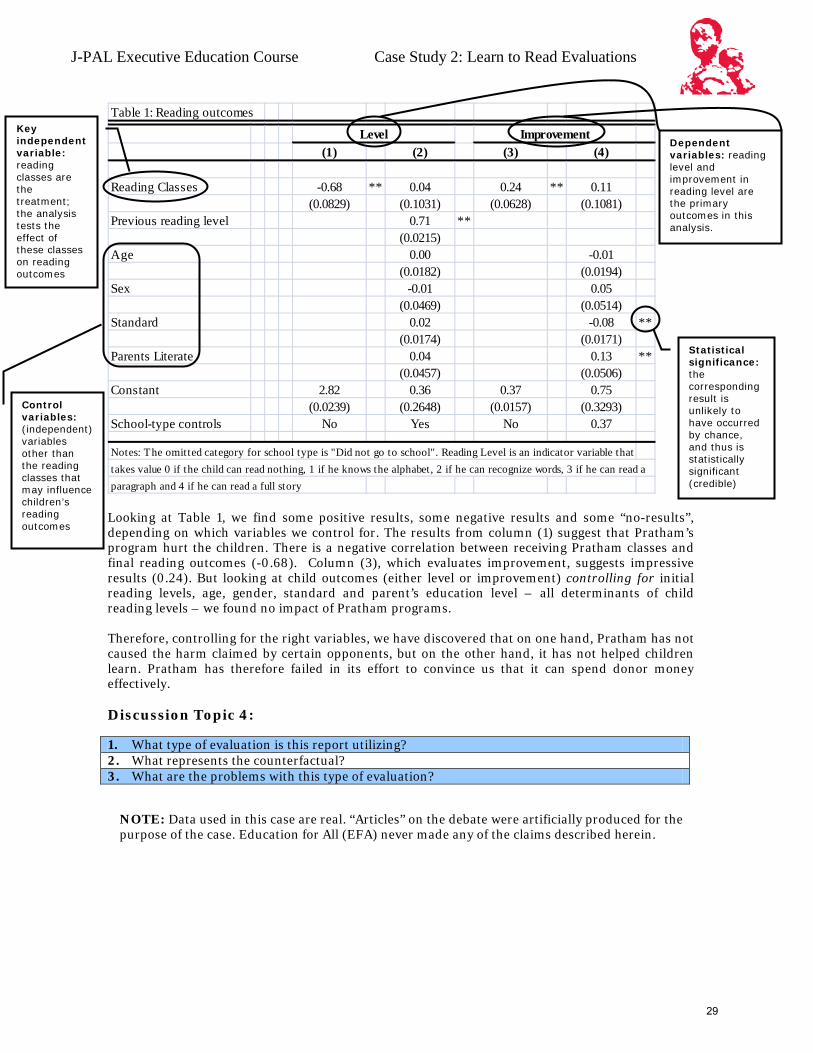
J-PAL Executive Education Course Case Study 2: Learn to Read Evaluations
Table 1: Reading outcomes
Level Improvement(1) (2) (3) (4)
Reading Classes -0.68 ** 0.04 0.24 ** 0.11(0.0829) (0.1031) (0.0628) (0.1081)
Previous reading level 0.71 **(0.0215)
Age 0.00 -0.01(0.0182) (0.0194)
Sex -0.01 0.05(0.0469) (0.0514)
Standard 0.02 -0.08 **(0.0174) (0.0171)
Parents Literate 0.04 0.13 **(0.0457) (0.0506)
Constant 2.82 0.36 0.37 0.75(0.0239) (0.2648) (0.0157) (0.3293)
School-type controls No Yes No 0.37
Notes: The omitted category for school type is "Did not go to school". Reading Level is an indicator variable thattakes value 0 if the child can read nothing, 1 if he knows the alphabet, 2 if he can recognize words, 3 if he can read aparagraph and 4 if he can read a full story
Looking at Table 1, we find some positive results, some negative results and some “no-results”, depending on which variables we control for. The results from column (1) suggest that Pratham’s program hurt the children. There is a negative correlation between receiving Pratham classes and final reading outcomes (-0.68). Column (3), which evaluates improvement, suggests impressive results (0.24). But looking at child outcomes (either level or improvement) controlling for initial reading levels, age, gender, standard and parent’s education level – all determinants of child reading levels – we found no impact of Pratham programs. Therefore, controlling for the right variables, we have discovered that on one hand, Pratham has not caused the harm claimed by certain opponents, but on the other hand, it has not helped children learn. Pratham has therefore failed in its effort to convince us that it can spend donor money effectively. Discussion Topic 4: 1. What type of evaluation is this report utilizing? 2. What represents the counterfactual? 3. What are the problems with this type of evaluation?
NOTE: Data used in this case are real. “Articles” on the debate were artificially produced for the purpose of the case. Education for All (EFA) never made any of the claims described herein.
Control variables: (independent) variables other than the reading classes that may influence children’s reading outcomes
Key independent variable: reading classes are the treatment; the analysis tests the effect of these classes on reading outcomes
Statistical significance: the corresponding result is unlikely to have occurred by chance, and thus is statistically significant (credible)
Dependent variables: reading level and improvement in reading level are the primary outcomes in this analysis.
29

30
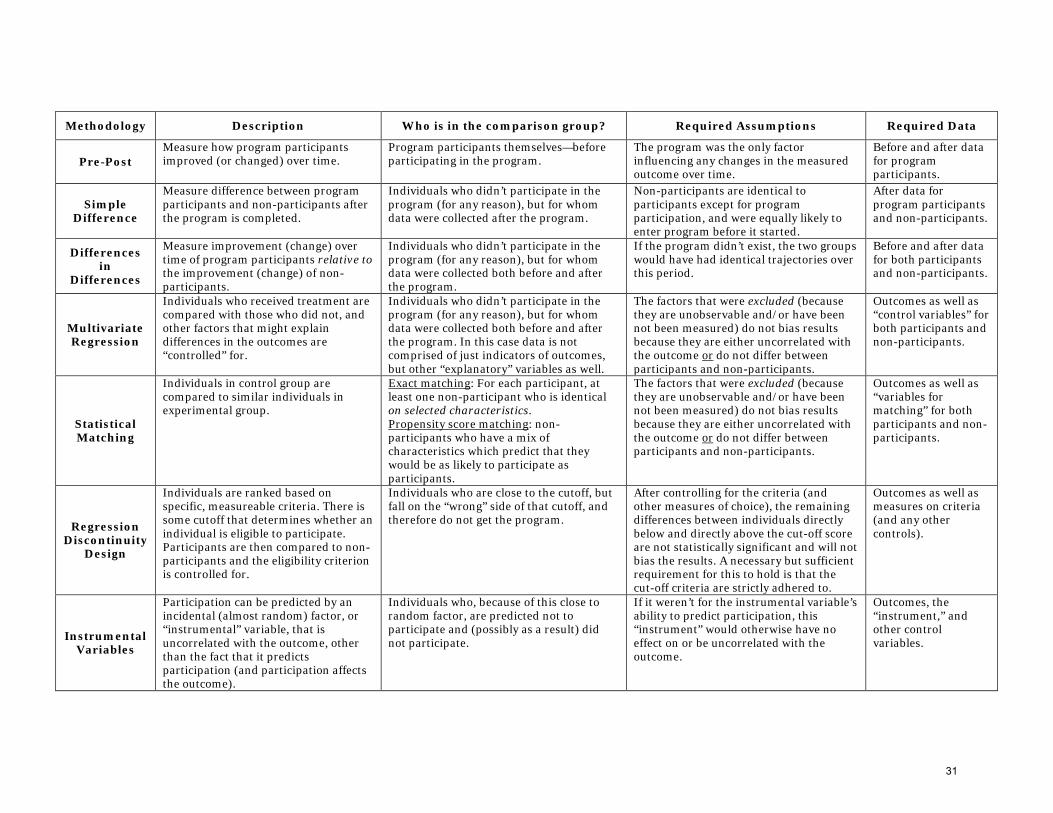
Methodology Description Who is in the comparison group? Required Assumptions Required Data
Pre-Post Measure how program participants improved (or changed) over time.
Program participants themselves—before participating in the program.
The program was the only factor influencing any changes in the measured outcome over time.
Before and after data for program participants.
Simple Difference
Measure difference between program participants and non-participants after the program is completed.
Individuals who didn’t participate in the program (for any reason), but for whom data were collected after the program.
Non-participants are identical to participants except for program participation, and were equally likely to enter program before it started.
After data for program participants and non-participants.
Differences in
Differences
Measure improvement (change) over time of program participants relative to the improvement (change) of non-participants.
Individuals who didn’t participate in the program (for any reason), but for whom data were collected both before and after the program.
If the program didn’t exist, the two groups would have had identical trajectories over this period.
Before and after data for both participants and non-participants.
Multivariate Regression
Individuals who received treatment are compared with those who did not, and other factors that might explain differences in the outcomes are “controlled” for.
Individuals who didn’t participate in the program (for any reason), but for whom data were collected both before and after the program. In this case data is not comprised of just indicators of outcomes, but other “explanatory” variables as well.
The factors that were excluded (because they are unobservable and/or have been not been measured) do not bias results because they are either uncorrelated with the outcome or do not differ between participants and non-participants.
Outcomes as well as “control variables” for both participants and non-participants.
Statistical Matching
Individuals in control group are compared to similar individuals in experimental group.
Exact matching: For each participant, at least one non-participant who is identical on selected characteristics. Propensity score matching: non-participants who have a mix of characteristics which predict that they would be as likely to participate as participants.
The factors that were excluded (because they are unobservable and/or have been not been measured) do not bias results because they are either uncorrelated with the outcome or do not differ between participants and non-participants.
Outcomes as well as “variables for matching” for both participants and non-participants.
Regression Discontinuity
Design
Individuals are ranked based on specific, measureable criteria. There is some cutoff that determines whether an individual is eligible to participate. Participants are then compared to non-participants and the eligibility criterion is controlled for.
Individuals who are close to the cutoff, but fall on the “wrong” side of that cutoff, and therefore do not get the program.
After controlling for the criteria (and other measures of choice), the remaining differences between individuals directly below and directly above the cut-off score are not statistically significant and will not bias the results. A necessary but sufficient requirement for this to hold is that the cut-off criteria are strictly adhered to.
Outcomes as well as measures on criteria (and any other controls).
Instrumental Variables
Participation can be predicted by an incidental (almost random) factor, or “instrumental” variable, that is uncorrelated with the outcome, other than the fact that it predicts participation (and participation affects the outcome).
Individuals who, because of this close to random factor, are predicted not to participate and (possibly as a result) did not participate.
If it weren’t for the instrumental variable’s ability to predict participation, this “instrument” would otherwise have no effect on or be uncorrelated with the outcome.
Outcomes, the “instrument,” and other control variables.
31

32

This case study is based on the paper “Peer Effects and the Impact of Tracking: Evidence from a Randomized Evaluation in Kenya,” by Esther Duflo (MIT), Pascaline Dupas (UCLA), and Michael Kremer (Harvard)
J-PAL thanks the authors for allowing us to use their paper
Case 2: Remedial Education in India
Evaluating the Balsakhi Program
Incorporating random assignment into the program
Case 3: Extra Teacher Program
Designing an evaluation to answer three key education policy questions
33

J-PAL Executive Education Course Case Study 3: Extra Teacher Program
Key Vocabulary
Confronted with overcrowded schools and a shortage of teachers, in 2005 the NGO International Child Support Africa (ICS) offered to help the school system of Western Kenya by introducing contract teachers in 120 primary schools. Under its two year program, ICS provided funds to these schools to hire one extra teacher per school. In contrast to the civil servants hired by the Ministry of Education, contract teachers are hired locally by school committees. ICS expected this program to improve student learning by, among other things, decreasing class size and using teachers who are more directly accountable to the communities they serve. However, contract teachers tend to have less training and receive a lower monthly salary than their civil servant counterparts. So there was concern about whether these teachers were sufficiently motivated, given their compensation, or qualified given their credentials. What experimental designs could test the impact of this intervention on educational achievement? Which of these changes in the school landscape is primarily responsible for improved student performance?
Over-crowded Schools Like many other developing countries, Kenya has recently made rapid progress toward the Millennium Development Goal of universal primary education. Largely attributed to the elimination of school fees in 2003, primary school enrollment rose nearly 30 percent, from 5.9 million to 7.6 million between 2002 and 2005.1 Without commensurate government funding, however, this progress has created its own set of new challenges in Kenya:
1) Large class size: Due to budget constraints, the rise in primary school enrollment has not been matched by proportional increases in the number of teachers. (Teacher salaries already account for the largest component of educational spending.) The result has been very large class sizes, particularly in lower grades. In a sample of schools in Western Kenya, for example, the average first grade class in 2005 was 83 students. This is concerning because it is believed that small classes are most important for the youngest students, who are still acclimating to the school environment. The Kenyan National Union of Teachers estimates that the country needs an additional 60,000 primary school teachers in addition to the existing 175,000 in order to reach all primary students and decrease class sizes.
2) Teacher absenteeism: Further exacerbating the problem of pupil-teacher ratios, teacher absenteeism remains high, reaching nearly 20% in some areas of Kenya.
There are typically no substitutes for absent teachers, so students simply mill around, go home or join another class, often of a different grade. Small schools, which are prevalent in rural areas of developing countries, may be closed entirely as a result of teacher absence. Families have to consider whether school will even be open when deciding
1 UNESCO. (2006). United Nations Education, Scientific and Cultural Organization. Fact Book on Education for All. Nairobi: UNESCO Publishing, 2006.
1. Level of Randomization: the level of observation (ex. individual, household, school, village) at which treatment and comparison groups are randomly assigned.
34

J-PAL Executive Education Course Case Study 3: Extra Teacher Program
whether or not to send their children to school. An obvious result is low student attendance—even on days when the school is open.
3) Heterogeneous classes: Classes in Kenya are also very heterogeneous with students varying widely in terms of school preparedness and support from home.
Grouping students into classes by ability (tracking, or streaming) is controversial among academics and policymakers. On one hand, if teachers are better able to teach a homogeneous group of students, tracking could improve school effectiveness and test scores. Many argue, on the other hand, that if students learn in part from their peers, tracking could disadvantage low achieving students while benefiting high achieving students, thereby exacerbating inequality. Some believe that tracking hurts everyone: with tracking, high-achievers lose learning benefits associated with explaining concepts to others.
4) Scarce school materials: Because of the high costs of educational inputs and the
rising number of students, educational resources other than the teacher are stretched, and in some cases up to four students must share one textbook. And an already over-burdened infrastructure deteriorates faster when forced to serve more children.
5) Low completion rates: As a result of these factors, completion rates are very low in
Kenya with only 45.1% of boys and 43.3% of girls completing the first grade. All in all, these issues pose new challenges to communities: how to ensure minimum quality of education given Kenya’s budget constraints.
What are Contract Teachers? Governments in several developing countries have responded to similar challenges by staffing unfilled teaching positions with locally-hired contract teachers who are not civil service employees. The four main characteristics of contract teachers are that they are: (1) appointed on annual renewable contracts, with no guarantee of renewed employment (unlike regular civil service teachers); (2) often less qualified than regular teachers and much less likely to have a formal teacher training certificate or degree; (3) paid lower salaries than those of regular teachers (typically less than a fifth of the salaries paid to regular teachers); and (4) more likely to be from the local area where the school is located.
Are Contract Teachers Effective? The increasing use of contract teachers has been one of the most significant policy innovations in providing primary education in developing countries, but it has also been highly controversial. Supporters say that using contract teachers is an efficient way of expanding education access and quality to a growing number of first-generation learners. Knowing that the school committee’s decision of whether or not to rehire them the following year may hinge on performance, contract teachers are motivated to try harder than their tenured government counterparts. Contract teachers are also often more similar to their students, geographically, culturally, and socioeconomically. Opponents argue that using under-qualified and untrained teachers may staff classrooms, but will not produce learning outcomes. Furthermore the use of contract teachers de-professionalizes teaching, reduces the prestige of the entire profession, and reduces motivation of all teachers. Even if it helps in the short term, it may hurt efforts to recruit highly qualified teachers in the future.
35

J-PAL Executive Education Course Case Study 3: Extra Teacher Program
While the use of contract teachers has generated much controversy, there is very little rigorous evidence regarding the effectiveness of contract teachers in improving student learning outcomes.
The Extra Teacher Program Randomized Evaluation In January 2005, International Child Support Africa initiated a two year program to examine the effect of contract teachers on education in Kenya. Under the program, ICS gave funds to 120 local school committees to hire one extra contract teacher to teach an additional first grade class. The purpose of this intervention was to address the first three challenges: class size, teacher accountability, and heterogeneity of ability. The evaluation was designed to measure the impact of class-size reductions, the relative effectiveness of contract teachers, and how tracking by ability would impact both low and high-achieving students.
Addressing Multiple Research Questions through Experimental Design Different randomization strategies may be used to answer different questions. What strategies could be used to evaluate the following questions? How would you design the study? Specifically, for the following research questions, who would be in the treatment and control groups, and how would they be randomly assigned to these groups? Discussion Topic 1: Testing the effectiveness of contract teachers 1. What is the relative effectiveness of contract teachers versus regular government teachers? Discussion Topic 2: Looking at more general approaches of improving education 1. What is the effect of grouping students by ability on student performance? 2. What is the effect of smaller class sizes on student performance? Discussion Topic 3: Addressing all questions with a single evaluation 1. Could a single evaluation explore all of these issues at once? 2. What randomization strategy could do so?
36
This case study is based on Edward Miguel and Michael Kremer, “Worms: Identifying Impacts on Education and Health in the Presence of Treatment Externalities,” Econometrica 72(1): 159-217, 2004
J-PAL thanks the authors for allowing us to use their paper
Case 4: Deworming in Kenya
Managing threats to experimental integrity Case 4: Deworming in Kenya
Addressing threats to experimental integrity
37
J-PAL Executive Education Course Case Study 4: Deworming in Kenya
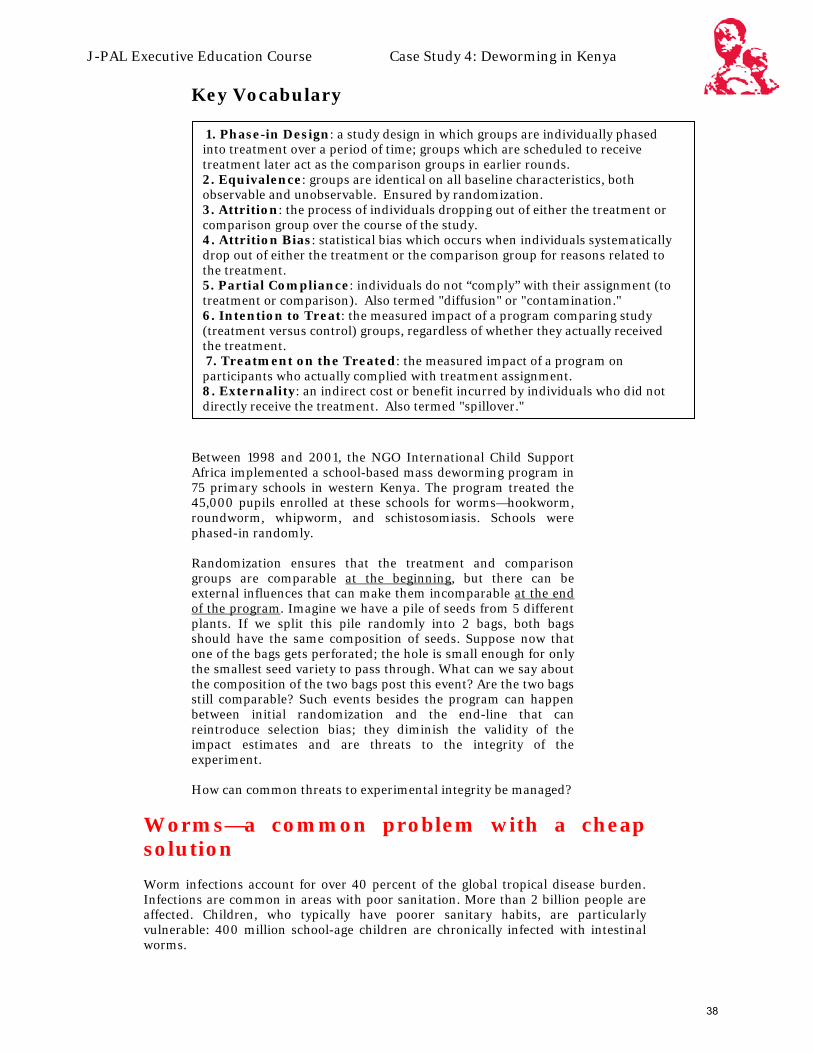
Key Vocabulary
Between 1998 and 2001, the NGO International Child Support Africa implemented a school-based mass deworming program in 75 primary schools in western Kenya. The program treated the 45,000 pupils enrolled at these schools for worms—hookworm, roundworm, whipworm, and schistosomiasis. Schools were phased-in randomly. Randomization ensures that the treatment and comparison groups are comparable at the beginning, but there can be external influences that can make them incomparable at the end of the program. Imagine we have a pile of seeds from 5 different plants. If we split this pile randomly into 2 bags, both bags should have the same composition of seeds. Suppose now that one of the bags gets perforated; the hole is small enough for only the smallest seed variety to pass through. What can we say about the composition of the two bags post this event? Are the two bags still comparable? Such events besides the program can happen between initial randomization and the end-line that can reintroduce selection bias; they diminish the validity of the impact estimates and are threats to the integrity of the experiment.
How can common threats to experimental integrity be managed?
Worms—a common problem with a cheap solution Worm infections account for over 40 percent of the global tropical disease burden. Infections are common in areas with poor sanitation. More than 2 billion people are affected. Children, who typically have poorer sanitary habits, are particularly vulnerable: 400 million school-age children are chronically infected with intestinal worms.
1. Phase-in Design: a study design in which groups are individually phased into treatment over a period of time; groups which are scheduled to receive treatment later act as the comparison groups in earlier rounds. 2. Equivalence: groups are identical on all baseline characteristics, both observable and unobservable. Ensured by randomization. 3. Attrition: the process of individuals dropping out of either the treatment or comparison group over the course of the study. 4. Attrition Bias: statistical bias which occurs when individuals systematically drop out of either the treatment or the comparison group for reasons related to the treatment. 5. Partial Compliance: individuals do not “comply” with their assignment (to treatment or comparison). Also termed "diffusion" or "contamination." 6. Intention to Treat: the measured impact of a program comparing study (treatment versus control) groups, regardless of whether they actually received the treatment. 7. Treatment on the Treated: the measured impact of a program on participants who actually complied with treatment assignment. 8. Externality: an indirect cost or benefit incurred by individuals who did not directly receive the treatment. Also termed "spillover."
38

J-PAL Executive Education Course Case Study 4: Deworming in Kenya Symptoms include listlessness, diarrhea, abdominal pain, and anemia. But worms affect more than the health of children. Heavy worm infections can impair children’s physical and mental development, leading to poor attendance and performance in school. Poor sanitation and personal hygiene habits facilitate transmission. Infected people excrete worm eggs in their feces and urine. In areas with poor sanitation, the eggs contaminate the soil or water. Other people are infected when they ingest contaminated food or soil (hookworm, whipworm, and roundworm), or when hatched worm larvae penetrate their skin upon contact with contaminated soil (hookworm) or fresh water (schistosome). School-age children are more likely to spread worms because they have riskier hygiene practices (more likely to swim in contaminated water, more likely to not use the latrine, less likely to wash hands before eating). So treating a child not only reduces her own worm load; it may also reduce disease transmission—and so benefit the community at large. Treatment kills worms in the body, but does not prevent re-infection. Oral medication that can kill 99 percent of worms in the body is available: albendazole or mebendazole for treating hookworm, roundworm, and whipworm infections; and praziquantel for treating schistosomiasis. These drugs are cheap and safe. A dose of albendazole or mebendazole costs less than 3 US cents while one dose of praziquantel costs less than 20 US cents. The drugs have very few and minor side effects. Worms colonize the intestines and the urinary tract, but they do not reproduce in the body; their numbers build up only through repeated contact with contaminated soil or water. The WHO recommends presumptive school-based mass deworming in areas with high prevalence. Schools with hookworm, whipworm, and roundworm prevalence over 50 percent should be mass treated with albendazole every 6 months, and schools with schistosomiasis prevalence over 30 percent should be mass treated with praziquantel once a year.
Primary School Deworming Program International Child Support Africa (ICS) implemented the Primary School Deworming Program (PSDP) in the Busia District in western Kenya, a densely-settled region with high worm prevalence. Treatment followed WHO guidelines. The medicine was administered by public health nurses from the Ministry of Health in the presence of health officers from ICS. The PSDP was expected to affect health, nutrition, and education. To measure impact, ICS collected data on a series of outcomes: prevalence of worm infection, worm loads (severity of worm infection); self-reported illness; and school participation rates and test scores.
Evaluation design — the experiment as planned Because of administrative and financial constraints the PSDP could not be implemented in all schools immediately. Instead, the 75 schools were randomly divided into 3 groups of 25 schools and phased-in over 3 years. Group 1 schools were treated starting in both 1998 and 1999, Group 2 schools in 1999, and Group 3 starting in 2001. Group 1 schools were the treatment group in 1998, while schools Group 2 and Group 3 were the comparison. In 1999 Group 1 and Group 2 schools were the treatment and Group 3 schools the comparison.
39
J-PAL Executive Education Course Case Study 4: Deworming in Kenya
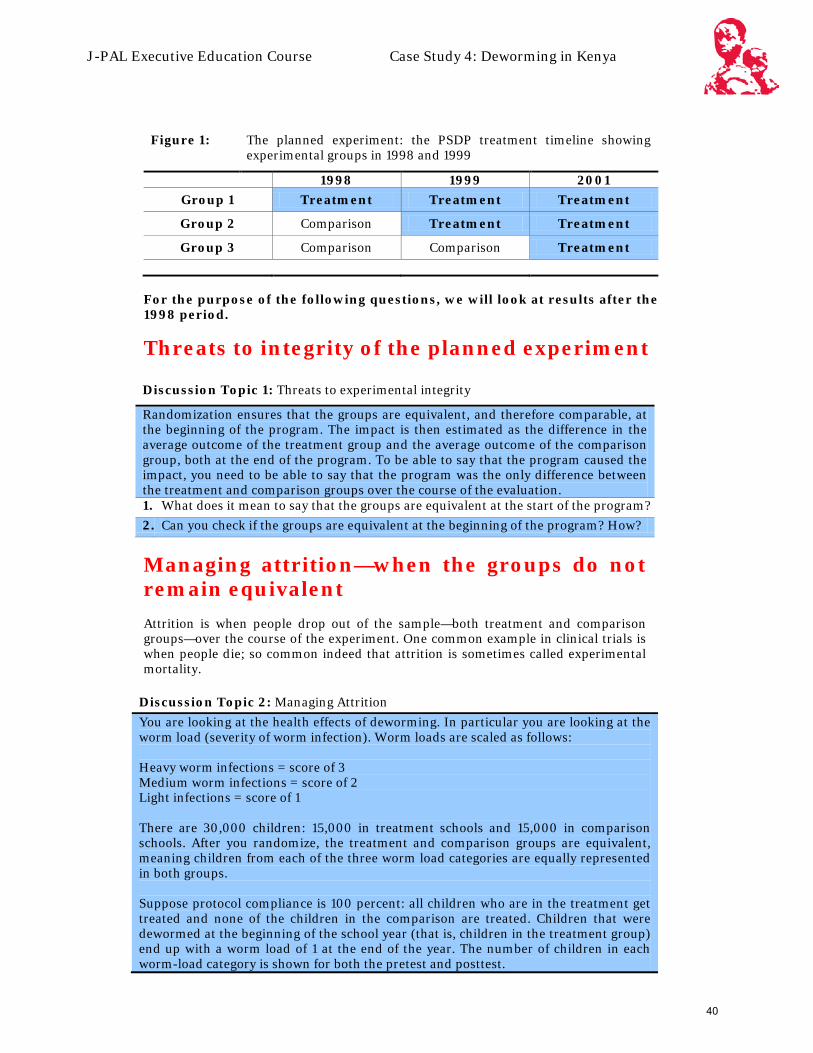
Figure 1: The planned experiment: the PSDP treatment timeline showing experimental groups in 1998 and 1999
1998 1999 2001 Group 1 Treatment Treatment Treatment
Group 2 Comparison Treatment Treatment
Group 3 Comparison Comparison Treatment
For the purpose of the following questions, we will look at results after the 1998 period.
Threats to integrity of the planned experiment
Discussion Topic 1: Threats to experimental integrity
Randomization ensures that the groups are equivalent, and therefore comparable, at the beginning of the program. The impact is then estimated as the difference in the average outcome of the treatment group and the average outcome of the comparison group, both at the end of the program. To be able to say that the program caused the impact, you need to be able to say that the program was the only difference between the treatment and comparison groups over the course of the evaluation. 1. What does it mean to say that the groups are equivalent at the start of the program? 2. Can you check if the groups are equivalent at the beginning of the program? How?
Managing attrition—when the groups do not remain equivalent Attrition is when people drop out of the sample—both treatment and comparison groups—over the course of the experiment. One common example in clinical trials is when people die; so common indeed that attrition is sometimes called experimental mortality.
Discussion Topic 2: Managing Attrition You are looking at the health effects of deworming. In particular you are looking at the worm load (severity of worm infection). Worm loads are scaled as follows: Heavy worm infections = score of 3 Medium worm infections = score of 2 Light infections = score of 1 There are 30,000 children: 15,000 in treatment schools and 15,000 in comparison schools. After you randomize, the treatment and comparison groups are equivalent, meaning children from each of the three worm load categories are equally represented in both groups. Suppose protocol compliance is 100 percent: all children who are in the treatment get treated and none of the children in the comparison are treated. Children that were dewormed at the beginning of the school year (that is, children in the treatment group) end up with a worm load of 1 at the end of the year. The number of children in each worm-load category is shown for both the pretest and posttest.
40
J-PAL Executive Education Course Case Study 4: Deworming in Kenya
Pretest Posttest Worm Load Treatment Comparison Treatment Comparison
3 5,000 10,000 0 10,000 2 5,000 10,000 0 10,000 1 5,000 10,000 15,000 10,000
Total children tested at school 15,000 30,000 15,000 30,000
Average 1. a. At pretest, what is the average worm load for each group?
b. At posttest, what is the average worm load for each group? c. What is the impact of the program? d. Do you need to know pretest values? Why or why not?
Suppose now that children who have a worm load of 3 only attend half the time and drop out of school if they are not treated. The number of children in each worm-load category is shown for both the pretest and posttest.
Pretest Posttest Worm Load Treatment Comparison Treatment Comparison
3 5,000 10,000 0 Dropped out
2 5,000 10,000 0 10,000 1 5,000 10,000 15,000 10,000
Total children tested at school 15,000 30,000 15,000 20,000
Average 2. a. At posttest, what is the new average worm load for the comparison group?
b. What is the impact of the program? c. Is this outcome difference an accurate estimate of the impact of the
program? Why or why not? d. If it is not accurate, does it overestimate or underestimate the impact? e. How can we get a better estimate of the program’s impact?
3. Besides worm load, the PSDP also looked at outcome measures such as school attendance rates and test scores. a. Would differential attrition (i.e. differences in drop-outs between treatment
and comparison groups) bias either of these outcomes? How? b. Would the impacts on these final outcome measures be underestimated or
overestimated? 3. In Case 1, you learned about other methods to estimate program impact, such as
pre-post, simple difference, differences in differences, and multivariate regression. a. Does the threat of attrition only present itself in randomized evaluations?
Managing partial compliance—when the treatment does not actually get treated or the comparison gets treated Some people assigned to the treatment may in the end not actually get treated. In an after-school tutoring program, for example, some children assigned to receive tutoring may simply not show up for tutoring. And the others assigned to the comparison may obtain access to tutoring, either from the program or from another provider. Or comparison group children may get extra help from the teachers or acquire program materials and methods from their classmates. In any of these scenarios, people are not complying with their assignment in the planned experiment. This is called “partial compliance” or “diffusion” or, less benignly,
41
J-PAL Executive Education Course Case Study 4: Deworming in Kenya
“contamination.” In contrast to carefully-controlled lab experiments, diffusion is ubiquitous concern in social programs. After all, life goes on, people will be people, and you have no control over what they decide to do over the course of the experiment. All you can do is plan your experiment and offer them treatments. How, then, can you deal with the complications that arise from partial compliance?
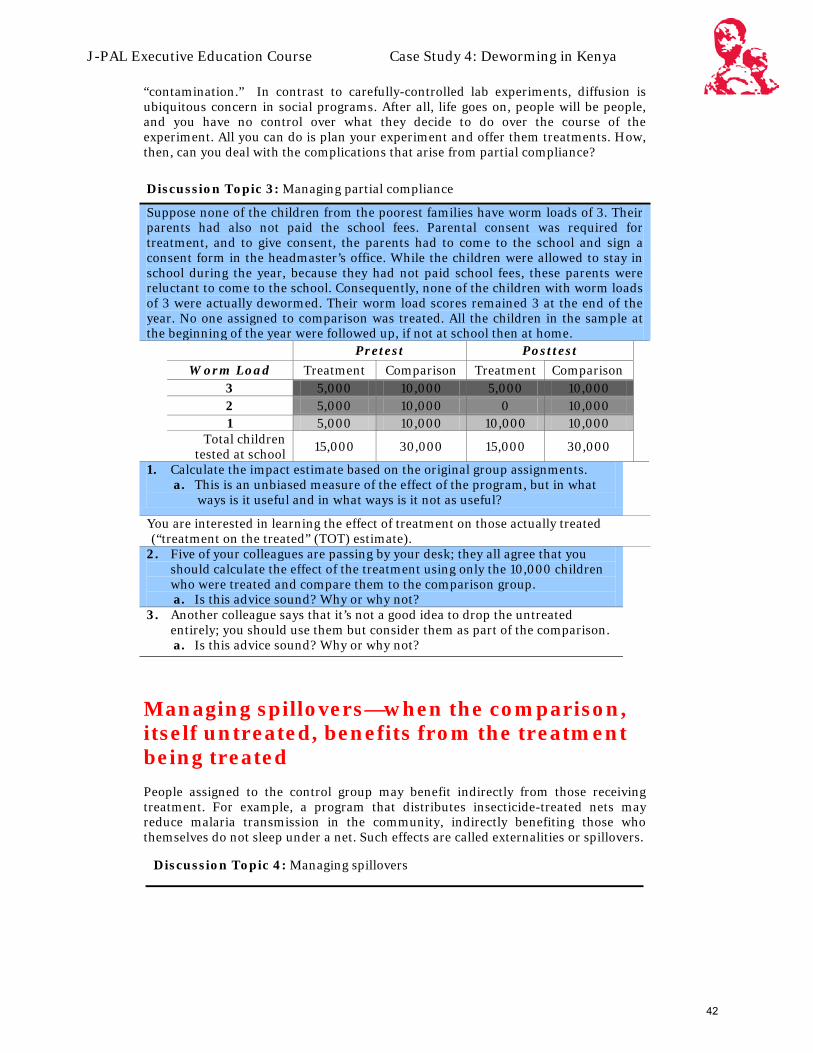
Discussion Topic 3: Managing partial compliance
Suppose none of the children from the poorest families have worm loads of 3. Their parents had also not paid the school fees. Parental consent was required for treatment, and to give consent, the parents had to come to the school and sign a consent form in the headmaster’s office. While the children were allowed to stay in school during the year, because they had not paid school fees, these parents were reluctant to come to the school. Consequently, none of the children with worm loads of 3 were actually dewormed. Their worm load scores remained 3 at the end of the year. No one assigned to comparison was treated. All the children in the sample at the beginning of the year were followed up, if not at school then at home. Pretest Posttest
Worm Load Treatment Comparison Treatment Comparison
3 5,000 10,000 5,000 10,000 2 5,000 10,000 0 10,000 1 5,000 10,000 10,000 10,000
Total children tested at school 15,000 30,000 15,000 30,000
1. Calculate the impact estimate based on the original group assignments. a. This is an unbiased measure of the effect of the program, but in what
ways is it useful and in what ways is it not as useful?
You are interested in learning the effect of treatment on those actually treated (“treatment on the treated” (TOT) estimate).
2. Five of your colleagues are passing by your desk; they all agree that you should calculate the effect of the treatment using only the 10,000 children who were treated and compare them to the comparison group. a. Is this advice sound? Why or why not?
3. Another colleague says that it’s not a good idea to drop the untreated entirely; you should use them but consider them as part of the comparison. a. Is this advice sound? Why or why not?
Managing spillovers—when the comparison, itself untreated, benefits from the treatment being treated People assigned to the control group may benefit indirectly from those receiving treatment. For example, a program that distributes insecticide-treated nets may reduce malaria transmission in the community, indirectly benefiting those who themselves do not sleep under a net. Such effects are called externalities or spillovers.
Discussion Topic 4: Managing spillovers
42
J-PAL Executive Education Course Case Study 4: Deworming in Kenya
Discussion Topic 4: Managing spillovers
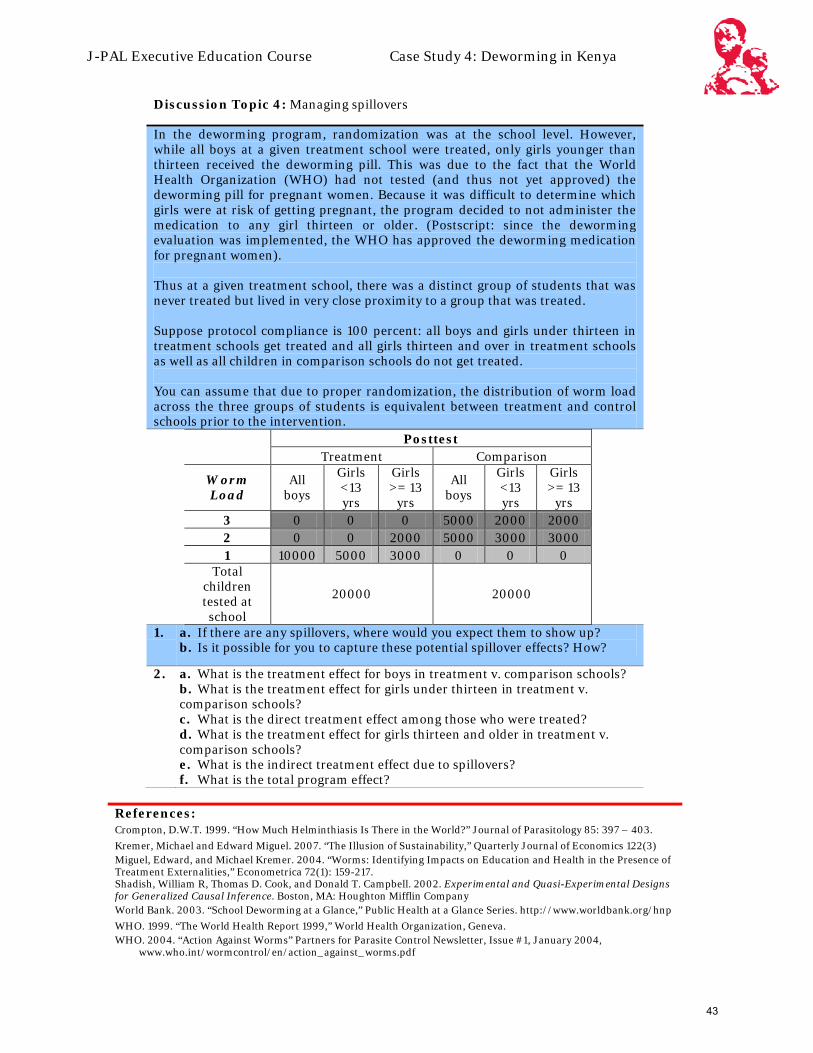
In the deworming program, randomization was at the school level. However, while all boys at a given treatment school were treated, only girls younger than thirteen received the deworming pill. This was due to the fact that the World Health Organization (WHO) had not tested (and thus not yet approved) the deworming pill for pregnant women. Because it was difficult to determine which girls were at risk of getting pregnant, the program decided to not administer the medication to any girl thirteen or older. (Postscript: since the deworming evaluation was implemented, the WHO has approved the deworming medication for pregnant women). Thus at a given treatment school, there was a distinct group of students that was never treated but lived in very close proximity to a group that was treated. Suppose protocol compliance is 100 percent: all boys and girls under thirteen in treatment schools get treated and all girls thirteen and over in treatment schools as well as all children in comparison schools do not get treated. You can assume that due to proper randomization, the distribution of worm load across the three groups of students is equivalent between treatment and control schools prior to the intervention.
Posttest
Treatment Comparison
Worm Load
All boys
Girls <13 yrs
Girls >= 13
yrs
All boys
Girls <13 yrs
Girls >= 13
yrs 3 0 0 0 5000 2000 2000 2 0 0 2000 5000 3000 3000 1 10000 5000 3000 0 0 0
Total children tested at school
20000 20000
1. a. If there are any spillovers, where would you expect them to show up? b. Is it possible for you to capture these potential spillover effects? How?
2. a. What is the treatment effect for boys in treatment v. comparison schools? b. What is the treatment effect for girls under thirteen in treatment v. comparison schools? c. What is the direct treatment effect among those who were treated? d. What is the treatment effect for girls thirteen and older in treatment v. comparison schools? e. What is the indirect treatment effect due to spillovers? f. What is the total program effect?
References: Crompton, D.W.T. 1999. “How Much Helminthiasis Is There in the World?” Journal of Parasitology 85: 397 – 403. Kremer, Michael and Edward Miguel. 2007. “The Illusion of Sustainability,” Quarterly Journal of Economics 122(3) Miguel, Edward, and Michael Kremer. 2004. “Worms: Identifying Impacts on Education and Health in the Presence of Treatment Externalities,” Econometrica 72(1): 159-217. Shadish, William R, Thomas D. Cook, and Donald T. Campbell. 2002. Experimental and Quasi-Experimental Designs for Generalized Causal Inference. Boston, MA: Houghton Mifflin Company World Bank. 2003. “School Deworming at a Glance,” Public Health at a Glance Series. http://www.worldbank.org/hnp WHO. 1999. “The World Health Report 1999,” World Health Organization, Geneva. WHO. 2004. “Action Against Worms” Partners for Parasite Control Newsletter, Issue #1, January 2004,
www.who.int/wormcontrol/en/action_against_worms.pdf
43

44

Exercise A: Understanding random sampling and the law of large numbers In this exercise, we will visually explore random samples of different sizes from a given population. In particular, we will try to demonstrate that larger sample sizes tend to be more reflective of the underlying population.
1) Open the file “Exercise A_SamplingDistributions.xlsm”.
2) If prompted, select “Enable Macros”.
3) Navigate to the “Randomize” worksheet, which allows you to choose a random sample of size “Sample Size” from the data contained in the “control” worksheet.
4) Enter “10” for “Sample Size and click the “Randomize” button. Observe the distribution of the
various characteristics between Treatment, Control and Expected. With a sample size this small, the percentage difference from the expected average is quite high for reading scores. Click “Randomize” multiple times and observe how the distribution changes.
5) Now, try “50” for the sample size. What happens to the distributions? Randomize a few times
and observe the percentage difference for the reading scores.
6) Increase the sample size to “500”, “2000” and “10000”, and repeat the observations from step 5. What can we say about larger sample sizes? How do they affect our Treatment and Control samples? Should the percentage difference between Treatment, Control and Expected always go down as we increase sample size?
45

46
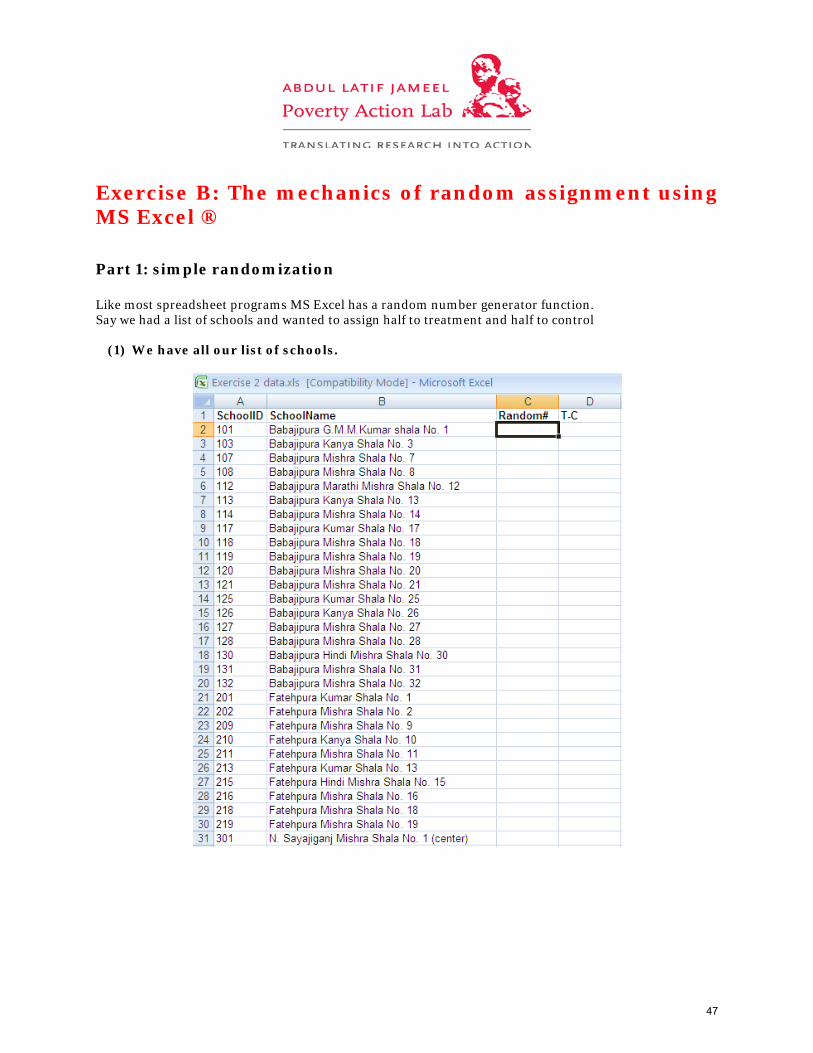
Exercise B: The mechanics of random assignment using MS Excel ®
Part 1: simple randomization Like most spreadsheet programs MS Excel has a random number generator function. Say we had a list of schools and wanted to assign half to treatment and half to control
(1) We have all our list of schools.
47
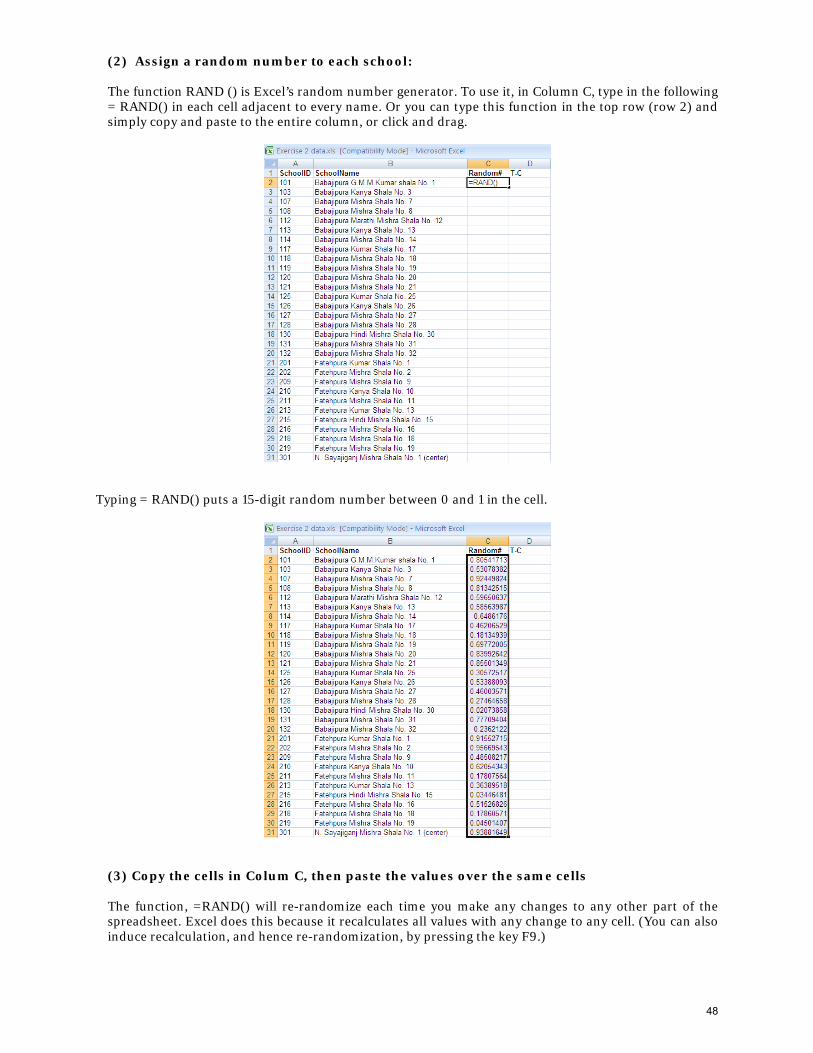
(2) Assign a random number to each school: The function RAND () is Excel’s random number generator. To use it, in Column C, type in the following = RAND() in each cell adjacent to every name. Or you can type this function in the top row (row 2) and simply copy and paste to the entire column, or click and drag.
Typing = RAND() puts a 15-digit random number between 0 and 1 in the cell.
(3) Copy the cells in Colum C, then paste the values over the same cells The function, =RAND() will re-randomize each time you make any changes to any other part of the spreadsheet. Excel does this because it recalculates all values with any change to any cell. (You can also induce recalculation, and hence re-randomization, by pressing the key F9.)
48
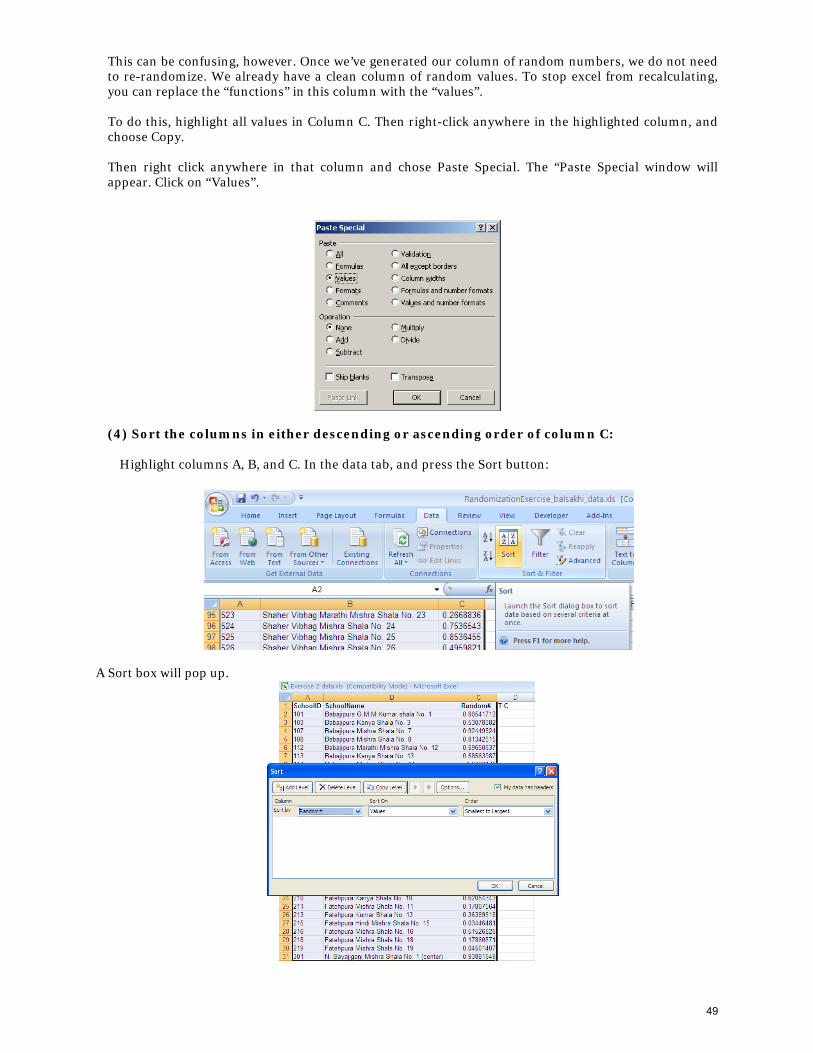
This can be confusing, however. Once we’ve generated our column of random numbers, we do not need to re-randomize. We already have a clean column of random values. To stop excel from recalculating, you can replace the “functions” in this column with the “values”. To do this, highlight all values in Column C. Then right-click anywhere in the highlighted column, and choose Copy. Then right click anywhere in that column and chose Paste Special. The “Paste Special window will appear. Click on “Values”.
(4) Sort the columns in either descending or ascending order of column C: Highlight columns A, B, and C. In the data tab, and press the Sort button:
A Sort box will pop up.
49
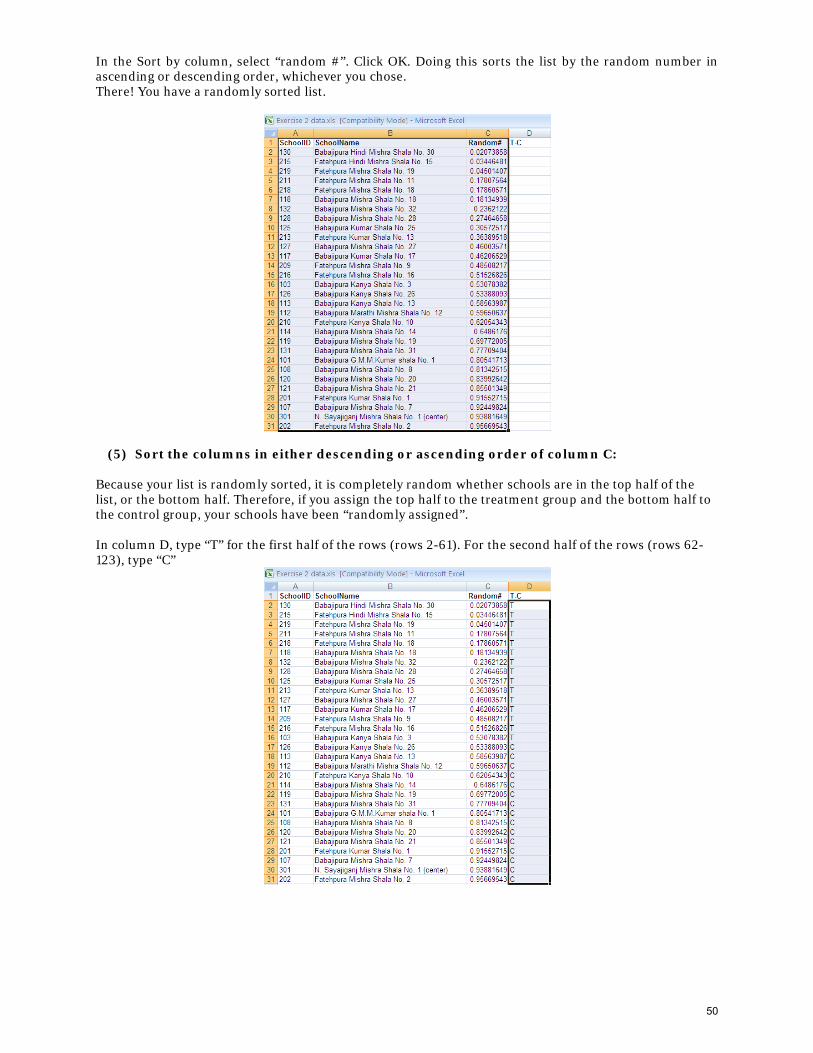
In the Sort by column, select “random #”. Click OK. Doing this sorts the list by the random number in ascending or descending order, whichever you chose. There! You have a randomly sorted list.
(5) Sort the columns in either descending or ascending order of column C: Because your list is randomly sorted, it is completely random whether schools are in the top half of the list, or the bottom half. Therefore, if you assign the top half to the treatment group and the bottom half to the control group, your schools have been “randomly assigned”. In column D, type “T” for the first half of the rows (rows 2-61). For the second half of the rows (rows 62-123), type “C”
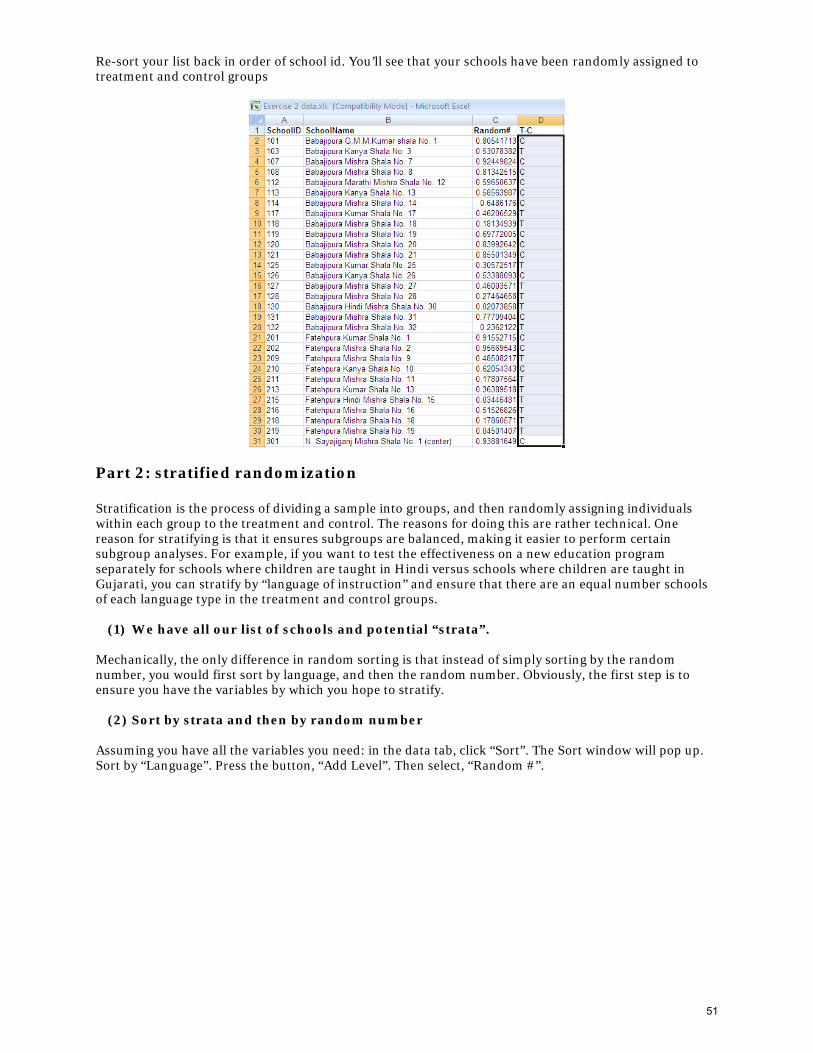
50
Re-sort your list back in order of school id. You’ll see that your schools have been randomly assigned to treatment and control groups
Part 2: stratified randomization Stratification is the process of dividing a sample into groups, and then randomly assigning individuals within each group to the treatment and control. The reasons for doing this are rather technical. One reason for stratifying is that it ensures subgroups are balanced, making it easier to perform certain subgroup analyses. For example, if you want to test the effectiveness on a new education program separately for schools where children are taught in Hindi versus schools where children are taught in Gujarati, you can stratify by “language of instruction” and ensure that there are an equal number schools of each language type in the treatment and control groups.
(1) We have all our list of schools and potential “strata”. Mechanically, the only difference in random sorting is that instead of simply sorting by the random number, you would first sort by language, and then the random number. Obviously, the first step is to ensure you have the variables by which you hope to stratify.
(2) Sort by strata and then by random number Assuming you have all the variables you need: in the data tab, click “Sort”. The Sort window will pop up. Sort by “Language”. Press the button, “Add Level”. Then select, “Random #”.
51
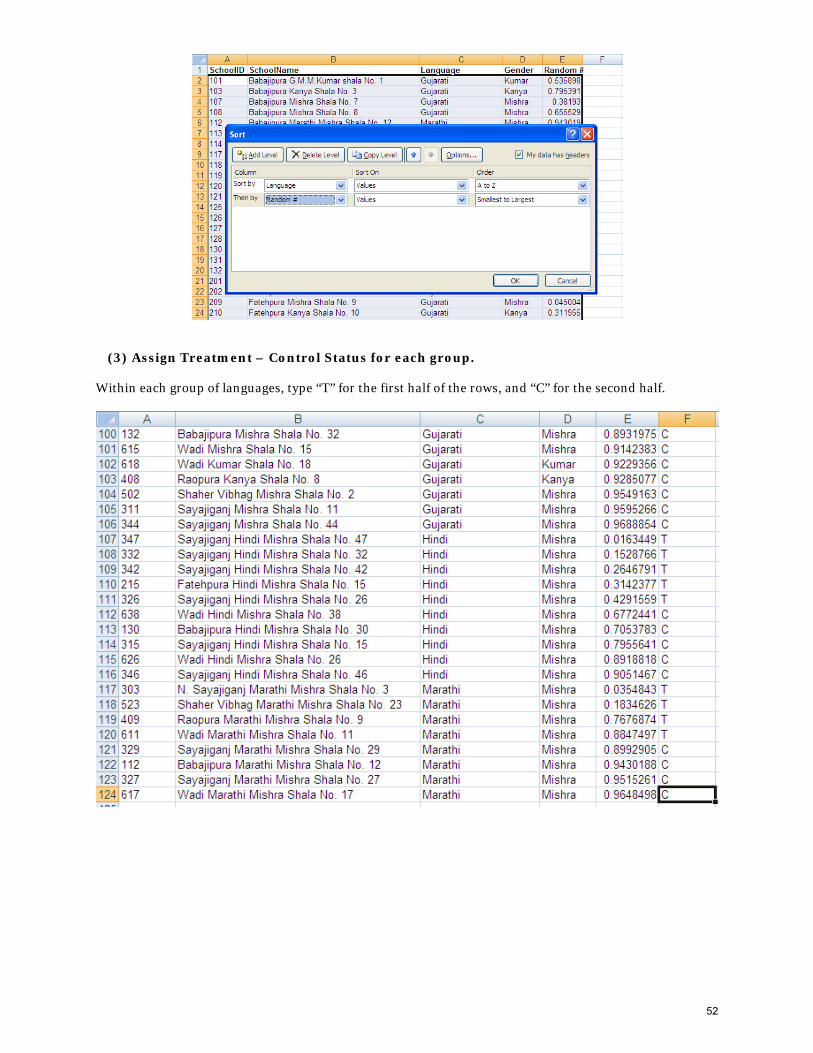
(3) Assign Treatment – Control Status for each group. Within each group of languages, type “T” for the first half of the rows, and “C” for the second half.
52

Exercise C: Sample size calculations
Key Vocabulary:
The Extra Teacher Program (ETP) case study discussed the concept of cluster randomized trials. The Balsakhi example in the prior lecture introduced the concept of power calculations. In the latter, we were interested in measuring the effect of a treatment (balsakhis in classrooms) on outcomes measured at the individual level—child test scores. However, the randomization of balsakhis was done at the classroom level. It could be that our outcome of interest is correlated for students in the same classroom, for reasons that have nothing to do with the balsakhi. For example, all the students in a classroom will be affected by their original teacher, by whether their classroom is unusually dark, or if they have a chalkboard; these factors mean that when one student in the class does particularly well for this reason, all the students in that classroom probably also do better—which might have nothing to do with a balsakhi.
Therefore, if we sample 100 kids from 10 randomly selected schools, that sample is less representative of the population of schools in the city than if we selected 100 random kids from the whole population of schools, and therefore absorbs less variance. In effect, we have a smaller sample size than we think. This will lead to more noise in our sample, and hence larger standard error than in the usual case of independent sampling. When planning both the sample size and the best way to sample classrooms, we need to take this into account.
1. Power: the likelihood that, when the program has an effect, one will be able to distinguish the effect from zero given the sample size. 2. Significance: the likelihood that the measured effect did not occur by chance. Statistical tests are performed to determine whether one group (e.g. the experimental group) is different from another group (e.g. comparison group) on the measurable outcome variables used in the evaluation. 3. Standard Deviation: a standardized measure of the variation of a sample population from its mean on a given characteristic/outcome. Mathematically, the square root of the variance. 4. Standardized Effect Size: a standardized measure of the [expected] magnitude of the effect of a program. 5. Cluster: the level of observation at which a sample size is measured. Generally, observations which are highly correlated with each other should be clustered and the sample size should be measured at this clustered level. 6. Intra-cluster Correlation Coefficient: a measure of the correlation between observations within a cluster; i.e. the level of correlation in drinking water source for individuals in a household.
53
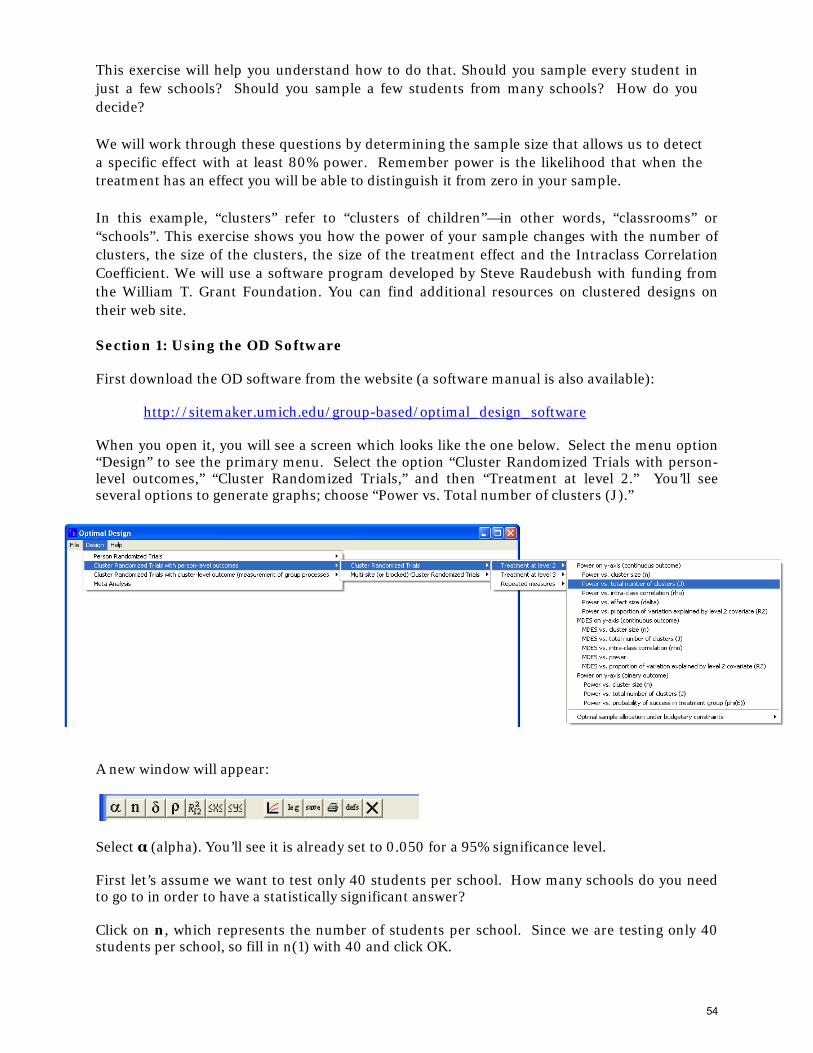
This exercise will help you understand how to do that. Should you sample every student in just a few schools? Should you sample a few students from many schools? How do you decide?
We will work through these questions by determining the sample size that allows us to detect a specific effect with at least 80% power. Remember power is the likelihood that when the treatment has an effect you will be able to distinguish it from zero in your sample.
In this example, “clusters” refer to “clusters of children”—in other words, “classrooms” or “schools”. This exercise shows you how the power of your sample changes with the number of clusters, the size of the clusters, the size of the treatment effect and the Intraclass Correlation Coefficient. We will use a software program developed by Steve Raudebush with funding from the William T. Grant Foundation. You can find additional resources on clustered designs on their web site.
Section 1: Using the OD Software First download the OD software from the website (a software manual is also available): http://sitemaker.umich.edu/group-based/optimal_design_software When you open it, you will see a screen which looks like the one below. Select the menu option “Design” to see the primary menu. Select the option “Cluster Randomized Trials with person-level outcomes,” “Cluster Randomized Trials,” and then “Treatment at level 2.” You’ll see several options to generate graphs; choose “Power vs. Total number of clusters (J).”
A new window will appear:
Select α (alpha). You’ll see it is already set to 0.050 for a 95% significance level. First let’s assume we want to test only 40 students per school. How many schools do you need to go to in order to have a statistically significant answer? Click on n, which represents the number of students per school. Since we are testing only 40 students per school, so fill in n(1) with 40 and click OK.
54
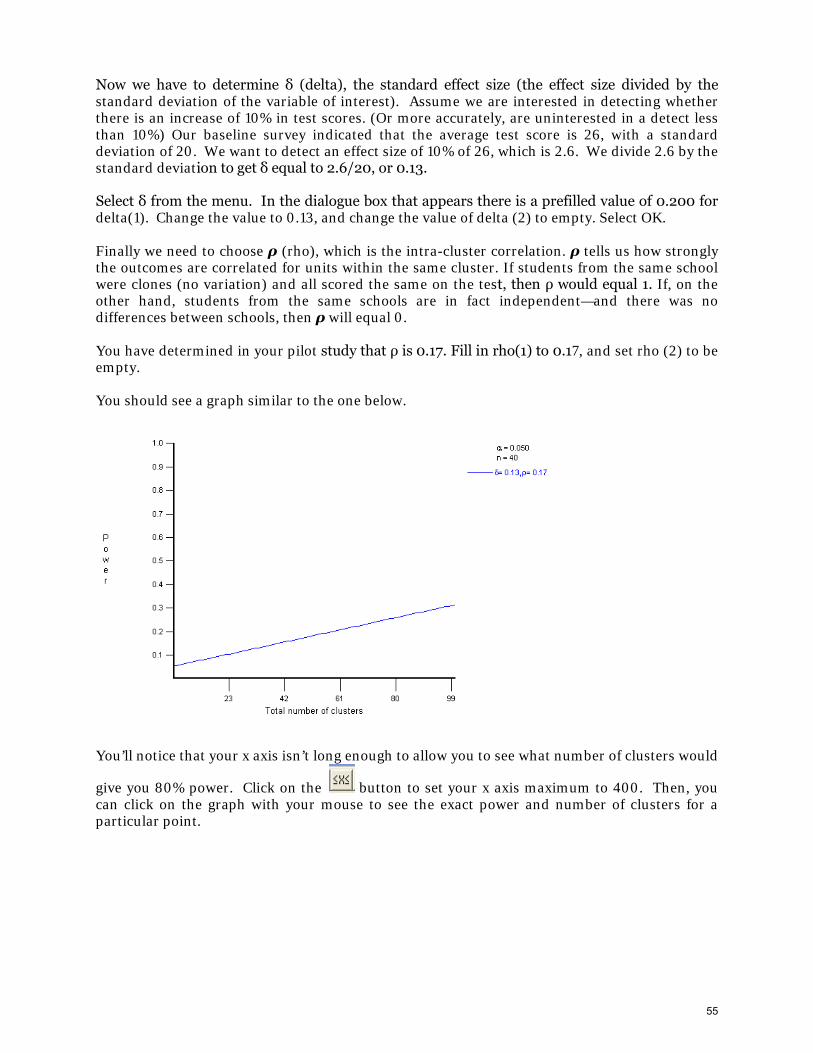
Now we have to determine δ (delta), the standard effect size (the effect size divided by the standard deviation of the variable of interest). Assume we are interested in detecting whether there is an increase of 10% in test scores. (Or more accurately, are uninterested in a detect less than 10%) Our baseline survey indicated that the average test score is 26, with a standard deviation of 20. We want to detect an effect size of 10% of 26, which is 2.6. We divide 2.6 by the standard deviation to get δ equal to 2.6/20, or 0.13. Select δ from the menu. In the dialogue box that appears there is a prefilled value of 0.200 for delta(1). Change the value to 0.13, and change the value of delta (2) to empty. Select OK. Finally we need to choose ρ (rho), which is the intra-cluster correlation. ρ tells us how strongly the outcomes are correlated for units within the same cluster. If students from the same school were clones (no variation) and all scored the same on the test, then ρ would equal 1. If, on the other hand, students from the same schools are in fact independent—and there was no differences between schools, then ρ will equal 0. You have determined in your pilot study that ρ is 0.17. Fill in rho(1) to 0.17, and set rho (2) to be empty. You should see a graph similar to the one below.
You’ll notice that your x axis isn’t long enough to allow you to see what number of clusters would
give you 80% power. Click on the button to set your x axis maximum to 400. Then, you can click on the graph with your mouse to see the exact power and number of clusters for a particular point.
55
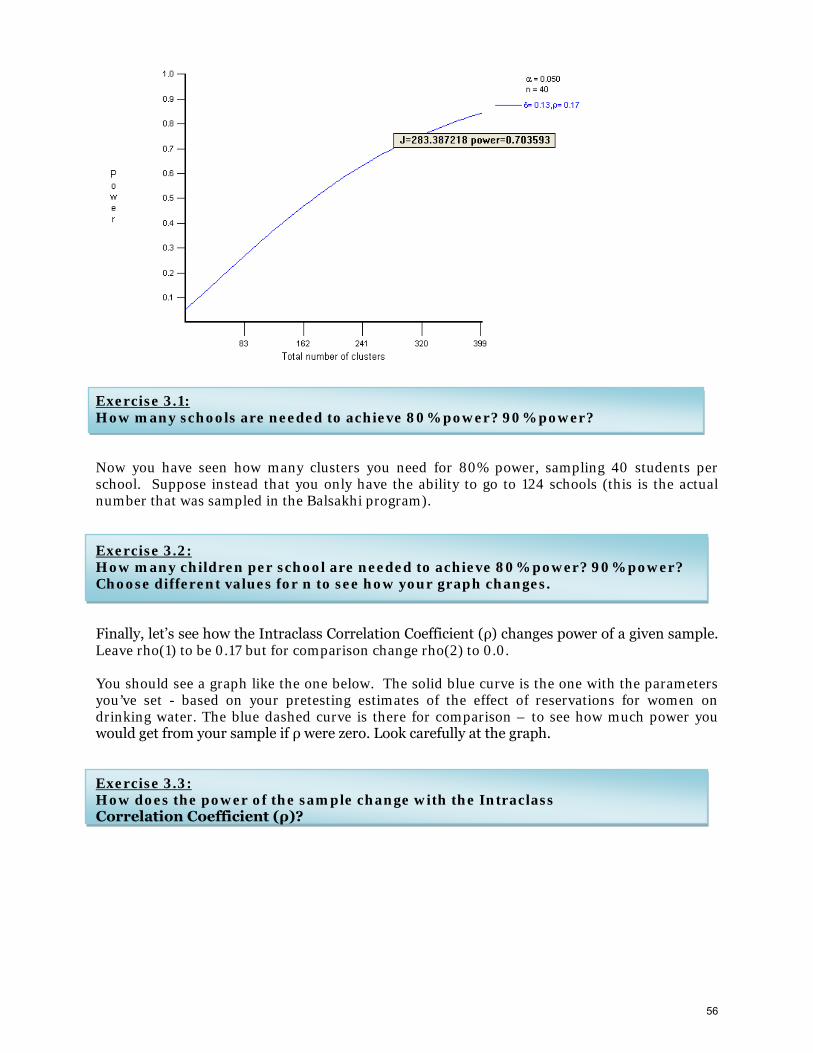
Exercise 3.1: How many schools are needed to achieve 80% power? 90% power? Now you have seen how many clusters you need for 80% power, sampling 40 students per school. Suppose instead that you only have the ability to go to 124 schools (this is the actual number that was sampled in the Balsakhi program). Exercise 3.2: How many children per school are needed to achieve 80% power? 90% power? Choose different values for n to see how your graph changes. Finally, let’s see how the Intraclass Correlation Coefficient (ρ) changes power of a given sample. Leave rho(1) to be 0.17 but for comparison change rho(2) to 0.0. You should see a graph like the one below. The solid blue curve is the one with the parameters you’ve set - based on your pretesting estimates of the effect of reservations for women on drinking water. The blue dashed curve is there for comparison – to see how much power you would get from your sample if ρ were zero. Look carefully at the graph. Exercise 3.3: How does the power of the sample change with the Intraclass Correlation Coefficient (ρ)?
56
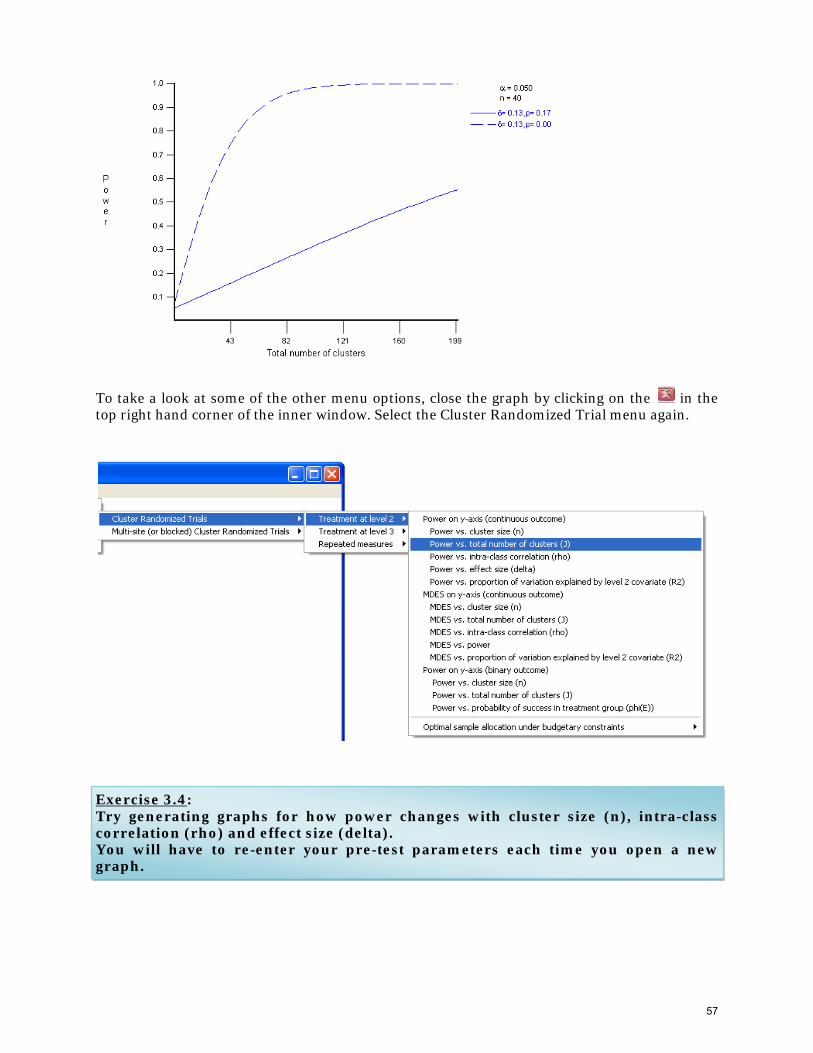
To take a look at some of the other menu options, close the graph by clicking on the in the top right hand corner of the inner window. Select the Cluster Randomized Trial menu again.
Exercise 3.4: Try generating graphs for how power changes with cluster size (n), intra-class correlation (rho) and effect size (delta). You will have to re-enter your pre-test parameters each time you open a new graph.
57

58
Group Presentation
Participants will form 4-6 person groups which will work through the design process for a randomized evaluation of a development project. Groups will be aided in this project by both the faculty and teaching assistants with the work culminating in presentations at the end of the week.
The goal of the group presentations is to consolidate and apply the knowledge of the lectures and thereby ensure that participants will leave with the knowledge, experience, and confidence necessary to conduct their own randomized evaluations. We encourage groups to work on projects that are relevant to participants’ organisations.
All groups will present on Friday. The 15-minute presentation is followed by a 15-minute discussion led by J-PAL affiliates and staff. We provide groups with template slides for their presentation (see next page). While the groups do not need to follow this exactly, the presentation should have no more than 9 slides (including title slide, excluding appendix) and should include the following topics:
• Brief project background • Theory of change • Evaluation question • Outcomes • Evaluation design • Data and sample size • Potential validity threats and how to manage them • Dissemination strategy of results
Please time yourself and do not exceed the allotted time. We have only a limited amount of time for these presentations, so we will follow a strict timeline to be fair to all groups.
59

60
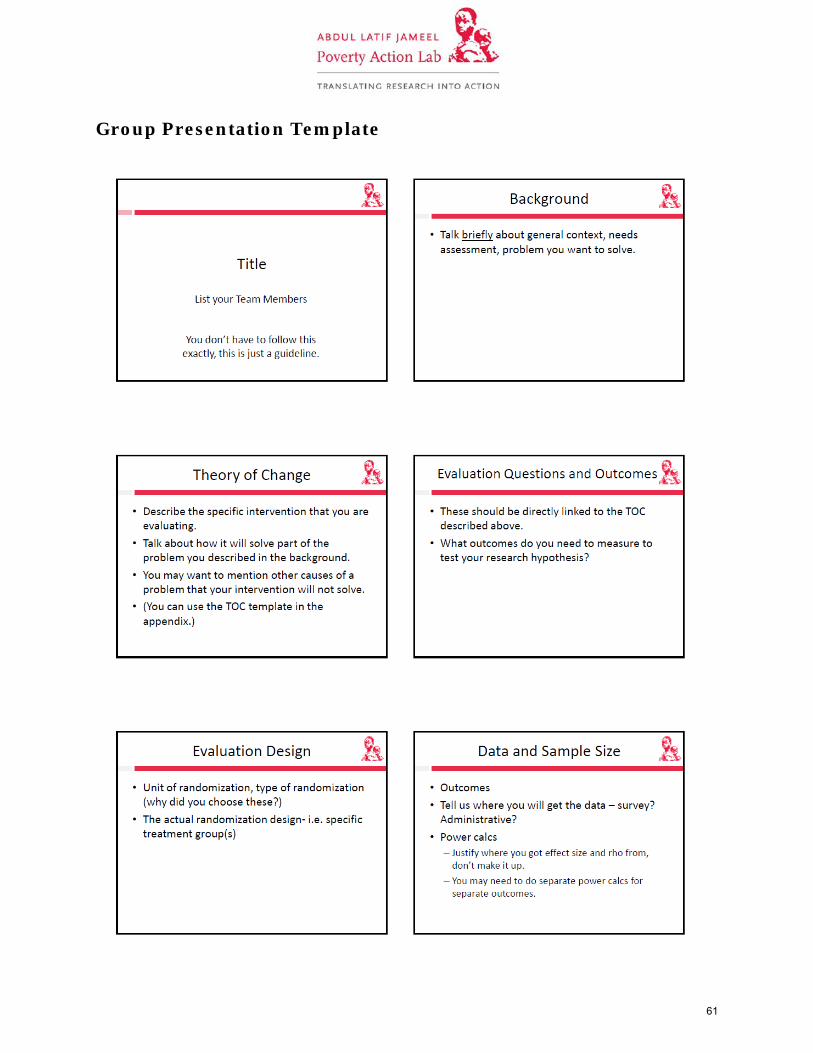
Group Presentation Template
61
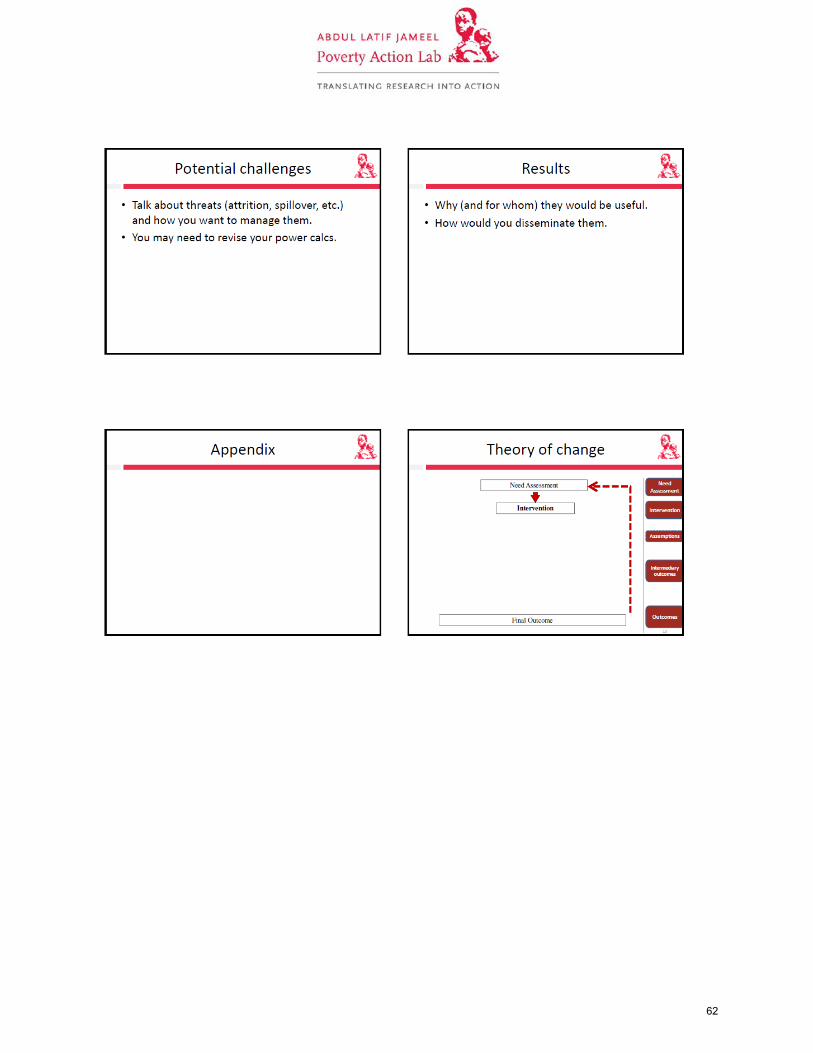
62
Checklist For Reviewing a Randomized Controlled Trial of a Social Program or Project, To Assess Whether It Produced Valid Evidence
63
Updated February 2010 This publication was produced by the Coalition for Evidence-Based Policy, with funding support from the William T. Grant Foundation, Edna McConnell Clark Foundation, and Jerry Lee Foundation. This publication is in the public domain. Authorization to reproduce it in whole or in part for educational purposes is granted. We welcome comments and suggestions on this document ([email protected]).
2 64
3
Checklist For Reviewing a Randomized Controlled Trial of a Social Program or Project, To Assess Whether It Produced Valid Evidence
This is a checklist of key items to look for in reading the results of a randomized controlled trial of a social program, project, or strategy (“intervention”), to assess whether it produced valid evidence on the intervention’s effectiveness. This checklist closely tracks guidance from both the U.S. Office of Management and Budget (OMB) and the U.S. Education Department’s Institute of Education Sciences (IES)1; however, the views expressed herein do not necessarily reflect the views of OMB or IES. This checklist limits itself to key items, and does not try to address all contingencies that may affect the validity of a study’s results. It is meant to aid – not substitute for – good judgment, which may be needed for example to gauge whether a deviation from one or more checklist items is serious enough to undermine the study’s findings. A brief appendix addresses how many well-conducted randomized controlled trials are needed to produce strong evidence that an intervention is effective.
Checklist for overall study design
Random assignment was conducted at the appropriate level – either groups (e.g., classrooms,
housing projects), or individuals (e.g., students, housing tenants), or both.
Random assignment of individuals is usually the most efficient and least expensive approach. However, it may be necessary to randomly assign groups – instead of, or in addition to, individuals – in order to evaluate (i) interventions that may have sizeable “spillover” effects on nonparticipants, and (ii) interventions that are delivered to whole groups such as classrooms, housing projects, or communities. (See reference 2 for additional detail.2)
The study had an adequate sample size – one large enough to detect meaningful effects of the intervention.
Whether the sample is sufficiently large depends on specific features of the intervention, the sample population, and the study design, as discussed elsewhere.3 Here are two items that can help you judge whether the study you’re reading had an adequate sample size: If the study found that the intervention produced statistically-significant effects (as discussed
later in this checklist), then you can probably assume that the sample was large enough. If the study found that the intervention did not produce statistically-significant effects, the
study report should include an analysis showing that the sample was large enough to detect meaningful effects of the intervention. (Such an analysis is known as a “power” analysis.4)
Reference 5 contains illustrative examples of sample sizes from well-conducted randomized controlled trials conducted in various areas of social policy.5
65
Checklist to ensure that the intervention and control groups remained equivalent
during the study
The study report shows that the intervention and control groups were highly similar in key
characteristics prior to the intervention (e.g., demographics, behavior).
If the study asked sample members to consent to study participation, they provided such consent before learning whether they were assigned to the intervention versus control group.
If they provided consent afterward, their knowledge of which group they are in could have affected their decision on whether to consent, thus undermining the equivalence of the two groups.
Few or no control group members participated in the intervention, or otherwise benefited from
it (i.e., there was minimal “cross-over” or “contamination” of controls).
The study collected outcome data in the same way, and at the same time, from intervention and control group members.
The study obtained outcome data for a high proportion of the sample members originally
randomized (i.e., the study had low sample “attrition”).
As a general guideline, the studies should obtain outcome data for at least 80 percent of the sample members originally randomized, including members assigned to the intervention group who did not participate in or complete the intervention. Furthermore, the follow-up rate should be approximately the same for the intervention and the control groups. The study report should include an analysis showing that sample attrition (if any) did not undermine the equivalence of the intervention and control groups.
The study, in estimating the effects of the intervention, kept sample members in the original group to which they were randomly assigned. This even applies to:
Intervention group members who failed to participate in or complete the intervention (retaining
them in the intervention group is consistent with an “intention-to-treat” approach); and
Control group members who may have participated in or benefited from the intervention (i.e., “cross-overs,” or “contaminated” members of the control group).6
Checklist for the study’s outcome measures
The study used “valid” outcome measures – i.e., outcome measures that are highly correlated
with the true outcomes that the intervention seeks to affect. For example:
Tests that the study used to measure outcomes (e.g., tests of academic achievement or psychological well-being) are ones whose ability to measure true outcomes is well-established.
4 66
If sample members were asked to self-report outcomes (e.g., criminal behavior), their reports were corroborated with independent and/or objective measures if possible (e.g., police records).
The outcome measures did not favor the intervention group over the control group, or vice-versa.
For instance, a study of a computerized program to teach mathematics to young students should not measure outcomes using a computerized test, since the intervention group will likely have greater facility with the computer than the control group.7
The study measured outcomes that are of policy or practical importance – not just
intermediate outcomes that may or may not predict important outcomes.
As illustrative examples: (i) the study of a pregnancy prevention program should measure outcomes such as actual pregnancies, and not just participants’ attitudes toward sex; and (ii) the study of a remedial reading program should measure outcomes such as reading comprehension, and not just the ability to sound out words.
Where appropriate, the members of the study team who collected outcome data were
“blinded” – i.e., kept unaware of who was in the intervention and control groups.
Blinding is important when the study measures outcomes using interviews, tests, or other instruments that are not fully structured, possibly allowing the person doing the measuring some room for subjective judgment. Blinding protects against the possibility that the measurer’s bias (e.g., as a proponent of the intervention) might influence his or her outcome measurements. Blinding would be important, for example, in a study that measures the incidence of hitting on the playground through playground observations, or a study that measures the word identification skills of first graders through individually-administered tests.
Preferably, the study measured whether the intervention’s effects lasted long enough to constitute meaningful improvement in participants’ lives (e.g., a year, hopefully longer).
This is important because initial intervention effects often diminish over time – for example, as changes in intervention group behavior wane, or as the control group “catches up” on their own.
Checklist for the study’s reporting of the intervention’s effects
If the study claims that the intervention has an effect on outcomes, it reports (i) the size of the
effect, and whether the size is of policy or practical importance; and (ii) tests showing the effect is statistically significant (i.e., unlikely to be due to chance).
These tests for statistical significance should take into account key features of the study design, including:
Whether individuals (e.g., students) or groups (e.g., classrooms) were randomly assigned;
Whether the sample was sorted into groups prior to randomization (i.e., “stratified,” “blocked,” or
“paired”); and Whether the study intends its estimates of the intervention’s effect to apply only to the sites (e.g.,
housing projects) in the study, or to be generalizable to a larger population.
5 67
The study reports the intervention’s effects on all the outcomes that the study measured, not just those for which there is a positive effect.
This is so you can gauge whether any positive effects are the exception or the pattern. In addition, if the study found only a limited number of statistically-significant effects among many outcomes measured, it should report tests showing that such effects were unlikely to have occurred by chance.
Appendix: How many randomized controlled trials are needed to produce strong
evidence of effectiveness?
To have strong confidence that an intervention would be effective if faithfully replicated, one generally would look for evidence including the following:
The intervention has been demonstrated effective, through well-conducted randomized controlled trials, in more than one site of implementation.
Such a demonstration might consist of two or more trials conducted in different implementation sites, or alternatively one large multi-site trial.
The trial(s) evaluated the intervention in the real-world community settings and conditions where it would normally be implemented (e.g., community drug abuse clinics, public schools, job training program sites).
This is as opposed to tightly-controlled conditions, such as specialized sites that researchers set up at a university for purposes of the study, or settings where the researchers themselves administer the intervention.
There is no strong countervailing evidence, such as well-conducted randomized controlled trials of the intervention showing an absence of effects.
6 68
7
References 1 U.S. Office of Management and Budget (OMB), What Constitutes Strong Evidence of Program Effectiveness, http://www.whitehouse.gov/omb/part/2004_program_eval.pdf, 2004; U.S. Department of Education’s Institute of Education Sciences, Identifying and Implementing Educational Practices Supported By Rigorous Evidence, http://www.ed.gov/rschstat/research/pubs/rigorousevid/index.html, December 2003; What Works Clearinghouse of the U.S. Education Department’s Institute of Education Sciences, Key Items To Get Right When Conducting A Randomized Controlled Trial in Education, prepared by the Coalition for Evidence-Based Policy, http://ies.ed.gov/ncee/wwc/pdf/guide_RCT.pdf.
2 Random assignment of groups rather than, or in addition to, individuals may be necessary in situations such as the following:
(a) The intervention may have sizeable “spillover” effects on individuals other than those who receive it.
For example, if there is good reason to believe that a drug-abuse prevention program for youth in a public housing project may produce sizeable reductions in drug use not only among program participants, but also among their peers in the same housing project (through peer-influence), it is probably necessary to randomly assign whole housing projects to intervention and control groups to determine the program’s effect. A study that only randomizes individual youth within a housing project to intervention versus control groups will underestimate the program’s effect to the extent the program reduces drug use among both intervention and control-group students in the project.
(b) The intervention is delivered to groups such as classrooms or schools (e.g., a classroom curriculum or
schoolwide reform program), and the study seeks to distinguish the effect of the intervention from the effect of other group characteristics (e.g., quality of the classroom teacher).
For example, in a study of a new classroom curriculum, classrooms in the sample will usually differ in two ways: (i) whether they use the new curriculum or not, and (ii) who is teaching the class. Therefore, if the study (for example) randomly assigns individual students to two classrooms that use the curriculum versus two classrooms that don’t, the study will not be able to distinguish the effect of the curriculum from the effect of other classroom characteristics, such as the quality of the teacher. Such a study therefore probably needs to randomly assign whole classrooms and teachers (a sufficient sample of each) to intervention and control groups, to ensure that the two groups are equivalent not only in student characteristics but also in classroom and teacher characteristics. For similar reasons, a study of a schoolwide reform program will probably need to randomly assign whole schools to intervention and control groups, to ensure that the two groups are equivalent not only in student characteristics but also school characteristics (e.g., teacher quality, average class size).
3 What Works Clearinghouse of the U.S. Education Department’s Institute of Education Sciences, Key Items To Get Right When Conducting A Randomized Controlled Trial in Education, op. cit., no. 1. 4 Resources that may be helpful in reviewing or conducting power analyses include: the William T. Grant Foundation’s free consulting service in the design of group-randomized trials, at http://sitemaker.umich.edu/group-based/consultation_service; Steve Raudenbush et. al., Optimal Design Software for Group Randomized Trials, at http://sitemaker.umich.edu/group-based/optimal_design_software; Peter Z. Schochet, Statistical Power for Random Assignment Evaluations of Education Programs (http://www.mathematica-mpr.com/publications/PDFs/statisticalpower.pdf), prepared for the U.S. Education Department’s Institute of Education Sciences, June 22, 2005; and Howard S. Bloom, “Randomizing Groups to Evaluate Place-Based Programs,” in Learning More from Social Experiments: Evolving Analytical Approaches, edited by Howard S. Bloom. New York: Russell Sage Foundation Publications, 2005, pp. 115-172. 5 Here are illustrative examples of sample sizes from well-conducted randomized controlled trials in various areas of social policy: (i) 4,028 welfare applicants and recipients were randomized in a trial of Portland Oregon’s Job Opportunities and Basic Skills Training Program (a welfare-to work program), to evaluate the program’s effects on employment and earnings – see http://evidencebasedprograms.org/wordpress/?page_id=140; (ii) between 400 and 800 women were randomized in each of three trials of the Nurse-Family Partnership (a nurse home visitation program for low-income, pregnant women), to evaluate the program’s effects on a range of maternal and child outcomes, such as child abuse and neglect, criminal arrests, and welfare dependency – see http://evidencebasedprograms.org/wordpress/?page_id=57; 206 9th graders were randomized in a trial of Check and
69
8
Connect (a school dropout prevention program for at-risk students), to evaluate the program’s effects on dropping out of school – see http://evidencebasedprograms.org/wordpress/?page_id=92; 56 schools containing nearly 6000 students were randomized in a trial of LifeSkills Training (a substance-abuse prevention program), to evaluate the program’s effects on students’ use of drugs, alcohol, and tobacco – see http://evidencebasedprograms.org/wordpress/?page_id=128. 6 The study, after obtaining estimates of the intervention’s effect with sample members kept in their original groups, can sometimes use a “no-show” adjustment to estimate the effect on intervention group members who actually participated in the intervention (as opposed to no-shows). A variation on this technique can sometimes be used to adjust for “cross-overs.” See Larry L. Orr, Social Experimentation: Evaluating Public Programs With Experimental Methods, Sage Publications, Inc., 1999, p. 62 and 210; and Howard S. Bloom, “Accounting for No-Shows in Experimental Evaluation Designs,” Evaluation Review, vol. 8, April 1984, pp. 225-246. 7 Similarly, a study of a crime prevention program that involves close police supervision of program participants should not use arrest rates as a measure of criminal outcomes, because the supervision itself may lead to more arrests for the intervention group.
70
Evaluating Social Programs Course: Evaluation Glossary
(Sources: 3ie and The World Bank) Attribution The extent to which the observed change in outcome is the result of the intervention, having allowed for all other factors which may also affect the outcome(s) of interest. Attrition Either the drop out of subjects from the sample during the intervention, or failure to collect data from a subject in subsequent rounds of a data collection. Either form of attrition can result in biased impact estimates. Baseline Pre-intervention, ex-ante. The situation prior to an intervention, against which progress can be assessed or comparisons made. Baseline data are collected before a program or policy is implemented to assess the “before” state. Bias The extent to which the estimate of impact differs from the true value as a result of problems in the evaluation or sample design. Cluster A cluster is a group of subjects that are similar in one way or another. For example, in a sampling of school children, children who attend the same school would belong to a cluster, because they share the same school facilities and teachers and live in the same neighborhood. Cluster sample Sample obtained by drawing a random sample of clusters, after which either all subjects in selected clusters constitute the sample or a number of subjects within each selected cluster is randomly drawn. Comparison group A group of individuals whose characteristics are similar to those of the treatment groups (or participants) but who do not receive the intervention. Comparison groups are used to approximate the counterfactual. In a randomized evaluation, where the evaluator can ensure that no confounding factors affect the comparison group, it is called a control group. Confidence level The level of certainty that the true value of impact (or any other statistical estimate) will fall within a specified range. Confounding factors Other variables or determinants that affect the outcome of interest.
71
Contamination When members of the control group are affected by either the intervention (see “spillover effects”) or another intervention that also affects the outcome of interest. Contamination is a common problem as there are multiple development interventions in most communities. Cost-effectiveness An analysis of the cost of achieving a one unit change in the outcome. The advantage compared to cost-benefit analysis, is that the (often controversial) valuation of the outcome is avoided. Can be used to compare the relative efficiency of programs to achieve the outcome of interest. Counterfactual The counterfactual is an estimate of what the outcome would have been for a program participant in the absence of the program. By definition, the counterfactual cannot be observed. Therefore it must be estimated using comparison groups. Dependent variable A variable believed to be predicted by or caused by one or more other variables (independent variables). The term is commonly used in regression analysis. Difference-in-differences (also known as double difference or D-in-D) The difference between the change in the outcome in the treatment group compared to the equivalent change in the control group. This method allows us to take into account any differences between the treatment and comparison groups that are constant over time. The two differences are thus before and after and between the treatment and comparison groups. Evaluation Evaluations are periodic, objective assessments of a planned, ongoing or completed project, program, or policy. Evaluations are used to answer specific questions often related to design, implementation and/or results. Ex ante evaluation design An impact evaluation design prepared before the intervention takes place. Ex ante designs are stronger than ex post evaluation designs because of the possibility of considering random assignment, and the collection of baseline data from both treatment and control groups. Also called prospective evaluation. Ex post evaluation design An impact evaluation design prepared once the intervention has started, and possibly been completed. Unless the program was randomly assigned, a quasi-experimental design has to be used.
72
External validity The extent to which the causal impact discovered in the impact evaluation can be generalized to another time, place, or group of people. External validity increases when the evaluation sample is representative of the universe of eligible subjects. Follow-up survey Also known as “post-intervention” or “ex-post” survey. A survey that is administered after the program has started, once the beneficiaries have benefited from the program for some time. An evaluation can include several follow-up surveys. Hawthorne effect The “Hawthorne effect” occurs when the mere fact that you are observing subjects makes them behave differently. Hypothesis A specific statement regarding the relationship between two variables. In an impact evaluation the hypothesis typically relates to the expected impact of the intervention on the outcome. Impact The effect of the intervention on the outcome for the beneficiary population. Impact evaluation An impact evaluation tries to make a causal link between a program or intervention and a set of outcomes. An impact evaluation tries to answer the question of whether a program is responsible for changes in the outcomes of interest. Contrast with “process evaluation”. Independent variable A variable believed to cause changes in the dependent variable, usually applied in regression analysis. Indicator An indicator is a variable that measures a phenomenon of interest to the evaluator. The phenomenon can be an input, an output, an outcome, or a characteristic. Inputs The financial, human, and material resources used for the development intervention. Intention to treat (ITT) estimate The average treatment effect calculated across the whole treatment group, regardless of whether they actually participated in the intervention or not. Compare to “treatment on the treated estimate”. Intra-cluster correlation Intra-cluster correlation is correlation (or similarity) in outcomes or characteristics between subjects that belong to the same cluster. For example, children that attend the
73
same school would typically be similar or correlated in terms of their area of residence or socio-economic background. Logical model Describes how a program should work, presenting the causal chain from inputs, through activities and outputs, to outcomes. While logical models present a theory about the expected program outcome, they do not demonstrate whether the program caused the observed outcome. A theory-based approach examines the assumptions underlying the links in the logical model. John Henry effect The “John Henry effect” happens when comparison subjects work harder to compensate for not being offered a treatment. When one compares treated units to those “harder-working” comparison units, the estimate of the impact of the program will be biased: we will estimate a smaller impact of the program than the true impact we would find if the comparison units did not make the additional effort. Minimum desired effect Minimum change in outcomes that would justify the investment that has been made in an intervention, accounting not only for the cost of the program and the type of benefits that it provides, but also on the opportunity cost of not having invested funds in an alternative intervention. The minimum desired effect is an input for power calculations: evaluation samples need to be large enough to detect at least the minimum desired effects with sufficient power. Null hypothesis A null hypothesis is a hypothesis that might be falsified on the basis of observed data. The null hypothesis typically proposes a general or default position. In evaluation, the default position is usually that there is no difference between the treatment and control group, or in other words, that the intervention has no impact on outcomes. Outcome A variable that measures the impact of the intervention. Can be intermediate or final, depending on what it measures and when. Output The products and services that are produced (supplied) directly by an intervention. Outputs may also include changes that result from the intervention which are relevant to the achievement of outcomes. Power calculation A calculation of the sample required for the impact evaluation, which depends on the minimum effect size that we want to be able to detect (see “minimum desired effect”) and the required level of confidence.
74
Pre-post comparison Also known as a before and after comparison. A pre-post comparison attempts to establish the impact of a program by tracking changes in outcomes for program beneficiaries over time using measures both before and after the program or policy is implemented. Process evaluation A process evaluation is an evaluation that tries to establish the level of quality or success of the processes of a program. For example: adequacy of the administrative processes, acceptability of the program benefits, clarity of the information campaign, internal dynamics of implementing organizations, their policy instruments, their service delivery mechanisms, their management practices, and the linkages among these. Contrast with “impact evaluation”. Quasi-experimental design Impact evaluation designs that create a control group using statistical procedures. The intention is to ensure that the characteristics of the treatment and control groups are identical in all respects, other than the intervention, as would be the case in an experimental design. Random assignment An intervention design in which members of the eligible population are assigned at random to either the treatment group (receive the intervention) or the control group (do not receive the intervention). That is, whether someone is in the treatment or control group is solely a matter of chance, and not a function of any of their characteristics (either observed or unobserved). Random sample The best way to avoid a biased or unrepresentative sample is to select a random sample. A random sample is a probability sample where each individual in the population being sampled has an equal chance (probability) of being selected. Randomized evaluation (RE) (also known as randomized controlled trial, or RCT) An impact evaluation design in which random assignment is used to allocate the intervention among members of the eligible population. Since there should be no correlation between participant characteristics and the outcome, and differences in outcome between the treatment and control can be fully attributed to the intervention, i.e. there is no selection bias. However, REs may be subject to several types of bias and so need follow strict protocols. Also called “experimental design”. Regression analysis A statistical method which determines the association between the dependent variable and one or more independent variables.
75
Selection bias A possible bias introduced into a study by the selection of different types of people into treatment and comparison groups. As a result, the outcome differences may potentially be explained as a result of pre-existing differences between the groups, rather than the treatment itself. Significance level The significance level is usually denoted by the Greek symbol, α (alpha). Popular levels of significance are 5% (0.05), 1% (0.01) and 0.1% (0.001). If a test of significance gives a p-value lower than the α-level, the null hypothesis is rejected. Such results are informally referred to as 'statistically significant'. The lower the significance level, the stronger the evidence required. Choosing level of significance is an arbitrary task, but for many applications, a level of 5% is chosen, for no better reason than that it is conventional. Spillover effects When the intervention has an impact (either positive or negative) on units not in the treatment group. Ignoring spillover effects results in a biased impact estimate. If there are spillover effects then the group of beneficiaries is larger than the group of participants. Stratified sample Obtained by dividing the population of interest (sampling frame) into groups (for example, male and female), then by drawing a random sample within each group. A stratified sample is a probabilistic sample: every unit in each group (or strata) has the same probability of being drawn. Treatment group The group of people, firms, facilities or other subjects who receive the intervention. Also called participants. Treatment on the treated (TOT) estimate The treatment on the treated estimate is the impact (average treatment effect) only on those who actually received the intervention. Compare to intention to treat. Unobservables Characteristics which cannot be observed or measured. The presence of unobservables can cause selection bias in quasi-experimental designs.
76