evaluating teacher performance in higher education:the
TRANSCRIPT
University of Central Florida University of Central Florida
STARS STARS
Electronic Theses and Dissertations, 2004-2019
2005
Evaluating Teacher Performance In Higher Education:the Value Of Evaluating Teacher Performance In Higher Education:the Value Of
Student Ratings Student Ratings
Judith Prugh Campbell University of Central Florida
Part of the Educational Leadership Commons
Find similar works at: https://stars.library.ucf.edu/etd
University of Central Florida Libraries http://library.ucf.edu
This Doctoral Dissertation (Open Access) is brought to you for free and open access by STARS. It has been accepted
for inclusion in Electronic Theses and Dissertations, 2004-2019 by an authorized administrator of STARS. For more
information, please contact [email protected].
STARS Citation STARS Citation Campbell, Judith Prugh, "Evaluating Teacher Performance In Higher Education:the Value Of Student Ratings" (2005). Electronic Theses and Dissertations, 2004-2019. 438. https://stars.library.ucf.edu/etd/438
EVALUATING TEACHER PERFORMANCE IN HIGHER EDUCATION:
THE VALUE OF STUDENT RATINGS
by
Judith Prugh Campbell B.A. University of South Florida, 1974
M.Ed. Stetson University, 1979
A dissertation submitted in partial fulfillment of the requirements for the degree of Doctor of Education
in the Department of Educational Research, Technology, and Leadership in the College of Education
at the University of Central Florida Orlando, Florida
Summer Term 2005
Major Professor: William C. Bozeman

© 2005 Judith Prugh Campbell
ii
ABSTRACT
The purposes of this research were to: (a) assess community college students’
perceptions of the student evaluation practice; (b) assess community college faculty
members’ responses to student evaluations of teachers and the extent to which
instructional modifications resulted from student ratings; and (c) assess community
college administrators’ responses to student evaluations of teachers, the extent student
ratings influenced administrators’ evaluations of faculty, and how the results from student
ratings were used to promote instructional effectiveness.
A total of 358 students, faculty, and administrators from 5 Florida community
colleges contributed their opinions on the value of the practice of student evaluation of
teaching. Data were collected using mixed methodology. The survey and interview
sessions were conducted on location at the respective community colleges. Descriptive
statistics, correlation and regression procedures, one-way analysis of variance, t-test, and
phenomenological analysis were used to analyze the data.
Quantitative results indicated that these 320 community college students believed
that student ratings had value, and, thus their role as instructor evaluator was important.
Furthermore, the students believed student evaluations were important to faculty and
administrators. However, most students were either unaware or did not believe that
student evaluations had any effect. Phenomenological analysis of the extensive
descriptions provided by 21 faculty participants suggested that the numeric data provided
by student evaluations was generally an ineffective method to impact instruction. Faculty
iii
described their frustration with inadequately designed instruments, ineffective methods of
receiving ratings results, and limited or non-existent feedback from supervisors.
Phenomenological analysis of the 17 administrators’ transcriptions suggested that
although the student ratings practice was vital to institutional integrity the results from
student evaluations were marginally valuable in their impact on enhancing instruction
and of limited value in faculty evaluation.
Implications for student evaluation practices drawn from this study included the
need for institutions to: (a) assess the value of their student evaluation practice and its
impact on teaching effectiveness; (b) define and clearly articulate a statement of purpose
for conducting student evaluations; (c) refine procedures for administering the student
evaluation practice; (d) examine their student evaluation practices and instrument on a
regular review cycle; (e) adopt alternative methods for collecting and disseminating
student feedback; (f) implement student evaluation measures that reflect the varied
teaching approaches and diverse learning environments.
iv
Knowledge enlightens; wisdom inspires. I dedicate the efforts of this project to
my parents, Sam and Marie Prugh, and to my children, Stephen, Gregory, and Elizabeth
Campbell. Their unconditional love has been, and always will be, my inspiration.
v
ACKNOWLEDGMENTS
To my dissertation committee members, colleagues, research participants, and
family, I extend my deepest appreciation for your assistance and encouragement during
the challenging journey of doctoral studies. Dr. William C. Bozeman, committee chair,
thank you for your expert guidance and valuable critiques of the research project. Dr.
Bernard Jensen, Dr. Debbie Hahs-Vaughn, and Dr. Charles Carroll, thank you for your
time and expertise. It was an honor and privilege to conduct this research under your
supervision and wise counsel.
I offer special recognition to Dr. Kent Sharples, President of Daytona Beach
Community College (DBCC), for his vision in developing the Beacon Leadership
Program, and to Dean Verl Beebe, trusted mentor and colleague. To the members of the
UCF/Daytona cohort, thank you for the bonds of friendship that facilitated my
professional and personal development. A very special tribute goes to Dilia Rodriguez
and Jennifer Maxwell, DBCC department colleagues, who accepted extra duties that
enabled me to have the freedom of mind to focus on this project.
An official acknowledgment goes to the five Florida community college
presidents, vice presidents, administrators, faculty members, and students who
participated in this research project. Each of you made the experience rewarding.
Heartfelt thanks to my children, Stephen, Gregory, and Elizabeth; and family
members including sisters Marybeth Collins, Ginny Goodin, Denise Kundid, Cathy
Prugh, and brothers Greg, Tim, Mike, Sam, and Chris Prugh for their loyal support. May
God bless each of you.
vi
TABLE OF CONTENTS
LIST OF TABLES............................................................................................................ xii
CHAPTER 1 INTRODUCTION ........................................................................................ 1
Statement of the Problem................................................................................................ 5
Purpose of the Study ....................................................................................................... 5
Research Questions......................................................................................................... 6
Definition of Terms ........................................................................................................ 7
Assumptions.................................................................................................................... 7
Design of the Study......................................................................................................... 8
Delimitations................................................................................................................. 10
Significance of the Study.............................................................................................. 10
Organization of the Study ............................................................................................. 11
CHAPTER 2 REVIEW OF THE LITERATURE ........................................................... 12
Introduction................................................................................................................... 12
Conceptual Frame for Evaluation of Teaching Effectiveness ...................................... 13
Characteristics of Good Teaching............................................................................. 14
Learning Theories and Teaching Methods................................................................ 17
Postsecondary Philosophical and Instructional Changes .......................................... 18
A Systems Approach to Evaluation .......................................................................... 20
Historical Overview...................................................................................................... 22
Status of the Student Ratings Research ........................................................................ 25
Validity of Student Ratings....................................................................................... 27
vii
Reliability of Student Ratings................................................................................... 31
Possible Biasing Factors ........................................................................................... 33
New Directions for Student Ratings Research ............................................................. 38
Summary....................................................................................................................... 41
CHAPTER 3 METHODOLOGY .................................................................................... 46
Introduction................................................................................................................... 46
Statement of the Problem.............................................................................................. 46
Population and Sample ................................................................................................. 48
Instrumentation ............................................................................................................. 56
Instrument Validity and Reliability .............................................................................. 58
Data Collection ............................................................................................................. 60
Data Analysis................................................................................................................ 64
Dependent Variables..................................................................................................... 65
Independent Variables .................................................................................................. 66
Research Question 1 ................................................................................................. 66
Research Question 2 ................................................................................................. 67
Research Questions 3 and 4 ...................................................................................... 68
Summary....................................................................................................................... 69
CHAPTER 4 ANALYSIS OF DATA .............................................................................. 71
Introduction................................................................................................................... 71
Description of Sample Population ............................................................................ 72
Research Question 1 ..................................................................................................... 73
Descriptive Analysis of Survey Statements 1 – 5, 10, 15 ......................................... 75
viii
Descriptive Analysis of Beliefs About the Value of Ratings ................................... 81
Inferential Analysis ................................................................................................... 83
Mean Differences in Beliefs as a Function of Gender.......................................... 83
Mean Differences in Beliefs as a Function of Program........................................ 85
Predicting Beliefs from Student Age .................................................................... 86
Predicting Beliefs from Total Credits Earned....................................................... 87
Research Question 2 ..................................................................................................... 88
Correlation Between Rating Scales: Importance and Effects ................................... 90
Correlations Across Variables .................................................................................. 91
Correlations Among Variables: Importance of Student Ratings .......................... 91
Correlations Among Variables: Effects of Student Ratings ................................. 93
Correlations Among Scale Variables: Importance and Effects ............................ 95
Descriptive Analysis for Scales: Importance and Effects......................................... 96
Descriptive Analysis of Survey Statements 6 – 9................................................. 96
Descriptive Analysis of Survey Statements 11 – 14........................................... 101
Qualitative Analysis of Student Comments ............................................................ 106
Research Question 3 ................................................................................................... 109
Independent-Samples t Test .................................................................................... 110
Qualitative Analysis................................................................................................ 111
Phenomenological Analysis of Faculty Transcriptions ...................................... 113
Phenomenological Reduction ............................................................................. 114
Imaginative Variation: How Evaluations Were Experienced............................. 119
Synthesis ............................................................................................................. 123
ix
Research Question 4 ................................................................................................... 124
Qualitative Analysis................................................................................................ 125
Phenomenological Reduction ............................................................................. 125
Imaginative Variation: How Evaluations Were Experienced............................. 131
Synthesis ............................................................................................................. 134
Summary..................................................................................................................... 135
CHAPTER 5 DISCUSSION OF FINDINGS AND RECOMMENDATIONS.............. 140
Introduction................................................................................................................. 140
Statement of the Problem............................................................................................ 140
Purpose of the Study ................................................................................................... 141
Summary and Discussion of Statistical Findings ....................................................... 142
Research Question 1 ............................................................................................... 143
Research Question 2 ............................................................................................... 147
Research Question 3 ............................................................................................... 152
Research Question 4 ............................................................................................... 155
Research Limitations .................................................................................................. 158
Implications for Student Evaluation Practices............................................................ 158
Recommendations for Future Studies......................................................................... 159
APPENDIX A FLORIDA COMMUNITY COLLEGES.............................................. 161
APPENDIX B NOTIFICATION LETTER.................................................................... 163
APPENDIX C LETTER OF REQUEST ........................................................................ 165
APPENDIX D INTERVIEW QUESTIONS – ADMINISTRATORS ........................... 167
APPENDIX E INTERVIEW QUESTIONS – FACULTY ............................................ 169
x
APPENDIX F GRADING FACULTY SURVEY – STUDENT VERSION ................. 171
APPENDIX G GRADING FACULTY SURVEY – FACULTY VERSION ................ 174
APPENDIX H INFORMED CONSENT – STUDENT GROUP.................................. 177
APPENDIX I INFORMED CONSENT – FACULTY GROUP .................................... 179
APPENDIX J INFORMED CONSENT – ADMINISTRATOR GROUP ..................... 181
APPENDIX K MEMO OF NEEDS FOR COLLEGE PARTICIPATION ................... 183
APPENDIX L INSTITUTIONAL REVIEW BOARD PERMISSION LETTER......... 185
LIST OF REFERENCES................................................................................................ 187
xi
LIST OF TABLES
Table 1: Number of Community College Classes Surveyed ............................................ 49
Table 2: Profile of Community College Participants........................................................ 50
Table 3: Frequency Analysis of Student Survey Group (n = 320) ................................... 51
Table 4: Age Profile of Student Group............................................................................. 52
Table 5: Profile of College Credits Earned by Student Group ......................................... 52
Table 6: Demographic Profile of Faculty Group .............................................................. 54
Table 7: Demographic Profile of Administrator Group.................................................... 55
Table 8: Grading Faculty Survey Instrument Reliability Analysis................................... 60
Table 9: Correspondence of Survey Statements to Scales................................................ 65
Table 10: Frequency Analysis for Survey Statement 1 .................................................... 76
Table 11: Frequency Analysis for Survey Statement 2 .................................................... 76
Table 12: Frequency Analysis for Survey Statement 3 .................................................... 77
Table 13: Frequency Analysis for Survey Statement 4 .................................................... 78
Table 14: Frequency Analysis for Survey Statement 5 .................................................... 79
Table 15: Frequency Analysis for Survey Statement 10 .................................................. 80
Table 16: Frequency Analysis for Survey Statement 15 .................................................. 80
Table 17: Descriptive Analysis - Beliefs About the Value of Student Ratings ................ 82
Table 18: Sample Size, Mean, and Standard Deviation of Beliefs Scale by Gender ....... 83
Table 19: One-Way ANOVA Summary of Beliefs and Gender....................................... 84
Table 20: Sample Size, Means, and Standard Deviations of Beliefs Scale by Program .. 85
Table 21: One-Way ANOVA Summary of Beliefs and Program of Study...................... 86
xii
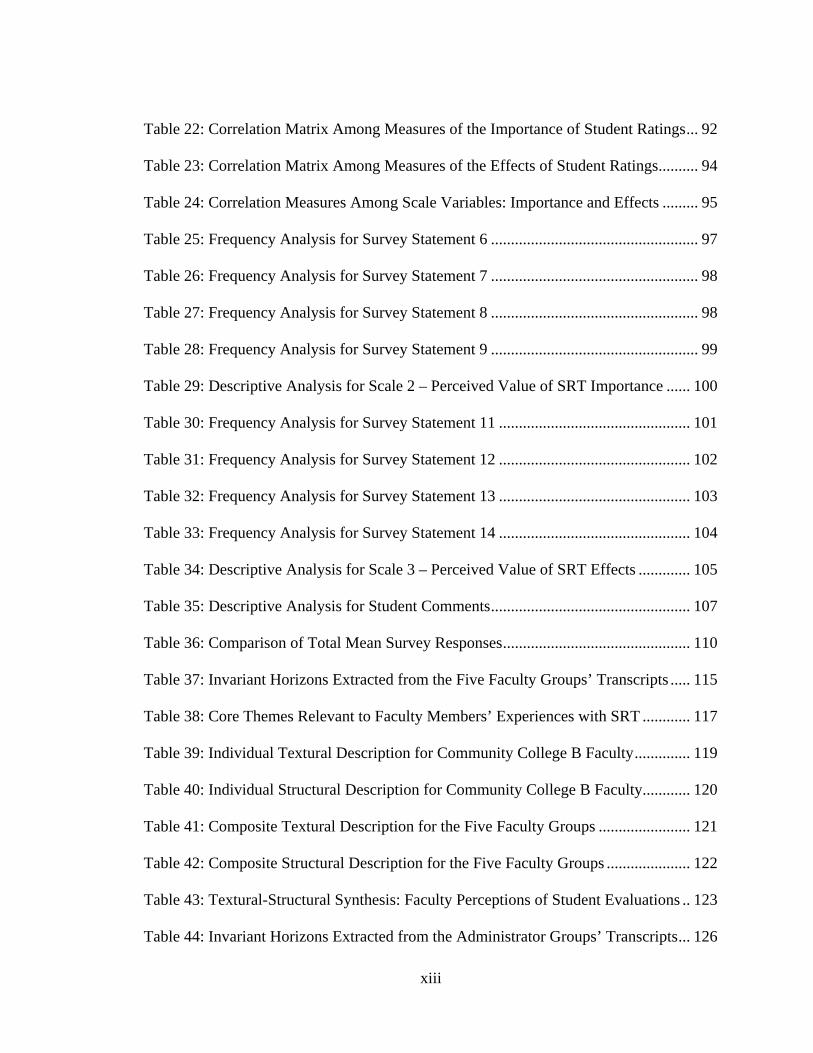
Table 22: Correlation Matrix Among Measures of the Importance of Student Ratings... 92
Table 23: Correlation Matrix Among Measures of the Effects of Student Ratings.......... 94
Table 24: Correlation Measures Among Scale Variables: Importance and Effects ......... 95
Table 25: Frequency Analysis for Survey Statement 6 .................................................... 97
Table 26: Frequency Analysis for Survey Statement 7 .................................................... 98
Table 27: Frequency Analysis for Survey Statement 8 .................................................... 98
Table 28: Frequency Analysis for Survey Statement 9 .................................................... 99
Table 29: Descriptive Analysis for Scale 2 – Perceived Value of SRT Importance ...... 100
Table 30: Frequency Analysis for Survey Statement 11 ................................................ 101
Table 31: Frequency Analysis for Survey Statement 12 ................................................ 102
Table 32: Frequency Analysis for Survey Statement 13 ................................................ 103
Table 33: Frequency Analysis for Survey Statement 14 ................................................ 104
Table 34: Descriptive Analysis for Scale 3 – Perceived Value of SRT Effects ............. 105
Table 35: Descriptive Analysis for Student Comments.................................................. 107
Table 36: Comparison of Total Mean Survey Responses............................................... 110
Table 37: Invariant Horizons Extracted from the Five Faculty Groups’ Transcripts ..... 115
Table 38: Core Themes Relevant to Faculty Members’ Experiences with SRT ............ 117
Table 39: Individual Textural Description for Community College B Faculty.............. 119
Table 40: Individual Structural Description for Community College B Faculty............ 120
Table 41: Composite Textural Description for the Five Faculty Groups ....................... 121
Table 42: Composite Structural Description for the Five Faculty Groups ..................... 122
Table 43: Textural-Structural Synthesis: Faculty Perceptions of Student Evaluations .. 123
Table 44: Invariant Horizons Extracted from the Administrator Groups’ Transcripts... 126
xiii
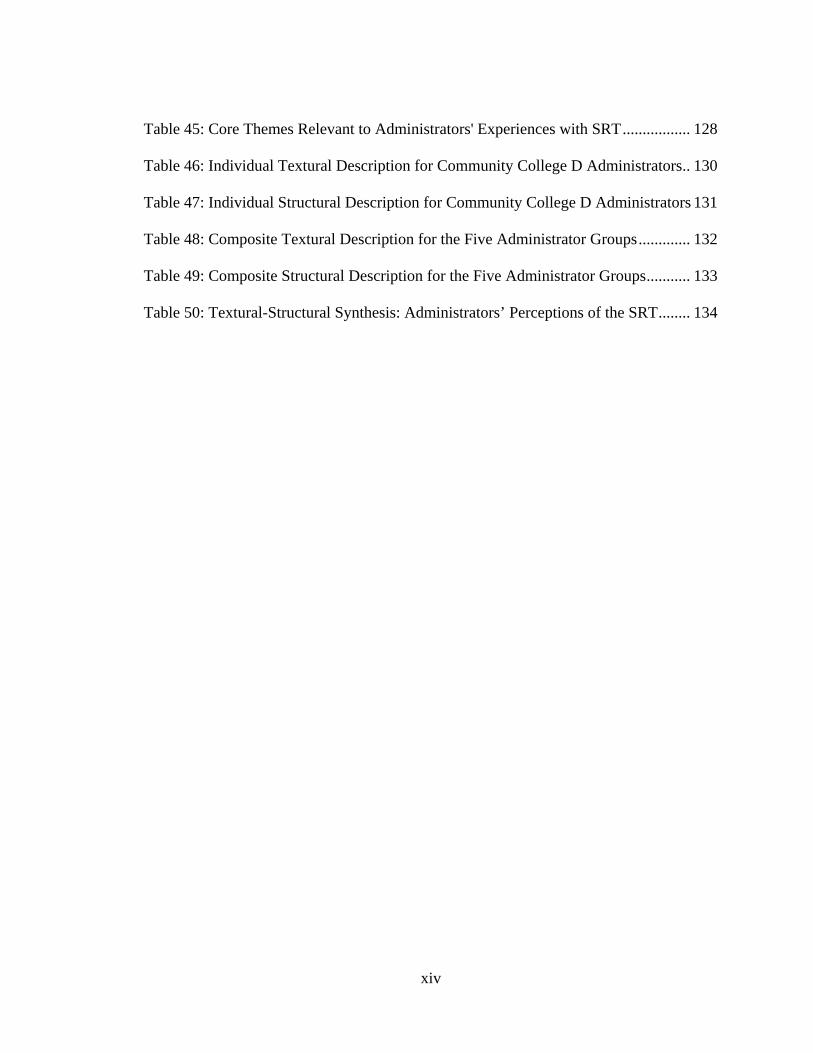
Table 45: Core Themes Relevant to Administrators' Experiences with SRT................. 128
Table 46: Individual Textural Description for Community College D Administrators.. 130
Table 47: Individual Structural Description for Community College D Administrators 131
Table 48: Composite Textural Description for the Five Administrator Groups............. 132
Table 49: Composite Structural Description for the Five Administrator Groups........... 133
Table 50: Textural-Structural Synthesis: Administrators’ Perceptions of the SRT........ 134
xiv
CHAPTER 1
INTRODUCTION
One measure of teaching effectiveness in North American higher education
institutions is the scores from the survey that students complete during each academic
semester. This evaluative instrument is commonly referred to as the student ratings of
teaching (SRT), teacher rating form (TRF), student evaluation of teaching (SET), or
student evaluation of faculty (SEF). Survey results have been used to make critical
judgments regarding instructional effectiveness. Abrami, Theall, and Mets (2001)
reported that student ratings “serve as tools for instructional improvement, as evidence
for promotion and tenure decisions, as the means for student course selection, as one
criterion of program effectiveness, and as the continuing focus of active research and
intensive debate” (p.1). Essentially, student ratings have served two faculty evaluative
functions: formative and summative. Results from student evaluations have been used to
inform the teacher and, hopefully, assist the individual to become a more effective
instructor. Summative evaluations have been made using student ratings to support
tenure, promotion, transfer, and termination decisions as well as approve pay increases
and faculty awards. In some colleges and universities, the data from student ratings have
served as the only criterion for judging teacher effectiveness. Cashin (1999) reported,
“Many colleges and universities rely heavily, if not solely, on student rating data as the
only systematic source of data collected to evaluate teaching” (p.26). According to
Theall and Franklin (2001), “Though it may seem obvious that summative evaluation
includes more technical rigor and a wider array of date, the unfortunate reality is that
1
summative decisions about teaching are often made on the basis of student ratings data
alone” (p.51). Consequently, evaluating faculty teaching performance through the use of
student ratings has involved students in the highly sensitive personnel evaluation process.
Selden (1999) reported a significant increase in the use of student ratings as a
source of information to evaluate teaching performance by liberal arts colleges.
According to Selden (1999), “Student ratings are now the most widely used source of
information on teaching effectiveness” (p.15). Approximately 55% of the 680 liberal arts
colleges that Selden surveyed in 1978 used student ratings to evaluate faculty. The
importance of using student ratings as a source of information increased to 80% of the
604 liberal arts colleges surveyed in 1988 and to 88% of the 598 colleges surveyed in
1998. Kulik (2001) suggested that “the trend seems to be toward an increasing use of
student ratings in higher education” (p.23). This emphasis on student ratings or “student
satisfaction measures” (Downey, 2003, p.711) concerns many faculty members who are
not convinced of the reliability, validity, and usefulness of the student ratings data.
Selden (1984) stated, “In general, most factors that might be expected to influence
student ratings have relatively small or no effect” (p. 135). As noted by Selden (1984,
p.135), some of the controversy surrounding the use of student ratings has involved
issues such as student characteristics (age, sex, student level, and personality); course and
class characteristics (size of class, subject matter, elective versus required course); and
instructor characteristics (sex, professional rank, and grading standards).
How to measure the quality of teaching through student evaluations has been a
research topic for 75 years. Centra (1993) reported that the Purdue teacher rating form
which was published by Purdue University in 1927 was most likely the first student
2
evaluation form. According to Centra, Remmers and his Purdue colleagues used the
Purdue teacher rating form in the initial investigations of student evaluation of teaching
effectiveness. Cashin (1999) reported that the research base of student ratings of teaching
was now extensive. Cashin’s concern was the over-reliance on student ratings data by
colleges and universities; he expressed the necessity to have other sources of information
to evaluate teaching. Theall and Franklin (2001) stated, “Few issues in higher education
are as sensitive, divisive, and political as faculty evaluation and in particular the quality
and value of the information provided by students in their evaluations of teachers and
courses” (p. 45). In their review of the ratings literature, Theall and Franklin discussed
the aggressive research efforts among some researchers to discredit student ratings.
Theall and Franklin suggested that a more beneficial direction would be to improve the
knowledge and skills of those who use the data and, thereby, decrease the issues of
mistrust and misuse of the data.
Although many individuals within the higher education academic community
would agree that student ratings of teaching (SRT) have informative merit, there appears
to be a lack of awareness about the findings of student evaluation research among college
faculty and administrators. Theall and Franklin (2001) in citing their 1989 study “found a
surprising lack of knowledge about the literature of student ratings and even about the
basic statistical information necessary to interpret reports accurately” (p. 46). Theall and
Franklin (2001) concluded from their 1989 survey of over 600 faculty and administrators
that the more knowledge the research participants had about student evaluations, the
more positive were their attitudes toward students and student evaluations. Furthermore,
3
they reported “that lack of knowledge correlated significantly with negative opinions
about evaluation, student ratings, and the value of student feedback” (p. 46).
The relative ease of SRT administration and its quantitative format have provided
higher education administrators a method to measure teaching effectiveness and support
personnel decisions. Moreover, using data from the SRTs has provided a method for
institutions to respond to societal demands to demonstrate instructional performance.
Despite concerns among some faculty about the use of SRTs, it appears that student
ratings will remain as one indicator of teaching effectiveness. However, for student
ratings to become more meaningful to the primary stakeholders (students, faculty, and
administrators), it has been suggested by Penny (2003) that there be a shift in ratings
research “to increase the practical usefulness of student ratings” (p.399). Ory and Ryan
(2001) suggested that “the body of literature supporting the validity of student ratings
needs to be expanded to include studies of how student ratings are used on today’s
campuses and what happens as a result” (p. 41).
Acquiring information on how students perceive their role as evaluators provides
an additional source of data in the continuous effort to improve the student ratings
practice. In addition, examining the value of student ratings to faculty and administrators
and identifying how they use the ratings data improve the feedback loop. The usefulness
of student evaluations is enhanced by understanding the value of the data to each of the
three stakeholder groups: students, faculty, and administrators.
4
Statement of the Problem
Colleges and universities have invested time, personnel, and money into the
process of students’ evaluation of faculty through the use of various forms of student
ratings of teaching. These data provide one measure of evaluating the quality and
effectiveness of instruction. Despite there being positive uses of the data from student
ratings, Ory and Ryan (2001) noted that there are unintended uses of the data. One
example of an unintended consequence stated by Ory and Ryan was that “the rating
process becomes a meaningless activity that is performed by students and instructors only
because it is mandated” (2001, p. 40). Penny (2003) raised the issue that ratings research
has been limited due to the research focus on “…issues pertaining to the validity and
reliability, rather than how best to use student ratings…” (p. 399).
This research responded to the lack of emphasis on more effective use of the data
for the purpose of improving teaching effectiveness by questioning the opinions and
practices of the three stakeholder groups: students, faculty, and administrators. More
importantly, this research raised the question of the value of SRTs: Is the effort of doing
student evaluations worth the institutional investment or is it simply a routine process
which has little or no effect on improving teaching effectiveness?
Purpose of the Study
Students in the higher education system have assumed a major role in the
evaluation of faculty. Data from the student ratings become part of the faculty member’s
file and can have a direct impact on personnel decisions. Results from the student ratings
can affect annual evaluations, merit pay, advancement in faculty rank, and tenure
5
opportunities. Students may or may not be aware of the influence their responses have in
the evaluation of faculty. Therefore, in order to improve the process of formal student
evaluation of faculty, it is important to examine the perceptions students have about
SRTs. The purposes of this research were to: (a) assess community college students’
perceptions of the student evaluation practice; (b) assess community college faculty
members’ responses to student evaluations of teachers and the extent to which
instructional modifications result from student ratings; and (c) assess community college
administrators’ responses to student evaluations of teachers, the extent student ratings
influence administrators’ evaluations of faculty, and how the results from student ratings
are used to promote instructional effectiveness.
Research Questions
The research was based on the following four questions:
1. How did students in Florida community colleges perceive the value of their
role as faculty evaluators?
2. Was there a statistically significant relationship between students’ perceptions
of the relevance or importance of the student survey for evaluating professors
and how students believed the survey results were used?
3. What were the Florida community college faculty member respondents’
perceptions of the student evaluation process and its impact on instruction?
4. What were the Florida community college administrators’ perceptions of the
student evaluation process and its impact on instruction and faculty
evaluation?
6
Definition of Terms
The following definitions were used for the purpose of this study:
Administrator—a community college program manager, department chair, dean,
and vice-president whose job function includes supervising and evaluating faculty
Community college—a public 2-year postsecondary institution which awards
associate degrees
Faculty—a teacher who is credentialed to teach by the institution and is currently
teaching at the community college level
Process—a series of actions leading to a final product; process and practice are
terms used to denote the customary action of the use of student rating forms to evaluate
teaching effectiveness
Student ratings of teaching (SRT)—a common term to describe the use of rating
forms which students use to evaluate teachers. This term is similar in meaning to the
terms teacher rating forms (TRFs), student evaluations of teaching (SET), and student
evaluation of faculty (SEF) which are often used in the student ratings literature.
Value—to rate or scale in usefulness, importance, or general worth; to consider or
rate highly (Merriam-Webster’s Collegiate Dictionary, 1993)
Assumptions
This research was conducted with the following assumptions:
1. The community college personnel who were asked to participate in this study
assisted with the research by randomly identifying class sections with students
7
who were enrolled in sophomore courses to respond to the Grading Faculty
survey.
2. Students thoughtfully and honestly completed the Grading Faculty survey.
3. Faculty thoughtfully and honestly completed the Grading Faculty survey.
4. Administrators and faculty candidly responded to the interview questions.
5. The presence of the researcher during the survey administrations and
interview sessions served to build rapport and to improve the response rate.
6. The survey and interview responses were a valid measure of all participants’
attitudes and opinions about the student ratings process.
Design of the Study
The state of Florida has 28 community colleges. This study was limited to
requesting participation from 6 Florida community colleges which were similar in annual
2002-2003 unduplicated enrollment size according to the United States Department of
Education National Center for Education Statistics (NCES, 2004). These community
colleges ranked by size of enrollment from eighth to thirteenth largest (Appendix A).
Each of the 6 community college presidents and academic vice-presidents was
contacted by two letters during October 2004. The first letter of notification (Appendix
B) informed the president and vice-president of the research project. The second letter
(Appendix C), which was mailed one week later, invited the senior administrators to
participate in the study and requested the vice-president’s assistance in arranging for
the researcher to visit the campus. Subsequently, the researcher contacted each academic
vice-president by telephone and E-mail to discuss the specific needs for data collection.
8
Chapter 3 provides the detailed process from making the initial contacts with the
community college administrators to arranging the campus visitations for the purpose of
administering the surveys and conducting the interview sessions with the research
participant groups.
Each of the community colleges that agreed to participate in the study had three
sample groups: students, faculty, and administrators. The research consisted of two mixed
methodologies: survey and phenomenological research. The student group completed the
Grading Faculty survey (Appendix F) which was administered by the researcher during a
regularly scheduled class session. The faculty participants completed a similar Grading
Faculty survey (Appendix G) following a small group 90-minute interview session.
Analyses of the survey data were completed by the researcher using SPSS version 11.5
statistical software. Descriptive and inferential statistics were used to analyze the survey
data for Research Questions 1 and 2.
Faculty and administrators were interviewed in separate 90-minute sessions of
small focus groups ranging from two to five volunteer participants. The interviews were
semi-structured and audio taped. Interview prompts (Appendix D & E) were designed to
elicit detailed verbal descriptions of how student ratings were used by the faculty and
administrator groups to evaluate and affect teaching performance. The essential structure
of the value of student ratings for the faculty and administrator groups was extracted from
these descriptions using a phenomenological analyses approach suggested by Moustakas
(1994).
9
Delimitations
This research was conducted with the following delimitations:
1. The results from this study were limited to the students of the Florida
community colleges that participated in this study. The students were enrolled
in 2000-level courses and had previous experience evaluating faculty through
student ratings.
2. The study focused only on the value of student ratings to the sample
populations of students, faculty, and administrators who participated in this
study.
Significance of the Study
Involving students in the evaluation of their professors is a standard practice in
the United States higher education system. However, limited research has been conducted
on how the student ratings data are used by community college personnel to improve
teaching effectiveness. For the evaluation process to be effective, this study was
conducted to increase awareness of the perceptions community college students have of
the student ratings practice and how they believed the student ratings data are used.
Understanding this relationship may result in adjustments to the current practice or
development of alternative methods for involving students in the faculty evaluation
process. Further, identifying how community college faculty and administrators currently
use the student ratings data provides institutions information on their investment of time,
personnel, and money in the SRT process. The significance of this study was to examine
the perceptions that community college students, faculty, and administrators have of the
10
formal evaluation of faculty by students and how the student ratings data impacted
instruction and evaluation. It is only through involving all stakeholders in questioning the
value of the SRT process that institutions can determine if the investment of time, money,
and human capital are achieving the intended purpose of evaluation—promoting a cycle
of instructional improvement. This study was conducted to enhance existing knowledge
in the research area of formal student evaluation of teaching effectiveness.
Organization of the Study
Chapter 1 introduced the research topic, stated the research problem and the
purpose of the study, presented the research questions with a brief overview of the
methodology, and identified definitions, assumptions, and delimitations of the study. The
rationale to support the significance of the study concluded Chapter 1. A review of
literature on the topic of formal student evaluation of teaching effectiveness is presented
in Chapter 2; it provides an overview of the evaluation issues that involve student ratings.
The methodology which was used to conduct this research study is provided in Chapter 3.
Chapter 4 reports the results from the statistical analyses of the survey data to answer
Research Questions 1 and 2; also, Chapter 4 provides qualitative analyses of the faculty
participants’ and administrators’ responses to the interview questions which correspond
to Research Questions 3 and 4. In conclusion, Chapter 5 proposes an interpretation of the
research data, discusses implications of the results, and offers recommendations for
future studies.
11
CHAPTER 2
REVIEW OF THE LITERATURE
Introduction
The investigation of the literature for this research study focused on the issue of
formal student evaluation of teaching in North American higher education institutions.
The customary practice of institutions seeking student input into the evaluation of faculty
has been through the use of rating forms to evaluate teacher effectiveness. The use of
student ratings is one of the sources for evaluating college and university faculty; this
source is being used extensively by American schools and progressively more throughout
the world (Abrami, Theall, & Mets, 2001). In reviewing the extensive student ratings
literature, the researcher sought to identify the major issues that are associated with the
formal evaluation of teaching effectiveness as measured by student ratings and to
determine the direction researchers were suggesting for further studies.
Chapter 2 includes six sections that provide the rationale for the present research
study: Introduction, Conceptual Framework for the Evaluation of Teaching Effectiveness,
Historical Overview, Status of the Student Ratings Research, New Directions for Student
Ratings Research, and Summary. Section one, Introduction, provides the outline for
Chapter 2. Section two presents the Conceptual Framework for the Evaluation of
Teaching Effectiveness through a discussion of the characteristics of good teaching, an
overview of three learning theories and three instructional approaches, and a brief review
of postsecondary instructional changes. The section concludes with an example of a
systems approach to improve the formal student evaluation practice. Section three,
12
Historical Overview, traces the history of student ratings research while section four,
Status of the Student Ratings Research, highlights the research findings associated with
the data from student ratings such as results of the studies on validity, reliability, and
possible biasing factors. Section five, New Directions for Student Ratings Research,
discusses suggestions that have been presented by researchers for new approaches to
student ratings research. Section six, Summary, completes the overview of the literature
research segment for this study.
Conceptual Frame for Evaluation of Teaching Effectiveness
The purposes of employee evaluation are to assess performance and provide data
to defend personnel decisions. It is a common practice that occurs in most work settings
where supervisors judge an employee’s effectiveness. The evaluation of faculty
performance in higher education is unique in that it involves students in the role of
evaluators. The students are not the teacher’s supervisors, yet the administrators in many
North American higher education institutions request that students complete an
evaluation on the teacher for each course during each academic semester. The students’
feedback serves as a source of evaluative information. The assumption for this practice of
students evaluating faculty performance is based on the belief, that since students are
with the teacher for a semester of study, the students can judge the instructional
effectiveness of the teacher. Although this practice may seem logical from the
administrators’ point of view, the administrators place a personnel evaluation expectation
on the students. Administrators assume that the students want to participate in this
activity, that the students provide honest and fair judgments of teaching effectiveness,
13
and that the students believe the evaluations are used for the stated purpose of the
evaluation. Furthermore, administrators presuppose that faculty members believe that
students should be involved in the evaluation process, that faculty members value the
students’ opinions as trustworthy and objective, and that faculty members use the
information to improve instructional effectiveness.
Critical to the evaluation of teaching effectiveness is an understanding of what
effective teaching means. Defining the qualities of good teaching to achieve student
learning has been the focus of numerous research studies. Despite research efforts, a
generally accepted definition of effective teaching has not been identified (Trout, 2000;
Paulsen, 2002). This fact has led researchers to suggest prudence in the use of student
ratings data when making decisions about the quality of teaching effectiveness
particularly when a summative decision is being made (Abrami & d’Apollonia, 1999).
Most researchers support the use of student ratings because the data provide a valuable
source of information about teaching quality and serve as a subjective assessment of the
learning experience.
Characteristics of Good Teaching
One of the difficulties in the measurement of effective teaching is the definition of
what effective teaching involves. Centra (1993) cited the following definition of good
teaching which was developed by a 1987 Syracuse University committee of which he
was a member: “Effective teaching produces beneficial and purposeful student learning
through the use of appropriate procedures” (p. 42). The committee suggested a definition
that included both functions of the teaching/learning relationship: process (what teachers
14
do) and outcome (student learning). Defining the term, teaching effectiveness, in this
manner transformed an abstract construct into two meaningful dimensions. Identification
of the qualities and skills that described good teaching could permit quantitative analyses.
Numerous researchers have asked students and faculty members to describe the
qualities that they believed were important to effective teaching. Selden (1984) listed the
following teaching behaviors that had been identified in numerous studies: “being well
prepared for class, demonstrating comprehensive subject knowledge, motivating students,
being fair and reasonable in managing the details of learning, and being sincerely
interested in the subject manner and in teaching itself” (p. 133). Centra (1993) reported
on the research by Feldman. Feldman’s analyses of 31 studies indicated a consistency
between the faculty and student groups regarding the traits and skills that they believed
exemplified good teachers. The faculty and student groups reported similar high ratings
in the following attributes of effective teachers:
1. sensitivity to and concern with class level and progress 2. preparation and organization of the course 3. knowledge of the subject 4. enthusiasm (for the subject or for teaching) 5. clarity and understandability 6. availability ad helpfulness 7. fairness 8. impartiality in evaluation of students 9. quality of examinations (p. 39) Centra (1993) maintained that “good teaching is more complicated than any list of
qualities or characteristics can suggest” (p. 41) specifically because some traits can be
quantified better than other teaching behaviors and because instructors exemplified
teaching qualities in varying degrees. Moreover, successful teaching depended upon a
unique combination of the instructor’s theory of how students learn with the instructor’s
15
beliefs about the most effective teaching behaviors to facilitate student learning.
Although there are varied teaching approaches which reflect a faculty member’s theory of
the teaching/learning relationship, a well-designed student evaluation system should be
able to determine how well faculty members promoted learning. Furthermore, effective
student appraisals of teaching effectiveness are contingent upon the appropriate questions
being asked of the students (Seldin, 1984).
Marsh and Roche (1997) stressed that teaching is multidimensional. Evidence for
the multidimensionality perspective was based on factor analysis of the Students’
Evaluation of Educational Quality (SEEQ) inventory of teaching effectiveness. Data
were collected from approximately one million SEEQ surveys. Nine factors emerged: (a)
learning/value, (b) instructor enthusiasm, (c) organization/clarity, (d) group interaction,
(e) individual rapport, (f) breadth of coverage, (g) examinations/grading, (h)
assignments/readings, and (i) workload/difficulty. Marsh expressed concern that many
“homemade” student evaluation surveys failed to reflect the multiple dimensions of
teaching. Therefore, the results from such “homemade” instruments weakened their
utility and seriously limited their diagnostic feedback. According to Marsh and Roche
(1997):
SET instruments differ in the quality of items, the way the teaching-effectiveness construct is operationalized, and the particular dimensions that are included. The validity and the usefulness of SET information depend on the content and the coverage of the items. Poorly worded or inappropriate items will not provide useful information, whereas scores averaged across an ill-defined assortment of items offer no basis for knowing what is being measured. (p.1187)
16
Learning Theories and Teaching Methods
Teaching behaviors are a reflection of a teacher’s theory of how students learn
(Centra, 1993). For every faculty member, the definition of effective teaching is based on
personal beliefs about how students learn most effectively. Centra in defining the
relationship between teaching effectiveness and a personal theory of student learning,
referenced the approaches and theories identified by Fuhrmann and Grasha (as cited in
Centra, 1993). They suggested three teaching methods that were grounded in three
learning theories. These methods of teaching and the reciprocal theory included the
following: behaviorist approach based on behaviorist theory, collaborative learning based
on cognitive theory, and self-initiated learning based on humanistic theory.
The behaviorist theory indicated effective teaching depended upon the instructor
creating the learning situation. Centra (1993) suggested that student rating forms would
ask students to judge “if course objectives were made clear, if there was agreement
between objectives and course content, and if the instructor accomplished the objectives”
(p. 43-44). Lecture-based courses are an example of a behaviorist approach.
The cognitive theory of learning suggested successful teaching depended upon the
teacher actively involving students in the learning situation to develop their problem-
solving and critical thinking skills. Small group instruction and collaborative learning are
examples of the cognitive approach.
The humanistic theory of learning emphasized learning through “self-initiated
learning or learning through self-discovery….Teachers should be a model of the
behaviors and values that they hope students will develop; they must become learners
along with the students rather than take on the role of expert” (Centra, 1993, p. 44).
17
One approach is not necessarily better than another. Rather effective teaching is a
unique blend of the instructor’s theory of learning with the instructional approach
required for a specific learning situation. In fact, as Centra (1993) suggested, teachers
may operate from multiple theories to accomplish the learning objectives; however, they
tend to subscribe to a learning theory and teach according to that theory.
The student rating forms which are used to evaluate teaching effectiveness need to
reflect the differences in instructional approaches. The evaluation statements on the
student rating forms should be appropriate to measure the teaching behaviors needed to
optimize learning. In addition, the construction of items for the rating forms must
consider the learning environment. The teaching approach often depends on the
intervening variable of the teaching circumstance. Distance learning requires unique
teaching behaviors. Effective teaching in an online environment needs a distinct approach
in order to retain students and promote learning. This is also true in other learning
situations which require teaching behaviors specific to the course or program of study
such as clinical settings, vocational training conditions, internships, etc.
Postsecondary Philosophical and Instructional Changes
Teaching behaviors which are used to define teaching effectiveness are being
redefined. According to Abrami, Theall, and Mets (2001), “Traditional didactic forms of
instruction are being replaced by more learner-centered approaches” (p. 4). This shift
away from the lecture method toward student-centered classrooms may require specific
modifications to student rating forms. For example, student survey items that reflect how
well the instructor’s approach facilitated the learner’s role in the learning process may be
18
more appropriate teaching behaviors for students to assess (Abrami, Theall, & Mets,
2001). This evaluation concept is even more appropriate when applied to the students
who are enrolling in the United States community colleges. Community colleges offer
two-year associate degree programs, certificate programs, and community education
courses. Teachers need teaching behaviors specific to the learning needs of this student
population.
The United States higher education system has experienced a rapid growth in its
community college sector during the last 100 years from the first junior college in Joliet,
Chicago in 1901 to 1173 two-year institutions at the beginning of the twenty-first century
(American Association of Community Colleges, 2004). According to the American
Association of Community Colleges (AACC), community college enrollment is
approximately 10.4 million students with 5.4 million enrolled in associate degree
programs and 5 million students registered in noncredit programs. In contrast to the four-
year colleges and universities, the primary function of community college faculty is
teaching. Miller, Finley, and Vancko (2000) reported that “two-year college instructional
staff members have heavy teaching loads, with four or five sections being the norm and
with classes often averaging twenty to forty students” (p. 3). Miller et al. stated,
“Classroom teaching quality, as judged by student evaluations of two-year and four-year
instructional teaching, is quite similar even with the heavier teaching loads in two-year
colleges” (p. 3). The challenges which are presented to community college teachers
include an emphasis on flexibility in curriculum and instruction. Community colleges
partner with businesses and industries within their communities to meet the changing
needs for a trained workforce. Therefore, it is essential that community college faculty be
19
client-oriented not only to provide the training that is requested by the local community
but also to meet the needs of an older, increasing diverse student population. This client-
centered philosophy is changing the way American educators do the business of teaching
in their classrooms.
Technology has modified the concept of the teaching/learning relationship; the
methods used to promote learning in this environment require new or adaptations to
traditional approaches. Distance learning necessitates a unique definition of teaching
effectiveness for the virtual classroom. Faculty members are modifying teaching
behaviors as the virtual university becomes reality. Asking students to judge teaching
effectiveness for the distance learning classroom may oblige students to modify their
traditional beliefs about the role of the teacher and about their role as the student.
Consequently, for an effective teaching evaluation program that relies on students as a
significant constituency group to evaluate teaching effectiveness, the institution needs a
clearly defined policy of the purpose and process regardless of paper or electronic format
(Theall & Franklin, 2001). Moreover, a successful system of evaluation hinges on the
“acceptance, participation, and cooperation from a number of stakeholders” (Theall &
Franklin, p.51).
A Systems Approach to Evaluation
The data from student ratings serve multiple purposes. Student responses are used
as sources of information about the quality of teaching, to help teachers improve their
teaching, and as evidence for promotion and tenure committees. Other uses for the results
from student ratings include hiring new faculty, in the annual reviews of current faculty,
20
in school accreditation reviews, in selecting teaching award nominees, and in course
assignments (Kulik, 2001). Student ratings have become increasingly popular because
they are easy to administer and provide a quantitative score; however, the data from the
results have been misused (Seldin, 1984; Theall & Franklin, 2001).
In discussing the issue of student ratings, researchers including Abrami, Theall,
and Mets (2001) and Ory (2001) maintained that data from student ratings provide one
important factor in the evaluation of teaching effectiveness. However, faculty
performance in higher education involves more than teaching. Depending upon the
institution, faculty performance also requires research, service to the college, and
professional development. In addition to student ratings, there are other sources to
evaluate teaching effectiveness including teacher self-analysis, peer observations,
supervisor evaluations, and alumni surveys. For these reasons, the data from student
ratings should not be used as the sole evidence of teaching effectiveness.
The research literature indicated an increasing use of student ratings to evaluate
teaching in higher education. This fact has intensified faculty discussions of this method
of evaluation and has encouraged student ratings research. Current researchers
emphasized the vital role that higher education administrators must assume as their
institutions’ develop formal evaluation programs. It is essential that the student ratings
system which is adopted by each institution be accepted, valued, and useful for all
stakeholders. Theall and Franklin (2001) suggested the following guidelines for
developing a comprehensive and effective evaluation system:
1. Establish the purpose of the evaluation and the uses and users of ratings beforehand.
2. Include all stakeholders in decisions about evaluation process and policy.
21
3. Publicly present clear information about the evaluation criteria, process, and procedures.
4. Produce reports that can be understood easily and accurately. 5. Educate the users of ratings results to avoid misuse and misinterpretation. 6. Keep a balance between individual and institutional needs in mind. 7. Include resources for improvement and support of teaching and teachers. 8. Keep formative evaluation confidential and separate from summative decision
making. 9. Adhere to rigorous psychometric and measurement principles and practices. 10. Regularly evaluate the evaluation system. 11. Establish a legally defensible process and a system for grievances. 12. Consider the appropriate combination of evaluation data with assessment and
institutional research information. (p. 52-54) In designing an evaluation system, it is essential that there be a clear distinction in
the purpose of the evaluation and the role of the evaluators. The literature suggested that
the primary issues expressed by some faculty members were their uneasiness about the
students being impartial evaluators and their concern that data were used for personnel
evaluations. Forsyth (2003) recommended that “the audience for the evaluation must also
be considered when designing the feedback system, for the kind of information that will
help instructors improve their teaching may be different from the kind of information that
administrators need to make decisions about salary, promotion, and tenure” (p. 262).
Historical Overview
Student evaluations of teachers in the twentieth century higher education system
most likely began with the publication of the first teacher rating form which was
published by Purdue University in 1927. Centra (1993) and Kulik (2001) indicated that
research in student evaluation of teaching effectiveness originated with Remmers and his
Purdue colleagues beginning in the late 1920s. These early researchers used the Purdue
rating form to investigate the following issues: (a) the relationship of students’ grades to
22
their ratings of teachers, (b) the reliability of student ratings, (c) the comparison between
alumni and student evaluations (Centra, 1993, p. 49).
Centra (1993) framed student evaluations into four phases: (a) the initial
investigations conducted by Remmers and his Purdue University colleagues from 1927 to
1960; (b) the period of voluntary evaluation practice during the 1960s; (c) the era of
validating ratings for formative and summative decisions during the 1970s; and (d) the
present era beginning in 1980 with its increased emphasis on clarifying and expanding
previous research using meta-analyses.
Student ratings research evolved as the use of student ratings on college campuses
became more popular. Prior to the 1960s, student evaluations of teachers were not
customarily done. It was not until the wave of student unrest on college campuses during
the 1960s that students began demanding a stronger voice in the education they were
receiving (Centra, 1993). As a reaction to student discontent, many colleges initiated a
voluntary system of student evaluation. Faculty members managed the process with very
little administrative involvement. Teachers who chose to use the student evaluation
forms generally used the results for personal advisement on teaching practices. Since
college evaluation systems were not well developed, tenure and promotion decisions
were typically automatic (Centra, 1979). Colleges were dealing with expanding
enrollment and needed to maintain faculty. Consequently, results from student ratings
were not systematically included in personnel decisions.
During the 1970s, student evaluations began to play a more important role in
tenure and promotion decisions. Enrollment trends were changing; budgets were
decreasing. These two factors affected faculty hiring and retention practices. Tenure and
23
promotion decisions were no longer automatic. Centra (1979) indicated that teachers had
to prove that they were tenure worthy. Pressure for instructional improvements was
coming from students, parents, and legislators. Teachers in America’s higher education
system were being held to higher accountability pressures. Furthermore, the new era of
increased litigation required that institutions adopt systematic faculty evaluation
processes. Student evaluations of teaching became more formal and centrally controlled
by the institutions. Documentation of teaching effectiveness from sources such as student
ratings became more valued by the administration particularly after research studies
supported that student ratings were valid measures of teaching effectiveness (Centra,
1993). The research of Selden (1999) documented the increased reliance on student
ratings as a measure of effective teaching. Approximately 55% of the 680 liberal arts
colleges that Selden surveyed used student ratings in 1978; the number increased to 88%
of the 598 colleges surveyed in 1998.
Historical trend analyses of the student ratings research by Greenwald (1997)
revealed a surge in ratings research during the period of 1976 to 1980. This coincided
with the increased adoption of formal evaluation of student ratings on college campuses.
Greenwald reported that the number of research publications increased from 21
documents to 71 documents from the previous five-year period of 1971 to 1975. This
represented a 238% increase in studies examining student ratings. During the 25-year
timeframe from 1971 to 1995, research efforts primarily focused on the validity of
student ratings; research studies supported validity more than invalidity (Greenwald,
1997).
24
According to Marsh and Roche (1999), “SETs are one of the most widely
researched systems of personnel evaluation and one of the best in terms of empirical
support for validity and relative freedom from bias” (p. 517). Miller, Finley, and Vancko
(2000) raised the issue that very little of the student ratings research has concentrated on
two-year colleges; however, they maintained that “until studies are performed within the
two-year sector that provide contrary findings, the validity levels of two-year students as
evaluators of faculty performance are assumed to be very similar to those for the four-
year students” (p. 50).
Although the use of student ratings to evaluate teaching effectiveness is standard
practice at most North American higher education institutions, faculty members remain
concerned about the overemphasizes on the importance of the data. Ory (2001) expressed
this concern:
The collection of student ratings is not the only way or the best way but rather one way to evaluate instruction. Our office, as well as other professionals in the field [Braskamp and Ory, 1994; Centra, 1993a; Doyle, 1983; Seldin, 1999], have advocated a multiple-source and multiple-method approach to evaluating teaching effectiveness. The collection of student ratings should be combined with data collected from different sources using various methods, such as peer reviews, teaching portfolios, classroom observations, or self-evaluations. (p. 8)
Status of the Student Ratings Research
Teaching evaluations by students has continued to gain momentum during the last
30 years, not only in the United States, but also in colleges and universities worldwide
(Abrami, Theall, & Mets, 2001). Student ratings became increasingly popular because
college administrators needed a systematic and official method for students to express
their opinions on the quality of teaching. Furthermore, the student rating forms were easy
25
to administer, and the results produced quantitative information which administrators
could use to gauge teaching effectiveness. The ratings data provided teachers formative
feedback which they could apply to enhance their teaching effectiveness. The data served
as a source of information to support personnel decisions regarding the granting of tenure
and the awarding of promotion and salary increases. Although researchers supported the
worth of evaluating teaching, the literature included the researchers’ uneasiness about the
student ratings being used in summative decisions. The weight that student ratings
carried appeared to influence administrative decisions regarding faculty careers. Faculty
response to the use of student evaluations in this manner generated intense controversy;
researchers sought to answer some of the issues teachers raised.
Research in the area of student evaluation of teaching has an extensive literature
base. Centra (2003) stated, “No method of evaluating college teaching has been
researched more than student evaluations, with well over 2,000 studies referenced in the
ERIC system” (p. 495). Much of the research literature concentrated on the issues of the
validity of student ratings and possible biasing factors such as class size, sex, age, and
rank of the teacher. These factors were considered by some faculty to influence student
assessment of teaching effectiveness.
The ideal goal of student evaluations should be to improve the teaching and
learning process. Armstrong (1998) questioned the usefulness of student ratings and
indicted that research has not demonstrated a relationship between the use of student
ratings and improvements in learning. However, according to Centra (1993), student
ratings feedback will improve teaching if four conditions are satisfied: (a) teachers learn
something new and important from the results, (b) faculty value student involvement in
26
the ratings process and accept the feedback, (c) teachers must be able to understand the
results and know how to use the information, and (d) faculty must want to change.
Validity of Student Ratings
The items on student ratings forms are intended to present the qualities which are
essential to teaching for evaluation by students. The topic of early student ratings
research was ratings validity. Researchers sought to determine the extent student ratings
measured instructional effectiveness.
Researchers examined this question through different types of validity studies
including content, criterion, and construct validity. During the 25-year period from 1971
to 1995, there were 172 studies which examined ratings validity: 77 studies favored
validity, 69 studies made no claim on validity, and 26 studies concluded that there were
one or more extraneous factors which contaminated student ratings (Greenwald, 1997).
The research interest in validity studies changed significantly from the late 1970s, when
there were 71 studies done, to the early 1990s, when there were only 8 validity studies
published. Greenwald maintained that it was plausible that the major validity issues had
been resolved and, thus, the decreased emphasis in research on validity.
Researchers studied the validity issue of using student ratings as a measurement
of teaching effectiveness through five different research approaches: multisection,
multitrait-multimethod, bias, laboratory, and dimensionality (Ory & Ryan, 2001).
Multisection validity studies have supported the construct validity of student ratings
(d’Apollonia & Abrami, 1997). In this type of study, multiple sections of a course which
were taught by different instructors used a standard test at the end of the semester.
27
Ideally, all sections used the same textbook and syllabus. The average score on the
student ratings per section was correlated with the average score on a standard test.
d’Apollonia and Abrami (1997) indicated that this multisection validity design, which
was used in more than 40 studies, provided “the most generalizable evidence for the
validity of student ratings” (p. 1200).
Results from a meta-analysis reported by d’Apollonia and Abrami (1997) of 43
multisection validity studies indicated a moderate to large association between student
ratings and student learning. The meta-analysis supported the existence of a relationship
between the student ratings of the teacher’s General Instructional Skill and student
learning; student ratings were measuring a construct of teaching effectiveness.
A single criterion of teaching effectiveness has not been identified. Researchers
have not agreed on an operational definition of teaching effectiveness; however, most
researchers agree that teaching is a multifaceted activity that includes numerous
dimensions of effectiveness. “The most acceptable criterion for good teaching is student
learning. There are consistently high correlations between students’ ratings of the
‘amount learned’ in the course and their overall ratings of the teacher and the course”
(Theall & Franklin, 2001, p. 49). According to Theall and Franklin, this relationship
between ratings and learning provided strong support for the validity of student ratings.
Marsh and Roche (1999) argued that it is difficult to operationalize teaching effectiveness
through objective measures of learning. Attempts to compare teaching effectiveness
based on objective measures between individual teachers in different courses presented
“insurmountable psychometric, design, and logistic problems” (p.517). Marsh and Roche
maintained that effective teaching included other indicators such as “different aspects of
28
learning, competency, and understanding; professional growth; appropriate attitudes; a
sense of mastery; plans to pursue the subject; future coursework selection” (p. 517),
which are factors that cannot be measured by final examination performance. However,
they concluded that multisection validity studies which have operationalized student
learning supported SET validity.
For student ratings to produce valid and reliable data about teaching effectiveness,
Franklin (2001) indicated that the following four elements were essential:
1. Ratings questionnaires must be properly constructed and administered. 2. Ratings data must be summarized in formats that provide readers with
essential information about response rates, frequencies, average or typical (mean or modal) response, information about the spread or dispersion of student responses, and if possible, benchmarks based on a criterion or normative data.
3. Those who will use the data must have the information they need for analysis and interpretation using the reports as provided.
4. The interpretations and conclusions that result must be evaluated and applied in the context of a well-constructed, comprehensive, and effectively implemented system for evaluating teaching. (p. 87)
Franklin (2001) suggested that common problems with student ratings result from bad
data or data “that are potentially misleading or uninformative” (p. 89). This results from
poorly constructed or unsuitable questionnaires, or improperly administered surveys.
Furthermore, problems may occur in data processing, analyses, or reporting. The results
from the student ratings are quickly invalidated if problems exist with the evaluation
procedures.
Overall, student ratings are considered valid measures of teaching effectiveness
and useful in the evaluation process (d’Apollonia & Abrami, 1997; Marsh & Roche,
1997; McKeachie, 1997). Other researchers (Gillmore & Greenwald, 1999), though they
acknowledge student ratings’ validity and their usefulness in giving students the
29
sanctioned opportunity to express their opinions, expressed the need to improve validity
by attending to the possible bias caused by the leniency effect. Gillmore and Greenwald
(1999) contend that the correlation between positive course grades and course ratings
might be “explained by the theory that lenient grading, independently of quality of
instruction, increases student ratings” (p. 518). They recommended using statistical
adjustment to reduce this possible biasing factor.
Ory and Ryan (2001) recognized that multisection validity studies provided some
evidence for the validity of student ratings and that this was supported by “the large body
of research results that revealed few, if any, potentially biasing influences on the rating
process” (p.40). However, Ory and Ryan, in referencing the changing concept of validity
assessment as included in the American Psychological Association revised Standards for
Educational and Psychological Testing, proposed an enhanced research direction for the
validation of student ratings. Ory and Ryan based their suggestion on the assessment of
construct validity as recommended by Messick, who maintained that the traditional
methods of examining validity through content, criterion, and construct studies were
incomplete measures of validation. Messick (1995) indicated that there needed to be a
unified concept for construct validity assessment to include six dimensions: content,
substantive, structural, generalizability, external, and consequential. Two important
consequential aspects that need further research include research on the uses and the
consequences of student ratings data.
Examining the assessment of the validity of student ratings through a revised
conceptual framework as suggested by Messick (1995) may help both the supporters and
critics of SRTs reach similar conclusions. According to Olivares (2003), “…supporters
30
have focused on justifying their conclusions regarding the validity of SRTs; critics have
focused on examining the validity of the inferences…Thus, supporters and critics of
SRTs have focused on research that confirms or supports their own findings” (p. 239).
The validity of any questionnaire depends upon identifying the construct to be
measured, in this case teaching effectiveness, and developing questions that can measure
the construct. Franklin (2001) maintained there must be a relationship between the
questions being asked and the students’ ability to observe and, thus, measure the
construct. With the exception of a few questions, most student ratings questionnaires
provide an acceptable source of data regarding teaching effectiveness (Franklin, 2001).
Reliability of Student Ratings
The reliability of an instrument is generally defined as the consistency, accuracy,
or stability of the measurement results. In regards to student ratings of instructors,
consistency refers to the agreement among students within a class; stability refers to the
agreement among raters judging the same teacher at different times while using the same
evaluation instrument (Braskamp & Ory, 1994). Numerous studies have examined the
reliability of student ratings. Theall and Franklin (2001) summarized the research
literature on student ratings reliability: “Whether reliability is measured within classes,
across classes, over time, or in other ways, student ratings are remarkably consistent” (p.
50). Forsyth (2003) indicated that there was a general agreement in the ratings research
literature concerning the reliability of SETs: “…students’ evaluations of a given
instructor are reasonably stable across different rating forms, times (e.g. mid-term vs.
31
end-of-term rating periods and immediately after class vs. delayed postclass follow-up),
and courses taught in the same year” (p. 263).
Braskamp and Ory (1994) contended that students are a valuable source of
information when they are asked to make judgments on topics such as the following:
1. Student-instructor relationships 2. Their views of the instructor’s professional and ethical behavior 3. Their work load 4. What they have learned in the course 5. Fairness of grading 6. The instructor’s ability to communicate clearly (p. 99)
However, Braskamp and Ory maintained that students are not the appropriate evaluators
for the quality of the course content or the instructor’s expertise in the field. Therefore, it
is critical that faculty assessment instruments be designed to provide the feedback which
students can provide. The results would then be of greater value, and the data which are
provided would be more credible.
Centra (1993) emphasized the importance of the number of students completing
questionnaires for each course and reported that the reliability coefficient increases from
approximately .20 for 1 student rater to above .70 for 10 student raters. The reliability
coefficient increases to above .90 for 25 students. Therefore, the reliability of the student
evaluation instrument increases with the number of student raters in a class. In addition,
the number of students who complete the survey should be a representative sample of the
enrollment for that class. Centra suggested that although 15 students may provide a
reliable measure, the results may not be accurate if less than two-thirds of the class
responded to the survey.
32
If the results from student evaluations were to be used for tenure and promotion
decisions, Centra (1993) stressed that a reliable assessment of a faculty member’s ratings
should be considered not only by the number of student raters per course but also by the
number of courses. Based on their research into the number of courses necessary for there
to be a reliable assessment of student ratings, Gilmore, Kane, and Naccarato (as cited in
Centra, 1993) concluded the following:
…ratings of at least five courses with at least fifteen students rating each one (thus providing a reliable estimate of each) are needed if the rating will be used in administrative decisions. If fewer than fifteen students make the ratings, then more than five courses—preferably ten—should be rated. (p. 58)
Possible Biasing Factors
Although much is known about student ratings, some misconceptions continue.
Some myths have continued to be popular despite the research evidence. Studies have
examined variables that could influence student ratings and, thus, affect the validity of
using SRTs to assess teaching effectiveness. The commonly accepted definition of bias
among researchers refers “to variables that are irrelevant or extraneous to teaching and
affect ratings. Put another way, variables that affect ratings, are beyond the purview of
the teacher, and are not related to the content and teaching of the course…” (Olivares,
2003, p.238).
Theall and Franklin (2001), d’Apollonia and Abrami (1997), McKeachie (1997),
and Marsh and Roche (1997) agreed that research has shown little evidence of bias in
ratings. Furthermore, Ory and Ryan (2001) stated, “What influences have been found can
be controlled or accounted for by the users of student ratings” (p. 40). However, Centra
33
(1993) suggested that ratings interpretation should be made only after considering how
the student, course, or teacher characteristics may affect student ratings. According to
Centra (1993), “Individually, most characteristics do not have an undue influence, but the
combination of several characteristics may” (p. 66). To lessen possible biasing factors,
Centra suggested the importance of considering “several different courses over several
years” (p. 78) when using the data from student ratings for tenure and promotion
decisions.
Some factors which have been researched as potentially affecting student ratings
include the following: student characteristics, course characteristics, and teacher
characteristics. Some of the student characteristics which have been researched for
possible biasing effects include academic ability as measured by grade point average and
age. These factors have shown little relationship to student ratings (Centra, 1993). The
research does not support the myth that good or mature students provide more valid
student ratings than less capable or younger students.
Some of the course characteristics which were studied included factors such as
class size, subject discipline, required versus elective course, time of day, level of
difficulty, and innovation. Research showed class size had almost no effect on student
ratings (Ory, 2001; Lesser & Ferrand, 2000; Centra, 1993). However, some researchers
suggested that student ratings were slightly biased by discipline. Students rated physical
sciences and engineering courses lower than courses in the humanities or social and
behavioral sciences. Furthermore, elective or major field courses were rated slightly
higher by students than required courses. Student ratings were not affected by the time of
day when class was in session. Conversely, Franklin (2001) reported that summer courses
34
received higher ratings than similar courses held during fall or spring term. Seldin (1984)
raised the issue of the frequency of student ratings and the possibility of “evaluation
fatigue” (p. 138) if students were expected to complete evaluations in every course for
each term. A popular myth held by some faculty was the belief that less difficult courses
or courses with less work load were rated higher. Centra (2003) investigated over 50,000
college courses that used the Student Instructional Report II. Results from this research
indicated that “courses were rated lower when they were rated as either difficult or too
elementary. Courses rated at the ‘just right’ level received the highest evaluations”
(Centra, 2003, p. 495). According to Centra,
What these findings indicate is that teachers will receive better evaluations when their courses are manageable for students. In other words, students will view instruction as most effective when it is at their level of preparation and ability rather than too difficult, when the course workload is close to what other courses demand rather than much heavier, and when the pace at which material is covered is about right for them rather than too fast. (p. 515)
Interestingly, teachers who were attempting innovative changes by teaching new or
revised courses often were rated lower than anticipated the first time the course was
offered (Franklin, 2001).
Finally, some of the teacher characteristics which were studied but showed no
significant relationship to student ratings include the gender and the race of the instructor.
Ory (2001) reported that teacher age, rank, years of experience, and research productivity
demonstrated “minimal impact on student ratings” (p. 6).
Greenwald and Gillmore (1997) maintained that ratings were biased by the
leniency effect based on a theory that lenient grading increases student ratings. This issue
created considerable controversy within academia. Edwards (2000) stated, “The existence
35
of grade inflation over the past 30 years has been consistently documented….Chief
among the causes are … an increased use of student evaluations of faculty” (p.538).
However, research does not support a lenient grading bias. Lesser and Ferrand (2000)
conducted research at a Maryland community college on the influence of three factors,
one of which was grades given, on student opinion of instruction. Results from this study
indicated there was no relationship between grades given and student opinion of
instruction ratings; the reported correlation coefficient was .18, with a p value of .113.
Centra (2003) examined the influence of expected final course grades on ratings of
teachers. The study sample included 55,000 classes from 2-year and 4-year colleges.
Results indicated “minimal effect of expected grades on course evaluations” (p. 514).
Centra’s research showed no evidence to support grading leniency. On the contrary,
Centra stated, “In fact, students with higher expected grades gave somewhat lower
evaluations, just the opposite of a grading leniency expectation” (p. 516). However,
McKeachie (1997) discussed the important issue of perceived grade inflation on a
promotion committee’s judgment. If the grading pattern is higher than usual and the
instructor receives strong student ratings, McKeachie maintained that the committee’s
decision may be biased since committee members may suspect grade inflation.
There is no research to support the claim that popularity influenced student ratings
(Theall & Franklin, 2001), nor that the personality of the teacher biased student ratings
(Ory, 2001). “The influence of the personality of a teacher is important but has not been
seen to invalidate or bias student ratings as one piece of evidence in assessing teaching
effectiveness” (Ory, 2001, p. 4). Despite the well-known “Dr. Fox study” (Naftulin,
Ware, & Donnelly, 1973) which has been used by critics to suggest that student ratings
36
were not measuring teaching effectiveness but instructional style, other researchers have
identified numerous methodological errors in this study (Kulik, 2001). Although rating
experts have not supported the claims made by the “Dr. Fox study”, this study
encouraged research in educational seduction—all style, weak content—on student
ratings. Centra (1993) maintained that one generalization learned from seduction research
was that “by teaching more enthusiastically, teachers will receive higher ratings and their
students will retain more of the course content” (p. 77).
Ory (2001) reported that the method of administering SRTs has only a slight
effect on the results. In an overview of two situations that can bias student ratings, Centra
(1993) maintained that whether or not students identify themselves in the ratings may be
a factor if they believe doing so will influence their grades. Another circumstance which
has shown to influence ratings was the presence of the instructor during ratings
administration. In reporting on the research by Feldman, who indicated that ratings were
slightly higher when the instructor was present, Centra (1993) emphasized that a neutral
observer should oversee the administration. Moreover, Seldin (1984) recommended that
survey administration be done during the last two weeks of the semester but not prior to
or during final exams. Some other characteristics that have been researched and the
summary of the findings as reported by Marsh and Roche (1997) included the following:
1. Level of course or year in school: graduate-level courses are rated somewhat more favorably; weak, inconsistent findings suggest upper division courses are rated higher than lower division courses.
2. Purpose of ratings: somewhat higher ratings if ratings are known to be used for tenure-promotion decisions.
3. Administrative conditions: somewhat higher if ratings are not anonymous and the instructor is present when ratings are being completed.
37
4. Students’ personality: mixed findings but apparently little effect, particularly because different ‘personality types’ may appear in somewhat similar numbers in different classes. (Summary of Potential Bias Interpretations)
Dunegan and Hrivnak (2003) examined student cognition or how cognitively
attentive students were to the task of completing the student evaluation of teaching
(SET). Their research suggested that “students might not be completing the SET
instruments as deliberately and mindfully as we would hope” (p. 300). Dunegan and
Hrivnak raised important concerns about deficiencies in the SET process including the
possibility that the procedures may be creating the mindless manner in which students
respond. In offering recommendations to improve the system, the researchers suggested
that “most academic institutions have not been very active in making students feel their
SET input is being used or valued” (p. 299). Improving the value of student ratings for
the students and faculty may reward the institutional effort.
New Directions for Student Ratings Research
Student evaluations offer vital feedback if the teacher is responsive to the student
as an evaluator. A review of the literature indicated that some SRT researchers
recommended that research needed to be done in determining how seriously students
perceived the system of evaluating their instructors. McKeachie (1997) suggested
qualitative research was needed to clarify what students were thinking as they completed
the evaluation forms. Knowing if students were reflecting on their learning experience or
just aimlessly filling out the rating form would provide valuable information that could
lead to improvements in item construction, instrument design, and administration
procedures.
38
Further, additional studies were suggested by Ory and Ryan (2001) to improve
validity. Ory and Ryan stated, “Research is needed to assess how students view the
process and respond to the forms; how faculty administer, interpret, and use ratings to
improve their instruction; and how administrators are using ratings to inform decision
making” (p. 41).
Some researchers (Penny, 2003; McKeachie, 1997) maintained that the use of the
information from student ratings could be improved through training personnel
committees and administrators in the methods of interpreting student ratings for
personnel evaluations. According to Penny (2003), SRT research has not examined the
process used by administrators when they analyze ratings data and judge instructional
effectiveness. Theall and Franklin (2001) suggested that future research examine ways to
improve the knowledge and skills of those who use the data.
Penny emphasized that there needed to be a shift in ratings research “to increase
the practical usefulness of student ratings” (p. 399). If ratings were intended to improve
teacher effectiveness, Armstrong (1998) suggested that the role of the student in the
learning relationship be assessed directly by asking students to respond to questions about
their performance. Armstrong argued that the teaching/learning process was one of
shared responsibility. Only rating the performance of teachers shifted the responsibility
entirely onto the instructor. Including questions on the SRTs that probed student
involvement would strengthen the connection and accountability between the role of
teacher and the role of student. Questions proposed by Armstrong included the following:
“Were you clear about the objectives? Were you well prepared? Were you organized?
39
Did you spend much time on learning tasks? Did you do the assigned work to the best of
your ability? What new concepts and techniques did you master?”
McKeachie (1997) urged research to improve how SRT results were
communicated to improve their utility. Ory and Ryan (2001) encouraged increased
research on the “intended” and “unintended” (p. 39) consequences of the use of student
ratings; such research would improve the validity of student evaluations. Some of the
possible consequences, both positive and negative, of using student ratings identified by
Ory and Ryan included the following:
Intended 1. Instructors collect ratings, value the input, and make improvements in their
teaching and courses.
2. Instructors are rewarded for having excellent rating results (salary, promotion, awards, recognition).
3. Instructors with very low ratings are encouraged by their department to seek help, possibly from colleagues or a campus faculty development office.
4. Students perceive and use ratings as a means for indicating suggestions for improvement.
5. Students have more information on which to base their course selections.
6. Instructors use ratings as motivation to improve their teaching.
7. Students perceive ratings as a vehicle for change.
Unintended 1. Instructors alter their teaching in order to receive high ratings (lower content
difficulty, provide less content, give only high grades).
2. The campus rewards poor teaching (lower faculty standards).
3. Due to their convenience, the campus looks to student ratings as the only measure of teaching quality.
4. The content of the student rating form may determine what is addressed in the classroom.
40
5. Students reward poor teaching by believing they can give high ratings in return for high grades.
6. Ratings are used to make discriminations between instructors that cannot be supported by the data.
7. Due to the high stakes involved, instructors fail to follow proper administration procedures.
8. The rating process becomes a meaningless activity that is performed by students and instructors only because it is mandated. (p. 39-40)
Penny (2003) asserted that a weakness of SRTs was “absence of a common
language on the characteristics that constitutes effective teaching and the absence of a
coherent set of benchmark standards for ratings forms” (p. 402). Penny also indicated
that SRT research has not adequately examined the changing climate in higher education
and its impact on the teaching professional. Finally, some researchers encouraged
research into identifying ways to apply the research findings to the practice of improving
teaching. Ory and Ryan (2001) suggested that “the body of literature supporting the
validity of student ratings needs to be expanded to include studies of how student ratings
are used on today’s campuses and what happens as a result” (p. 41).
Summary
Chapter 2 presented important research findings from the extensive literature on
the phenomenon of relying on students to measure teaching effectiveness in the North
American higher education system. The focus of the literature review was to investigate
major issues that were associated with the practice of students’ formal evaluation of
faculty through a quantitative student ratings system.
41
The chapter was divided into six sections that included an introduction and a
summary. Section two reviewed the traits associated with effective teaching and provided
a conceptual frame to describe the association between teaching approach and a teacher’s
theory of learning. The experts on ratings agreed that identifying a single perfect criterion
of teaching effectiveness is a virtual impossibility. Therefore, student ratings should
primarily function as one source of information on teaching effectiveness since no direct
correlation can be made between ratings and teaching effectiveness. Recognizing this
limitation, SRT researchers emphasized the multidimensionality of teaching and the
importance of defining a teaching-effectiveness construct. This construct must be
properly reflected in the development of student ratings instruments.
Experts suggested that there was not a perfect instrument appropriate for all
teaching situations and cautioned about possible misuse of the student ratings data.
Furthermore, the quality of information from SRTs depended not only on the ratings
instrument but also on the administration procedures. Issues with data processing,
analyses, or reporting could result in data limitations. The section continued by
identifying instructional changes that were affecting postsecondary education such as the
movement away from traditional lecture methods of teaching to an increased focus on
collaborative and distance-learning approaches. Within the context of the changing
instructional environment, it was suggested that traditional student ratings may not be a
suitable method of assessing faculty effectiveness (Braskamp & Ory, 1994). The section
concluded with suggestions for developing an effective evaluation program that
incorporated a student ratings system which must be accepted, valued, and useful for all
stakeholders.
42
The evolution of student evaluation of teaching effectiveness was presented in
section three. From the initial investigations by Remmers in the late 1920s to the present,
the student ratings system has been the most researched method of personnel evaluation.
Researchers of student ratings provided extensive empirical support for ratings validity.
This section also presented the shifting purposes of the student ratings evaluation system.
During the early period of the twentieth century, student evaluations were rarely used in
higher education. It was during the volatile campus climate of the 1960s when students
protested “irrelevant curriculum and uninspired teachers” (Centra, 1993, p. 49) that
institutions began to adopt student ratings. Though the ratings systems were initially
voluntary, institutions gradually began to implement SRTs as a response to accountability
pressures and increased litigation, and by the late 1970s, SRTs became standard practice
at most colleges and universities throughout the United States.
Section four included some of the major research findings associated with student
ratings such as results from the studies on validity, reliability, and possible biasing
factors. According to Centra (1993), “…the research on student evaluations, like that on
other teacher-evaluation methods, shows significant tendencies but no certainties” (p.51).
Although SRTs provided administrators a sanctioned method for students to express their
opinions on the quality of teaching, researchers expressed their concern about the SRT
results being used as the primary source of teaching effectiveness in personnel decisions.
Ratings were considered valid and reliable measures of teaching effectiveness and useful
in the evaluation process but should not be used as the only measure. The research on
student ratings can be summarized by the following statement by Centra (1993):
The reliability measure of student evaluations, in particular, the relative
43
consistency of ratings and their stability over time, are both good, providing that a sufficient number of students rate a course. The validity of student evaluations, as measured by correlations with student learning or comparisons with ratings by trained observers or alumni, is also acceptable. However, the magnitude of the correlations reported in the studies of validity and bias underscores the need to supplement student evaluation information with other sources when assessing teaching. (p. 78-79)
Most experts agreed that research showed little evidence of bias or factors that might
unjustly influence ratings. Bias resulted from factors not related to a teacher’s
effectiveness, but they were factors which may affect student ratings. Through studies on
student, teacher, and course characteristics, some researchers recommended that faculty
and administrators consider the combination of characteristics when reviewing student
ratings results. For example, student ratings tended to be higher in elective courses and
lower in required courses. SRTs given during final exam tended to be lower than ratings
administered prior to finals. Courses in the physical sciences and engineering disciplines
received lower ratings than courses in the humanities or social and behavioral sciences.
Summer courses were rated higher than major semester courses. Courses that students
judged as too easy or too difficult received lower ratings than courses which students
judged as just right which meant the courses were meeting the students’ pace and
workload expectations. These factors and others affected ratings but were not a measure
of the teacher’s effectiveness. Ratings experts advised that it was important that those
reviewing the data be aware of such factors.
Section five presented suggestions from researchers for new research studies to
examine the many issues related to student ratings including ratings validity and utility.
One of the intended consequences of student ratings as discussed by Ory and Ryan
(2001) was the possibility that “students perceive and use ratings as a means for
44
indicating suggestions for improvement” (p. 39). Some researchers suggested that studies
were needed on the effects of ratings particularly since it appeared that the student ratings
trend would continue in the higher education system. Therefore, the significance of this
study was to examine the perceptions that sample groups of Florida community college
students, faculty members, and administrators had of the formal evaluation of faculty by
students and how they believed student ratings data impacted instruction and evaluation.
The study examined the question of the value of SRTs: Is the effort of doing SRTs worth
the institutional investment or is it simply a routine process which has little or no effect
on improving teaching effectiveness?
In the next chapter, the methodology that was used to conduct this research study
is presented.
45
CHAPTER 3
METHODOLOGY
Introduction
Chapter three describes the mixed methodology which guided this study. In
preparing to conduct the phenomenological component of the investigation, the
researcher followed the methodology suggestions outlined by Moustakas (1994). This
chapter reviews the process which was involved in preparing to complete the study
including defining the problem statement and the four research questions. The chapter
continues with an explanation of the data collection procedures including the
identification of the population and sample, and the description of the three research
instruments: survey, interview questionnaire, and researcher. Finally, the chapter presents
the techniques used for organizing, analyzing, and synthesizing the data. A summary
section concludes the chapter.
Statement of the Problem
Colleges and universities have invested time, personnel, and money into the
process of students’ evaluation of faculty through the use of student ratings of teaching.
These data provide one measure of evaluating the quality and effectiveness of instruction.
Despite there being positive uses of the data from student ratings, Ory and Ryan (2001)
noted that there are unintended uses of the data. One example of an unintended
consequence stated by Ory and Ryan was that “the rating process becomes a meaningless
activity that is performed by students and instructors only because it is mandated” (2001,
46
p. 40). Penny (2003) raised the issue that ratings research has been limited due to the
research focus on “issues pertaining to validity and reliability rather than how best to use
student ratings” (p. 399). This research responded to the lack of emphasis on more
effective use of the data for the purpose of improving teaching effectiveness by
questioning the opinions and practices of three stakeholder groups: students, faculty, and
administrators. More importantly, this research raised the question of the value of SRTs:
“Is the effort of doing SRTs worth the institutional investment or is it simply a routine
process which has little or no effect on improving teaching effectiveness?” This core
question satisfied an underlying principle for conducting a phenomenological study.
Namely, the topic had both social meaning and personal significance (Moustakas, 1994).
The researcher’s personal experience with student ratings as a teacher and community
college department chairperson prompted the investigation. The following four questions
guided the research:
1. How did students in Florida community colleges perceive the value of their
role as faculty evaluators?
2. Was there a statistically significant relationship between students’ perceptions
of the relevance or importance of the student survey for evaluating professors
and how students believed the survey results were used?
3. What were the Florida community college faculty member respondents’
perceptions of the student evaluation process and its impact on instruction?
4. What were the Florida community college administrators’ perceptions of the
student evaluation process and its impact on instruction and faculty
evaluation?
47
Population and Sample
Six of the 28 community colleges located in the state of Florida were invited to
participate in the study; this sample of six was chosen based on similarity in enrollment
size to the college with which the researcher was affiliated. Five of the six community
colleges accepted the invitation. The 5 institutions had an annual unduplicated student
headcount enrollment in 2002-2003 between 22,900 and 34,000 (U.S. Department of
Education, National Center for Education Statistics, 2004). These 5 institutions
represented 17.5% of Florida’s public 2-year institutional enrollment of 795,319 during
2002-2003. See Appendix A for a comparison of Florida community colleges by
enrollment size as measured by unduplicated student headcount.
The assistance of the academic vice-presidents from each of the community
colleges was requested to identify the research participants for each of the three sample
groups: students, faculty, and administrators. The student group included a purposeful
sample of students enrolled in second year courses which were identified as sophomore-
level courses beginning with the course number 2. It was assumed that students at this
level had previous experience using the student rating forms. In a memo (Appendix K)
outlining the population sample needs for the study, the researcher asked each academic
vice president to identify from three to five classes that were in session during the
morning, afternoon, and evening. The memo indicated that the researcher would
administer the survey to the students with the faculty member’s permission.
Subsequently, the arrangement for the classroom visits was facilitated by faculty
members who responded to their vice president’s call for participants and who
volunteered to allow their students to participate in the study. Therefore, the original
48
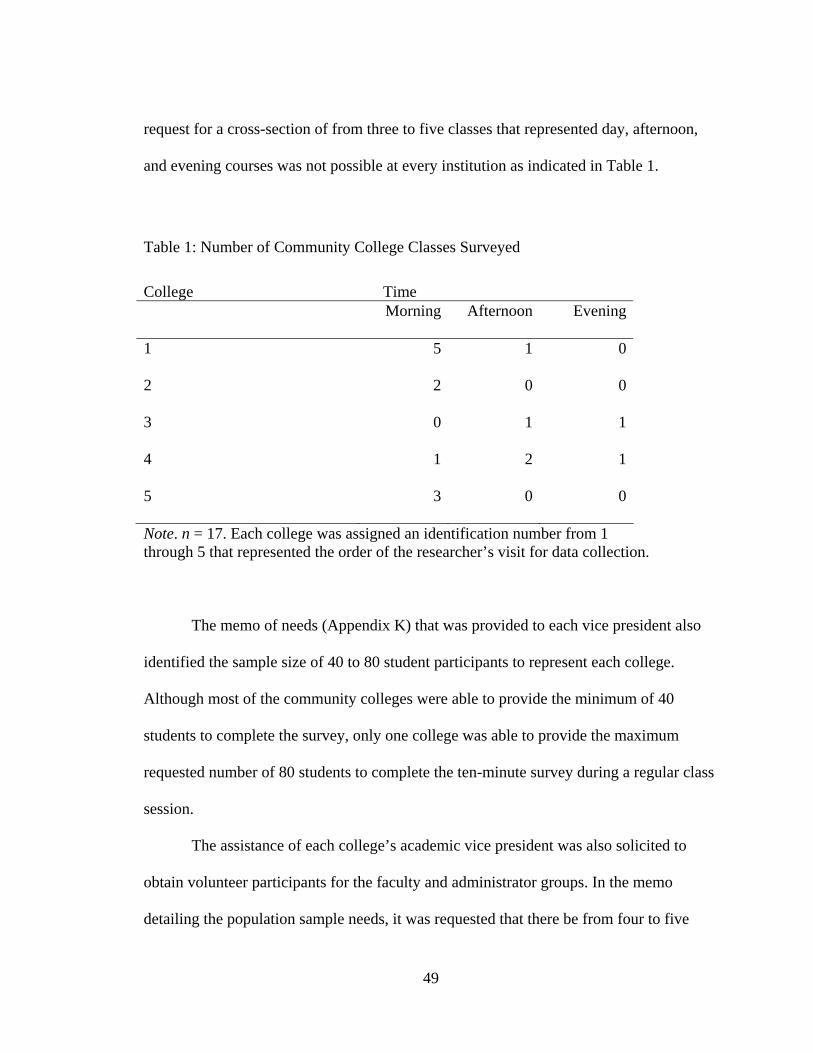
request for a cross-section of from three to five classes that represented day, afternoon,
and evening courses was not possible at every institution as indicated in Table 1.
Table 1: Number of Community College Classes Surveyed
College Time Morning Afternoon Evening
1 5 1 0
2 2 0 0
3 0 1 1
4 1 2 1
5 3 0 0
Note. n = 17. Each college was assigned an identification number from 1 through 5 that represented the order of the researcher’s visit for data collection.
The memo of needs (Appendix K) that was provided to each vice president also
identified the sample size of 40 to 80 student participants to represent each college.
Although most of the community colleges were able to provide the minimum of 40
students to complete the survey, only one college was able to provide the maximum
requested number of 80 students to complete the ten-minute survey during a regular class
session.
The assistance of each college’s academic vice president was also solicited to
obtain volunteer participants for the faculty and administrator groups. In the memo
detailing the population sample needs, it was requested that there be from four to five
49
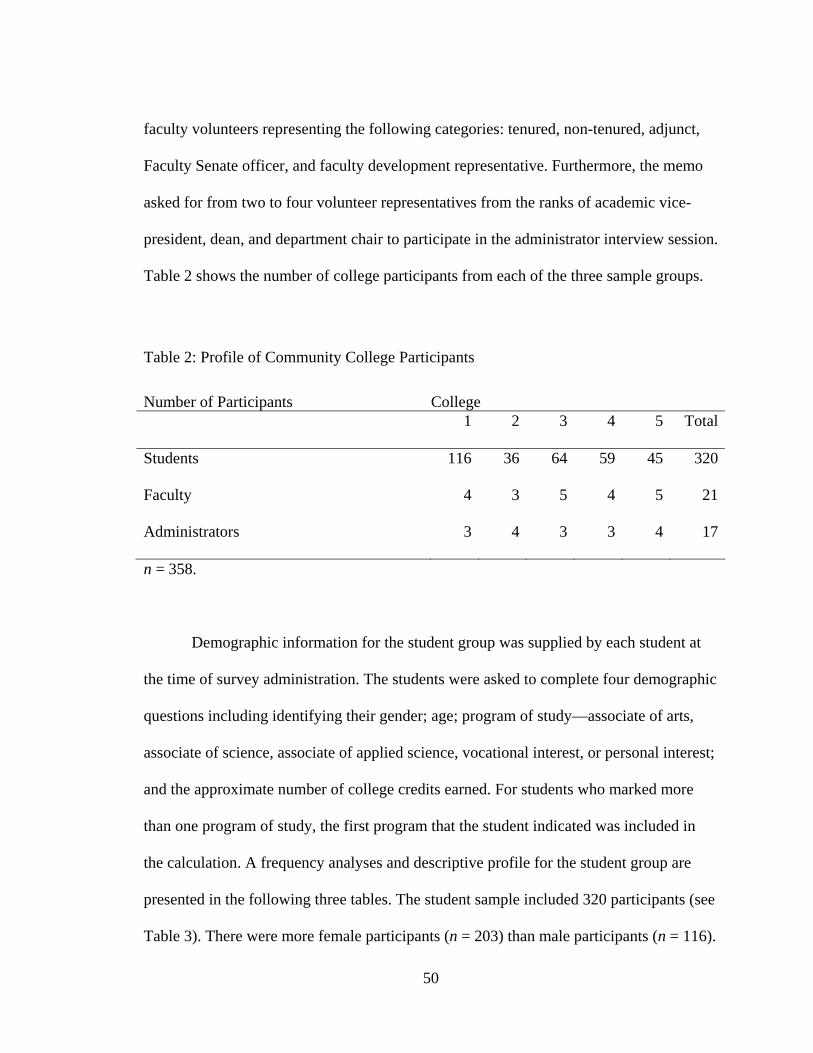
faculty volunteers representing the following categories: tenured, non-tenured, adjunct,
Faculty Senate officer, and faculty development representative. Furthermore, the memo
asked for from two to four volunteer representatives from the ranks of academic vice-
president, dean, and department chair to participate in the administrator interview session.
Table 2 shows the number of college participants from each of the three sample groups.
Table 2: Profile of Community College Participants
Number of Participants College 1 2 3 4 5 Total
Students 116 36 64 59 45 320
Faculty 4 3 5 4 5 21
Administrators 3 4 3 3 4 17
n = 358.
Demographic information for the student group was supplied by each student at
the time of survey administration. The students were asked to complete four demographic
questions including identifying their gender; age; program of study—associate of arts,
associate of science, associate of applied science, vocational interest, or personal interest;
and the approximate number of college credits earned. For students who marked more
than one program of study, the first program that the student indicated was included in
the calculation. A frequency analyses and descriptive profile for the student group are
presented in the following three tables. The student sample included 320 participants (see
Table 3). There were more female participants (n = 203) than male participants (n = 116).
50
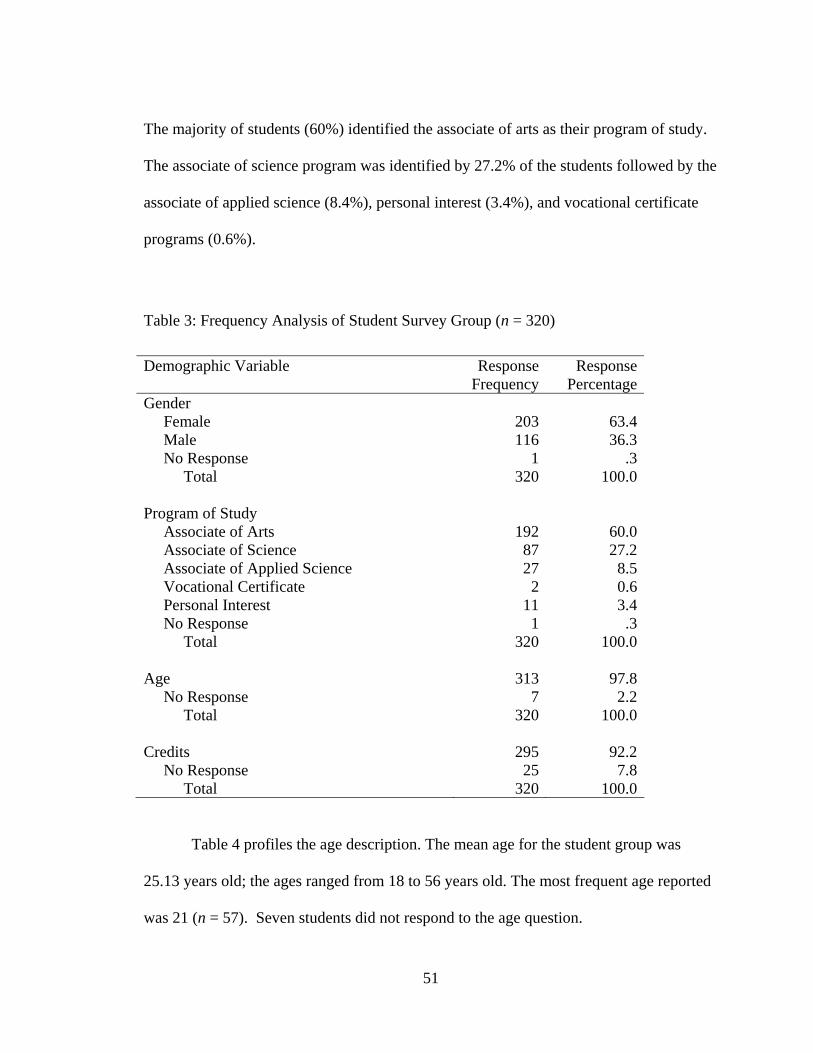
The majority of students (60%) identified the associate of arts as their program of study.
The associate of science program was identified by 27.2% of the students followed by the
associate of applied science (8.4%), personal interest (3.4%), and vocational certificate
programs (0.6%).
Table 3: Frequency Analysis of Student Survey Group (n = 320)
Demographic Variable Response Frequency
Response Percentage
Gender Female 203 63.4 Male 116 36.3 No Response 1 .3 Total 320 100.0 Program of Study Associate of Arts 192 60.0 Associate of Science 87 27.2 Associate of Applied Science 27 8.5 Vocational Certificate 2 0.6 Personal Interest 11 3.4 No Response 1 .3 Total 320 100.0 Age 313 97.8 No Response 7 2.2 Total 320 100.0 Credits 295 92.2 No Response 25 7.8 Total 320 100.0
Table 4 profiles the age description. The mean age for the student group was
25.13 years old; the ages ranged from 18 to 56 years old. The most frequent age reported
was 21 (n = 57). Seven students did not respond to the age question.
51
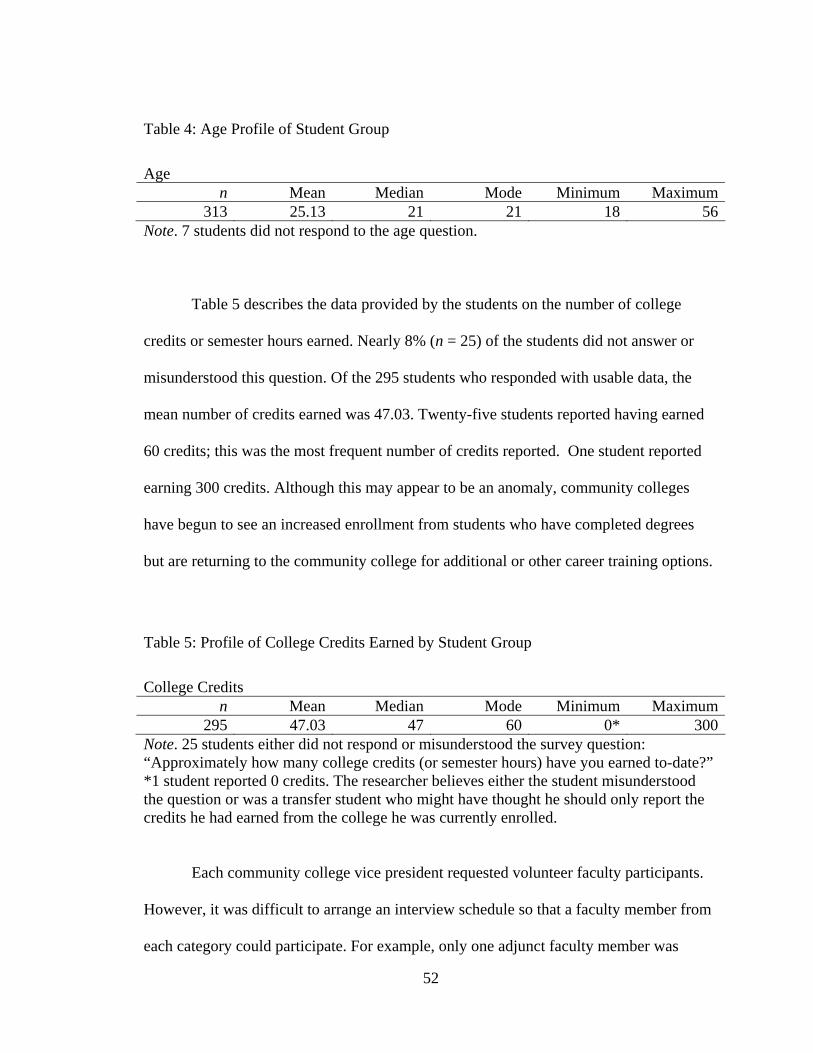
Table 4: Age Profile of Student Group
Age n Mean Median Mode Minimum Maximum
313 25.13 21 21 18 56Note. 7 students did not respond to the age question.
Table 5 describes the data provided by the students on the number of college
credits or semester hours earned. Nearly 8% (n = 25) of the students did not answer or
misunderstood this question. Of the 295 students who responded with usable data, the
mean number of credits earned was 47.03. Twenty-five students reported having earned
60 credits; this was the most frequent number of credits reported. One student reported
earning 300 credits. Although this may appear to be an anomaly, community colleges
have begun to see an increased enrollment from students who have completed degrees
but are returning to the community college for additional or other career training options.
Table 5: Profile of College Credits Earned by Student Group
College Credits n Mean Median Mode Minimum Maximum
295 47.03 47 60 0* 300Note. 25 students either did not respond or misunderstood the survey question: “Approximately how many college credits (or semester hours) have you earned to-date?” *1 student reported 0 credits. The researcher believes either the student misunderstood the question or was a transfer student who might have thought he should only report the credits he had earned from the college he was currently enrolled.
Each community college vice president requested volunteer faculty participants.
However, it was difficult to arrange an interview schedule so that a faculty member from
each category could participate. For example, only one adjunct faculty member was
52
available to participate in the interview sessions. Demographic information for the faculty
group was supplied by each faculty member at the time of survey administration. The
survey was completed by each faculty member at the conclusion of the 90-minute
interview session. As part of the survey, the faculty members were asked to complete six
demographic questions including identifying their gender; faculty employment status—
adjunct or full time; faculty position—non-tenured or tenured; faculty rank—instructor,
assistant professor, associate professor, professor, or senior professor; and area of
primary instruction—college preparatory, associate of arts general education, associate of
science/associate of applied science, vocational certificate, or combination of the above;
and total years teaching in higher education. The demographic profile for the faculty
group is presented in Table 6. The faculty group (n =21) included more female (61.9%)
than male (38.1%) participants. Faculty members were primarily full time (95.2%). One
part time instructor contributed to the study. The majority of teachers indicated that they
were tenured (66.7%). The most frequent rank identified was associate professor
(38.1%). Most of the faculty taught either in the associate of arts general education
programs (38.1%) or the associate of science/associate of applied science programs
(28.6%). The number of years of higher education teaching ranged from 2 years to 31
years (M =16.48).
53
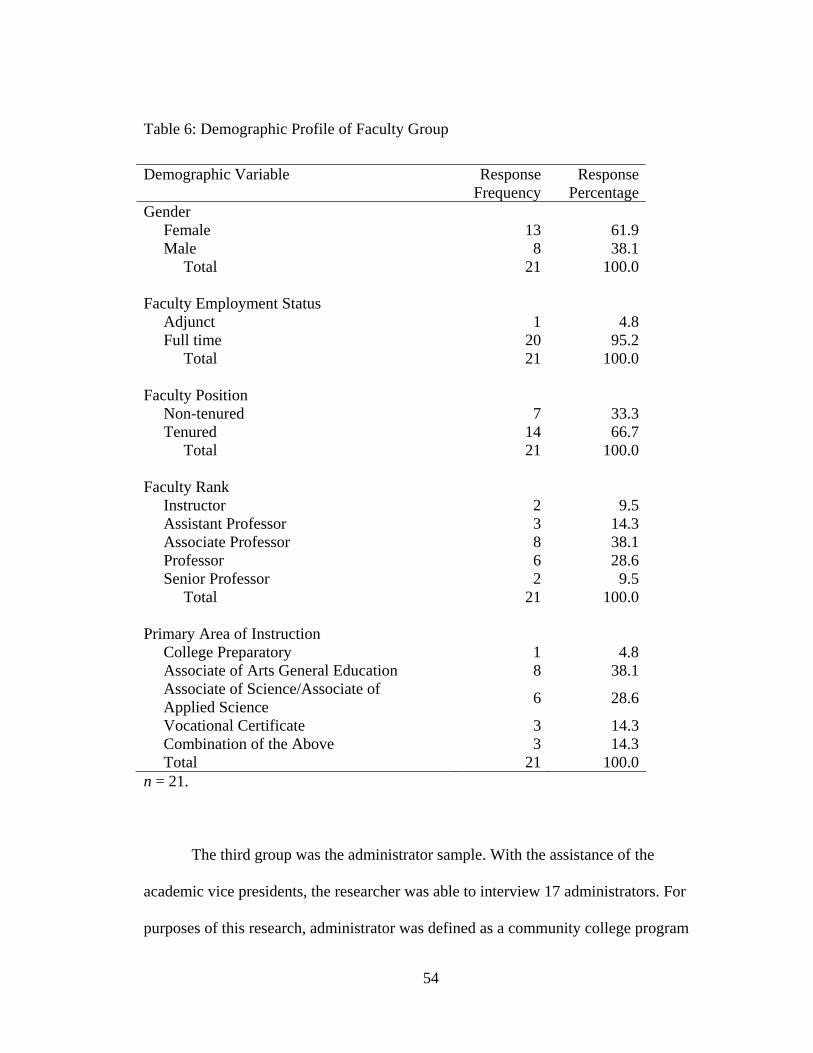
Table 6: Demographic Profile of Faculty Group
Demographic Variable Response Frequency
Response Percentage
Gender Female 13 61.9 Male 8 38.1 Total 21 100.0 Faculty Employment Status Adjunct 1 4.8 Full time 20 95.2 Total 21 100.0 Faculty Position Non-tenured 7 33.3 Tenured 14 66.7 Total 21 100.0 Faculty Rank Instructor 2 9.5 Assistant Professor 3 14.3 Associate Professor 8 38.1 Professor 6 28.6 Senior Professor 2 9.5 Total 21 100.0 Primary Area of Instruction College Preparatory 1 4.8 Associate of Arts General Education 8 38.1 Associate of Science/Associate of Applied Science 6 28.6
Vocational Certificate 3 14.3 Combination of the Above 3 14.3 Total 21 100.0 n = 21.
The third group was the administrator sample. With the assistance of the
academic vice presidents, the researcher was able to interview 17 administrators. For
purposes of this research, administrator was defined as a community college program
54
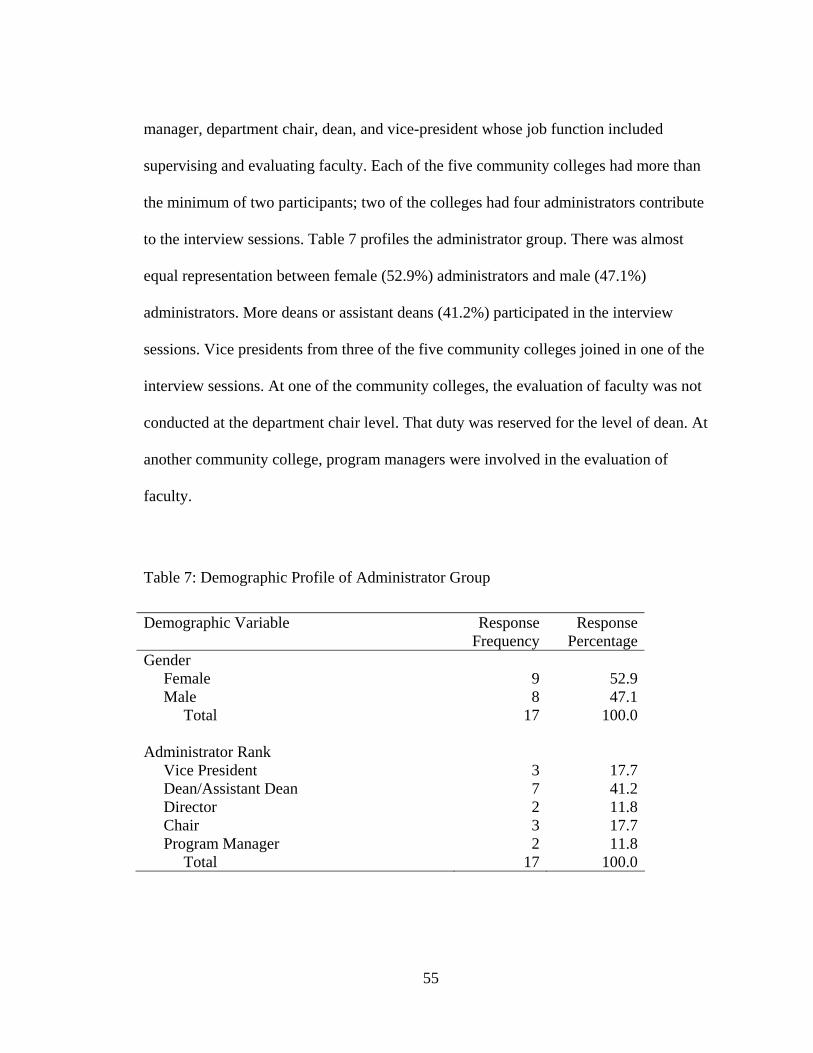
manager, department chair, dean, and vice-president whose job function included
supervising and evaluating faculty. Each of the five community colleges had more than
the minimum of two participants; two of the colleges had four administrators contribute
to the interview sessions. Table 7 profiles the administrator group. There was almost
equal representation between female (52.9%) administrators and male (47.1%)
administrators. More deans or assistant deans (41.2%) participated in the interview
sessions. Vice presidents from three of the five community colleges joined in one of the
interview sessions. At one of the community colleges, the evaluation of faculty was not
conducted at the department chair level. That duty was reserved for the level of dean. At
another community college, program managers were involved in the evaluation of
faculty.
Table 7: Demographic Profile of Administrator Group
Demographic Variable Response Frequency
Response Percentage
Gender Female 9 52.9 Male 8 47.1 Total 17 100.0 Administrator Rank Vice President 3 17.7 Dean/Assistant Dean 7 41.2 Director 2 11.8 Chair 3 17.7 Program Manager 2 11.8 Total 17 100.0
55
Instrumentation
The study consisted of two mixed methodologies: survey and phenomenological
research. The researcher chose a mixed methods approach to study the issue of the value
of student ratings using the opinions of those involved in the practice of either completing
a student ratings form, or reviewing and using the information. To examine and
understand the phenomenon or the meaning of the experience of student ratings for each
stakeholder group (students, faculty members, and administrators), the researcher became
one of the three instruments for data collection. The other instruments for data collection
were surveys and interview questionnaires. The researcher believed it was important to
meet with each of the participating groups in their college environment to obtain an
objective sense of their perceptions regarding student ratings. In administering the
surveys to the student and faculty groups, the researcher presented herself as a student
engaged in research. By personally inviting each student and teacher to respond to the
survey and by reinforcing the importance of the study, the researcher became an
instrument which complemented the survey administration. Prior to engaging the teachers
and administrators in a discussion on the topic of student ratings, the researcher
consciously set aside preconceived ideas or prejudices concerning the value of student
ratings; Moustakas (1994) refers to this practice as the Epoche process. It is a vital first
step in conducting phenomenological research. It allowed the researcher to perceive and
understand the phenomenon, in this case—the value of student ratings, through the
experiences of others. The researcher then became an instrument to collect the thoughts
and words of those individuals who had volunteered to share their experiences.
56
The principles for survey design recommended by Dillman (1999) guided the
survey and questionnaire formation. The survey was used to collect quantitative data
from the student and faculty groups, while interview questionnaires were developed as a
tool to gather descriptions of the essence or value of student ratings from the faculty and
administrator groups. The researcher developed the Grading Faculty survey (Appendixes
F & G) to be administered to the student and faculty groups and the two interview
questionnaires (Appendixes D & E) to be used with the faculty and administrator groups.
The items for the survey and questionnaire instruments were based upon a review of the
student ratings literature. The interview questions were used to encourage the participants
to discuss and describe their personal experiences involving the student ratings practice.
Two forms of the Grading Faculty survey were used: one for the student group
and another for the faculty group. Each of the 2 forms shared the same 15 statements
which were designed to measure 3 dimensions: attitudes toward faculty evaluation,
perceived relevance or importance of the student survey for evaluating faculty members,
and perceived effects of the ratings evaluation. The 15 statements asked the students and
faculty members to indicate the extent to which they agreed with the 15 perception items
using a 5-point scale ranging from strongly disagree (1) to strongly agree (5). There was
additional space on the survey form for participants to add opinions concerning student
ratings. However, the two survey forms differed in demographic questions. Demographic
questions were modified to be appropriate for the participating groups. For example, the
students were asked to complete four demographic questions including identifying their
gender; age; program of study—associate of arts, associate of science, associate of
applied science, vocational interest, or personal interest; and the approximate number of
57
college credits earned. Faculty participants were asked to complete six demographic
questions including identifying their gender; faculty employment status—adjunct or full
time; faculty position—non-tenured or tenured; faculty rank—instructor, assistant
professor, associate professor, professor, or senior professor; area of primary
instruction—college preparatory, associate of arts general education, associate of
science/associate of applied science, vocational certificate, or combination of the above;
and the total number of teaching years in higher education.
The two interview questionnaires each contained nine items; four of the items
were identical. Six of the items were open-ended questions. The items for the
questionnaires were designed to evoke personal descriptions and experiences. The
researcher sought to create a relaxed environment where colleagues could share with one
another openly and honestly. The ten interview sessions and the two questionnaires were
the tools that were used to collect the data on the value of student ratings for the faculty
and administrator groups for the phenomenological segment of the study.
Instrument Validity and Reliability
The Grading Faculty survey (Appendixes F & G) measured perceptions that
students and teachers have of the student ratings evaluation method and how they
believed the student ratings data impacted instruction and teacher evaluation. To
determine the content for the Grading Faculty survey, the researcher reviewed the student
ratings literature and developed the survey items. Fifteen statements were drafted using
three construct categories: attitudes toward faculty evaluation, students’ perceptions of
the relevance or importance of student ratings for evaluating faculty, and how students
58
believed the survey results were used. These statements were then read and discussed by
four community college professionals including two teachers and two administrators.
Adjustments to the wording of the statements were made according to their suggestions,
and demographic questions were added. “When checking content validity, the test
construction alone and with the aid of others judges the extent to which the test items
present a representative sample of the universe of the content that the test is designed to
measure” (Van Dalen, 1966, p. 314).
During August 2004, the Grading Faculty survey was tested and administered to
42 undergraduate community college students. In the current study, 320 community
college students completed the survey. Based on these responses from the student sample
and data analysis software SPSS, Version 11.5 (SPSS, 2002), the dimensionality of the
15 items from the Grading Faculty instrument was analyzed using maximum likelihood
factor analysis. “Factor analysis is a technique used to identify factors that statistically
explain the variation and covariation among measures….A common use of factor
analysis is to define dimensions underlying existing measurement instruments” (Green &
Salkind, 2005, p. 312-313). The decision to rotate three factors using a Varimax rotation
procedure was based on the scree plot of the eigenvalues. The three factors accounted for
44.16% of the variable variance. The first factor, importance of student ratings, accounted
for 15.02% of the variance of the 15 variables. The second factor, effects of student
ratings, accounted for 14.80% of the variance; the third factor, beliefs about student
ratings, accounted for 14.34% of the variance. Therefore, based on the factor analysis,
the Grading Faculty instrument is a valid measure of the three constructs under
investigation. Factor analysis confirmed the construct validity of the survey.
59
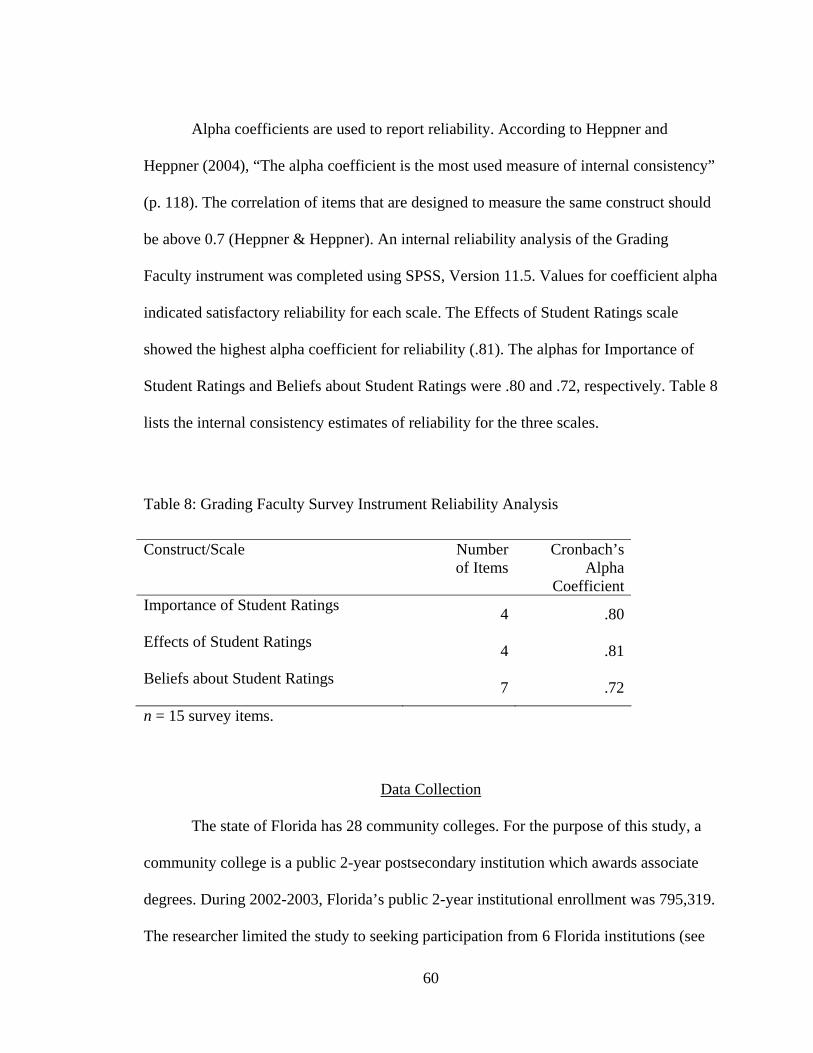
Alpha coefficients are used to report reliability. According to Heppner and
Heppner (2004), “The alpha coefficient is the most used measure of internal consistency”
(p. 118). The correlation of items that are designed to measure the same construct should
be above 0.7 (Heppner & Heppner). An internal reliability analysis of the Grading
Faculty instrument was completed using SPSS, Version 11.5. Values for coefficient alpha
indicated satisfactory reliability for each scale. The Effects of Student Ratings scale
showed the highest alpha coefficient for reliability (.81). The alphas for Importance of
Student Ratings and Beliefs about Student Ratings were .80 and .72, respectively. Table 8
lists the internal consistency estimates of reliability for the three scales.
Table 8: Grading Faculty Survey Instrument Reliability Analysis
Construct/Scale Number of Items
Cronbach’s Alpha
Coefficient Importance of Student Ratings 4 .80
Effects of Student Ratings 4 .81
Beliefs about Student Ratings 7 .72
n = 15 survey items.
Data Collection
The state of Florida has 28 community colleges. For the purpose of this study, a
community college is a public 2-year postsecondary institution which awards associate
degrees. During 2002-2003, Florida’s public 2-year institutional enrollment was 795,319.
The researcher limited the study to seeking participation from 6 Florida institutions (see
60
Appendix A) that had an annual unduplicated student headcount enrollment in 2002-2003
between 22,900 and 34,000 (NCES, 2004). These colleges were similar in enrollment
size to the college with which the researcher was affiliated.
In early October 2004, a notification letter (Appendix B) was sent to each of the
six community college presidents and academic vice presidents notifying them of the
research project. One week later, a second letter (Appendix C) was mailed to the six
community college presidents and academic vice presidents. The second letter provided
additional information on the research project and requested the college’s participation.
A follow-up phone call to each academic vice president was made one week later. Each
of the six vice presidents seemed interested in the project. Several indicated that their
college had been studying the issue of student ratings. Two of the vice presidents
requested that they be contacted again in January to discuss the research project. Two
agreed to participate immediately while another vice president requested a delay. Only
one of the six colleges did not participate. Several follow up attempts were made to this
college, but there was no response from the phone calls or E-mails. Subsequently,
campus visits to the five colleges for the purpose of data collection were conducted from
November 2004 to February 2005.
Prior to the campus visit, each vice president was E-mailed a description outlining
the project needs (Appendix K). The memo sought the vice president’s assistance with
arranging a date to visit, identifying three to five classes for survey administration,
arranging the faculty small-group interview session, arranging the administrator small-
group interview session, and providing a list of participants’ campus addresses. The
memo also described the desired sample population including the request for 40 to 80
61
students from sophomore level classes; 4 to 5 faculty volunteers from the categories of
tenured, non-tenured, adjunct, Faculty Senate officer, and faculty development
representative; and 2 to 4 administrator volunteers from the ranks of academic vice
president, dean, and department chair.
Once the vice president provided the names and address of the faculty and
administrator participants, each volunteer was mailed the appropriate letter of consent
(Appendixes I & J) and interview questionnaire (Appendixes D & E) before the campus
visit. However, in one instance, the consent letter and interview questionnaire were not
mailed. There was not enough time between the date for the visit and mail delivery.
Therefore, each of those volunteers was provided the material at the time of the interview
session.
Data were collected from personal distribution of the Grading Faculty survey
(Appendix F) by the researcher to the student groups. Faculty members volunteered their
class after being notified by their college administrators about the project. A schedule for
classroom visits was arranged to coincide with the faculty and administrator interview
sessions. The surveys were administered at a time designated by the teacher; typically, it
was done at the beginning of class. Each survey administration began with the researcher
reading to the students the College Classroom Participant Verbal Consent (Appendix H).
The classroom survey administrations were usually completed in less than 15 minutes.
Five community colleges participated in the student survey administrations. Seventeen
classes which represented 320 students completed the Grading Faculty survey. For the
purposes of this research, each college was assigned a number which coincided with the
order of campus visits. For example, College 1 was the first college where the researcher
62
visited; College 2 was the second college that was visited, etc. This number was used to
code all surveys, interview questionnaires, and audio tapes. To facilitate data collection
and analyses, numbers were placed on each survey which identified the college, class,
and anonymous student. For example, the first class surveyed at College 1 was coded as
11.01—College 1, Class 1, and Student 1. Another example of this coding was 53.10
which would represent College 5, Class 3, and Student 10.
Interview meetings, a commonly used qualitative method, were conducted with
the faculty and administrator groups in separate ninety-minute focus sessions at a location
determined by the five institutions; each session was audio taped for later transcription by
the researcher. There were five faculty groups which ranged from three to five faculty
participants, a total of 21 teachers participated in the interview sessions. There were 5
administrator groups which ranged from 3 to 4 participants; a total of 17 administrators
participated in the interview meetings. The interview sessions were usually held in a
conference room or classroom. Following introductions and the collection of the
informed consent letters, the researcher briefly reviewed the purpose of the investigation,
confirmed participants’ willingness to be audio taped, and presented each participant with
a list of the questions to be used as a reference. The questionnaires had previously been
mailed along with the informed consent letters to each participant with one exception for
one group. That group received the consent letter and questions at the time of the
interview. The questionnaires (Appendixes D & E), which were developed to elicit
specific as well as open-ended responses regarding participants’ experiences with student
ratings, guided but did not limit the discussions. At the end of the faculty interview
sessions, faculty members completed the Grading Faculty (Appendix G) survey. To
63
facilitate data collection and analyses, a number was placed on each faculty survey which
identified the college, class, and anonymous teacher. This coding was similar to the
coding used for the student group. An example of a coded faculty survey is 4.03 which
represented College 4, Teacher 3. Creswell (1998) offered several suggestions to enhance
field research; these suggestions were most helpful in facilitating the interviewing
process.
A few days after each campus visit, the researcher sent each college vice
president, faculty member, and administrator a personalized note of appreciation for
his/her contribution to the research project.
Data Analysis
The mixed methodology which was used to conduct this research required
different data analysis measures. The survey data were analyzed using descriptive and
inferential statistics to address Research Questions 1 and 2. The phenomenology methods
and procedures outlined by Moustakas (1994) were used to analyze the transcribed
interviews and to develop a composite textural-structural statement to address Research
Questions 3 and 4. In addition, inferential statistics were used in Research Question 3 to
test the hypothesis that there was no statistically significant difference between the total
mean survey responses between the student group and the faculty group.
Data from the 320 student surveys and the 21 faculty surveys were manually
entered into the SPSS, Version 11.5 software program for data analysis. Each survey
entry was checked twice by the researcher. Missing data were not included in the
calculations. The most common missing information was a demographic question on the
64
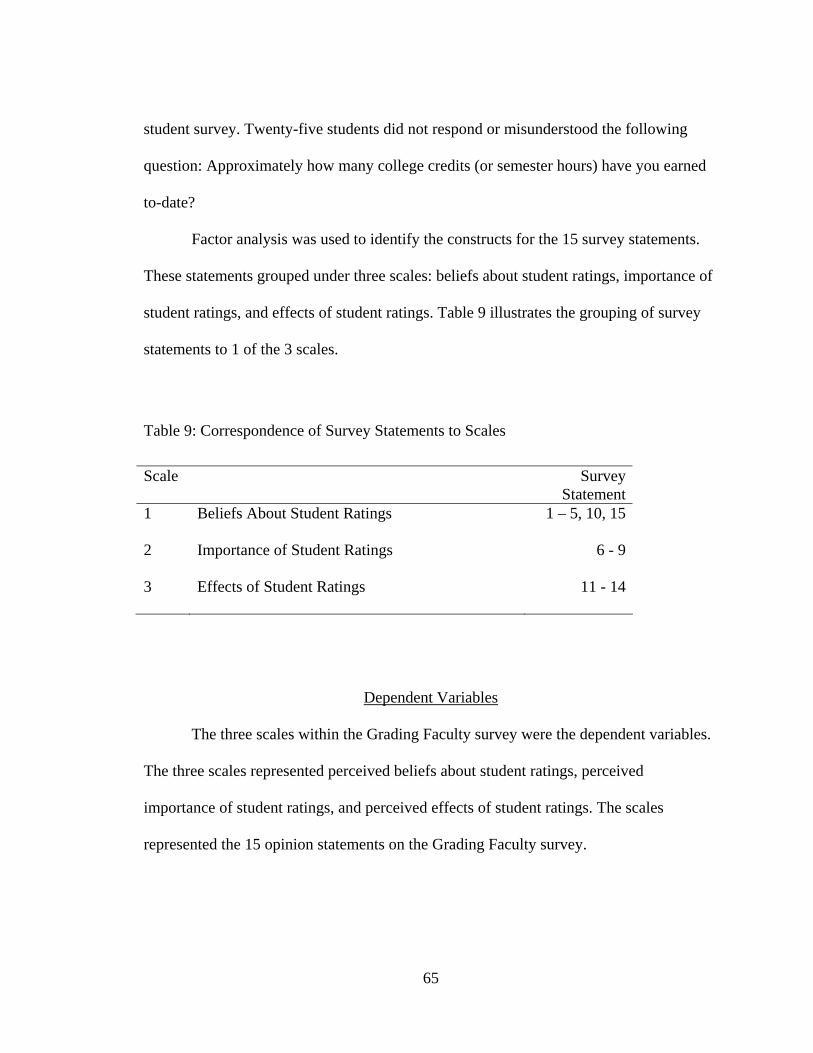
student survey. Twenty-five students did not respond or misunderstood the following
question: Approximately how many college credits (or semester hours) have you earned
to-date?
Factor analysis was used to identify the constructs for the 15 survey statements.
These statements grouped under three scales: beliefs about student ratings, importance of
student ratings, and effects of student ratings. Table 9 illustrates the grouping of survey
statements to 1 of the 3 scales.
Table 9: Correspondence of Survey Statements to Scales
Scale Survey Statement
1 Beliefs About Student Ratings 1 – 5, 10, 15
2 Importance of Student Ratings 6 - 9
3 Effects of Student Ratings 11 - 14
Dependent Variables
The three scales within the Grading Faculty survey were the dependent variables.
The three scales represented perceived beliefs about student ratings, perceived
importance of student ratings, and perceived effects of student ratings. The scales
represented the 15 opinion statements on the Grading Faculty survey.
65
Independent Variables
The demographic characteristics reported by the students were the independent
variables. The student variables were gender, age, program of study, and college credits
earned.
Research Question 1
Survey questions 1-5, 10, and 15 addressed Research Question 1: How do
students in 5 Florida community colleges perceive the value of their role as faculty
evaluators? These survey items reflected the scale of students’ Beliefs about Student
Ratings. The students rated the 7 statements on a scale of 1 to 5 (1 = strongly disagree,
2 = disagree, 3 = neither agree nor disagree, 4 = agree, and 5 = strongly agree). First,
frequency analyses were completed for the seven survey items describing this dimension.
Median and mode scores were reported since these two scores are appropriate measures
of central tendency for ordinal data (Lomax, 2001). Next, students’ responses from the
seven statements were categorized according to perceived value to describe a composite
variable, Beliefs about the Value of Student Ratings. Descriptive measures of frequency,
percentage, and scale median were used to describe the students’ perceived value of
student ratings. Finally, an analysis of variance (ANOVA) was used to determine if there
were any significant differences between the scale mean for the seven beliefs underlying
Scale 1, Beliefs about Student Ratings (dependent variables), and the student
demographic characteristics (independent variables) of gender and program of study.
Simple linear regression was conducted to evaluate how well the Beliefs Scale mean
score (criterion) could be predicted from student age and total credits earned (predictors).
66
Research Question 2
Inferential and descriptive statistics were used to address Research Question 2: Is
there a statistically significant relationship between students’ perceptions of the relevance
or importance of the student survey for evaluating faculty and how students believe the
survey results are used? First, a Pearson product-moment correlation coefficient was
computed to assess the degree that the total score from the Importance of Student Ratings
Scale and the total score from the Effects of Student Ratings Scale were related. The sum
of the data from the 4-item Importance of Student Ratings Scale was compared to the
sum of the data from the 4-item Effects of Student Ratings Scale to provide a measure of
the relationship between perceived importance and perceived effects of student ratings.
Next, Spearman’s rho was used to calculate the degree of correlation among the variables
within each set and then between the variables of each set of ranked data. Spearman’s rho
was the appropriate measure to show the possible relationship among the variables on the
two scales. In addition, descriptive analysis was completed for the eight factors
describing these two dimensions. Furthermore, students’ responses for each scale were
categorized according to perceived value to describe two composite variables, Perceived
Value of the Importance of Student Ratings and Perceived Value of the Effects of Student
Ratings. Finally, the additional written comments which were provided by the students
were analyzed and described. Each response was evaluated and coded into one of the
three survey scales: Beliefs about Student Ratings = 1, Importance of Student Ratings =
2, and Effects of Student Ratings = 3. Comments not related to one of these scales were
included in a separate category: General Comments = 4. Once the scale category was
determined for each comment, the comments were again analyzed and assigned a second
67
code. This code reflected the student’s perceived value of student ratings as follows: no
value = 1, uncertain value = 2, and value = 3.
Research Questions 3 and 4
Research Question 3, what are the community college faculty member
respondents’ perceptions of the student evaluation process and its impact on instruction,
and Research Question 4, what are the community college administrators’ perceptions of
the student evaluation process and its impact on instruction and faculty evaluation, were
analyzed using one of the phenomenology analysis processes outlined by Moustakas
(1994). The Moustakas method which was used to organize and analyze the faculty and
administrator transcripts was his modification of the Stevick-Colaizzi-Keen
phenomenological data analysis method (Moustakas, 1994). One adjustment to the
Moustakas method was made. The Moustakas approach included an analysis of the
verbatim description for each respondent. Since this study involved small focus groups in
two categories, faculty and administrators, the analysis of each transcript reflected not
one individual’s experience but each separate college group’s experience with student
ratings.
First, the interview tapes were transcribed verbatim. Next, all relevant statements
which pertained to Research Questions 3 and 4 were listed. It is important to note that
only statements from the faculty group applied to Research Question 3, and only
statements from the administrator group applied to Research Question 4. These
statements were the “invariant horizons or meaning units of the experience” (Moustakas,
1994, p. 122). Then, these invariant meaning units were clustered into themes. From
68
these themes, a textural description was constructed for each of the five faculty groups
and each of the five administrator groups. Next, through a process that Moustakas
referred to as imaginative variation, a structural description was constructed for each
group. This analysis step examined the dynamics underlying the experience of student
ratings for the participants. From the five textural descriptions and the five structural
descriptions for each college, a composite textural description and a composite structural
description were developed. Finally, a synthesis of the composite textural and composite
structural descriptions of the student ratings experience which represented the essence or
value of student ratings for each group was presented. This statement reflected a
descriptive summary of the analysis regarding the participants’ perceptions of student
evaluations. In addition, inferential statistics were used in Research Question 3 to test the
null hypothesis that there was no statistically significant mean difference between the
survey responses by the student group and the faculty group.
Summary
The phenomenon of enlisting students to rate teachers’ effectiveness within the
higher education system has been studied extensively and primarily through quantitative
research. Although researchers examined many variables, some researchers suggested
that there needed to be more studies on students’ attitudes (Centra, 1993). Ory and Ryan
(2001) postulated that an unintended outcome of the student ratings practice is that it
might become an inconsequential activity that is simply done as part of an institutional
directive.
69
This research studied the perceptions that 358 Florida community college
students, faculty, and administrators held in regards to the student ratings practice.
Perceptions about the value of student ratings were examined by employing both
quantitative and qualitative methods. Participants’ attitudes and opinions were analyzed
and presented in Chapter 4.
70
CHAPTER 4
ANALYSIS OF DATA
Introduction
Chapter 4 presents the results from the data analyses of the responses for the four
research questions using both quantitative and qualitative methods. Data analyses
included responses to the Grading Faculty survey and two questionnaires produced by the
researcher using the principles for survey design recommended by Dillman (1999). Each
survey statement and interview question was designed to measure participants’ opinions
of student ratings and how they believed the data from student ratings influenced
instruction and teacher evaluation. The purposes of this research were to: (a) assess
community college students’ perceptions of the student evaluation practice; (b) assess
community college faculty members’ responses to student evaluations of teachers and the
extent to which instructional modifications result from student ratings; and (c) assess
community college administrators’ responses to student evaluations of teachers, the
extent student ratings influence administrators’ evaluations of faculty, and how the results
from student ratings are used to promote instructional effectiveness. This research posed
the core question of the value of SRTs: Is the effort of doing SRTs worth the institutional
investment or is it simply a routine process which has little or no effect on improving
teaching effectiveness?
71
Description of Sample Population
Six of the 28 community colleges located in the state of Florida were invited to
participate in the study; this sample of 6 was chosen based on similarity in student
enrollment to the college with which the researcher was affiliated. Five of the six
community colleges accepted the invitation. The 5 institutions had an annual
unduplicated student headcount enrollment in 2002-2003 between 22,900 and 34,000
(U.S. Department of Education, National Center for Education Statistics, 2004). These 5
institutions represented 17.5% of Florida’s public 2-year institutional enrollment of
795,319 during 2002-2003. See Appendix A for a comparison of Florida community
colleges by enrollment size as measured by unduplicated student headcount.
A total of 358 participants from the 5 Florida community colleges contributed
their opinions on the value of student ratings of teaching. The assistance of the academic
vice-presidents from each of the five community colleges was requested to assist the
researcher in scheduling an on-site visit and in identifying research participants for each
of the three sample groups: students, faculty, and administrators. The student sample
consisted of 320 participants, more than half were female (n = 203), while the rest were
male (n = 116). One student did not identify gender. During fall 2004 and spring 2005,
students responded to the survey (Appendix F) which was administered by the researcher
during 1 of 17 class administrations. The faculty sample consisted of 21 faculty members
who participated in 1 of the 5 small group interview sessions. Each interview session was
conducted on location at the respective participating community college. Each faculty
group consisted of between three to five teachers. The most represented faculty category
was tenured at the rank of associate professor. Following the interviews, each faculty
72
member also completed the survey (Appendix G). The surveys were identical for both the
student and faculty groups with the exception of the demographic questions. The
administrator sample consisted of 17 administrators who volunteered to join in 1 of the 5
small focus interview sessions. Each interview session was conducted on location at the
respective participating community college. Each administrator group consisted of
between three to four administrators. The most frequent rank of administrator participant
was at the level of dean or assistant dean. Responses to the surveys and questionnaires are
considered to be trustworthy for all 358 volunteers. For complete demographic
descriptions of the 3 sample groups, see Chapter 3, Tables 2 through 7.
Research Question 1
How did students in Florida community colleges perceive the value of their role
as faculty evaluators? For this study, the definition of value referred to students’ beliefs
about the usefulness, importance, or general worth of the SRT practice. Students
responded to 15 survey items which measured their opinions on the practice of formal
evaluation of their college teachers. The students rated the statements on a scale of 1 to 5:
(1 = strongly disagree, 2 = disagree, 3 = neither agree nor disagree, 4 = agree; and 5 =
strongly agree). Factor analysis was used to identify the dimensions underlying the 15
survey statements. The dimensionality of the 15 items was analyzed using the maximum
likelihood estimation procedure to extract the factors from the variable data. The decision
to rotate three factors using a Varimax rotation procedure was based on the scree plot of
the eigenvalues. Once the factors were extracted, the rotated solution yielded three
interpretable factors: Beliefs about Student Ratings, Importance of Student Ratings, and
73
Effects of Student Ratings. These three factors accounted for 44.16% of the variable
variance. Importance of student ratings accounted for 15.02% of the variance of the 15
variables. Effects of student ratings accounted for 14.80% of the variance, and beliefs
about student ratings accounted for 14.34% of the variance.
The data from the following 7 survey statements (items 1-5, 10, 15) which
comprised the Beliefs about Student Ratings Scale were used to answer Research
Question 1:
1. Statement 1: Students should complete formal evaluations of their instructors.
2. Statement 2: Students take the process of evaluating their instructors
seriously.
3. Statement 3: Student surveys are a valuable method of evaluating instructors.
4. Statement 4: Students provide fair evaluations of their instructors.
5. Statement 5: Students know the qualities of an effective teacher.
6. Statement 10: Administrators should inform professors about the results.
7. Statement 15: A summary of the results from the student evaluations should
be available online for students to review.
Research Question 1 was examined in three phases using descriptive and
inferential statistics. First, responses to individual survey statements, 1-5, 10, and 15,
were described. Next, a composite variable, Beliefs about the Value of Student Ratings,
was created by categorizing the responses to the seven survey statements according to
perceived value. Students’ responses were grouped into three value categories (no value,
uncertain value, value) and then described. Finally, the relationships between the
74
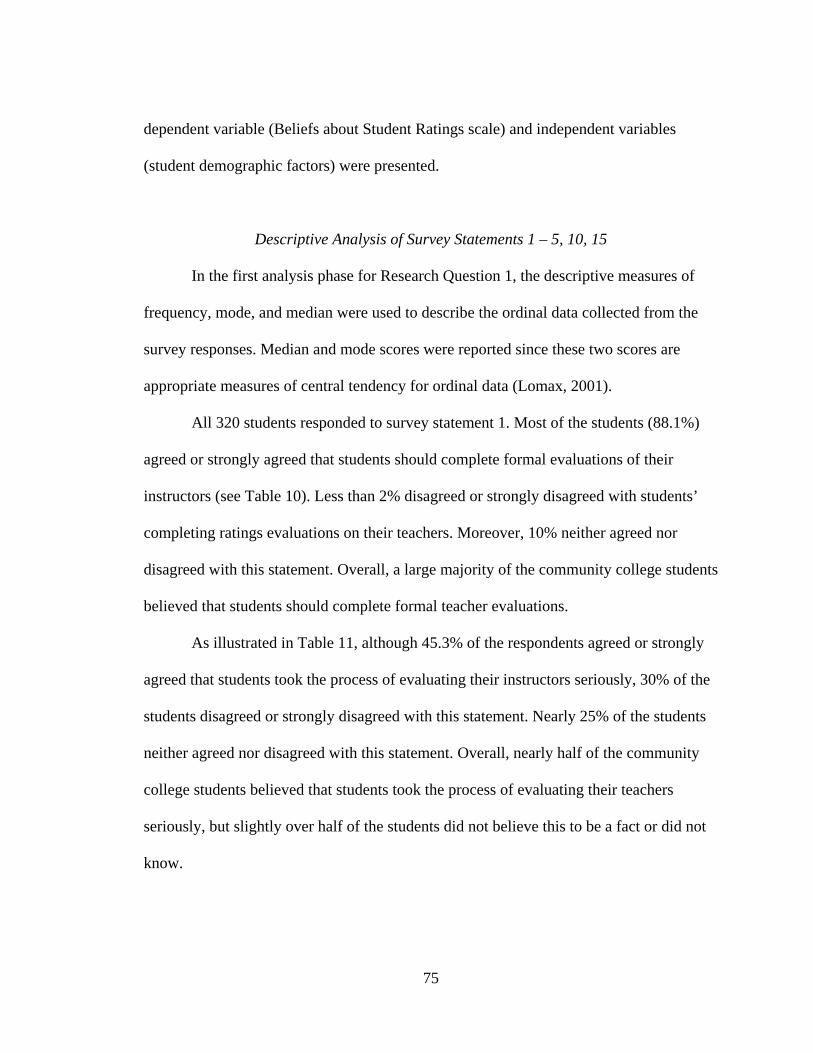
dependent variable (Beliefs about Student Ratings scale) and independent variables
(student demographic factors) were presented.
Descriptive Analysis of Survey Statements 1 – 5, 10, 15
In the first analysis phase for Research Question 1, the descriptive measures of
frequency, mode, and median were used to describe the ordinal data collected from the
survey responses. Median and mode scores were reported since these two scores are
appropriate measures of central tendency for ordinal data (Lomax, 2001).
All 320 students responded to survey statement 1. Most of the students (88.1%)
agreed or strongly agreed that students should complete formal evaluations of their
instructors (see Table 10). Less than 2% disagreed or strongly disagreed with students’
completing ratings evaluations on their teachers. Moreover, 10% neither agreed nor
disagreed with this statement. Overall, a large majority of the community college students
believed that students should complete formal teacher evaluations.
As illustrated in Table 11, although 45.3% of the respondents agreed or strongly
agreed that students took the process of evaluating their instructors seriously, 30% of the
students disagreed or strongly disagreed with this statement. Nearly 25% of the students
neither agreed nor disagreed with this statement. Overall, nearly half of the community
college students believed that students took the process of evaluating their teachers
seriously, but slightly over half of the students did not believe this to be a fact or did not
know.
75
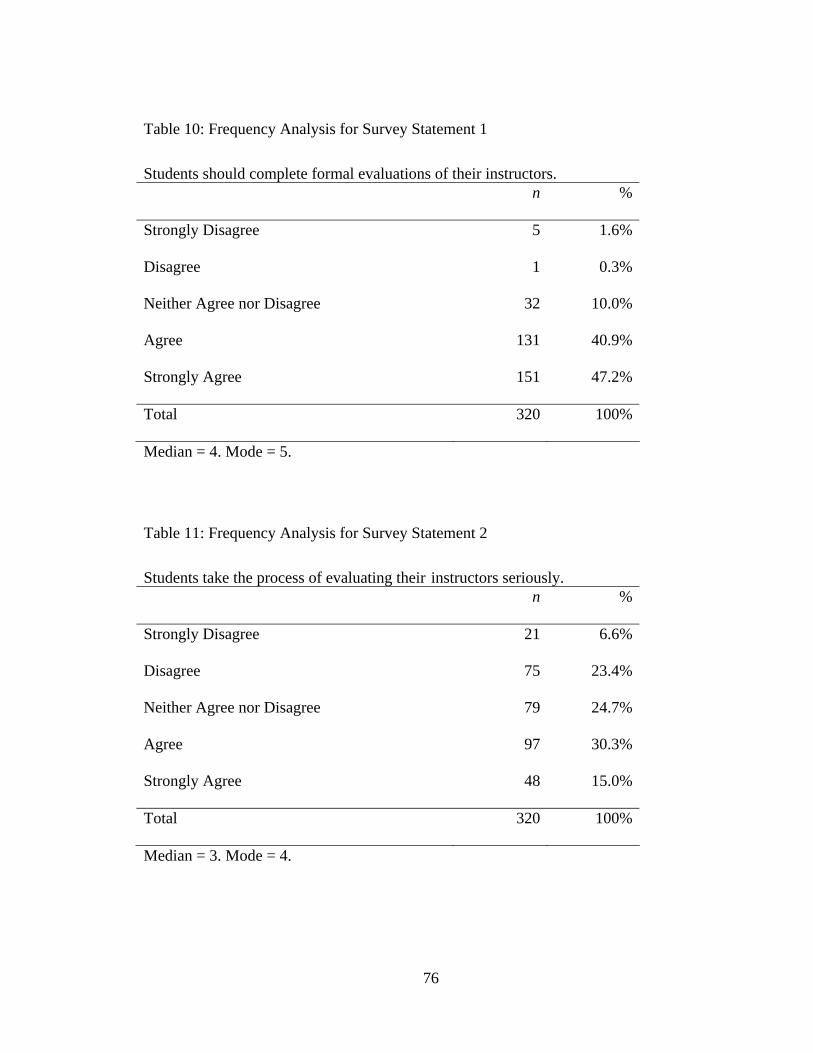
Table 10: Frequency Analysis for Survey Statement 1
Students should complete formal evaluations of their instructors. n %
Strongly Disagree 5 1.6%
Disagree 1 0.3%
Neither Agree nor Disagree 32 10.0%
Agree 131 40.9%
Strongly Agree 151 47.2%
Total 320 100%
Median = 4. Mode = 5.
Table 11: Frequency Analysis for Survey Statement 2
Students take the process of evaluating their instructors seriously. n %
Strongly Disagree 21 6.6%
Disagree 75 23.4%
Neither Agree nor Disagree 79 24.7%
Agree 97 30.3%
Strongly Agree 48 15.0%
Total 320 100%
Median = 3. Mode = 4.
76
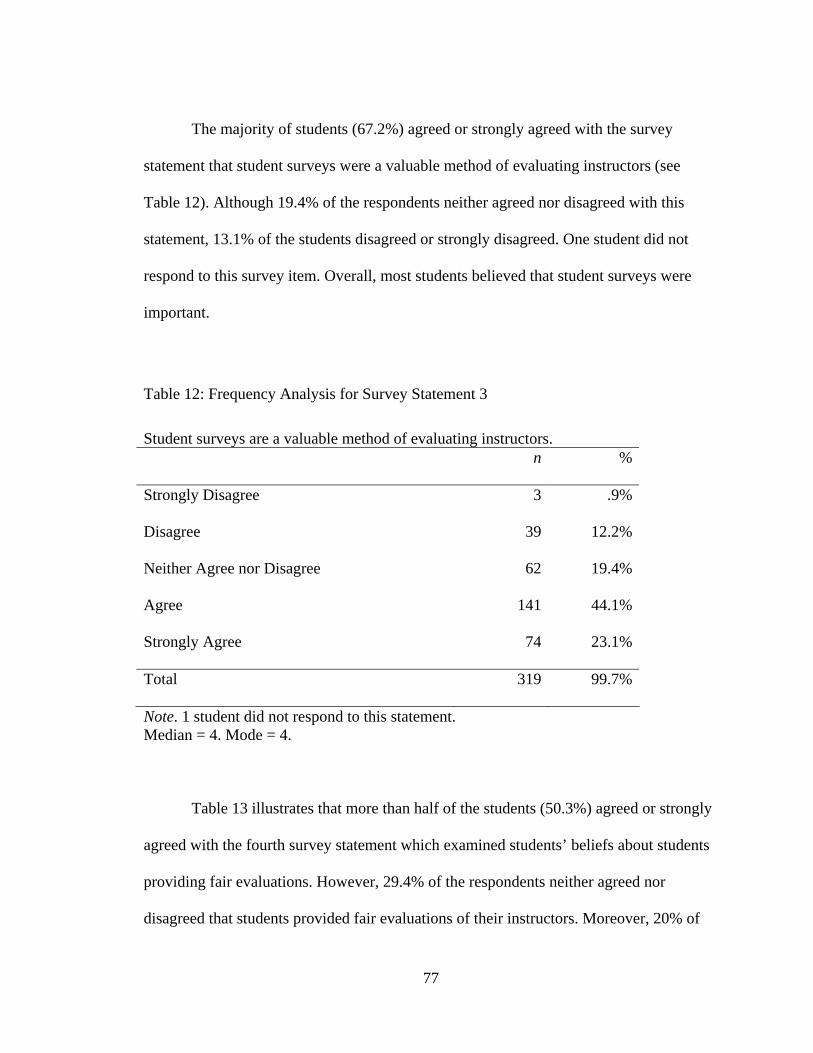
The majority of students (67.2%) agreed or strongly agreed with the survey
statement that student surveys were a valuable method of evaluating instructors (see
Table 12). Although 19.4% of the respondents neither agreed nor disagreed with this
statement, 13.1% of the students disagreed or strongly disagreed. One student did not
respond to this survey item. Overall, most students believed that student surveys were
important.
Table 12: Frequency Analysis for Survey Statement 3
Student surveys are a valuable method of evaluating instructors. n %
Strongly Disagree 3 .9%
Disagree 39 12.2%
Neither Agree nor Disagree 62 19.4%
Agree 141 44.1%
Strongly Agree 74 23.1%
Total 319 99.7%
Note. 1 student did not respond to this statement. Median = 4. Mode = 4.
Table 13 illustrates that more than half of the students (50.3%) agreed or strongly
agreed with the fourth survey statement which examined students’ beliefs about students
providing fair evaluations. However, 29.4% of the respondents neither agreed nor
disagreed that students provided fair evaluations of their instructors. Moreover, 20% of
77
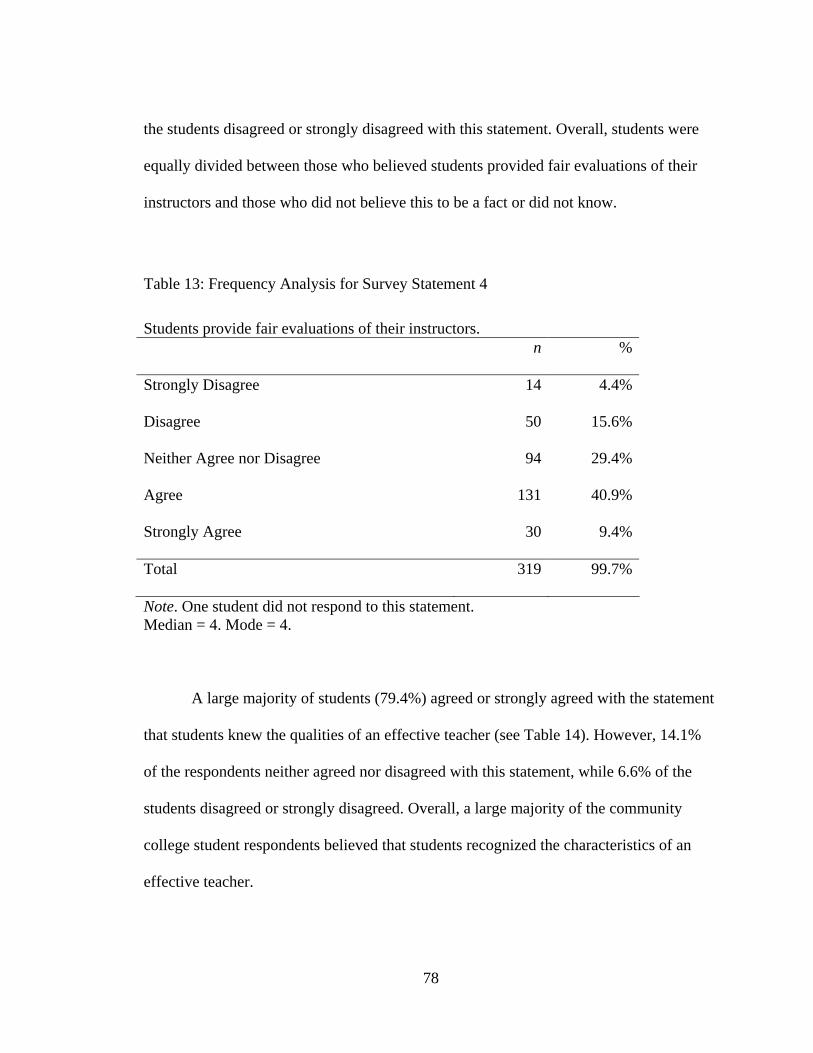
the students disagreed or strongly disagreed with this statement. Overall, students were
equally divided between those who believed students provided fair evaluations of their
instructors and those who did not believe this to be a fact or did not know.
Table 13: Frequency Analysis for Survey Statement 4
Students provide fair evaluations of their instructors. n %
Strongly Disagree 14 4.4%
Disagree 50 15.6%
Neither Agree nor Disagree 94 29.4%
Agree 131 40.9%
Strongly Agree 30 9.4%
Total 319 99.7%
Note. One student did not respond to this statement. Median = 4. Mode = 4.
A large majority of students (79.4%) agreed or strongly agreed with the statement
that students knew the qualities of an effective teacher (see Table 14). However, 14.1%
of the respondents neither agreed nor disagreed with this statement, while 6.6% of the
students disagreed or strongly disagreed. Overall, a large majority of the community
college student respondents believed that students recognized the characteristics of an
effective teacher.
78
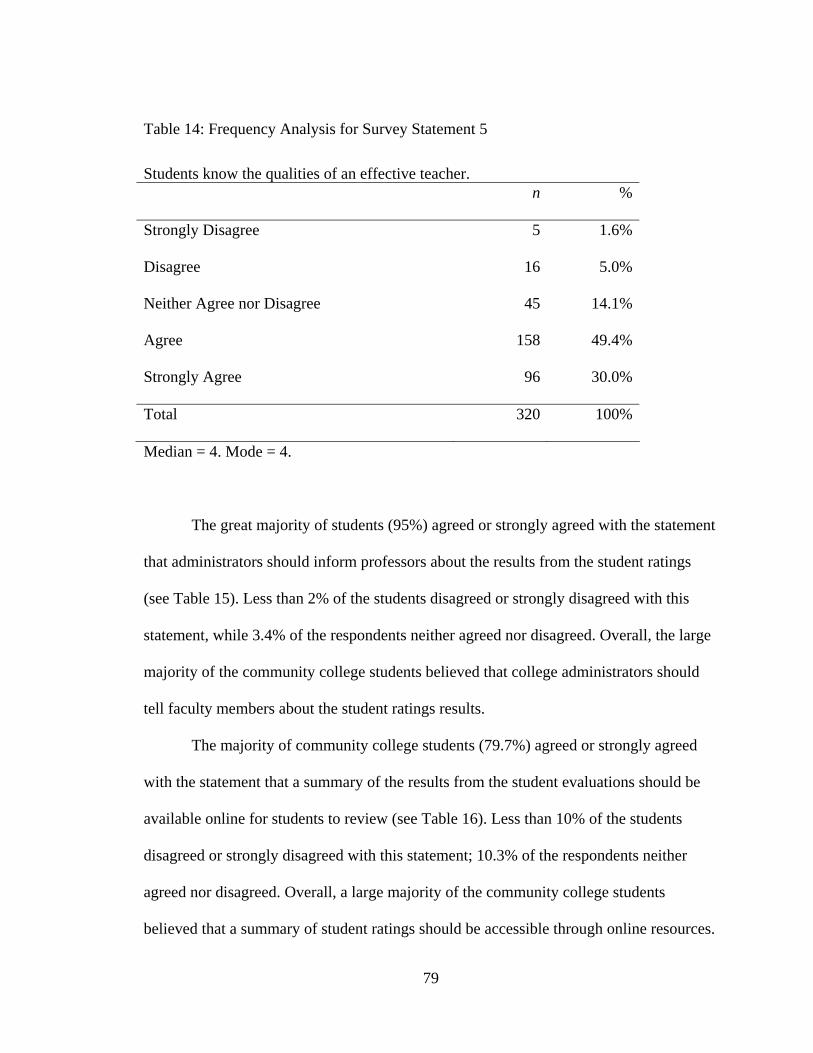
Table 14: Frequency Analysis for Survey Statement 5
Students know the qualities of an effective teacher. n %
Strongly Disagree 5 1.6%
Disagree 16 5.0%
Neither Agree nor Disagree 45 14.1%
Agree 158 49.4%
Strongly Agree 96 30.0%
Total 320 100%
Median = 4. Mode = 4.
The great majority of students (95%) agreed or strongly agreed with the statement
that administrators should inform professors about the results from the student ratings
(see Table 15). Less than 2% of the students disagreed or strongly disagreed with this
statement, while 3.4% of the respondents neither agreed nor disagreed. Overall, the large
majority of the community college students believed that college administrators should
tell faculty members about the student ratings results.
The majority of community college students (79.7%) agreed or strongly agreed
with the statement that a summary of the results from the student evaluations should be
available online for students to review (see Table 16). Less than 10% of the students
disagreed or strongly disagreed with this statement; 10.3% of the respondents neither
agreed nor disagreed. Overall, a large majority of the community college students
believed that a summary of student ratings should be accessible through online resources.
79
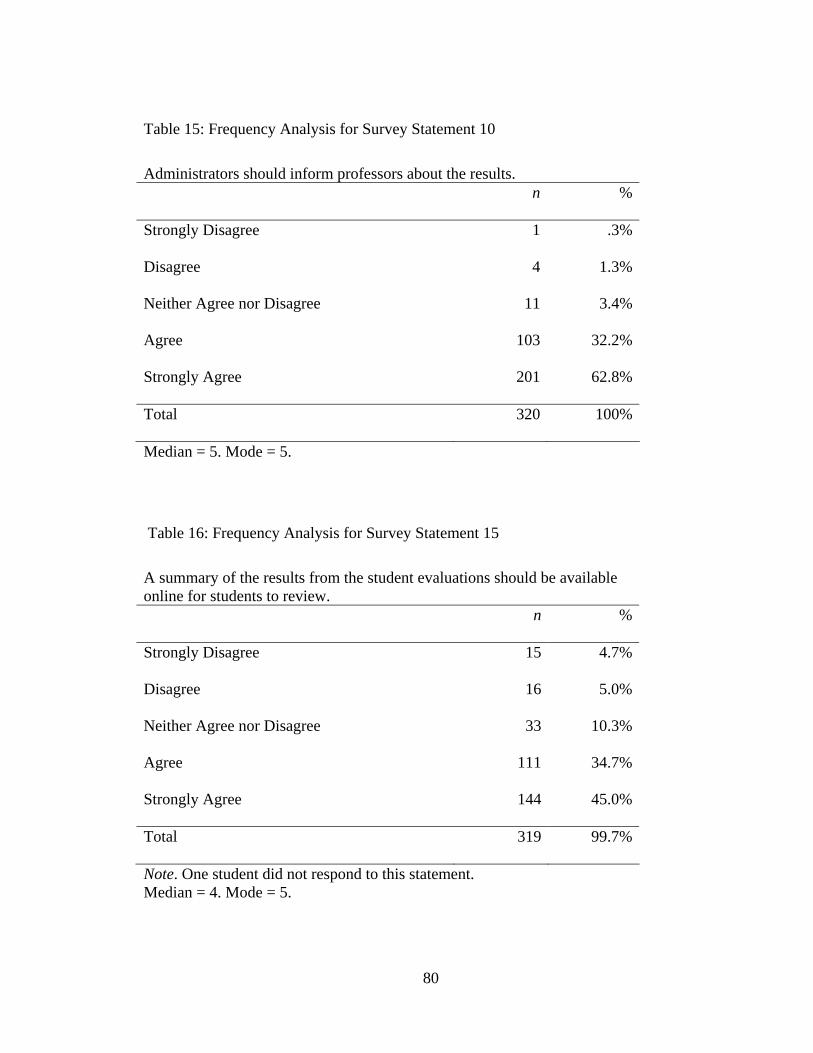
Table 15: Frequency Analysis for Survey Statement 10
Administrators should inform professors about the results. n %
Strongly Disagree 1 .3%
Disagree 4 1.3%
Neither Agree nor Disagree 11 3.4%
Agree 103 32.2%
Strongly Agree 201 62.8%
Total 320 100%
Median = 5. Mode = 5.
Table 16: Frequency Analysis for Survey Statement 15
A summary of the results from the student evaluations should be available online for students to review. n %
Strongly Disagree 15 4.7%
Disagree 16 5.0%
Neither Agree nor Disagree 33 10.3%
Agree 111 34.7%
Strongly Agree 144 45.0%
Total 319 99.7%
Note. One student did not respond to this statement. Median = 4. Mode = 5.
80
Students most often responded strongly agree to survey statements 1, 10 and 15.
Therefore, the large majority of community college students strongly believed that
students should complete formal evaluations, that administrators should inform faculty
about the ratings, and that a summary of the results should be available online.
Furthermore, students most often responded agree to survey statements 2, 3, 4, and 5.
Students generally believed that students took the process of evaluating their instructors
seriously, that student surveys were a valuable method of evaluating instructors, that
students provided fair evaluations of their instructors, and that students knew the qualities
of an effective teacher. Only 1 of the 7 statements had a median measure of central
tendency of 3 which indicated that 50% of the responses fell below the median and 50%
fell above the median. This was statement 2: students take the process of evaluating their
instructors seriously. Although the most frequent score for this statement was a 4, the
median measure of 3 indicated that the respondents were divided on their opinions for
this statement. It is noteworthy that 30% (n = 96) of the students disagreed or strongly
disagreed with this statement.
Descriptive Analysis of Beliefs About the Value of Ratings
In the second analysis phase for Research Question 1, students’ responses from
the 7 statements were categorized according to perceived value to describe a composite
variable, Beliefs about the Value of Student Ratings. Students’ responses were grouped
into three belief categories and assigned a value (no value, uncertain value, value).
Responses of 1 (strongly disagree) and 2 (disagree) were grouped into the first belief
category: Belief 1 = no value. Responses of 3 (neither agree nor disagree) were grouped
81
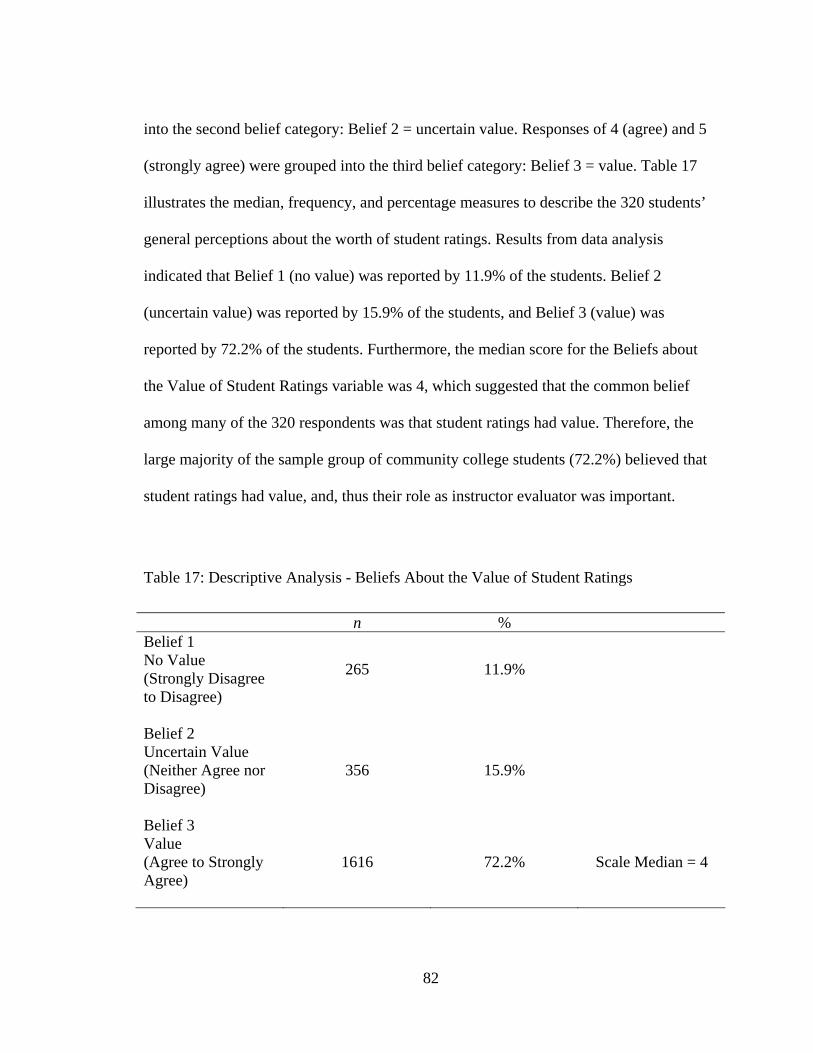
into the second belief category: Belief 2 = uncertain value. Responses of 4 (agree) and 5
(strongly agree) were grouped into the third belief category: Belief 3 = value. Table 17
illustrates the median, frequency, and percentage measures to describe the 320 students’
general perceptions about the worth of student ratings. Results from data analysis
indicated that Belief 1 (no value) was reported by 11.9% of the students. Belief 2
(uncertain value) was reported by 15.9% of the students, and Belief 3 (value) was
reported by 72.2% of the students. Furthermore, the median score for the Beliefs about
the Value of Student Ratings variable was 4, which suggested that the common belief
among many of the 320 respondents was that student ratings had value. Therefore, the
large majority of the sample group of community college students (72.2%) believed that
student ratings had value, and, thus their role as instructor evaluator was important.
Table 17: Descriptive Analysis - Beliefs About the Value of Student Ratings
n % Belief 1 No Value (Strongly Disagree to Disagree)
265 11.9%
Belief 2 Uncertain Value (Neither Agree nor Disagree)
356 15.9%
Belief 3 Value (Agree to Strongly Agree)
1616 72.2%
Scale Median = 4
82
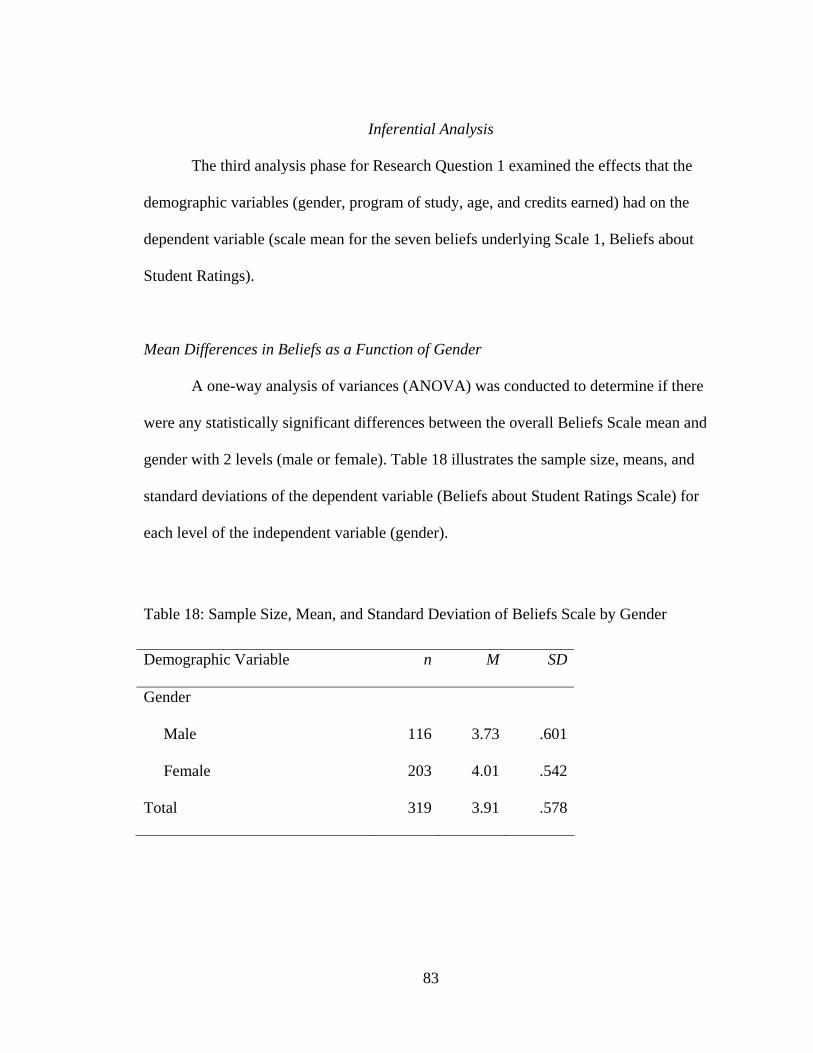
Inferential Analysis
The third analysis phase for Research Question 1 examined the effects that the
demographic variables (gender, program of study, age, and credits earned) had on the
dependent variable (scale mean for the seven beliefs underlying Scale 1, Beliefs about
Student Ratings).
Mean Differences in Beliefs as a Function of Gender
A one-way analysis of variances (ANOVA) was conducted to determine if there
were any statistically significant differences between the overall Beliefs Scale mean and
gender with 2 levels (male or female). Table 18 illustrates the sample size, means, and
standard deviations of the dependent variable (Beliefs about Student Ratings Scale) for
each level of the independent variable (gender).
Table 18: Sample Size, Mean, and Standard Deviation of Beliefs Scale by Gender
Demographic Variable n M SD
Gender
Male 116 3.73 .601
Female 203 4.01 .542
Total 319 3.91 .578
83
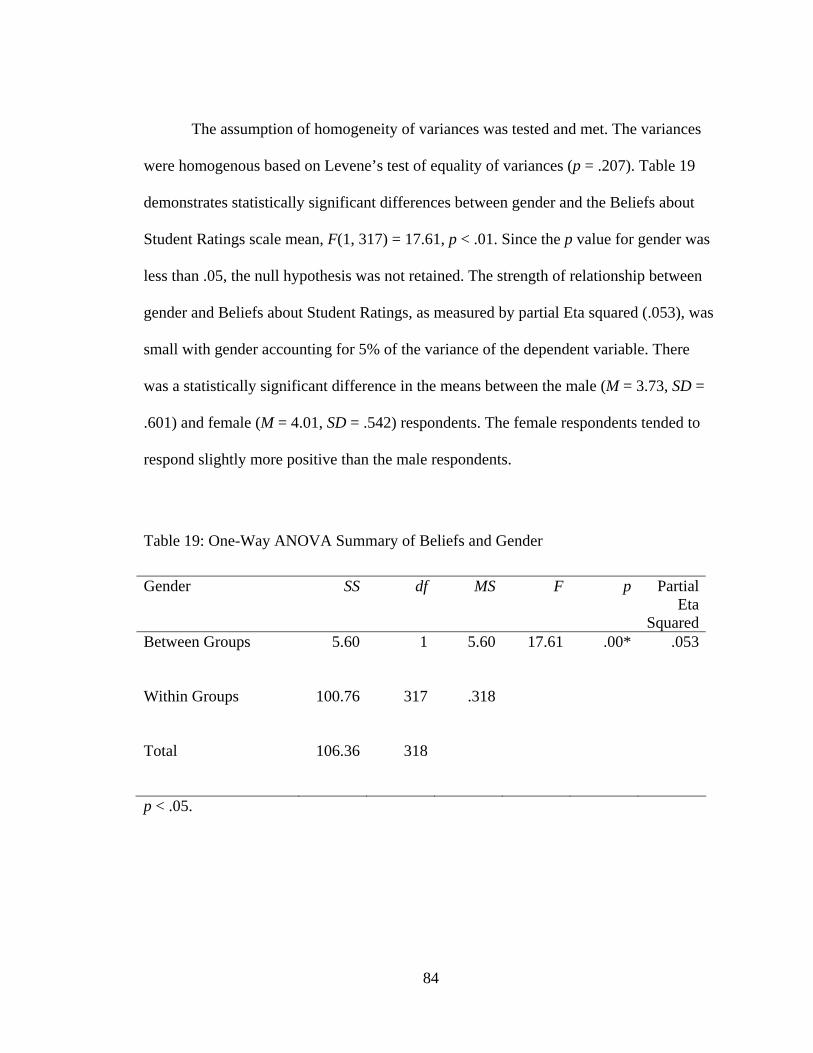
The assumption of homogeneity of variances was tested and met. The variances
were homogenous based on Levene’s test of equality of variances (p = .207). Table 19
demonstrates statistically significant differences between gender and the Beliefs about
Student Ratings scale mean, F(1, 317) = 17.61, p < .01. Since the p value for gender was
less than .05, the null hypothesis was not retained. The strength of relationship between
gender and Beliefs about Student Ratings, as measured by partial Eta squared (.053), was
small with gender accounting for 5% of the variance of the dependent variable. There
was a statistically significant difference in the means between the male (M = 3.73, SD =
.601) and female (M = 4.01, SD = .542) respondents. The female respondents tended to
respond slightly more positive than the male respondents.
Table 19: One-Way ANOVA Summary of Beliefs and Gender
Gender SS df MS F p Partial Eta
SquaredBetween Groups 5.60 1 5.60 17.61 .00* .053
Within Groups 100.76 317 .318
Total 106.36 318
p < .05.
84
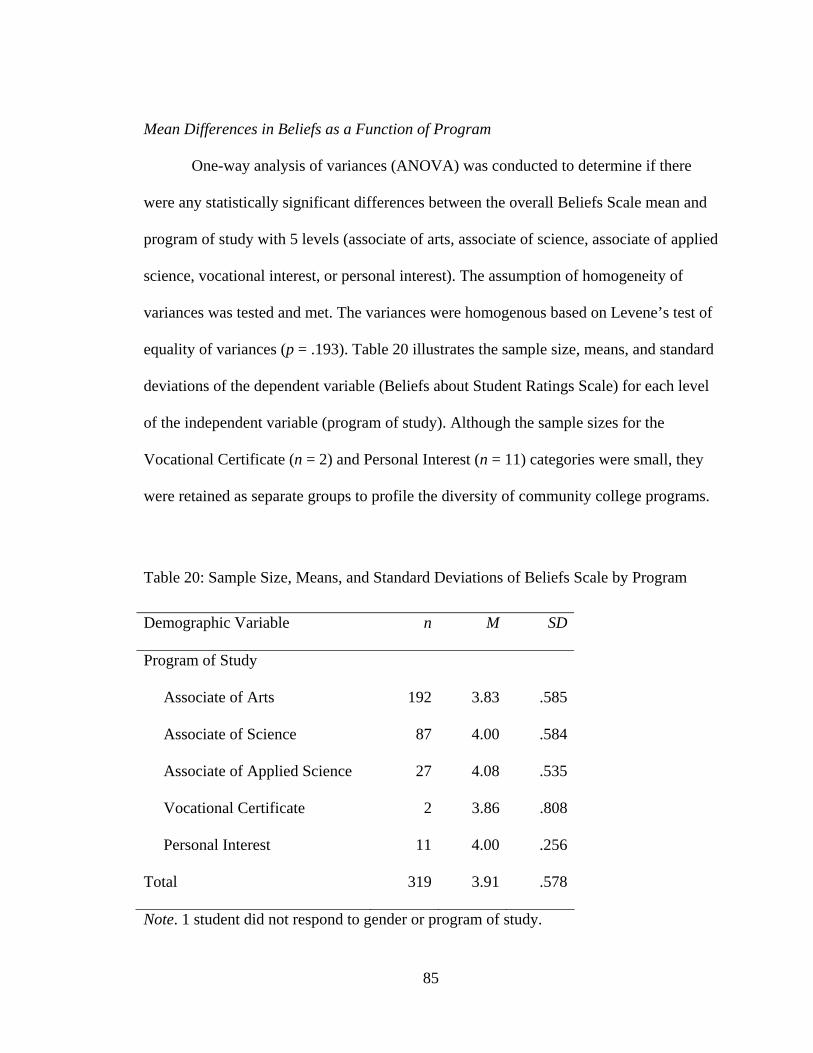
Mean Differences in Beliefs as a Function of Program
One-way analysis of variances (ANOVA) was conducted to determine if there
were any statistically significant differences between the overall Beliefs Scale mean and
program of study with 5 levels (associate of arts, associate of science, associate of applied
science, vocational interest, or personal interest). The assumption of homogeneity of
variances was tested and met. The variances were homogenous based on Levene’s test of
equality of variances (p = .193). Table 20 illustrates the sample size, means, and standard
deviations of the dependent variable (Beliefs about Student Ratings Scale) for each level
of the independent variable (program of study). Although the sample sizes for the
Vocational Certificate (n = 2) and Personal Interest (n = 11) categories were small, they
were retained as separate groups to profile the diversity of community college programs.
Table 20: Sample Size, Means, and Standard Deviations of Beliefs Scale by Program
Demographic Variable n M SD
Program of Study
Associate of Arts 192 3.83 .585
Associate of Science 87 4.00 .584
Associate of Applied Science 27 4.08 .535
Vocational Certificate 2 3.86 .808
Personal Interest 11 4.00 .256
Total 319 3.91 .578
Note. 1 student did not respond to gender or program of study.
85
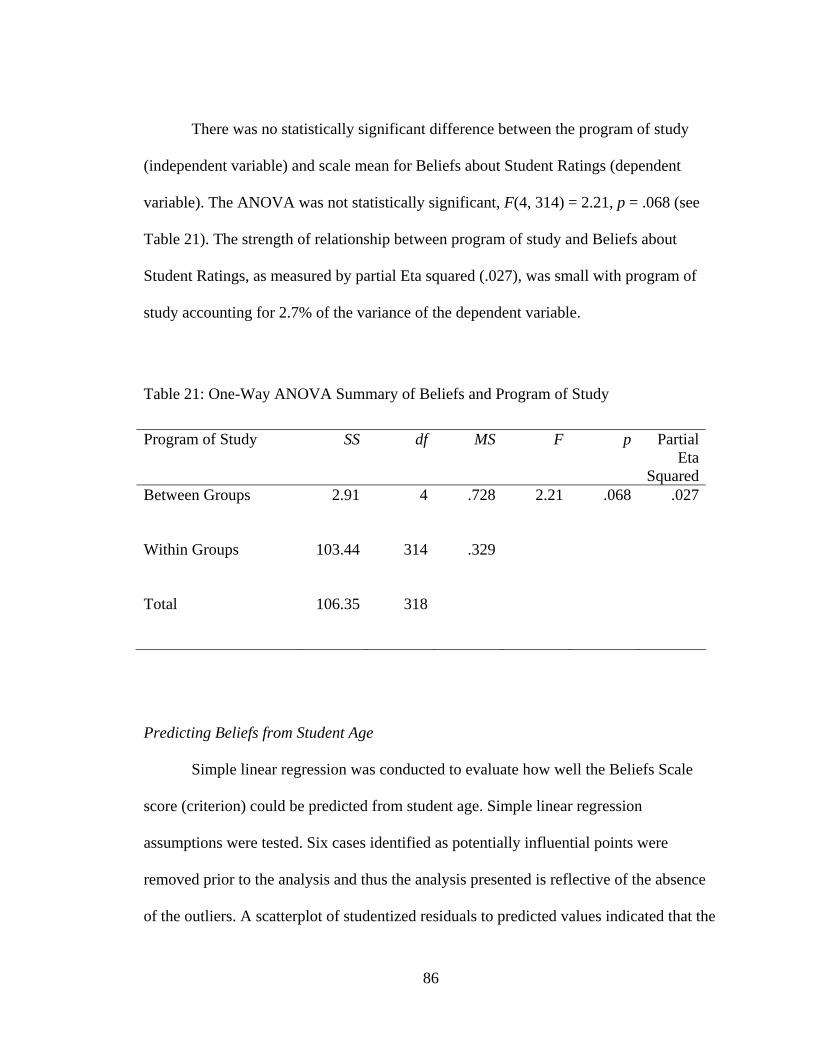
There was no statistically significant difference between the program of study
(independent variable) and scale mean for Beliefs about Student Ratings (dependent
variable). The ANOVA was not statistically significant, F(4, 314) = 2.21, p = .068 (see
Table 21). The strength of relationship between program of study and Beliefs about
Student Ratings, as measured by partial Eta squared (.027), was small with program of
study accounting for 2.7% of the variance of the dependent variable.
Table 21: One-Way ANOVA Summary of Beliefs and Program of Study
Program of Study SS df MS F p Partial Eta
SquaredBetween Groups 2.91 4 .728 2.21 .068 .027
Within Groups 103.44 314 .329
Total 106.35 318
Predicting Beliefs from Student Age
Simple linear regression was conducted to evaluate how well the Beliefs Scale
score (criterion) could be predicted from student age. Simple linear regression
assumptions were tested. Six cases identified as potentially influential points were
removed prior to the analysis and thus the analysis presented is reflective of the absence
of the outliers. A scatterplot of studentized residuals to predicted values indicated that the
86
assumptions of linearity and homogeneity were met. A histogram and Q-Q plot indicated
the residuals were relatively normally distributed. Furthermore, skewness (-.255) and
kurtosis (-.421) statistics indicated normality. Although the Shapiro Wilks tests suggested
non-normality (p < .05), the Kolmogorov-Smirnov did not indicate significance (p = .20).
Regression is robust to violations of non-normality with large samples greater than 30
(Dielmam, 2004). A scatterplot of studentized residuals to case number indicated the
assumption of independence was met.
The scatterplot for the two variables, age and Beliefs Scale mean, was linearly
related. The regression equation for predicting the Beliefs Scale mean score was
Predicted Beliefs Scale score = 3.629 + .012 (age). The model predicts that a change in
age results in a slight increase in Beliefs Scale score of .012. The 95% confidence
interval for the slope, .005 to .019, contained the value of zero; therefore, age was not
significantly related to Beliefs Scale score. Accuracy in predicting Beliefs Scale score
was small with a correlation between Beliefs Scale score and age of .193. Only 4%
(R2 = .037) of the variation in Beliefs Scale score was accounted for by its linear
relationship with age. There was not a lot of practical significance. The predictor
variable, age, was not accounting for a lot of variation in the criterion variable, Beliefs
Scale mean.
Predicting Beliefs from Total Credits Earned
Simple linear regression was conducted to evaluate how well the Beliefs Scale
mean score (criterion) could be predicted from total credits earned (predictors). Simple
linear regression assumptions were again tested for the predictor variable, credits
87
completed, and the criterion variable, Beliefs Scale mean. Six cases identified as
potentially influential points were removed prior to the analysis and thus the analysis
presented is reflective of the absence of the outliers. A review of a scatterplot of
studentized residuals to predicted values indicated the assumptions of linearity and
homogeneity were met. Skewness (-.246) and kurtosis (-.478) statistics indicated
normality. However, Kolmogorov-Smirnov and Shapiro Wilks tests were significant
(p < .05) suggesting non-normality.
The regression equation for predicting the Beliefs Scale score was Predicted
Beliefs Scale score = 3.862 + .001 (credits earned). The model predicts that a change in
credits earned results in a slight increase in Beliefs Scale score of .001. The 95%
confidence interval for the slope, -.002 to .004, contained the value of zero; therefore,
credits completed was not significantly related to Beliefs Scale score. Accuracy in
predicting Beliefs Scale score was small with a correlation between Beliefs Scale score
and credits earned of .04. Only .2% (R2 = .002) of the variation in Beliefs Scale score was
accounted for by its linear relationship with credits completed. There was slight practical
significance with the number of credits completed as a predictor of Beliefs Scale score.
Therefore, neither age nor credits completed could be used to predict a student’s score on
the Beliefs about Student Ratings construct.
Research Question 2
Was there a statistically significant relationship between students’ perceptions of
the relevance or importance of the student survey for evaluating professors and how
students believed the survey results were used? This question was addressed using
88
descriptive and inferential statistics for 8 of the 15 survey statements. Furthermore, a
description of the students’ perceptions of the student evaluation practice was completed
using qualitative analysis of written comments provided by 124 of the students.
As explained in Chapter 3, factor analysis was used to define the dimensions
underlying the survey instrument. The 15 items were reduced to 3 dimensions. The first
scale, Beliefs About Student Ratings, included 7 survey statements. This scale was used
to address Research Question 1. Data from the other 2 scales were analyzed to address
Research Question 2. These 2 dimensions were defined as Scale 2, Importance of Student
Ratings, and Scale 3, Effects of Student Ratings.
Data from the following 4 survey statements identified the construct for Scale 2:
Perceived Importance of Student Ratings:
1. Statement 6: Student evaluations are important to the college administrators.
2. Statement 7: Student evaluations are important to the instructor.
3. Statement 8: Professors care about the opinions of their students.
4. Statement 9: Professors use class evaluations to improve their teaching.
Data from the following 4 survey statements identified the construct for Scale 3:
Perceived Effects of Student Ratings:
1. Statement 11: Professors change their grading system based on feedback from
the evaluations.
2. Statement 12: Results from student evaluations are used to dismiss professors.
3. Statement 13: Results from student evaluations are used to promote
professors.
89
4. Statement 14: Results from student evaluations influence faculty salary
increases.
Two different correlation procedures, Pearson product-moment and Spearman’s
rho, were used to examine Research Question 2. Pearson correlation coefficients were
computed between the two newly created composite variables (Importance of Student
Ratings and Effects of Student Ratings), and Spearman’s rho correlation coefficients
were computed for each pair of individual items within the constructs using SPSS 11.5.
Correlation Between Rating Scales: Importance and Effects
First, a Pearson product-moment correlation coefficient, which is an appropriate
correlation measure of interval data, was computed to assess the degree that the total
score from the Importance of Student Ratings Scale and the total score from the Effects
of Student Ratings Scale were related. The sum of the data from the 4-item Importance of
Student Ratings Scale was compared to the sum of the data from the 4-item Effects of
Student Ratings Scale to provide a measure of the relationship between perceived
importance and perceived effects of student ratings. The correlation between the
Importance of Student Ratings Scale and the Effects of Student Ratings Scale was
statistically significant, r(318) = .397, p < .01. “…for the behavioral sciences, correlation
coefficients of .10, .30, and .50, irrespective of sign, are, by convention, interpreted as
small, medium, and large coefficients, respectively” (Green & Salkind, 2005, p. 256).
Therefore, there was a medium positive relationship between students’ perceptions of the
relevance or importance of the student survey for evaluating professors and how students
believed the survey results were used.
90
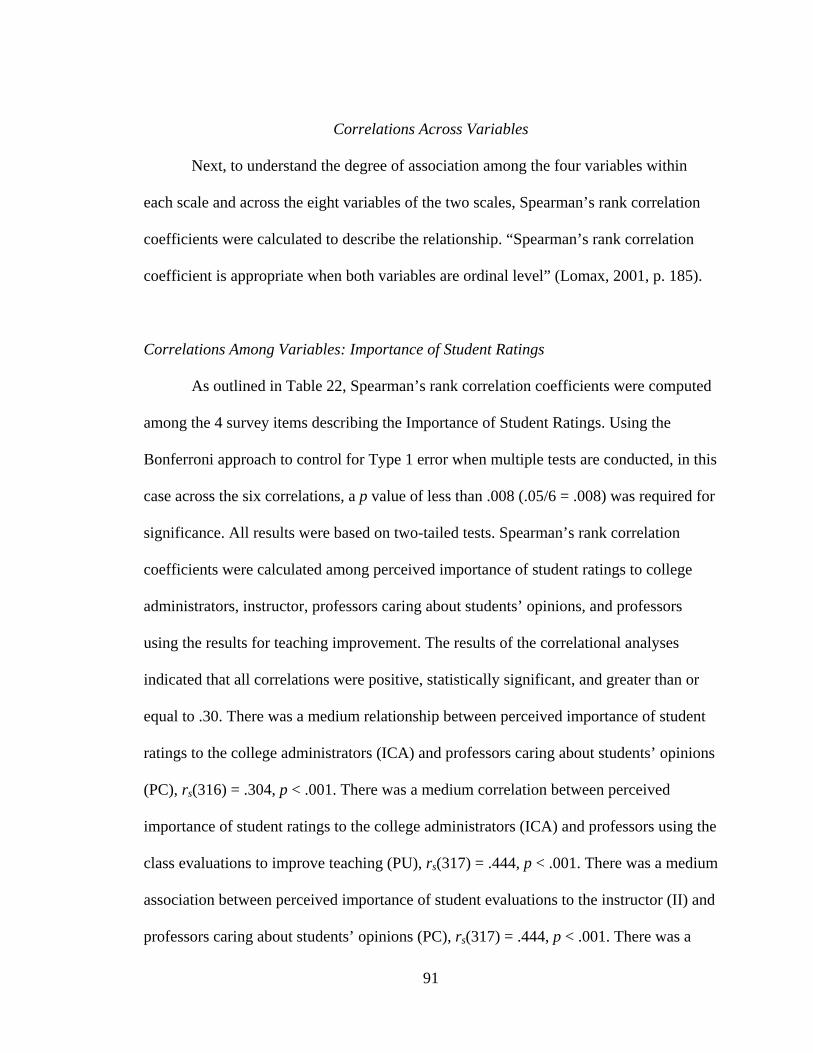
Correlations Across Variables
Next, to understand the degree of association among the four variables within
each scale and across the eight variables of the two scales, Spearman’s rank correlation
coefficients were calculated to describe the relationship. “Spearman’s rank correlation
coefficient is appropriate when both variables are ordinal level” (Lomax, 2001, p. 185).
Correlations Among Variables: Importance of Student Ratings
As outlined in Table 22, Spearman’s rank correlation coefficients were computed
among the 4 survey items describing the Importance of Student Ratings. Using the
Bonferroni approach to control for Type 1 error when multiple tests are conducted, in this
case across the six correlations, a p value of less than .008 (.05/6 = .008) was required for
significance. All results were based on two-tailed tests. Spearman’s rank correlation
coefficients were calculated among perceived importance of student ratings to college
administrators, instructor, professors caring about students’ opinions, and professors
using the results for teaching improvement. The results of the correlational analyses
indicated that all correlations were positive, statistically significant, and greater than or
equal to .30. There was a medium relationship between perceived importance of student
ratings to the college administrators (ICA) and professors caring about students’ opinions
(PC), rs(316) = .304, p < .001. There was a medium correlation between perceived
importance of student ratings to the college administrators (ICA) and professors using the
class evaluations to improve teaching (PU), rs(317) = .444, p < .001. There was a medium
association between perceived importance of student evaluations to the instructor (II) and
professors caring about students’ opinions (PC), rs(317) = .444, p < .001. There was a
91
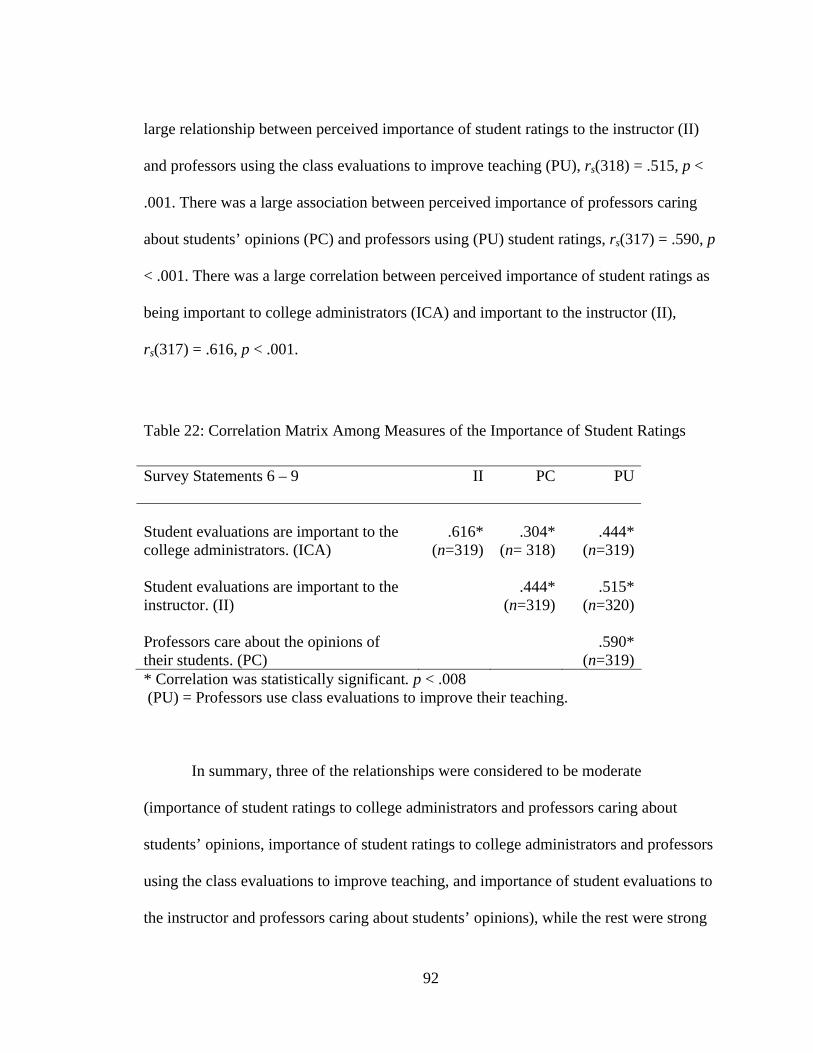
large relationship between perceived importance of student ratings to the instructor (II)
and professors using the class evaluations to improve teaching (PU), rs(318) = .515, p <
.001. There was a large association between perceived importance of professors caring
about students’ opinions (PC) and professors using (PU) student ratings, rs(317) = .590, p
< .001. There was a large correlation between perceived importance of student ratings as
being important to college administrators (ICA) and important to the instructor (II),
rs(317) = .616, p < .001.
Table 22: Correlation Matrix Among Measures of the Importance of Student Ratings
Survey Statements 6 – 9 II PC PU
Student evaluations are important to the college administrators. (ICA)
.616*(n=319)
.304* (n= 318)
.444*
(n=319) Student evaluations are important to the instructor. (II)
.444*(n=319)
.515*
(n=320) Professors care about the opinions of their students. (PC)
.590*
(n=319) * Correlation was statistically significant. p < .008 (PU) = Professors use class evaluations to improve their teaching.
In summary, three of the relationships were considered to be moderate
(importance of student ratings to college administrators and professors caring about
students’ opinions, importance of student ratings to college administrators and professors
using the class evaluations to improve teaching, and importance of student evaluations to
the instructor and professors caring about students’ opinions), while the rest were strong
92
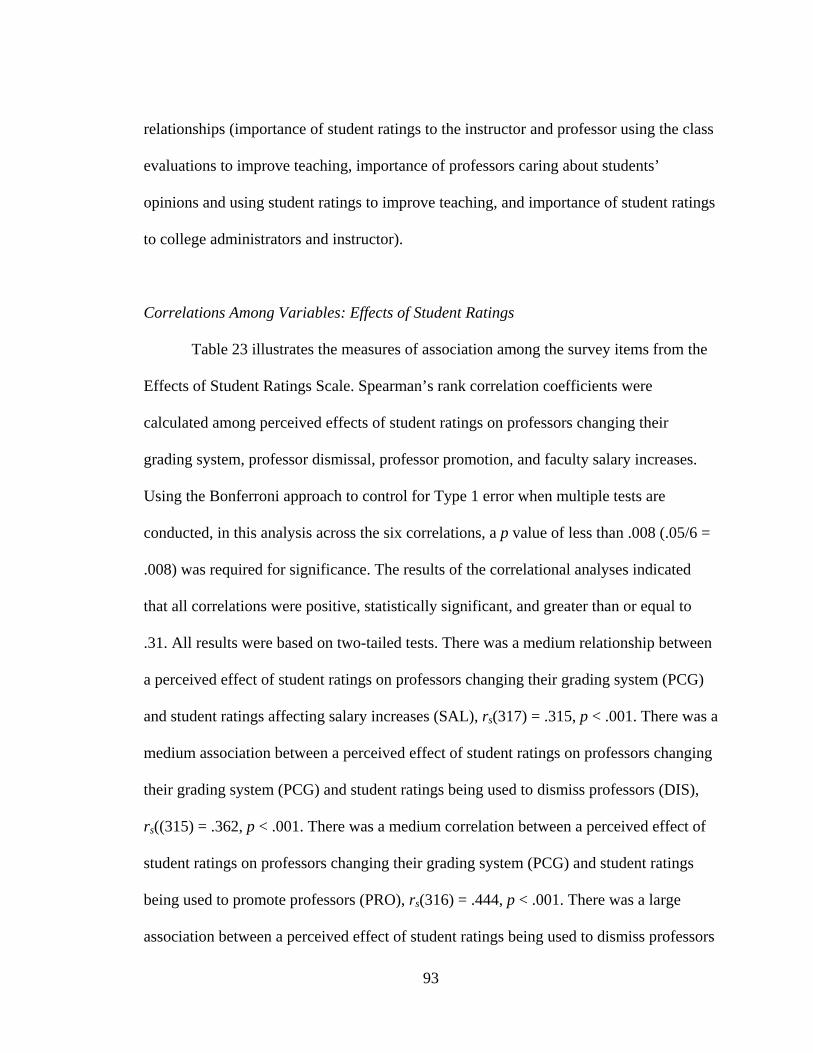
relationships (importance of student ratings to the instructor and professor using the class
evaluations to improve teaching, importance of professors caring about students’
opinions and using student ratings to improve teaching, and importance of student ratings
to college administrators and instructor).
Correlations Among Variables: Effects of Student Ratings
Table 23 illustrates the measures of association among the survey items from the
Effects of Student Ratings Scale. Spearman’s rank correlation coefficients were
calculated among perceived effects of student ratings on professors changing their
grading system, professor dismissal, professor promotion, and faculty salary increases.
Using the Bonferroni approach to control for Type 1 error when multiple tests are
conducted, in this analysis across the six correlations, a p value of less than .008 (.05/6 =
.008) was required for significance. The results of the correlational analyses indicated
that all correlations were positive, statistically significant, and greater than or equal to
.31. All results were based on two-tailed tests. There was a medium relationship between
a perceived effect of student ratings on professors changing their grading system (PCG)
and student ratings affecting salary increases (SAL), rs(317) = .315, p < .001. There was a
medium association between a perceived effect of student ratings on professors changing
their grading system (PCG) and student ratings being used to dismiss professors (DIS),
rs((315) = .362, p < .001. There was a medium correlation between a perceived effect of
student ratings on professors changing their grading system (PCG) and student ratings
being used to promote professors (PRO), rs(316) = .444, p < .001. There was a large
association between a perceived effect of student ratings being used to dismiss professors
93
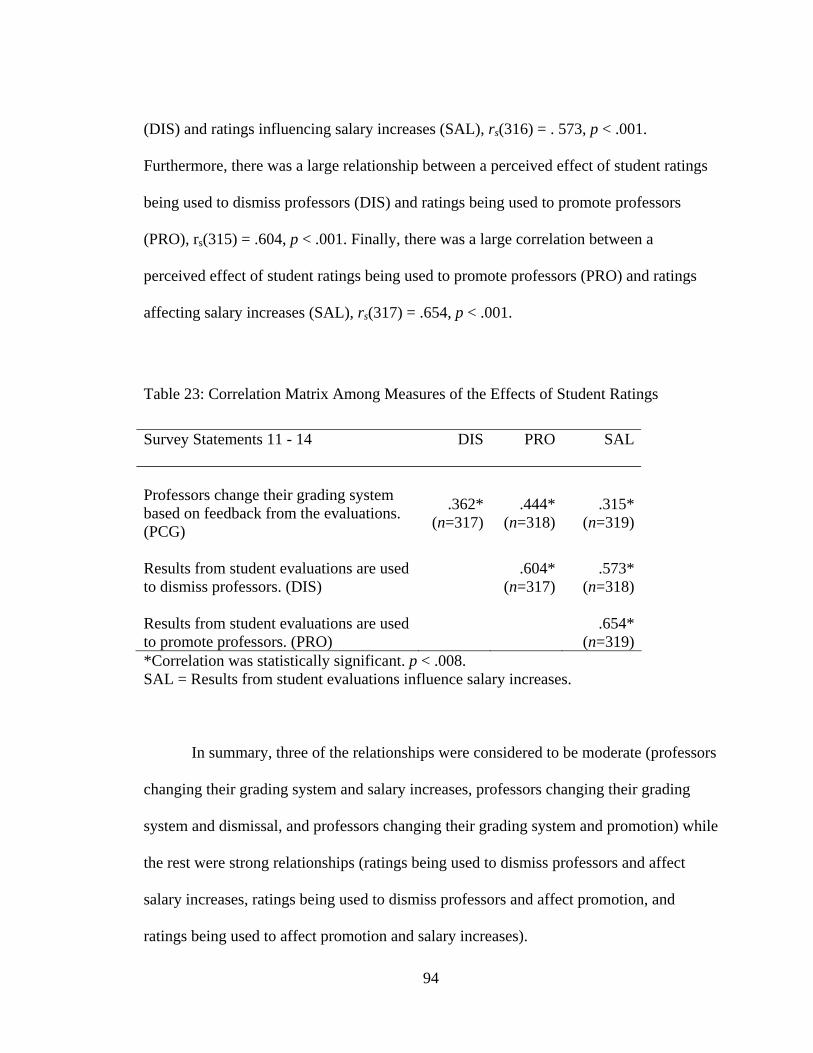
(DIS) and ratings influencing salary increases (SAL), rs(316) = . 573, p < .001.
Furthermore, there was a large relationship between a perceived effect of student ratings
being used to dismiss professors (DIS) and ratings being used to promote professors
(PRO), rs(315) = .604, p < .001. Finally, there was a large correlation between a
perceived effect of student ratings being used to promote professors (PRO) and ratings
affecting salary increases (SAL), rs(317) = .654, p < .001.
Table 23: Correlation Matrix Among Measures of the Effects of Student Ratings
Survey Statements 11 - 14 DIS PRO SAL
Professors change their grading system based on feedback from the evaluations. (PCG)
.362*(n=317)
.444*(n=318)
.315*
(n=319)
Results from student evaluations are used to dismiss professors. (DIS)
.604* (n=317)
.573*
(n=318) Results from student evaluations are used to promote professors. (PRO)
.654*
(n=319) *Correlation was statistically significant. p < .008. SAL = Results from student evaluations influence salary increases.
In summary, three of the relationships were considered to be moderate (professors
changing their grading system and salary increases, professors changing their grading
system and dismissal, and professors changing their grading system and promotion) while
the rest were strong relationships (ratings being used to dismiss professors and affect
salary increases, ratings being used to dismiss professors and affect promotion, and
ratings being used to affect promotion and salary increases).
94
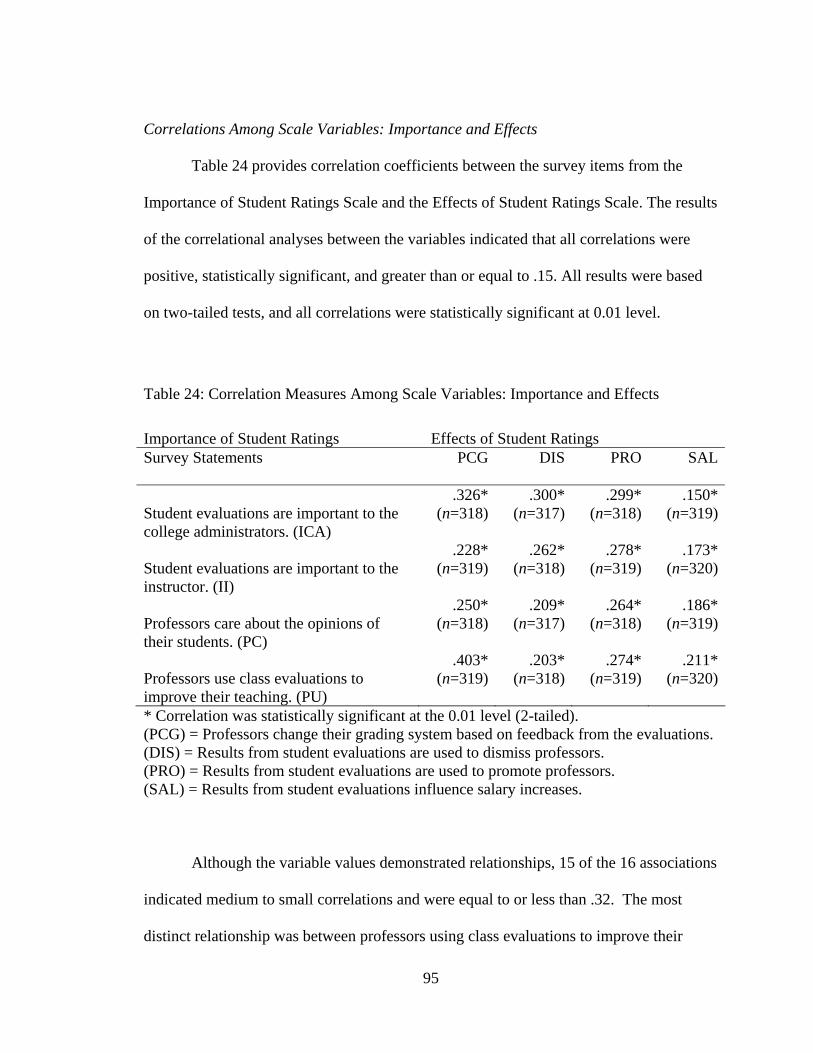
Correlations Among Scale Variables: Importance and Effects
Table 24 provides correlation coefficients between the survey items from the
Importance of Student Ratings Scale and the Effects of Student Ratings Scale. The results
of the correlational analyses between the variables indicated that all correlations were
positive, statistically significant, and greater than or equal to .15. All results were based
on two-tailed tests, and all correlations were statistically significant at 0.01 level.
Table 24: Correlation Measures Among Scale Variables: Importance and Effects
Importance of Student Ratings Effects of Student Ratings Survey Statements PCG DIS PRO SAL
Student evaluations are important to the college administrators. (ICA)
.326* (n=318)
.300*(n=317)
.299* (n=318)
.150*(n=319)
Student evaluations are important to the instructor. (II)
.228*(n=319)
.262*(n=318)
.278* (n=319)
.173*(n=320)
Professors care about the opinions of their students. (PC)
.250*(n=318)
.209*(n=317)
.264* (n=318)
.186*(n=319)
Professors use class evaluations to improve their teaching. (PU)
.403*(n=319)
.203*(n=318)
.274* (n=319)
.211*(n=320)
* Correlation was statistically significant at the 0.01 level (2-tailed). (PCG) = Professors change their grading system based on feedback from the evaluations. (DIS) = Results from student evaluations are used to dismiss professors. (PRO) = Results from student evaluations are used to promote professors. (SAL) = Results from student evaluations influence salary increases.
Although the variable values demonstrated relationships, 15 of the 16 associations
indicated medium to small correlations and were equal to or less than .32. The most
distinct relationship was between professors using class evaluations to improve their
95
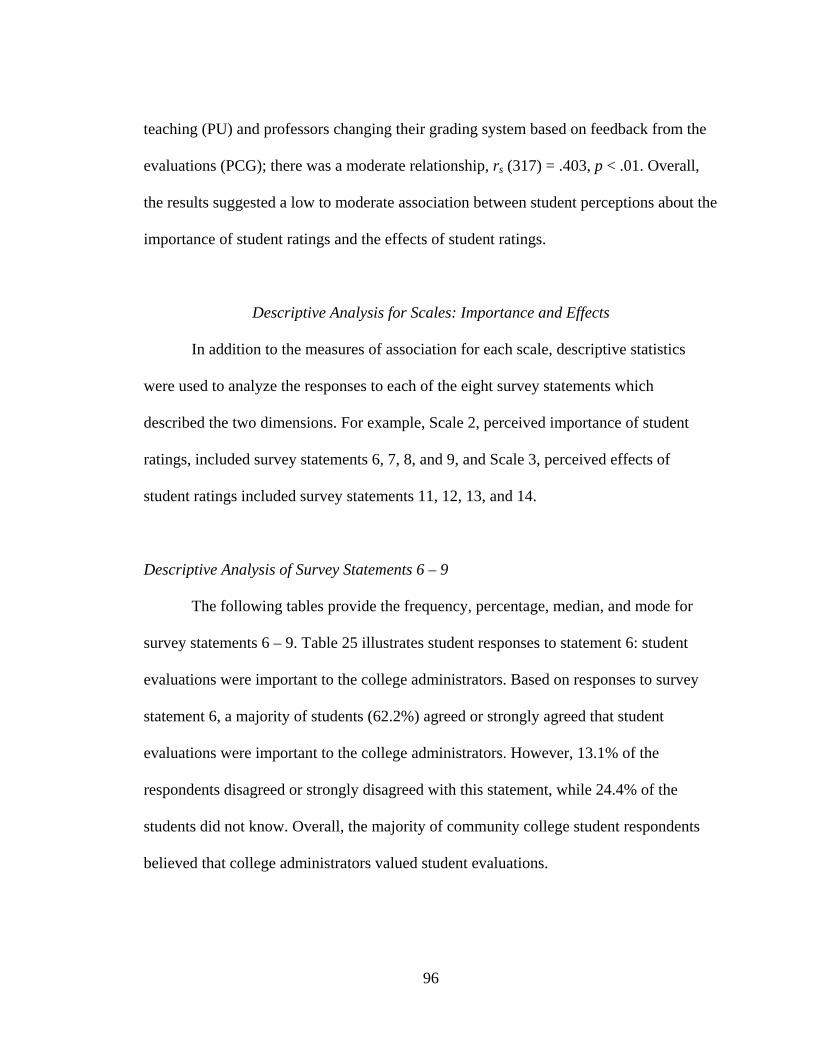
teaching (PU) and professors changing their grading system based on feedback from the
evaluations (PCG); there was a moderate relationship, rs (317) = .403, p < .01. Overall,
the results suggested a low to moderate association between student perceptions about the
importance of student ratings and the effects of student ratings.
Descriptive Analysis for Scales: Importance and Effects
In addition to the measures of association for each scale, descriptive statistics
were used to analyze the responses to each of the eight survey statements which
described the two dimensions. For example, Scale 2, perceived importance of student
ratings, included survey statements 6, 7, 8, and 9, and Scale 3, perceived effects of
student ratings included survey statements 11, 12, 13, and 14.
Descriptive Analysis of Survey Statements 6 – 9
The following tables provide the frequency, percentage, median, and mode for
survey statements 6 – 9. Table 25 illustrates student responses to statement 6: student
evaluations were important to the college administrators. Based on responses to survey
statement 6, a majority of students (62.2%) agreed or strongly agreed that student
evaluations were important to the college administrators. However, 13.1% of the
respondents disagreed or strongly disagreed with this statement, while 24.4% of the
students did not know. Overall, the majority of community college student respondents
believed that college administrators valued student evaluations.
96
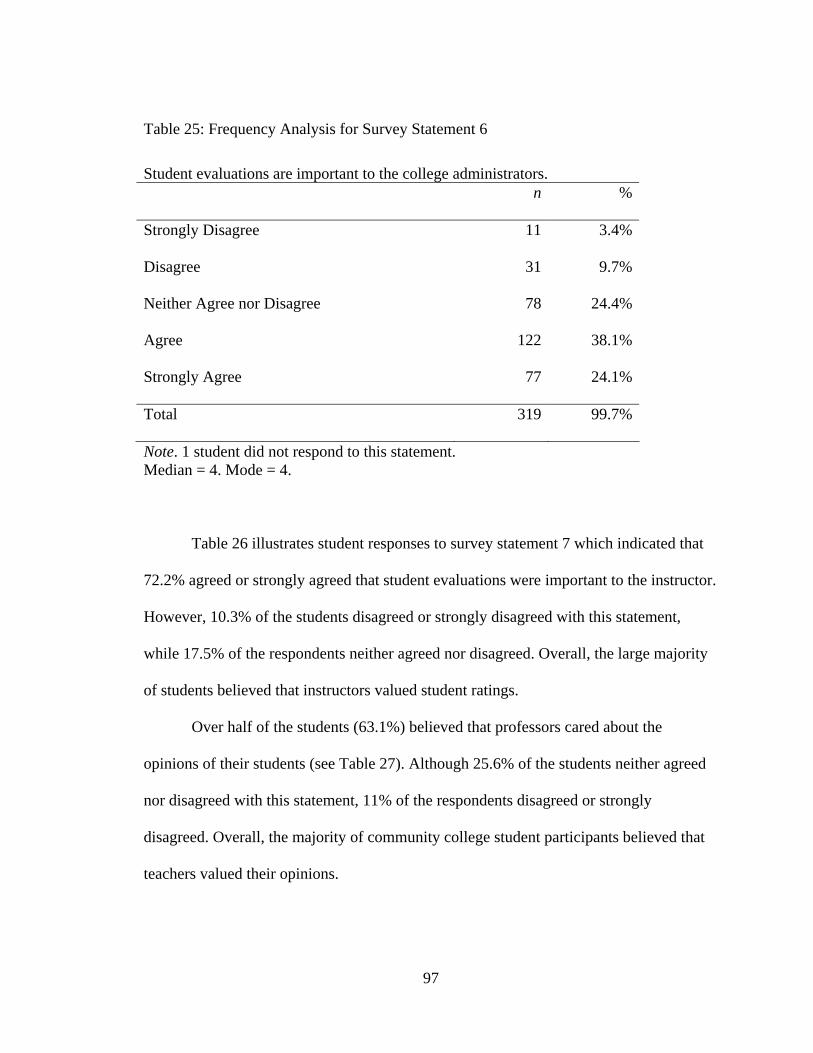
Table 25: Frequency Analysis for Survey Statement 6
Student evaluations are important to the college administrators. n %
Strongly Disagree 11 3.4%
Disagree 31 9.7%
Neither Agree nor Disagree 78 24.4%
Agree 122 38.1%
Strongly Agree 77 24.1%
Total 319 99.7%
Note. 1 student did not respond to this statement. Median = 4. Mode = 4.
Table 26 illustrates student responses to survey statement 7 which indicated that
72.2% agreed or strongly agreed that student evaluations were important to the instructor.
However, 10.3% of the students disagreed or strongly disagreed with this statement,
while 17.5% of the respondents neither agreed nor disagreed. Overall, the large majority
of students believed that instructors valued student ratings.
Over half of the students (63.1%) believed that professors cared about the
opinions of their students (see Table 27). Although 25.6% of the students neither agreed
nor disagreed with this statement, 11% of the respondents disagreed or strongly
disagreed. Overall, the majority of community college student participants believed that
teachers valued their opinions.
97
Table 26: Frequency Analysis for Survey Statement 7
Student evaluations are important to the instructor. n %
Strongly Disagree 10 3.1%
Disagree 23 7.2%
Neither Agree nor Disagree 56 17.5%
Agree 145 45.3%
Strongly Agree 86 26.9%
Total 320 100.0%
Median = 4. Mode = 4.
Table 27: Frequency Analysis for Survey Statement 8
Professors care about the opinions of their students. n %
Strongly Disagree 5 1.6%
Disagree 30 9.4%
Neither Agree nor Disagree 82 25.6%
Agree 146 45.6%
Strongly Agree 56 17.5%
Total 319 99.7%
Note. 1 student did not respond to this statement. Median = 4. Mode = 4.
98
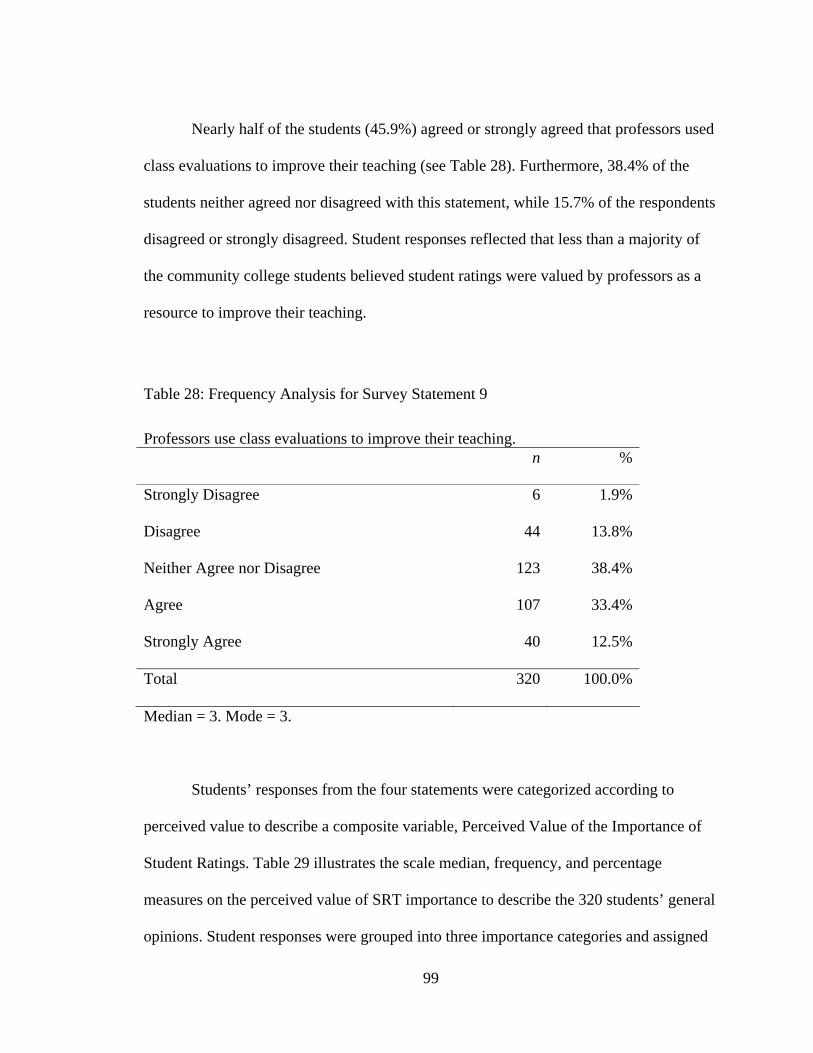
Nearly half of the students (45.9%) agreed or strongly agreed that professors used
class evaluations to improve their teaching (see Table 28). Furthermore, 38.4% of the
students neither agreed nor disagreed with this statement, while 15.7% of the respondents
disagreed or strongly disagreed. Student responses reflected that less than a majority of
the community college students believed student ratings were valued by professors as a
resource to improve their teaching.
Table 28: Frequency Analysis for Survey Statement 9
Professors use class evaluations to improve their teaching. n %
Strongly Disagree 6 1.9%
Disagree 44 13.8%
Neither Agree nor Disagree 123 38.4%
Agree 107 33.4%
Strongly Agree 40 12.5%
Total 320 100.0%
Median = 3. Mode = 3.
Students’ responses from the four statements were categorized according to
perceived value to describe a composite variable, Perceived Value of the Importance of
Student Ratings. Table 29 illustrates the scale median, frequency, and percentage
measures on the perceived value of SRT importance to describe the 320 students’ general
opinions. Student responses were grouped into three importance categories and assigned
99
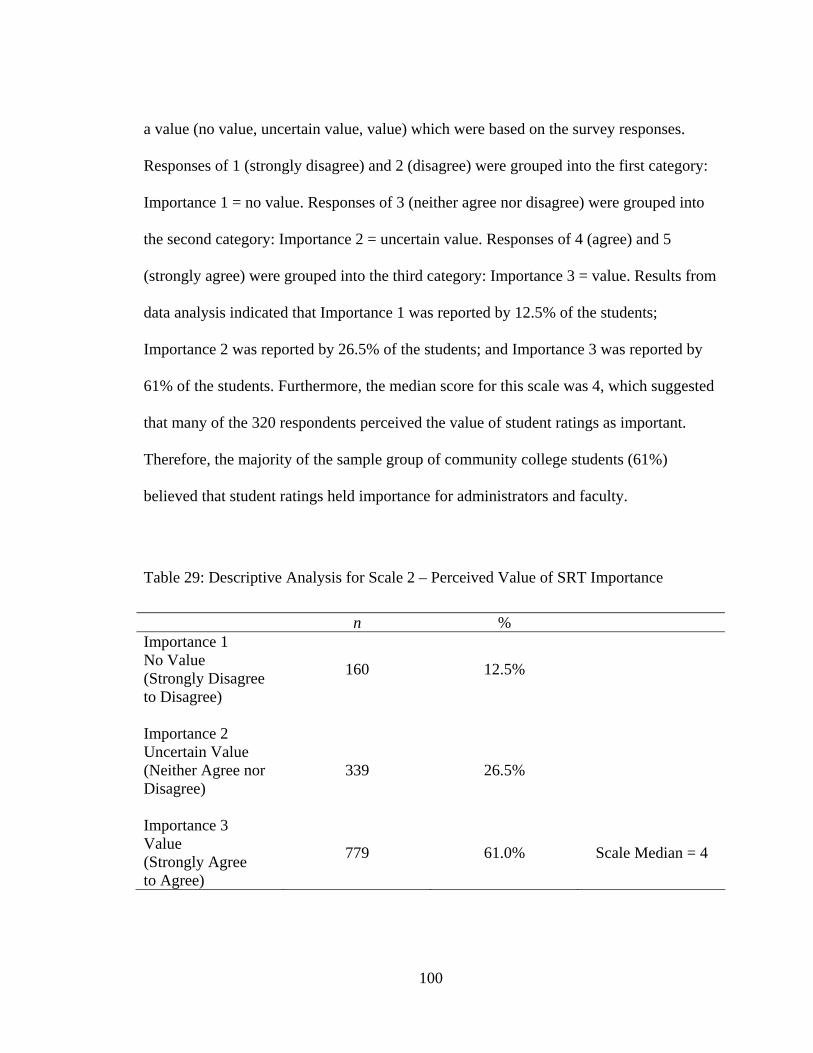
a value (no value, uncertain value, value) which were based on the survey responses.
Responses of 1 (strongly disagree) and 2 (disagree) were grouped into the first category:
Importance 1 = no value. Responses of 3 (neither agree nor disagree) were grouped into
the second category: Importance 2 = uncertain value. Responses of 4 (agree) and 5
(strongly agree) were grouped into the third category: Importance 3 = value. Results from
data analysis indicated that Importance 1 was reported by 12.5% of the students;
Importance 2 was reported by 26.5% of the students; and Importance 3 was reported by
61% of the students. Furthermore, the median score for this scale was 4, which suggested
that many of the 320 respondents perceived the value of student ratings as important.
Therefore, the majority of the sample group of community college students (61%)
believed that student ratings held importance for administrators and faculty.
Table 29: Descriptive Analysis for Scale 2 – Perceived Value of SRT Importance
n % Importance 1 No Value (Strongly Disagree to Disagree)
160 12.5%
Importance 2 Uncertain Value (Neither Agree nor Disagree)
339 26.5%
Importance 3 Value (Strongly Agree to Agree)
779 61.0%
Scale Median = 4
100
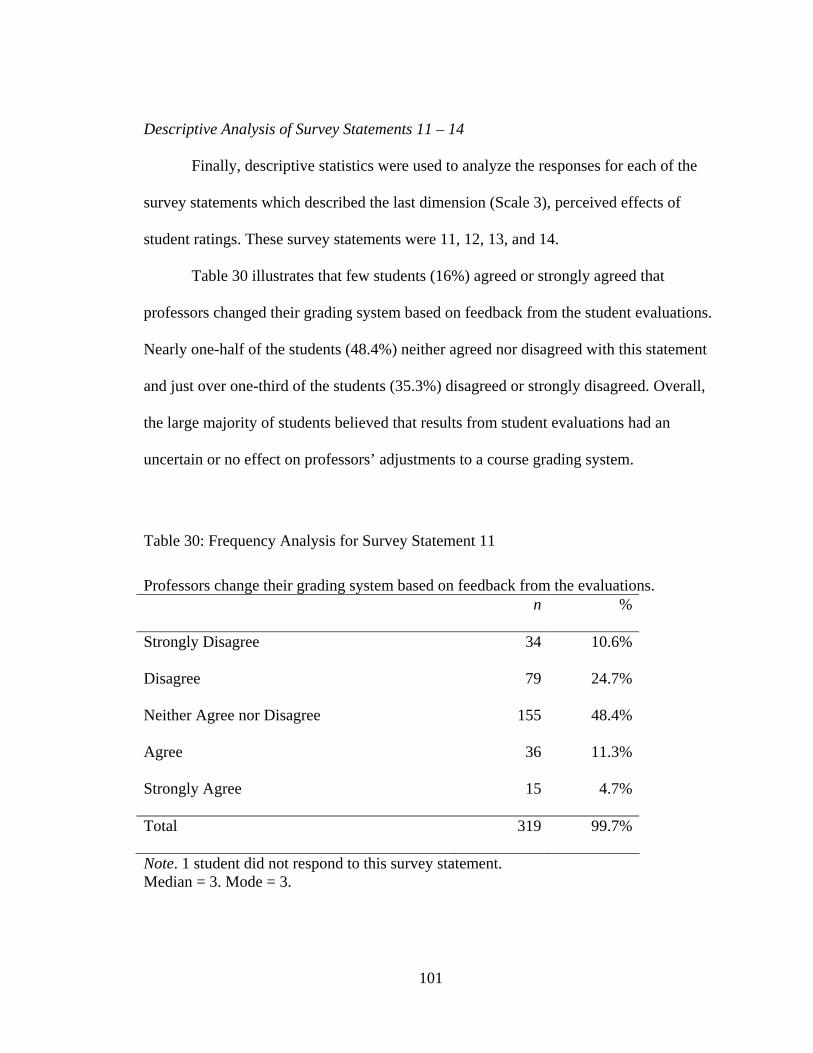
Descriptive Analysis of Survey Statements 11 – 14
Finally, descriptive statistics were used to analyze the responses for each of the
survey statements which described the last dimension (Scale 3), perceived effects of
student ratings. These survey statements were 11, 12, 13, and 14.
Table 30 illustrates that few students (16%) agreed or strongly agreed that
professors changed their grading system based on feedback from the student evaluations.
Nearly one-half of the students (48.4%) neither agreed nor disagreed with this statement
and just over one-third of the students (35.3%) disagreed or strongly disagreed. Overall,
the large majority of students believed that results from student evaluations had an
uncertain or no effect on professors’ adjustments to a course grading system.
Table 30: Frequency Analysis for Survey Statement 11
Professors change their grading system based on feedback from the evaluations. n %
Strongly Disagree 34 10.6%
Disagree 79 24.7%
Neither Agree nor Disagree 155 48.4%
Agree 36 11.3%
Strongly Agree 15 4.7%
Total 319 99.7%
Note. 1 student did not respond to this survey statement. Median = 3. Mode = 3.
101
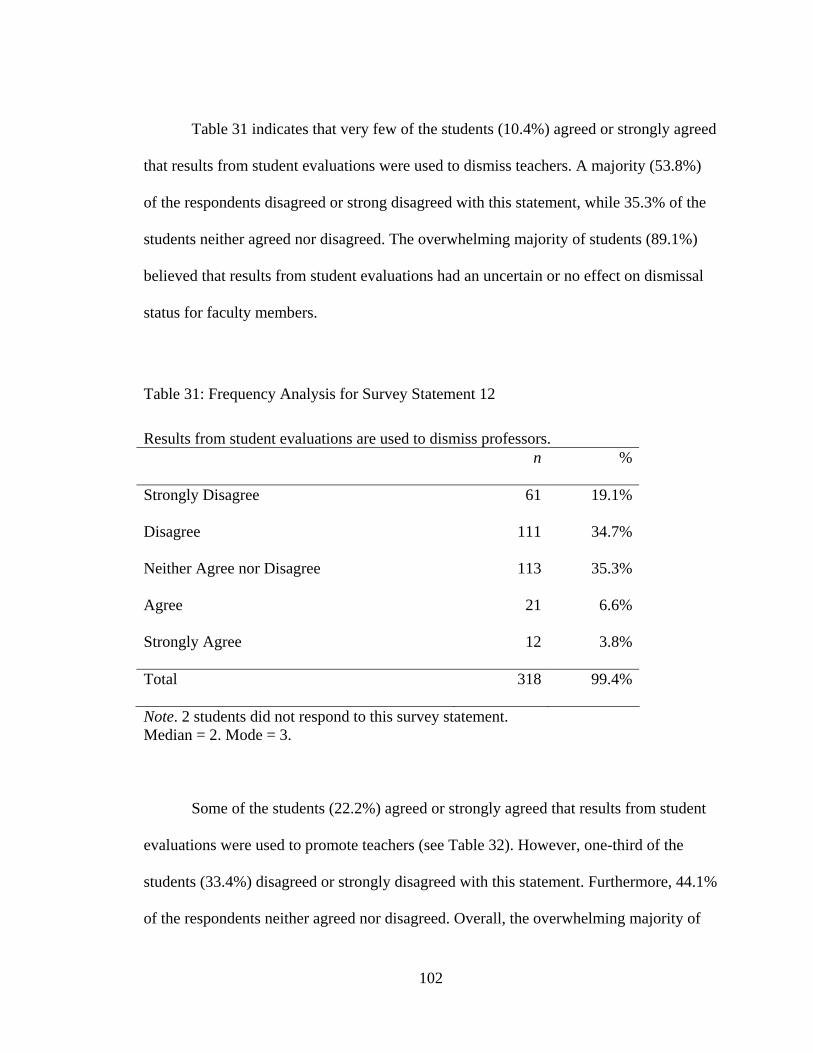
Table 31 indicates that very few of the students (10.4%) agreed or strongly agreed
that results from student evaluations were used to dismiss teachers. A majority (53.8%)
of the respondents disagreed or strong disagreed with this statement, while 35.3% of the
students neither agreed nor disagreed. The overwhelming majority of students (89.1%)
believed that results from student evaluations had an uncertain or no effect on dismissal
status for faculty members.
Table 31: Frequency Analysis for Survey Statement 12
Results from student evaluations are used to dismiss professors. n %
Strongly Disagree 61 19.1%
Disagree 111 34.7%
Neither Agree nor Disagree 113 35.3%
Agree 21 6.6%
Strongly Agree 12 3.8%
Total 318 99.4%
Note. 2 students did not respond to this survey statement. Median = 2. Mode = 3.
Some of the students (22.2%) agreed or strongly agreed that results from student
evaluations were used to promote teachers (see Table 32). However, one-third of the
students (33.4%) disagreed or strongly disagreed with this statement. Furthermore, 44.1%
of the respondents neither agreed nor disagreed. Overall, the overwhelming majority of
102
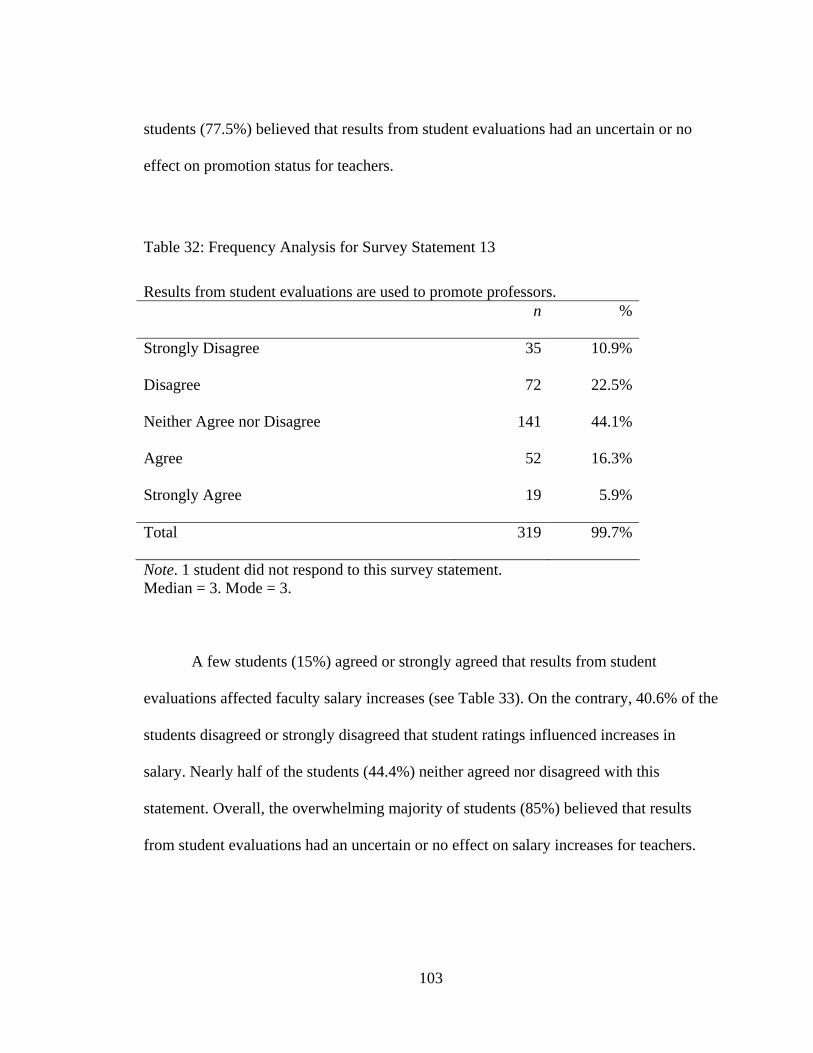
students (77.5%) believed that results from student evaluations had an uncertain or no
effect on promotion status for teachers.
Table 32: Frequency Analysis for Survey Statement 13
Results from student evaluations are used to promote professors. n %
Strongly Disagree 35 10.9%
Disagree 72 22.5%
Neither Agree nor Disagree 141 44.1%
Agree 52 16.3%
Strongly Agree 19 5.9%
Total 319 99.7%
Note. 1 student did not respond to this survey statement. Median = 3. Mode = 3.
A few students (15%) agreed or strongly agreed that results from student
evaluations affected faculty salary increases (see Table 33). On the contrary, 40.6% of the
students disagreed or strongly disagreed that student ratings influenced increases in
salary. Nearly half of the students (44.4%) neither agreed nor disagreed with this
statement. Overall, the overwhelming majority of students (85%) believed that results
from student evaluations had an uncertain or no effect on salary increases for teachers.
103
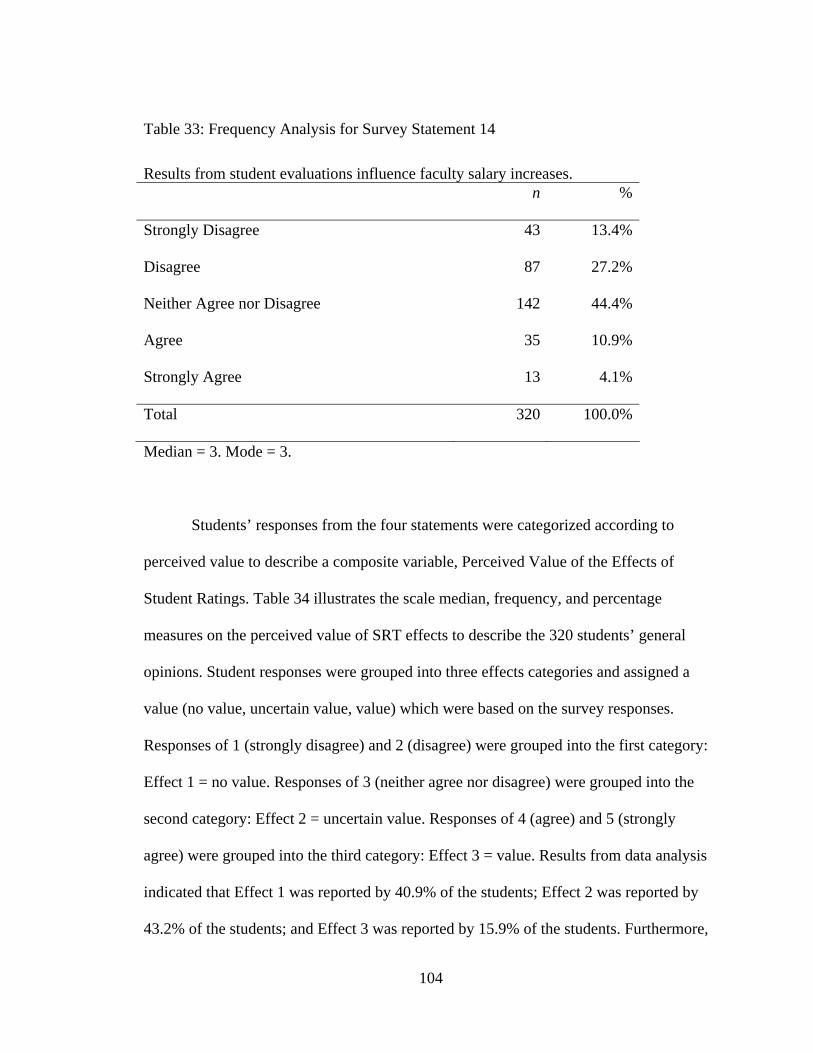
Table 33: Frequency Analysis for Survey Statement 14
Results from student evaluations influence faculty salary increases. n %
Strongly Disagree 43 13.4%
Disagree 87 27.2%
Neither Agree nor Disagree 142 44.4%
Agree 35 10.9%
Strongly Agree 13 4.1%
Total 320 100.0%
Median = 3. Mode = 3.
Students’ responses from the four statements were categorized according to
perceived value to describe a composite variable, Perceived Value of the Effects of
Student Ratings. Table 34 illustrates the scale median, frequency, and percentage
measures on the perceived value of SRT effects to describe the 320 students’ general
opinions. Student responses were grouped into three effects categories and assigned a
value (no value, uncertain value, value) which were based on the survey responses.
Responses of 1 (strongly disagree) and 2 (disagree) were grouped into the first category:
Effect 1 = no value. Responses of 3 (neither agree nor disagree) were grouped into the
second category: Effect 2 = uncertain value. Responses of 4 (agree) and 5 (strongly
agree) were grouped into the third category: Effect 3 = value. Results from data analysis
indicated that Effect 1 was reported by 40.9% of the students; Effect 2 was reported by
43.2% of the students; and Effect 3 was reported by 15.9% of the students. Furthermore,
104
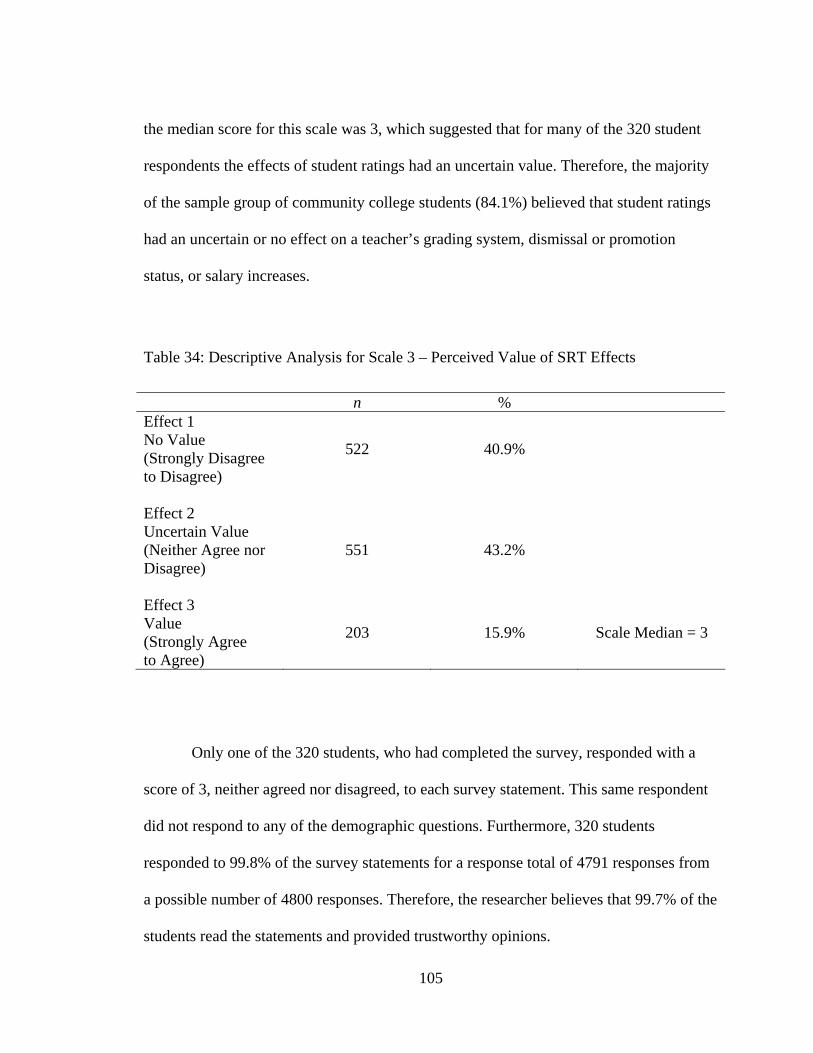
the median score for this scale was 3, which suggested that for many of the 320 student
respondents the effects of student ratings had an uncertain value. Therefore, the majority
of the sample group of community college students (84.1%) believed that student ratings
had an uncertain or no effect on a teacher’s grading system, dismissal or promotion
status, or salary increases.
Table 34: Descriptive Analysis for Scale 3 – Perceived Value of SRT Effects
n % Effect 1 No Value (Strongly Disagree to Disagree)
522 40.9%
Effect 2 Uncertain Value (Neither Agree nor Disagree)
551 43.2%
Effect 3 Value (Strongly Agree to Agree)
203 15.9%
Scale Median = 3
Only one of the 320 students, who had completed the survey, responded with a
score of 3, neither agreed nor disagreed, to each survey statement. This same respondent
did not respond to any of the demographic questions. Furthermore, 320 students
responded to 99.8% of the survey statements for a response total of 4791 responses from
a possible number of 4800 responses. Therefore, the researcher believes that 99.7% of the
students read the statements and provided trustworthy opinions.
105
Qualitative Analysis of Student Comments
Students were provided the opportunity to include a written comment on the
survey form. It was noteworthy that 124 students, which represented 39% of the 320
respondents, entered comments. The majority of respondents were female (70%). Each
response was evaluated and coded into one of the three dimensions: Beliefs about Student
Ratings = 1, Importance of Student Ratings = 2, and Effects of Student Ratings = 3.
Comments not related to one of these scales were included in a separate category and
coded: General Comments = 4. Such general comments (17%, n = 21) might have
referred to a particular instructor or college and were not directly related to the student
ratings practice. One example of a student comment which was coded into the General
Comments category was given by a respondent who stated, “I believe that some
instructors are very easy going and others are not. Some of them help the students with
difficulties and some don’t. Most of my teachers were great.” Also, several comments in
the General Comments category were from students who thanked the researcher for
inviting them to participate in the study and expressed their appreciation for being asked
their opinions.
Once the scale category was determined for each comment, the comments which
related to beliefs, importance, or effects received a second code. This code reflected the
student’s perceived value of student ratings as follows: no value = 1, uncertain value = 2,
and value = 3. Table 35 illustrates the frequency and percentage for each of the comments
according to 1 of the 4 categories: beliefs, importance, effects, and general. The table also
provides a summary of the comments according to value: no value, uncertain value, and
value.
106
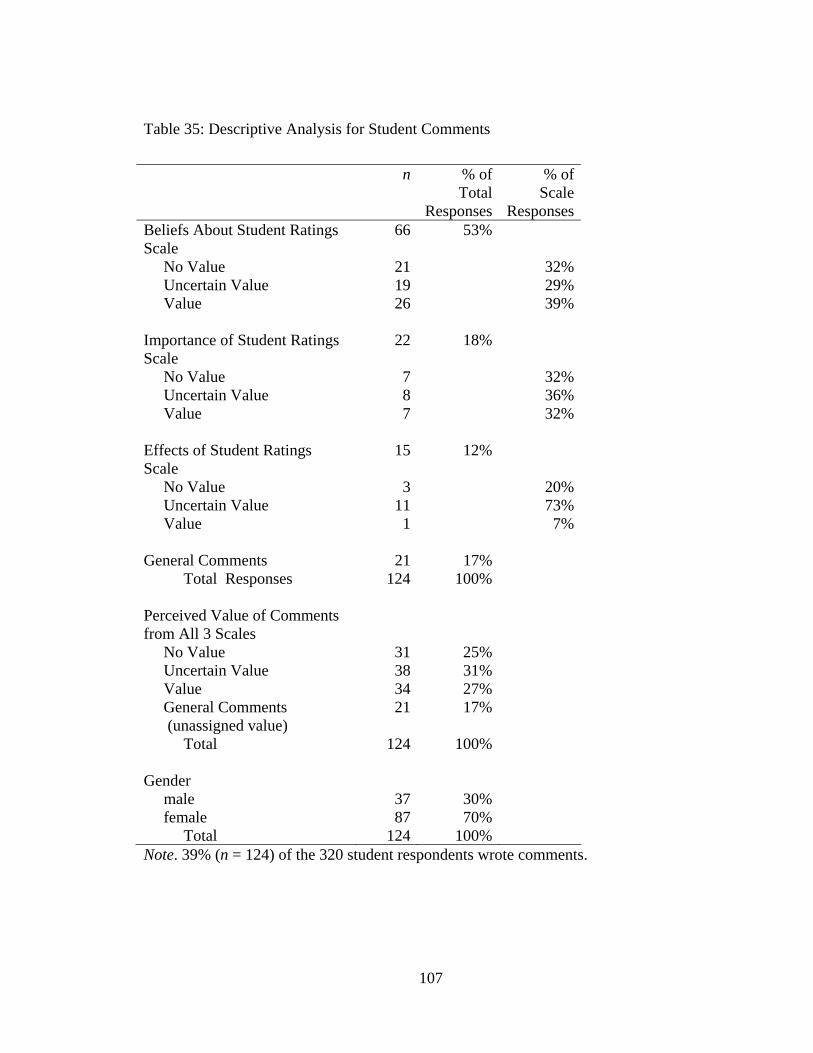
Table 35: Descriptive Analysis for Student Comments
n % of Total
Responses
% of Scale
Responses Beliefs About Student Ratings Scale
66 53%
No Value 21 32% Uncertain Value 19 29% Value 26 39% Importance of Student Ratings Scale
22 18%
No Value 7 32% Uncertain Value 8 36% Value 7 32% Effects of Student Ratings Scale
15 12%
No Value 3 20% Uncertain Value 11 73% Value 1 7% General Comments 21 17% Total Responses 124 100% Perceived Value of Comments from All 3 Scales
No Value 31 25% Uncertain Value 38 31% Value 34 27% General Comments (unassigned value)
21 17%
Total 124 100% Gender male 37 30% female 87 70% Total 124 100% Note. 39% (n = 124) of the 320 student respondents wrote comments.
107
In category 1, perceived beliefs about student ratings, the most frequent
comments reflected the belief that student ratings had value (39%, n = 26). However,
32% (n = 21) of the students who expressed an opinion in this category disagreed that
student ratings had value. One example of a student comment which was coded into the
Beliefs about Student Ratings category was given by a student who wrote, “Most students
usually fill out the form in 30 seconds and just pick a line and fill. Not very effective.”
This comment was coded 1, 1. The first number represented category 1, Beliefs about
Student Ratings, and the second number represented perceived value. This participant’s
response indicated that the student believed ratings had no perceived value.
Seven students (32%) commented on the perceived importance of student ratings
by indicating that ratings were important to the instructors and administrators. A student
commented, “I believe that professors should know how students assess them and they
should be able to look at their teaching methods and improve upon them.” This was
coded 2, 3. For this student, student ratings were important and had value. However, 36%
(n = 8) of the students who made a comment regarding the importance of student ratings
for instructors or administrators were uncertain if student evaluations had value.
Eleven students (73%) who commented on the effects of student ratings were
uncertain about how the results from student ratings were used. Most of the students in
this category expressed an interest in knowing how the student evaluations were used.
For example, one student stated, “I am not sure as to how the information obtained from
evaluations are used. This is why most of my answers are 3s. I would like to know more
on how they are used. Also, I feel evaluations should be administered later in the
semester. Students might be more serious about filling them out if they know how the
108

information was used and the impact it would have.” This was coded 3, 2. The student is
uncertain of the effects of student ratings. Overall, the most frequent written comment
(31%) from the total of the 3 scales indicated that students perceived students ratings as
having an uncertain value (n = 38).
Research Question 3
What were the Florida community college faculty member respondents’
perceptions of the student evaluation process and its impact on instruction? In this study,
process and practice were terms used to denote the customary action or series of actions
leading to the use of student rating forms to evaluate teaching effectiveness. The data
from the faculty responses to the survey (Appendix G) and to the interview questions
(Appendix E) were used to address Research Question 3. First, inferential statistics were
used to test the null hypothesis that there was no statistically significant mean difference
on the total Grading Faculty survey responses between student and faculty. Next, the
qualitative methods and procedures outlined by Moustakas (1994) were used to organize
and analyze the transcribed interviews and to develop a composite statement highlighting
the essence of student ratings for the faculty group. According to Moustakas, “In
accordance with phenomenological principles, scientific investigation is valid when the
knowledge sought is arrived at through descriptions that make possible an understanding
of the meanings and essences of experience” (p. 84). By choosing to do qualitative
research, the researcher wanted to examine the individual experiences with the SRT
practice for community college colleagues. Through personal contact and small group
discussions with 21 faculty members from 5 Florida community colleges, the researcher
109
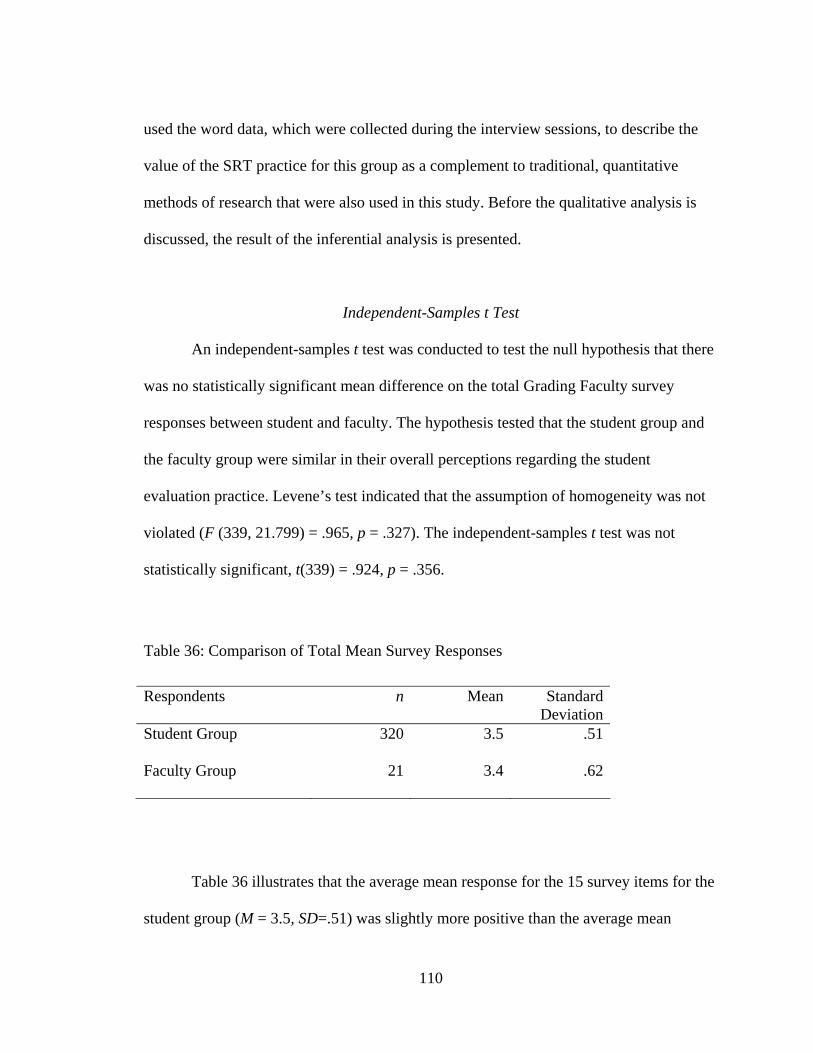
used the word data, which were collected during the interview sessions, to describe the
value of the SRT practice for this group as a complement to traditional, quantitative
methods of research that were also used in this study. Before the qualitative analysis is
discussed, the result of the inferential analysis is presented.
Independent-Samples t Test
An independent-samples t test was conducted to test the null hypothesis that there
was no statistically significant mean difference on the total Grading Faculty survey
responses between student and faculty. The hypothesis tested that the student group and
the faculty group were similar in their overall perceptions regarding the student
evaluation practice. Levene’s test indicated that the assumption of homogeneity was not
violated (F (339, 21.799) = .965, p = .327). The independent-samples t test was not
statistically significant, t(339) = .924, p = .356.
Table 36: Comparison of Total Mean Survey Responses
Respondents n Mean Standard Deviation
Student Group 320 3.5 .51
Faculty Group 21 3.4 .62
Table 36 illustrates that the average mean response for the 15 survey items for the
student group (M = 3.5, SD=.51) was slightly more positive than the average mean
110
response for the faculty group (M = 3.4, SD=.62). The 95% confidence interval for the
difference in means ranged from -.120 to .334. The null hypothesis was not rejected. The
effect size (d = .21) indicated a small difference between the means of the two groups.
Qualitative Analysis
The Moustakas method which was used to organize and analyze the faculty
transcripts was his modification of the phenomenological data analysis methods
suggested by Stevick-Colaizzi-Keen (Moustakas, 1994). The Moustakas’ approach
analyzes the verbatim descriptions for each respondent. One adjustment to the
Moustakas’ method was made. Since this study involved small focus groups of faculty
members, the analysis of each transcript reflected not one individual’s experience but
each separate college group’s experience with student ratings. In order to construct the
composite or essence statement, each interview experience was analyzed through a series
of processes: Epoche, Phenomenological Reduction, Imaginative Variation, and
Synthesis (Moustakas). The essence statement represented the combined descriptions of
the participants’ experiences with student evaluations. This statement reflected a
summary of the descriptive analysis regarding the faculty participants’ perceptions of
student evaluations and how the results from student evaluations impact instruction.
The initial process of phenomenological analysis required the researcher to
dismiss personal experiences with student evaluations in order for the interviews and data
interpretation to be understood through the experiences of the participants. The researcher
had personal experiences with SRTs as both a faculty member, who had been evaluated
by students for more than 10 years, and as a department chairperson, who used results
111
from SRTs when evaluating full time and adjunct faculty teaching effectiveness within
the department. Therefore, through the first process or Epoche phase, the researcher was
required to set “aside predilections, prejudices, predispositions, and allowing things,
events, and people to enter anew into consciousness, and to look and see them again, as if
for the first time” (Moustaksas, 1994, p. 85). This was a conscious activity that the
researcher engaged in during the interviews and the analysis phases.
To complete the second process of phenomenological reduction, the researcher
engaged in a series of four steps: bracketing, horizonalizing, clustering, and organizing.
In developing the interview questions (Appendix E), the researcher focused or bracketed
each question on the phenomenon of student evaluations. During the interviews, the
researcher noted that the respondents would occasionally digress from the topic of
student ratings to discuss related academic topics. Although each statement was initially
considered as having equal value, each statement that was not related to the topic was
deleted as part of the data reduction phase through a process Moustakas described as
horizonalizing. Therefore, only relevant and non-repetitive statements which pertained to
Research Questions 3 were listed and became the raw data for analysis. These statements
are the “invariant horizons or meaning units of the experience” (Moustakas, 1994, p.
122). Next, these invariant meaning units were clustered into core themes. From these
core themes, a textural description of the student ratings experience was constructed for
the faculty group; this is a description of what happened.
The third process included using a technique Moustakas (1994) described as
imaginative variation. This action involved examining the data for all possible meanings,
searching for varied opinions, and adjusting the point of view in order to develop a
112
structural description for the faculty group; this is a description of how the phenomenon
was experience. Finally, a composite textural-structural description of the student ratings
experience was presented. This represented the synthesis of meanings and essences (the
value of student ratings) for the faculty group.
Phenomenological Analysis of Faculty Transcriptions
The researcher selected the mixed methodology to provide both the quantitative
data typically collected in research and the qualitative data gathered through a
naturalistic, personal contact with each participant. According to Moustakas (1994),
“The method of reflection that occurs throughout the phenomenological approach
provides a logical, systematic, and coherent resource for carrying out the analysis and
synthesis needed to arrive at essential descriptions of experience” (p. 47). In designing
this study, the researcher sought to understand the personal perspectives and experiences
that community college colleagues had with the student ratings practice. The researcher
felt this could be best achieved through personal interview sessions. The philosophical
perspective of the phenomenological approach provided a unique way for investigation.
In phenomenological studies the investigator abstains from making suppositions, focuses on a specific topic freshly and naively, constructs a question or problem to guide the study, and derives findings that will provide the basis for further research and reflection. In phenomenological science a relationship always exists between the external perceptions of natural objects and internal perceptions, memories, and judgments. (Moustakas, 1994, p. 47) Each faculty interview session was conducted at the 5 respective community
colleges between November 2004 and February 2005. Each interview session was audio
taped and lasted approximately 90 minutes. A total of 21 faculty (female = 13, male = 8)
113
participated in the different sessions (see Table 6 for the faculty demographic profile).
Faculty members were primarily full time, tenured, associate professors who taught in the
associate of arts general education program (n = 8) or the associate of science/associate of
applied science programs (n = 6). The average number of years of higher education
teaching was 16 years.
Phenomenological Reduction
In the analysis phase of phenomenological data reduction, every significant
statement was given equal value. Moustakas (1994) described this process as
horizonalization. As applied here, the researcher considered every statement related to
student evaluations as important. Next, statements not related to the student evaluation
topic and repetitive statements were deleted as part of the data reduction phase. Through
this action, only the horizons or invariant constituents remained (Moustakas). Table 37
illustrates the verbatim examples extracted from the faculty transcriptions that reflected
the respondents’ perceptions of the teacher evaluation practice and its impact on
instruction. This sample of significant statements from the extensive transcripts revealed
some of the invariant horizons or meaning units of the SRT experience for the
community college faculty participants.
114
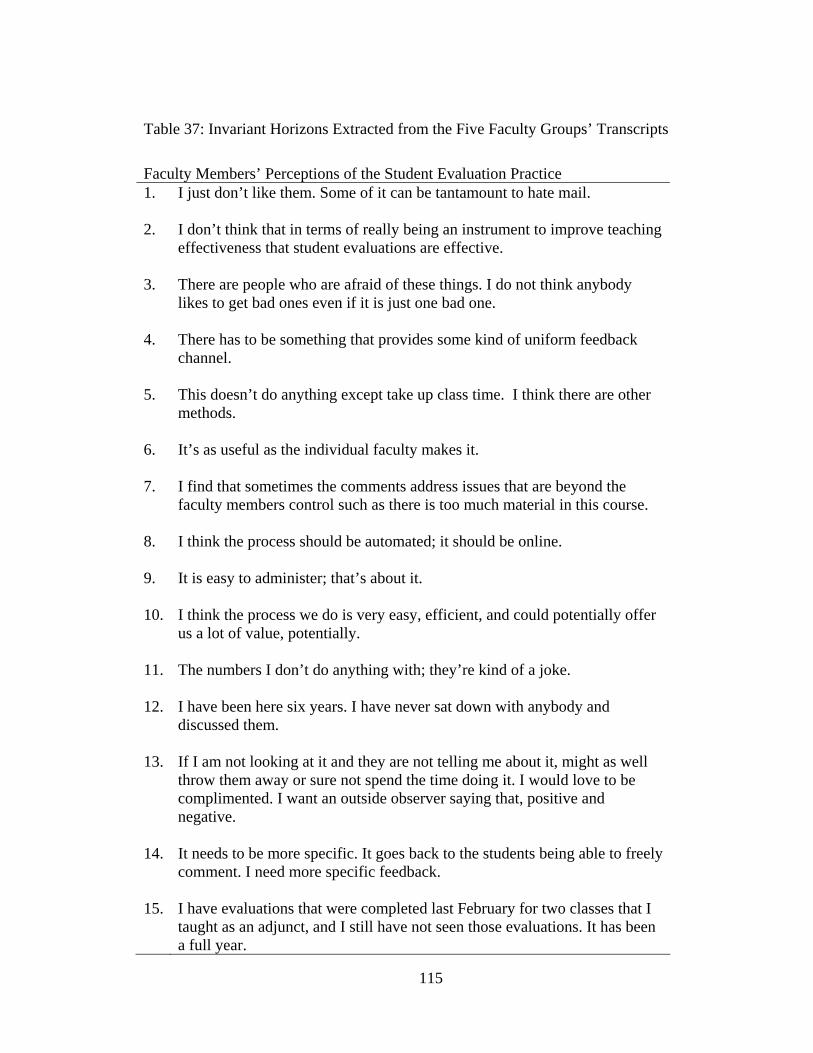
Table 37: Invariant Horizons Extracted from the Five Faculty Groups’ Transcripts
Faculty Members’ Perceptions of the Student Evaluation Practice 1. I just don’t like them. Some of it can be tantamount to hate mail.
2. I don’t think that in terms of really being an instrument to improve teaching effectiveness that student evaluations are effective.
3. There are people who are afraid of these things. I do not think anybody likes to get bad ones even if it is just one bad one.
4. There has to be something that provides some kind of uniform feedback channel.
5. This doesn’t do anything except take up class time. I think there are other methods.
6. It’s as useful as the individual faculty makes it.
7. I find that sometimes the comments address issues that are beyond the faculty members control such as there is too much material in this course.
8. I think the process should be automated; it should be online.
9. It is easy to administer; that’s about it.
10. I think the process we do is very easy, efficient, and could potentially offer us a lot of value, potentially.
11. The numbers I don’t do anything with; they’re kind of a joke.
12. I have been here six years. I have never sat down with anybody and discussed them.
13. If I am not looking at it and they are not telling me about it, might as well throw them away or sure not spend the time doing it. I would love to be complimented. I want an outside observer saying that, positive and negative.
14. It needs to be more specific. It goes back to the students being able to freely comment. I need more specific feedback.
15. I have evaluations that were completed last February for two classes that I taught as an adjunct, and I still have not seen those evaluations. It has been a full year.
115
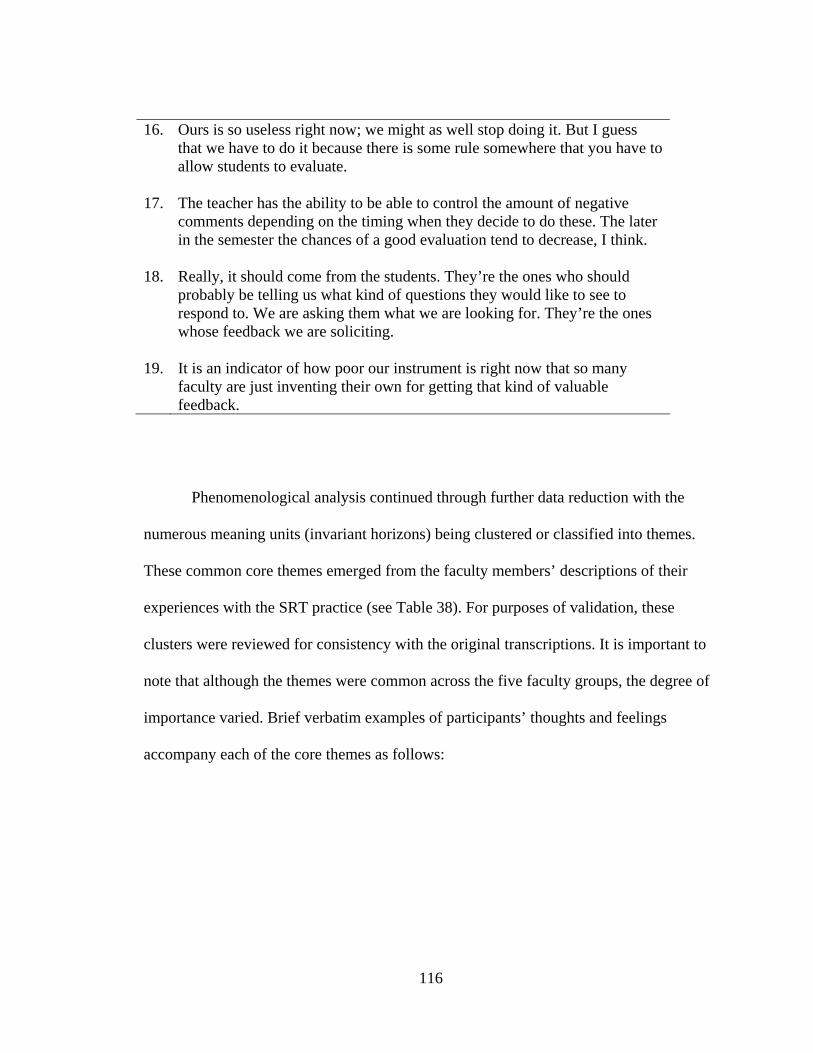
16. Ours is so useless right now; we might as well stop doing it. But I guess that we have to do it because there is some rule somewhere that you have to allow students to evaluate.
17. The teacher has the ability to be able to control the amount of negative comments depending on the timing when they decide to do these. The later in the semester the chances of a good evaluation tend to decrease, I think.
18. Really, it should come from the students. They’re the ones who should probably be telling us what kind of questions they would like to see to respond to. We are asking them what we are looking for. They’re the ones whose feedback we are soliciting.
19. It is an indicator of how poor our instrument is right now that so many faculty are just inventing their own for getting that kind of valuable feedback.
Phenomenological analysis continued through further data reduction with the
numerous meaning units (invariant horizons) being clustered or classified into themes.
These common core themes emerged from the faculty members’ descriptions of their
experiences with the SRT practice (see Table 38). For purposes of validation, these
clusters were reviewed for consistency with the original transcriptions. It is important to
note that although the themes were common across the five faculty groups, the degree of
importance varied. Brief verbatim examples of participants’ thoughts and feelings
accompany each of the core themes as follows:
116
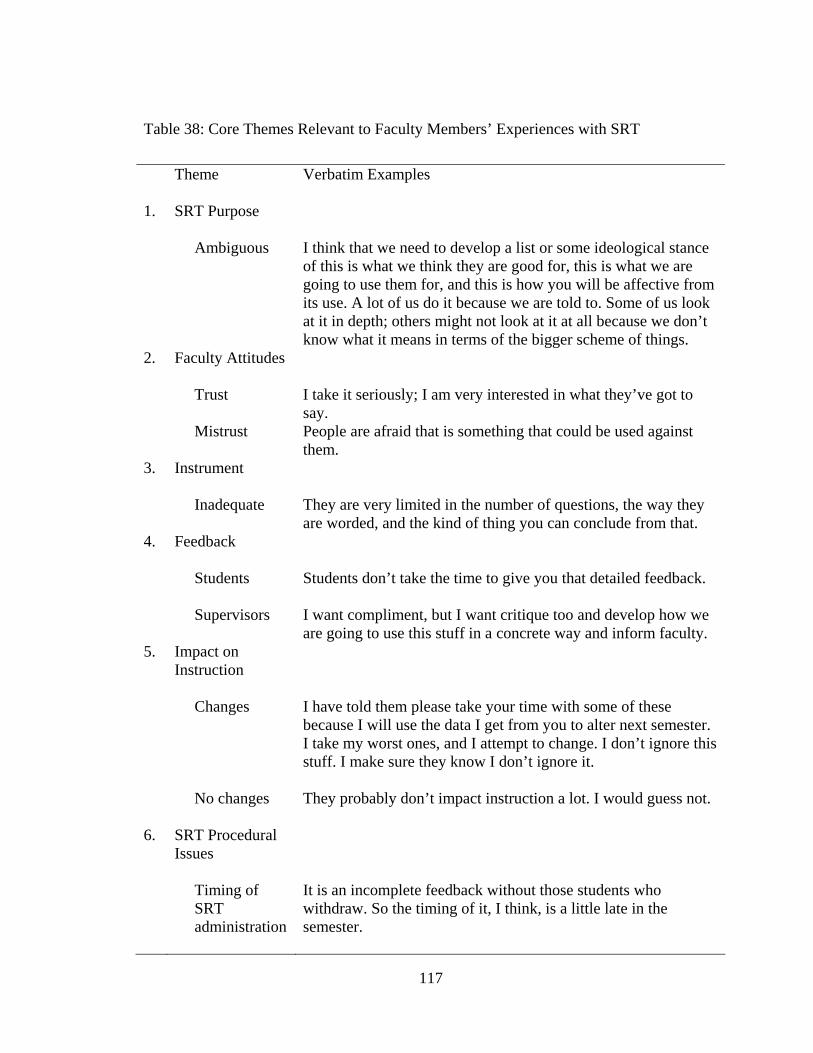
Table 38: Core Themes Relevant to Faculty Members’ Experiences with SRT
Theme Verbatim Examples
1. SRT Purpose
Ambiguous
I think that we need to develop a list or some ideological stance of this is what we think they are good for, this is what we are going to use them for, and this is how you will be affective from its use. A lot of us do it because we are told to. Some of us look at it in depth; others might not look at it at all because we don’t know what it means in terms of the bigger scheme of things.
2. Faculty Attitudes
Trust I take it seriously; I am very interested in what they’ve got to say.
Mistrust People are afraid that is something that could be used against them.
3. Instrument
Inadequate They are very limited in the number of questions, the way they are worded, and the kind of thing you can conclude from that.
4. Feedback
Students Students don’t take the time to give you that detailed feedback.
Supervisors I want compliment, but I want critique too and develop how we are going to use this stuff in a concrete way and inform faculty.
5. Impact on Instruction
Changes I have told them please take your time with some of these because I will use the data I get from you to alter next semester. I take my worst ones, and I attempt to change. I don’t ignore this stuff. I make sure they know I don’t ignore it.
No changes They probably don’t impact instruction a lot. I would guess not.
6. SRT Procedural Issues
Timing of SRT administration
It is an incomplete feedback without those students who withdraw. So the timing of it, I think, is a little late in the semester.
117
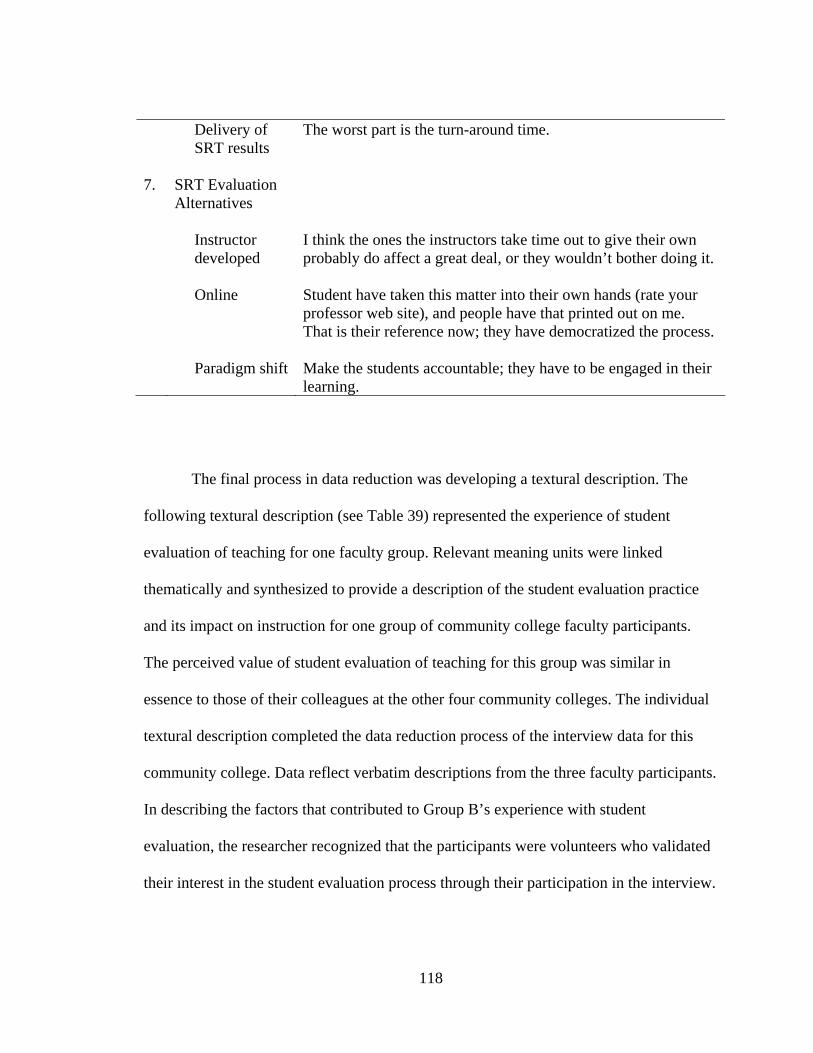
Delivery of SRT results
The worst part is the turn-around time.
7. SRT Evaluation Alternatives
Instructor developed
I think the ones the instructors take time out to give their own probably do affect a great deal, or they wouldn’t bother doing it.
Online
Student have taken this matter into their own hands (rate your professor web site), and people have that printed out on me. That is their reference now; they have democratized the process.
Paradigm shift Make the students accountable; they have to be engaged in their learning.
The final process in data reduction was developing a textural description. The
following textural description (see Table 39) represented the experience of student
evaluation of teaching for one faculty group. Relevant meaning units were linked
thematically and synthesized to provide a description of the student evaluation practice
and its impact on instruction for one group of community college faculty participants.
The perceived value of student evaluation of teaching for this group was similar in
essence to those of their colleagues at the other four community colleges. The individual
textural description completed the data reduction process of the interview data for this
community college. Data reflect verbatim descriptions from the three faculty participants.
In describing the factors that contributed to Group B’s experience with student
evaluation, the researcher recognized that the participants were volunteers who validated
their interest in the student evaluation process through their participation in the interview.
118
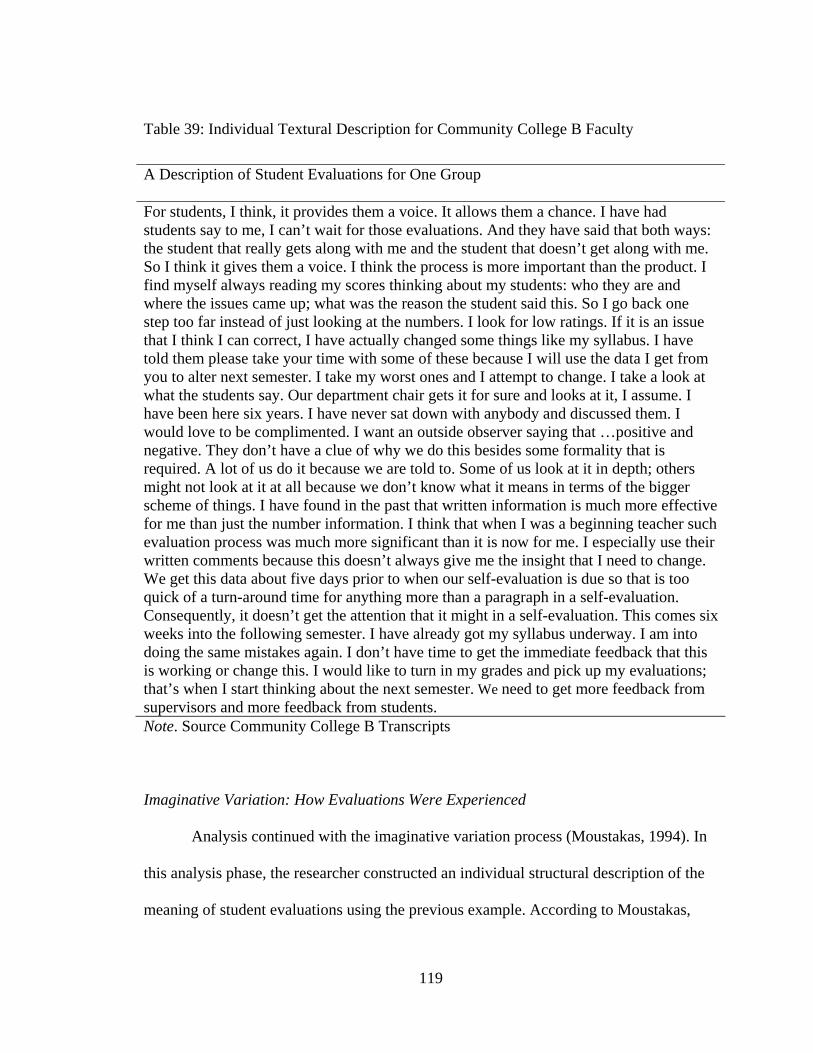
Table 39: Individual Textural Description for Community College B Faculty
A Description of Student Evaluations for One Group For students, I think, it provides them a voice. It allows them a chance. I have had students say to me, I can’t wait for those evaluations. And they have said that both ways: the student that really gets along with me and the student that doesn’t get along with me. So I think it gives them a voice. I think the process is more important than the product. I find myself always reading my scores thinking about my students: who they are and where the issues came up; what was the reason the student said this. So I go back one step too far instead of just looking at the numbers. I look for low ratings. If it is an issue that I think I can correct, I have actually changed some things like my syllabus. I have told them please take your time with some of these because I will use the data I get from you to alter next semester. I take my worst ones and I attempt to change. I take a look at what the students say. Our department chair gets it for sure and looks at it, I assume. I have been here six years. I have never sat down with anybody and discussed them. I would love to be complimented. I want an outside observer saying that …positive and negative. They don’t have a clue of why we do this besides some formality that is required. A lot of us do it because we are told to. Some of us look at it in depth; others might not look at it at all because we don’t know what it means in terms of the bigger scheme of things. I have found in the past that written information is much more effective for me than just the number information. I think that when I was a beginning teacher such evaluation process was much more significant than it is now for me. I especially use their written comments because this doesn’t always give me the insight that I need to change. We get this data about five days prior to when our self-evaluation is due so that is too quick of a turn-around time for anything more than a paragraph in a self-evaluation. Consequently, it doesn’t get the attention that it might in a self-evaluation. This comes six weeks into the following semester. I have already got my syllabus underway. I am into doing the same mistakes again. I don’t have time to get the immediate feedback that this is working or change this. I would like to turn in my grades and pick up my evaluations; that’s when I start thinking about the next semester. We need to get more feedback from supervisors and more feedback from students. Note. Source Community College B Transcripts
Imaginative Variation: How Evaluations Were Experienced
Analysis continued with the imaginative variation process (Moustakas, 1994). In
this analysis phase, the researcher constructed an individual structural description of the
meaning of student evaluations using the previous example. According to Moustakas,
119
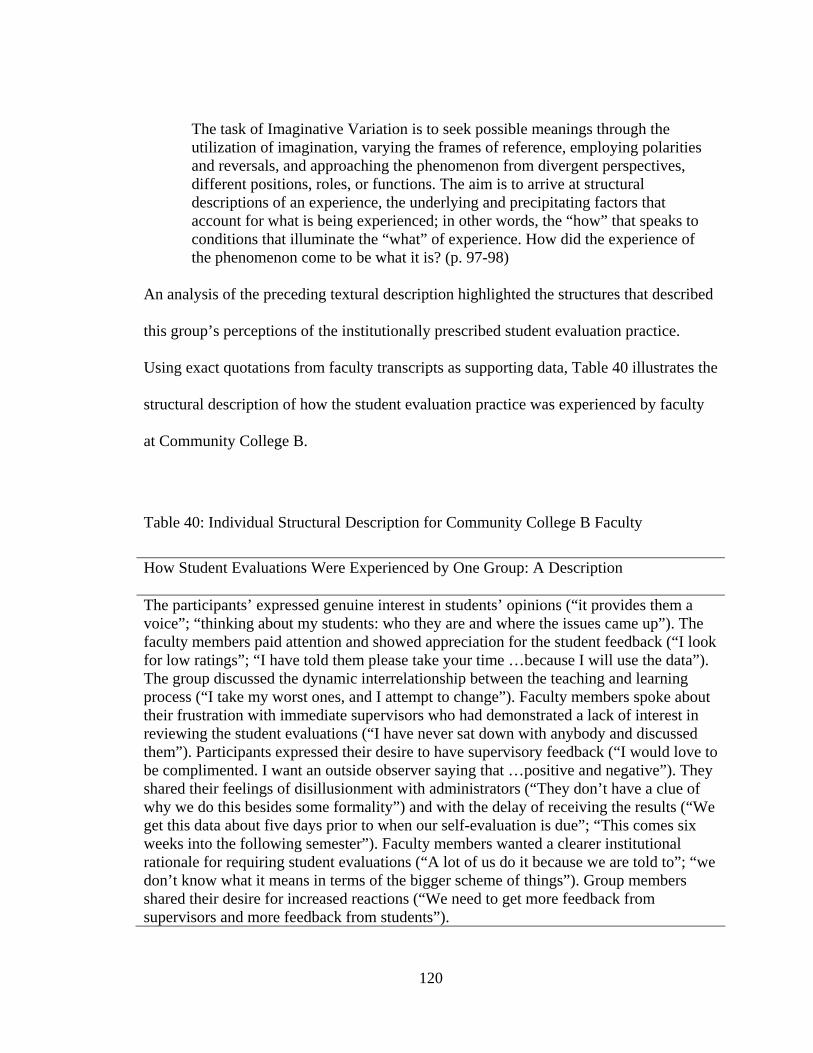
The task of Imaginative Variation is to seek possible meanings through the utilization of imagination, varying the frames of reference, employing polarities and reversals, and approaching the phenomenon from divergent perspectives, different positions, roles, or functions. The aim is to arrive at structural descriptions of an experience, the underlying and precipitating factors that account for what is being experienced; in other words, the “how” that speaks to conditions that illuminate the “what” of experience. How did the experience of the phenomenon come to be what it is? (p. 97-98)
An analysis of the preceding textural description highlighted the structures that described
this group’s perceptions of the institutionally prescribed student evaluation practice.
Using exact quotations from faculty transcripts as supporting data, Table 40 illustrates the
structural description of how the student evaluation practice was experienced by faculty
at Community College B.
Table 40: Individual Structural Description for Community College B Faculty
How Student Evaluations Were Experienced by One Group: A Description The participants’ expressed genuine interest in students’ opinions (“it provides them a voice”; “thinking about my students: who they are and where the issues came up”). The faculty members paid attention and showed appreciation for the student feedback (“I look for low ratings”; “I have told them please take your time …because I will use the data”). The group discussed the dynamic interrelationship between the teaching and learning process (“I take my worst ones, and I attempt to change”). Faculty members spoke about their frustration with immediate supervisors who had demonstrated a lack of interest in reviewing the student evaluations (“I have never sat down with anybody and discussed them”). Participants expressed their desire to have supervisory feedback (“I would love to be complimented. I want an outside observer saying that …positive and negative”). They shared their feelings of disillusionment with administrators (“They don’t have a clue of why we do this besides some formality”) and with the delay of receiving the results (“We get this data about five days prior to when our self-evaluation is due”; “This comes six weeks into the following semester”). Faculty members wanted a clearer institutional rationale for requiring student evaluations (“A lot of us do it because we are told to”; “we don’t know what it means in terms of the bigger scheme of things”). Group members shared their desire for increased reactions (“We need to get more feedback from supervisors and more feedback from students”).
120
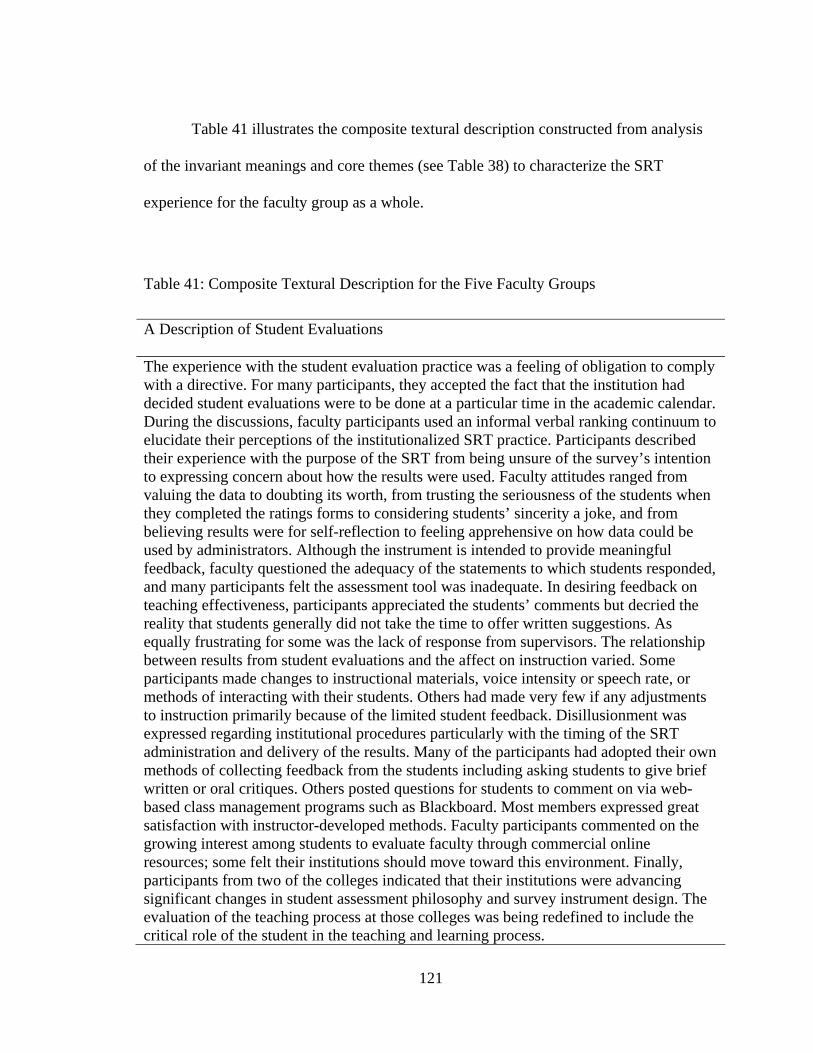
Table 41 illustrates the composite textural description constructed from analysis
of the invariant meanings and core themes (see Table 38) to characterize the SRT
experience for the faculty group as a whole.
Table 41: Composite Textural Description for the Five Faculty Groups
A Description of Student Evaluations The experience with the student evaluation practice was a feeling of obligation to comply with a directive. For many participants, they accepted the fact that the institution had decided student evaluations were to be done at a particular time in the academic calendar. During the discussions, faculty participants used an informal verbal ranking continuum to elucidate their perceptions of the institutionalized SRT practice. Participants described their experience with the purpose of the SRT from being unsure of the survey’s intention to expressing concern about how the results were used. Faculty attitudes ranged from valuing the data to doubting its worth, from trusting the seriousness of the students when they completed the ratings forms to considering students’ sincerity a joke, and from believing results were for self-reflection to feeling apprehensive on how data could be used by administrators. Although the instrument is intended to provide meaningful feedback, faculty questioned the adequacy of the statements to which students responded, and many participants felt the assessment tool was inadequate. In desiring feedback on teaching effectiveness, participants appreciated the students’ comments but decried the reality that students generally did not take the time to offer written suggestions. As equally frustrating for some was the lack of response from supervisors. The relationship between results from student evaluations and the affect on instruction varied. Some participants made changes to instructional materials, voice intensity or speech rate, or methods of interacting with their students. Others had made very few if any adjustments to instruction primarily because of the limited student feedback. Disillusionment was expressed regarding institutional procedures particularly with the timing of the SRT administration and delivery of the results. Many of the participants had adopted their own methods of collecting feedback from the students including asking students to give brief written or oral critiques. Others posted questions for students to comment on via web-based class management programs such as Blackboard. Most members expressed great satisfaction with instructor-developed methods. Faculty participants commented on the growing interest among students to evaluate faculty through commercial online resources; some felt their institutions should move toward this environment. Finally, participants from two of the colleges indicated that their institutions were advancing significant changes in student assessment philosophy and survey instrument design. The evaluation of the teaching process at those colleges was being redefined to include the critical role of the student in the teaching and learning process.
121
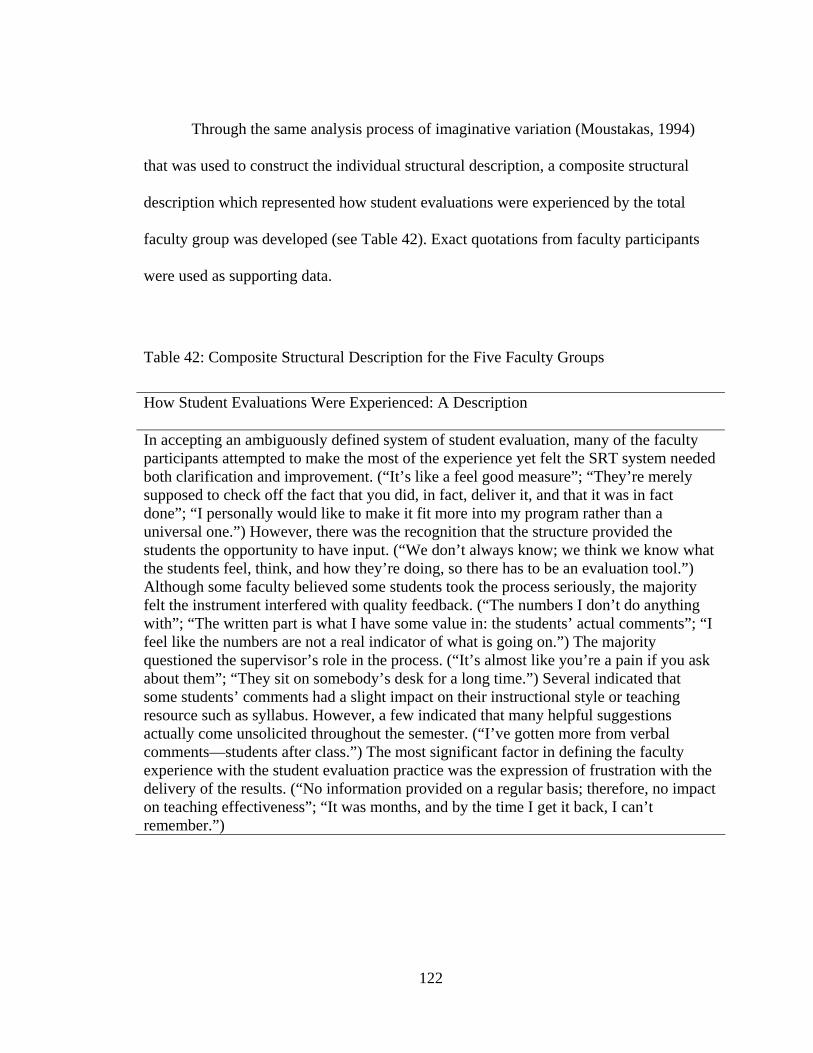
Through the same analysis process of imaginative variation (Moustakas, 1994)
that was used to construct the individual structural description, a composite structural
description which represented how student evaluations were experienced by the total
faculty group was developed (see Table 42). Exact quotations from faculty participants
were used as supporting data.
Table 42: Composite Structural Description for the Five Faculty Groups
How Student Evaluations Were Experienced: A Description In accepting an ambiguously defined system of student evaluation, many of the faculty participants attempted to make the most of the experience yet felt the SRT system needed both clarification and improvement. (“It’s like a feel good measure”; “They’re merely supposed to check off the fact that you did, in fact, deliver it, and that it was in fact done”; “I personally would like to make it fit more into my program rather than a universal one.”) However, there was the recognition that the structure provided the students the opportunity to have input. (“We don’t always know; we think we know what the students feel, think, and how they’re doing, so there has to be an evaluation tool.”) Although some faculty believed some students took the process seriously, the majority felt the instrument interfered with quality feedback. (“The numbers I don’t do anything with”; “The written part is what I have some value in: the students’ actual comments”; “I feel like the numbers are not a real indicator of what is going on.”) The majority questioned the supervisor’s role in the process. (“It’s almost like you’re a pain if you ask about them”; “They sit on somebody’s desk for a long time.”) Several indicated that some students’ comments had a slight impact on their instructional style or teaching resource such as syllabus. However, a few indicated that many helpful suggestions actually come unsolicited throughout the semester. (“I’ve gotten more from verbal comments—students after class.”) The most significant factor in defining the faculty experience with the student evaluation practice was the expression of frustration with the delivery of the results. (“No information provided on a regular basis; therefore, no impact on teaching effectiveness”; “It was months, and by the time I get it back, I can’t remember.”)
122
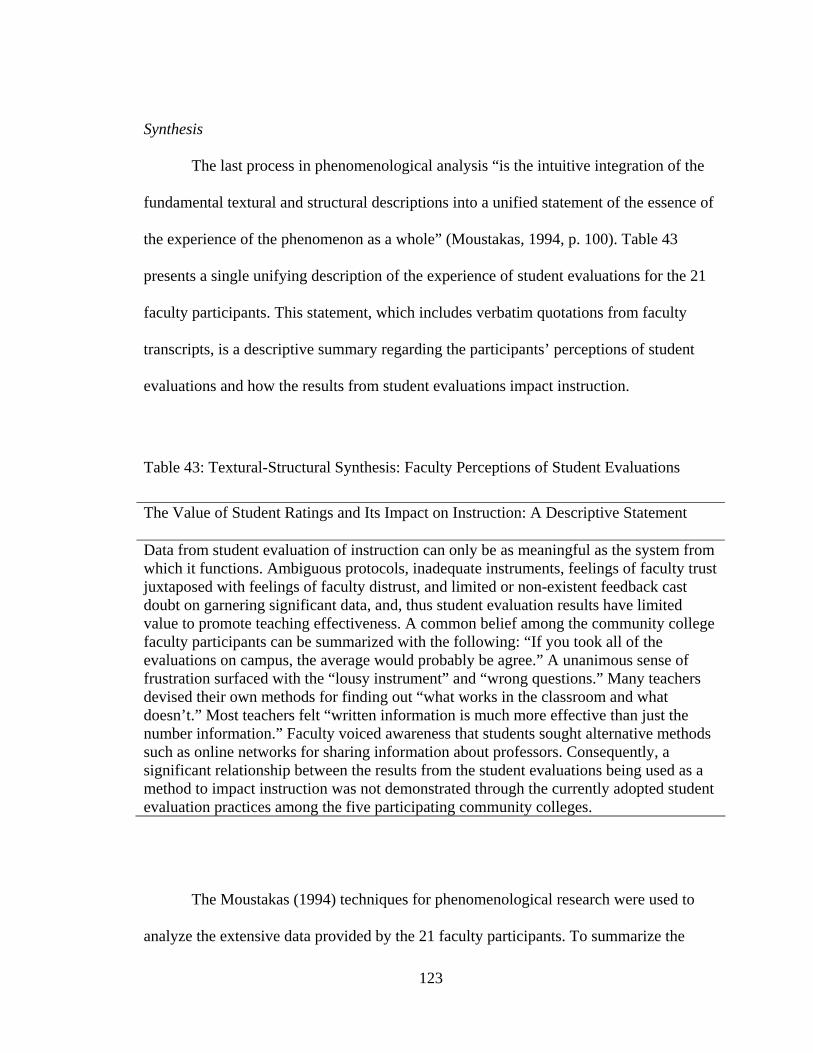
Synthesis
The last process in phenomenological analysis “is the intuitive integration of the
fundamental textural and structural descriptions into a unified statement of the essence of
the experience of the phenomenon as a whole” (Moustakas, 1994, p. 100). Table 43
presents a single unifying description of the experience of student evaluations for the 21
faculty participants. This statement, which includes verbatim quotations from faculty
transcripts, is a descriptive summary regarding the participants’ perceptions of student
evaluations and how the results from student evaluations impact instruction.
Table 43: Textural-Structural Synthesis: Faculty Perceptions of Student Evaluations
The Value of Student Ratings and Its Impact on Instruction: A Descriptive Statement Data from student evaluation of instruction can only be as meaningful as the system from which it functions. Ambiguous protocols, inadequate instruments, feelings of faculty trust juxtaposed with feelings of faculty distrust, and limited or non-existent feedback cast doubt on garnering significant data, and, thus student evaluation results have limited value to promote teaching effectiveness. A common belief among the community college faculty participants can be summarized with the following: “If you took all of the evaluations on campus, the average would probably be agree.” A unanimous sense of frustration surfaced with the “lousy instrument” and “wrong questions.” Many teachers devised their own methods for finding out “what works in the classroom and what doesn’t.” Most teachers felt “written information is much more effective than just the number information.” Faculty voiced awareness that students sought alternative methods such as online networks for sharing information about professors. Consequently, a significant relationship between the results from the student evaluations being used as a method to impact instruction was not demonstrated through the currently adopted student evaluation practices among the five participating community colleges.
The Moustakas (1994) techniques for phenomenological research were used to
analyze the extensive data provided by the 21 faculty participants. To summarize the
123
descriptions of their experiences with student ratings, the following perceptions regarding
the student evaluation practice were noted: (a) Most of the faculty participants’ did not
believe that there was a significant relationship between the institutionally adopted
formal practice of student evaluation and the numeric data typically collected from
student evaluations as being a valuable source to influence instruction; (b) Most faculty
participants expressed their general frustration with inadequately designed instruments,
ineffective methods of receiving ratings results, and limited or non-existent feedback
from supervisors; and (c) Many of these teachers had designed their own methods for
receiving feedback from their students. They placed greater value on this information.
Research Question 4
What were the Florida community college administrators’ perceptions of the
student evaluation process and its impact on instruction and faculty evaluation? The
phenomenological data analysis approach advanced by Moustakas (1994) was used to
organize and analyze the data collected from the questionnaire (Appendix D) which was
used during the administrator interview sessions. One adjustment to the Moustakas’
method was made. The Moustakas’ approach analyzes the verbatim descriptions from
each respondent. Since this study involved small focus groups of administrators, the
analysis of each transcript reflected not one individual’s experience but each separate
college group’s experience with student ratings. In order to construct the composite or
essence statement, each interview experience was analyzed through a series of processes:
Epoch, Phenomenological Reduction, Imaginative Variation, and Synthesis (Moustakas,
124
1994). These data analysis processes were outlined in the previous section which
presented the sequence for phenomenological investigation of Research Question 3.
Qualitative Analysis
Each administrator interview session was conducted at the 5 respective
community colleges between November 2004 and February 2005. Each interview session
was audio taped and lasted approximately 90 minutes. A total of 17 administrators
(female = 9, male = 8) participated in the different sessions (see Table 7 for administrator
demographic profile). More deans or assistant deans (41.2%, n = 7)) participated in the
interview sessions. Academic vice presidents from three of the five community colleges
joined in one of the five interview sessions. All sessions were conducted on the same day
as the faculty interview sessions, whereas the survey administration to the student groups
occurred over a period of one or more days.
Phenomenological Reduction
In the analysis phase of phenomenological data reduction, every significant
statement was given equal value. Moustakas (1994) described this process as
horizonalization. As applied here, the researcher considered every statement related to
student evaluations as important. Next, statements not related to the student evaluation
topic and repetitive statements were deleted. Through this action, only the horizons or
invariant constituents remained (Moustakas). The following statements (see Table 44) are
verbatim examples extracted from the administrator transcriptions that reflected the
respondents’ perceptions of the student evaluation practice and its impact on instruction
125
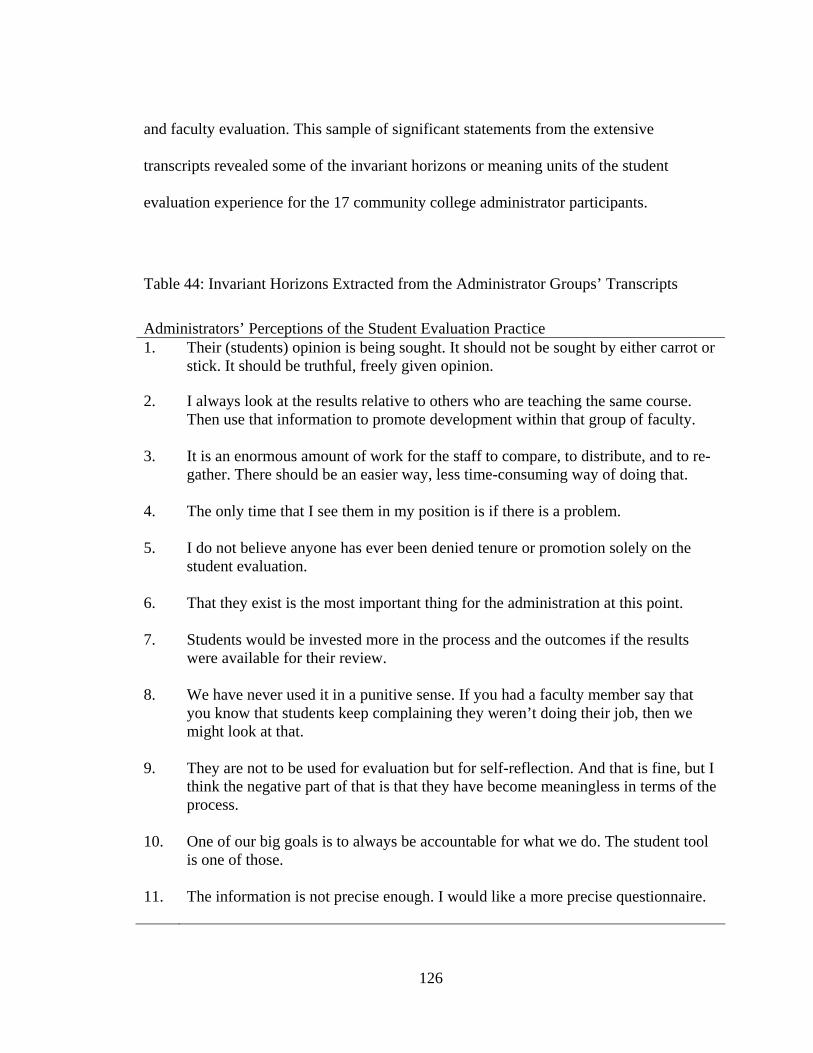
and faculty evaluation. This sample of significant statements from the extensive
transcripts revealed some of the invariant horizons or meaning units of the student
evaluation experience for the 17 community college administrator participants.
Table 44: Invariant Horizons Extracted from the Administrator Groups’ Transcripts
Administrators’ Perceptions of the Student Evaluation Practice 1. Their (students) opinion is being sought. It should not be sought by either carrot or
stick. It should be truthful, freely given opinion.
2. I always look at the results relative to others who are teaching the same course. Then use that information to promote development within that group of faculty.
3. It is an enormous amount of work for the staff to compare, to distribute, and to re-gather. There should be an easier way, less time-consuming way of doing that.
4. The only time that I see them in my position is if there is a problem.
5. I do not believe anyone has ever been denied tenure or promotion solely on the student evaluation.
6. That they exist is the most important thing for the administration at this point.
7. Students would be invested more in the process and the outcomes if the results were available for their review.
8. We have never used it in a punitive sense. If you had a faculty member say that you know that students keep complaining they weren’t doing their job, then we might look at that.
9. They are not to be used for evaluation but for self-reflection. And that is fine, but I think the negative part of that is that they have become meaningless in terms of the process.
10. One of our big goals is to always be accountable for what we do. The student tool is one of those.
11. The information is not precise enough. I would like a more precise questionnaire.
126
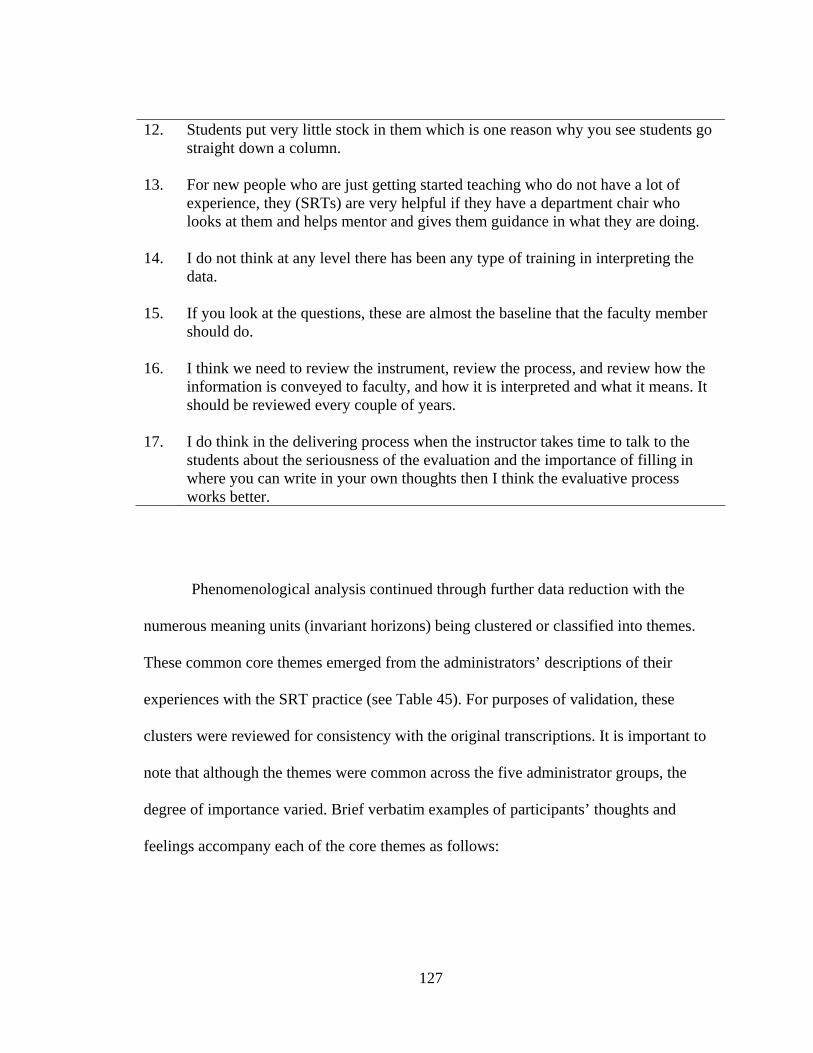
12. Students put very little stock in them which is one reason why you see students go straight down a column.
13. For new people who are just getting started teaching who do not have a lot of experience, they (SRTs) are very helpful if they have a department chair who looks at them and helps mentor and gives them guidance in what they are doing.
14. I do not think at any level there has been any type of training in interpreting the data.
15. If you look at the questions, these are almost the baseline that the faculty member should do.
16. I think we need to review the instrument, review the process, and review how the information is conveyed to faculty, and how it is interpreted and what it means. It should be reviewed every couple of years.
17. I do think in the delivering process when the instructor takes time to talk to the students about the seriousness of the evaluation and the importance of filling in where you can write in your own thoughts then I think the evaluative process works better.
Phenomenological analysis continued through further data reduction with the
numerous meaning units (invariant horizons) being clustered or classified into themes.
These common core themes emerged from the administrators’ descriptions of their
experiences with the SRT practice (see Table 45). For purposes of validation, these
clusters were reviewed for consistency with the original transcriptions. It is important to
note that although the themes were common across the five administrator groups, the
degree of importance varied. Brief verbatim examples of participants’ thoughts and
feelings accompany each of the core themes as follows:
127
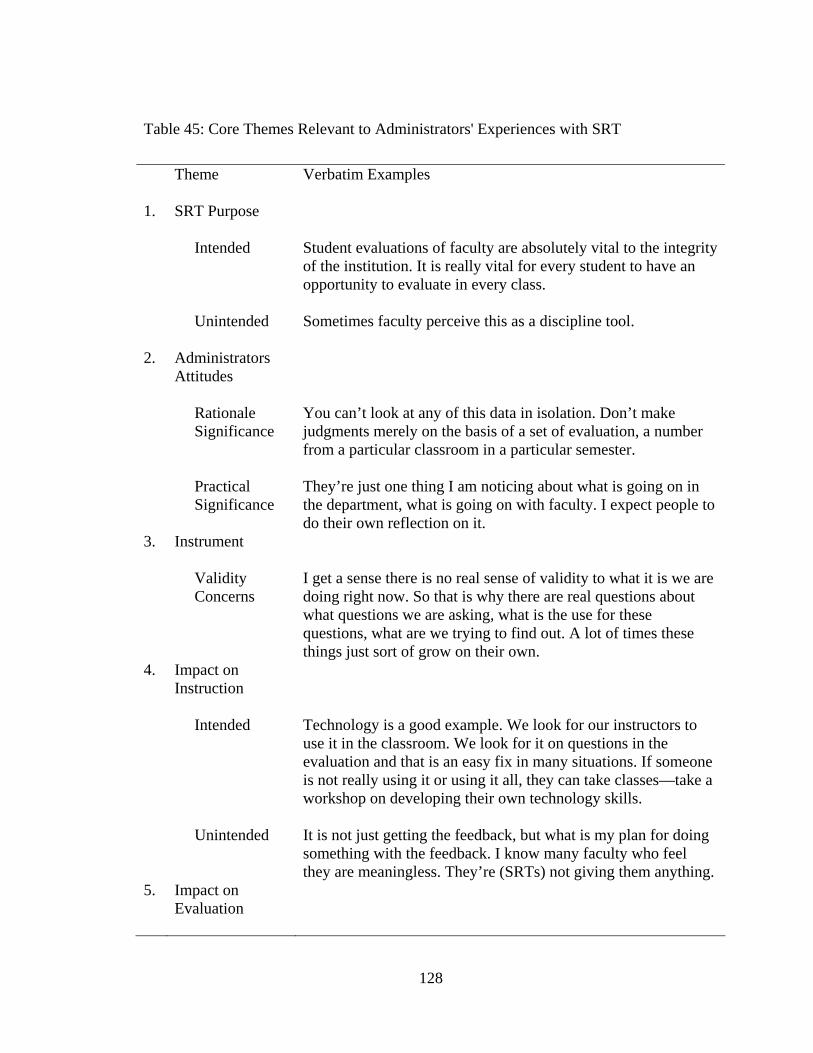
Table 45: Core Themes Relevant to Administrators' Experiences with SRT
Theme Verbatim Examples
1. SRT Purpose
Intended Student evaluations of faculty are absolutely vital to the integrity of the institution. It is really vital for every student to have an opportunity to evaluate in every class.
Unintended Sometimes faculty perceive this as a discipline tool.
2. Administrators Attitudes
Rationale Significance
You can’t look at any of this data in isolation. Don’t make judgments merely on the basis of a set of evaluation, a number from a particular classroom in a particular semester.
Practical Significance
They’re just one thing I am noticing about what is going on in the department, what is going on with faculty. I expect people to do their own reflection on it.
3. Instrument
Validity Concerns
I get a sense there is no real sense of validity to what it is we are doing right now. So that is why there are real questions about what questions we are asking, what is the use for these questions, what are we trying to find out. A lot of times these things just sort of grow on their own.
4. Impact on Instruction
Intended Technology is a good example. We look for our instructors to use it in the classroom. We look for it on questions in the evaluation and that is an easy fix in many situations. If someone is not really using it or using it all, they can take classes—take a workshop on developing their own technology skills.
Unintended It is not just getting the feedback, but what is my plan for doing something with the feedback. I know many faculty who feel they are meaningless. They’re (SRTs) not giving them anything.
5. Impact on Evaluation
128
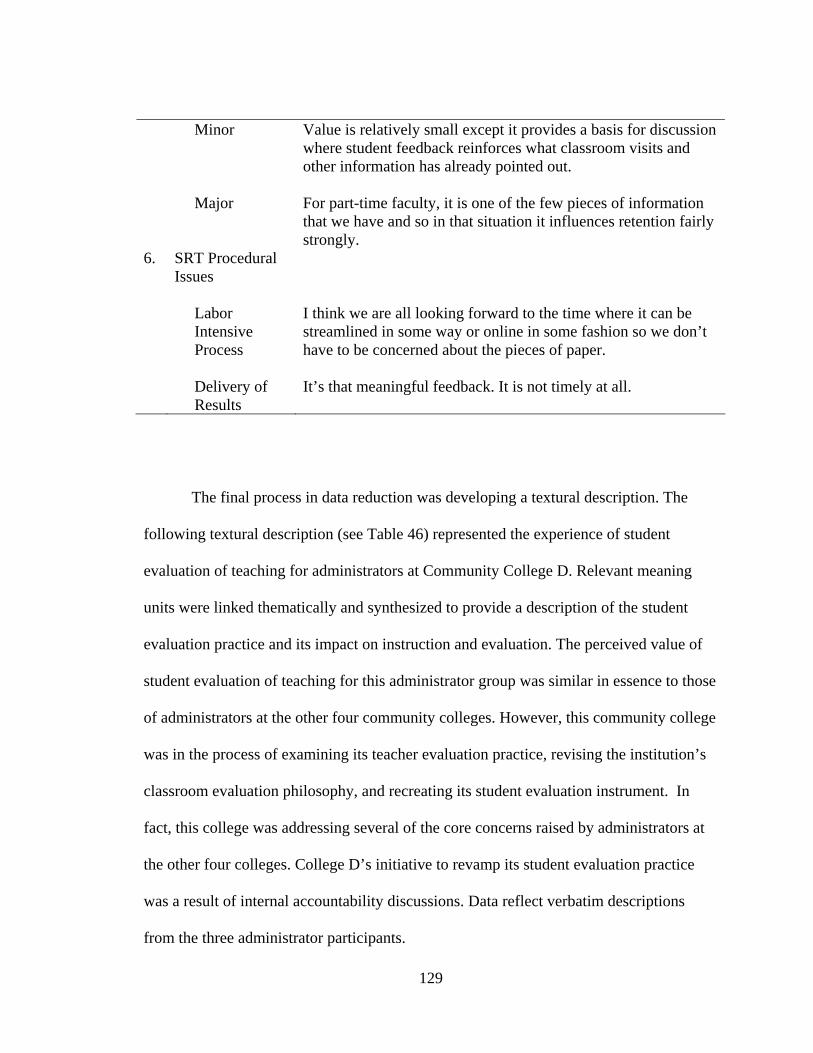
Minor Value is relatively small except it provides a basis for discussion where student feedback reinforces what classroom visits and other information has already pointed out.
Major For part-time faculty, it is one of the few pieces of information that we have and so in that situation it influences retention fairly strongly.
6. SRT Procedural Issues
Labor Intensive Process
I think we are all looking forward to the time where it can be streamlined in some way or online in some fashion so we don’t have to be concerned about the pieces of paper.
Delivery of Results
It’s that meaningful feedback. It is not timely at all.
The final process in data reduction was developing a textural description. The
following textural description (see Table 46) represented the experience of student
evaluation of teaching for administrators at Community College D. Relevant meaning
units were linked thematically and synthesized to provide a description of the student
evaluation practice and its impact on instruction and evaluation. The perceived value of
student evaluation of teaching for this administrator group was similar in essence to those
of administrators at the other four community colleges. However, this community college
was in the process of examining its teacher evaluation practice, revising the institution’s
classroom evaluation philosophy, and recreating its student evaluation instrument. In
fact, this college was addressing several of the core concerns raised by administrators at
the other four colleges. College D’s initiative to revamp its student evaluation practice
was a result of internal accountability discussions. Data reflect verbatim descriptions
from the three administrator participants.
129
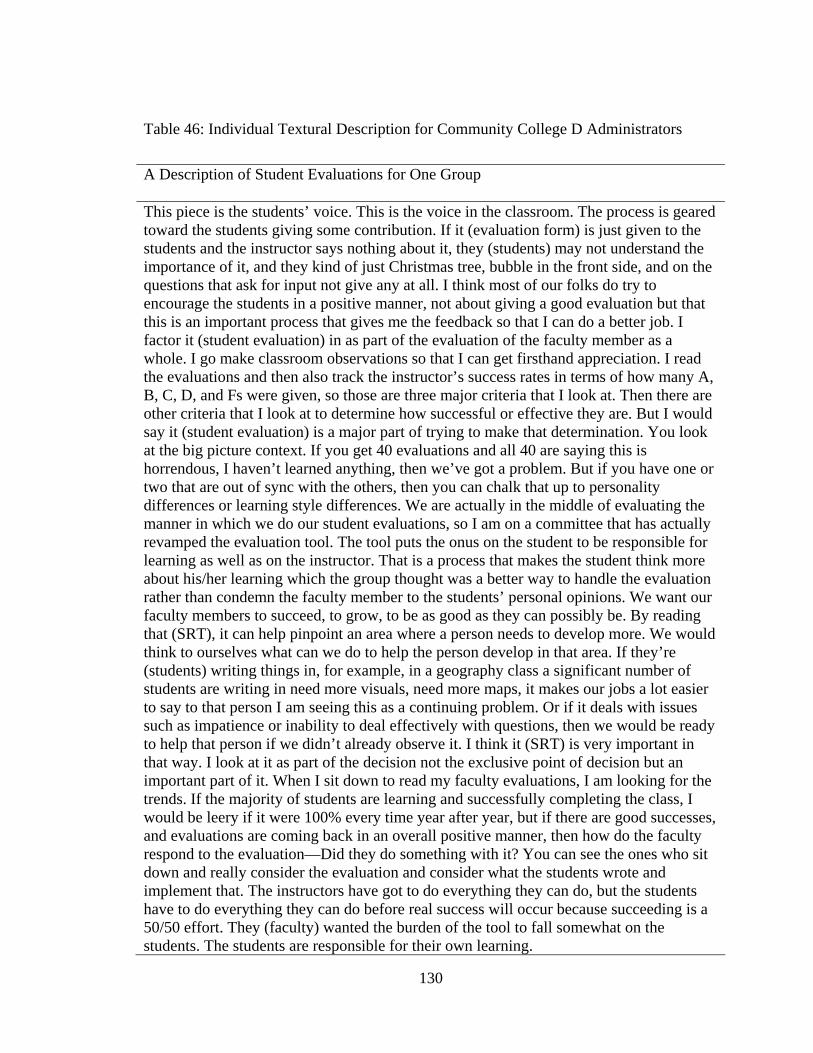
Table 46: Individual Textural Description for Community College D Administrators
A Description of Student Evaluations for One Group This piece is the students’ voice. This is the voice in the classroom. The process is geared toward the students giving some contribution. If it (evaluation form) is just given to the students and the instructor says nothing about it, they (students) may not understand the importance of it, and they kind of just Christmas tree, bubble in the front side, and on the questions that ask for input not give any at all. I think most of our folks do try to encourage the students in a positive manner, not about giving a good evaluation but that this is an important process that gives me the feedback so that I can do a better job. I factor it (student evaluation) in as part of the evaluation of the faculty member as a whole. I go make classroom observations so that I can get firsthand appreciation. I read the evaluations and then also track the instructor’s success rates in terms of how many A, B, C, D, and Fs were given, so those are three major criteria that I look at. Then there are other criteria that I look at to determine how successful or effective they are. But I would say it (student evaluation) is a major part of trying to make that determination. You look at the big picture context. If you get 40 evaluations and all 40 are saying this is horrendous, I haven’t learned anything, then we’ve got a problem. But if you have one or two that are out of sync with the others, then you can chalk that up to personality differences or learning style differences. We are actually in the middle of evaluating the manner in which we do our student evaluations, so I am on a committee that has actually revamped the evaluation tool. The tool puts the onus on the student to be responsible for learning as well as on the instructor. That is a process that makes the student think more about his/her learning which the group thought was a better way to handle the evaluation rather than condemn the faculty member to the students’ personal opinions. We want our faculty members to succeed, to grow, to be as good as they can possibly be. By reading that (SRT), it can help pinpoint an area where a person needs to develop more. We would think to ourselves what can we do to help the person develop in that area. If they’re (students) writing things in, for example, in a geography class a significant number of students are writing in need more visuals, need more maps, it makes our jobs a lot easier to say to that person I am seeing this as a continuing problem. Or if it deals with issues such as impatience or inability to deal effectively with questions, then we would be ready to help that person if we didn’t already observe it. I think it (SRT) is very important in that way. I look at it as part of the decision not the exclusive point of decision but an important part of it. When I sit down to read my faculty evaluations, I am looking for the trends. If the majority of students are learning and successfully completing the class, I would be leery if it were 100% every time year after year, but if there are good successes, and evaluations are coming back in an overall positive manner, then how do the faculty respond to the evaluation—Did they do something with it? You can see the ones who sit down and really consider the evaluation and consider what the students wrote and implement that. The instructors have got to do everything they can do, but the students have to do everything they can do before real success will occur because succeeding is a 50/50 effort. They (faculty) wanted the burden of the tool to fall somewhat on the students. The students are responsible for their own learning.
130
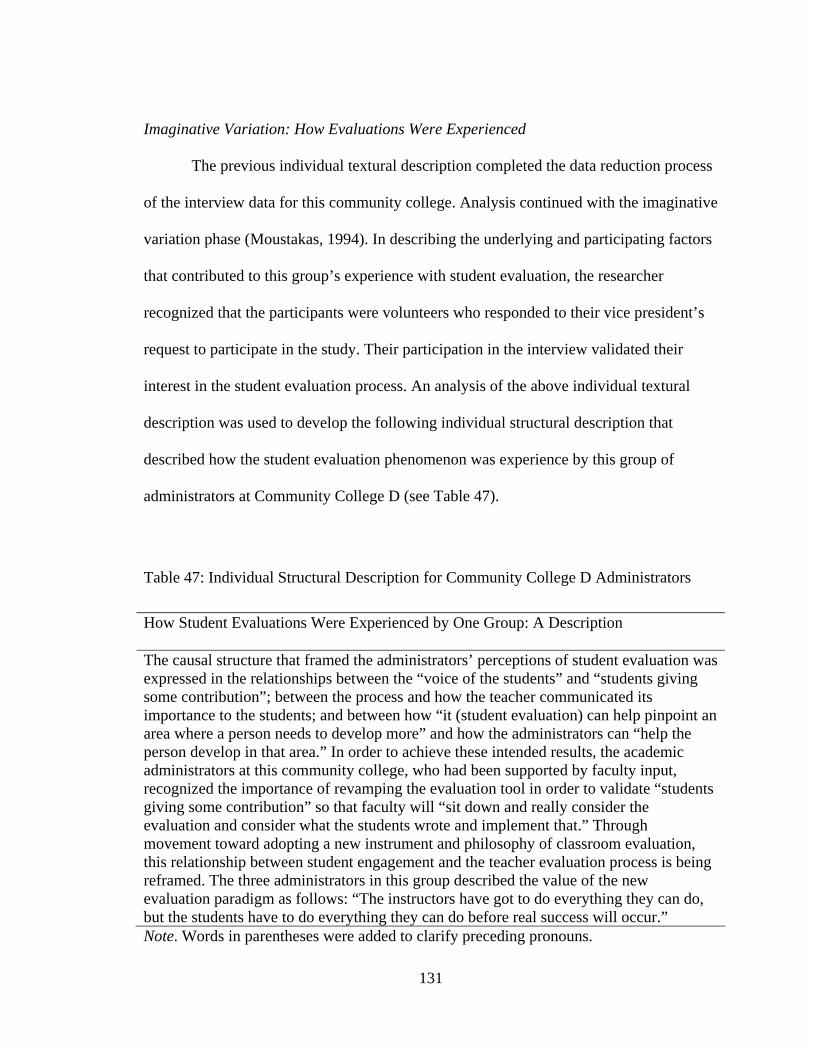
Imaginative Variation: How Evaluations Were Experienced
The previous individual textural description completed the data reduction process
of the interview data for this community college. Analysis continued with the imaginative
variation phase (Moustakas, 1994). In describing the underlying and participating factors
that contributed to this group’s experience with student evaluation, the researcher
recognized that the participants were volunteers who responded to their vice president’s
request to participate in the study. Their participation in the interview validated their
interest in the student evaluation process. An analysis of the above individual textural
description was used to develop the following individual structural description that
described how the student evaluation phenomenon was experience by this group of
administrators at Community College D (see Table 47).
Table 47: Individual Structural Description for Community College D Administrators
How Student Evaluations Were Experienced by One Group: A Description The causal structure that framed the administrators’ perceptions of student evaluation was expressed in the relationships between the “voice of the students” and “students giving some contribution”; between the process and how the teacher communicated its importance to the students; and between how “it (student evaluation) can help pinpoint an area where a person needs to develop more” and how the administrators can “help the person develop in that area.” In order to achieve these intended results, the academic administrators at this community college, who had been supported by faculty input, recognized the importance of revamping the evaluation tool in order to validate “students giving some contribution” so that faculty will “sit down and really consider the evaluation and consider what the students wrote and implement that.” Through movement toward adopting a new instrument and philosophy of classroom evaluation, this relationship between student engagement and the teacher evaluation process is being reframed. The three administrators in this group described the value of the new evaluation paradigm as follows: “The instructors have got to do everything they can do, but the students have to do everything they can do before real success will occur.” Note. Words in parentheses were added to clarify preceding pronouns.
131
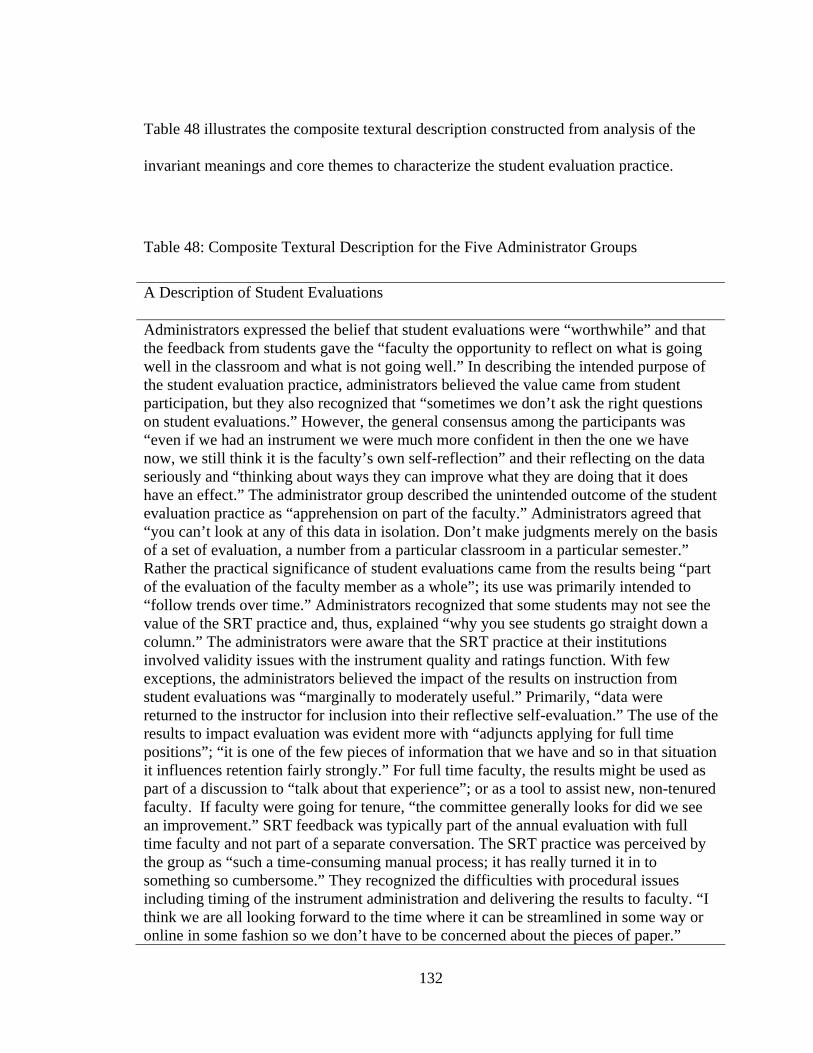
Table 48 illustrates the composite textural description constructed from analysis of the
invariant meanings and core themes to characterize the student evaluation practice.
Table 48: Composite Textural Description for the Five Administrator Groups
A Description of Student Evaluations Administrators expressed the belief that student evaluations were “worthwhile” and that the feedback from students gave the “faculty the opportunity to reflect on what is going well in the classroom and what is not going well.” In describing the intended purpose of the student evaluation practice, administrators believed the value came from student participation, but they also recognized that “sometimes we don’t ask the right questions on student evaluations.” However, the general consensus among the participants was “even if we had an instrument we were much more confident in then the one we have now, we still think it is the faculty’s own self-reflection” and their reflecting on the data seriously and “thinking about ways they can improve what they are doing that it does have an effect.” The administrator group described the unintended outcome of the student evaluation practice as “apprehension on part of the faculty.” Administrators agreed that “you can’t look at any of this data in isolation. Don’t make judgments merely on the basis of a set of evaluation, a number from a particular classroom in a particular semester.” Rather the practical significance of student evaluations came from the results being “part of the evaluation of the faculty member as a whole”; its use was primarily intended to “follow trends over time.” Administrators recognized that some students may not see the value of the SRT practice and, thus, explained “why you see students go straight down a column.” The administrators were aware that the SRT practice at their institutions involved validity issues with the instrument quality and ratings function. With few exceptions, the administrators believed the impact of the results on instruction from student evaluations was “marginally to moderately useful.” Primarily, “data were returned to the instructor for inclusion into their reflective self-evaluation.” The use of the results to impact evaluation was evident more with “adjuncts applying for full time positions”; “it is one of the few pieces of information that we have and so in that situation it influences retention fairly strongly.” For full time faculty, the results might be used as part of a discussion to “talk about that experience”; or as a tool to assist new, non-tenured faculty. If faculty were going for tenure, “the committee generally looks for did we see an improvement.” SRT feedback was typically part of the annual evaluation with full time faculty and not part of a separate conversation. The SRT practice was perceived by the group as “such a time-consuming manual process; it has really turned it in to something so cumbersome.” They recognized the difficulties with procedural issues including timing of the instrument administration and delivering the results to faculty. “I think we are all looking forward to the time where it can be streamlined in some way or online in some fashion so we don’t have to be concerned about the pieces of paper.”
132
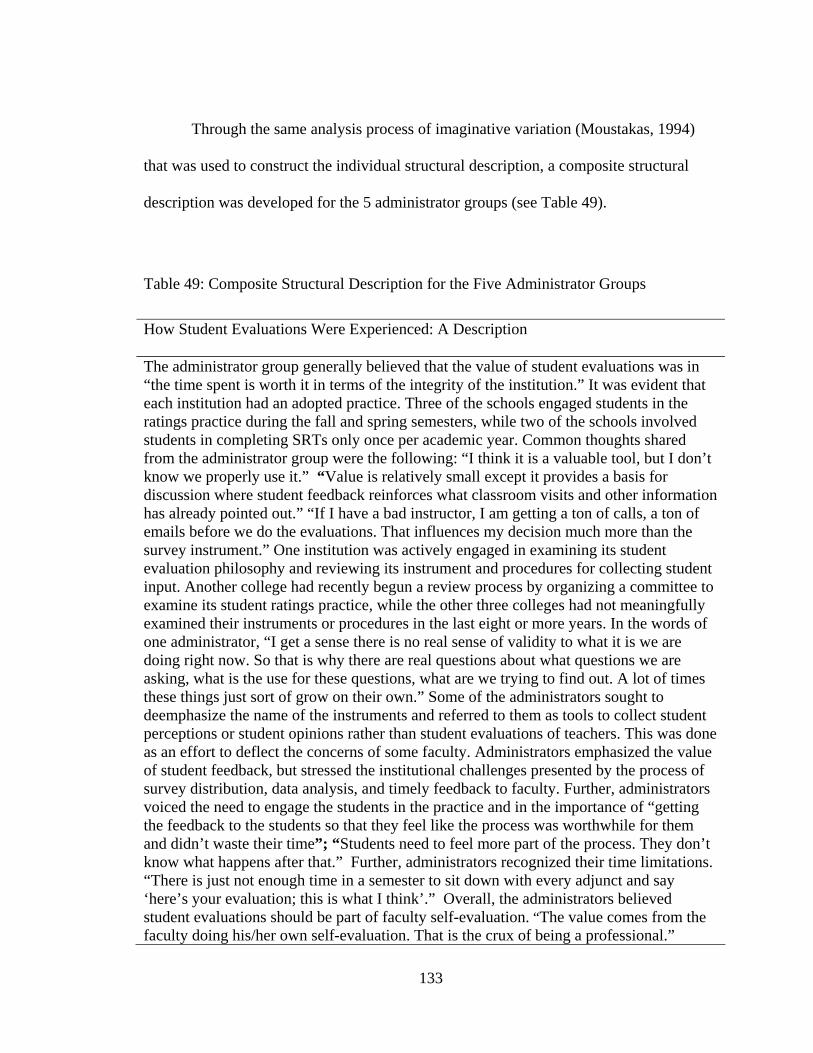
Through the same analysis process of imaginative variation (Moustakas, 1994)
that was used to construct the individual structural description, a composite structural
description was developed for the 5 administrator groups (see Table 49).
Table 49: Composite Structural Description for the Five Administrator Groups
How Student Evaluations Were Experienced: A Description The administrator group generally believed that the value of student evaluations was in “the time spent is worth it in terms of the integrity of the institution.” It was evident that each institution had an adopted practice. Three of the schools engaged students in the ratings practice during the fall and spring semesters, while two of the schools involved students in completing SRTs only once per academic year. Common thoughts shared from the administrator group were the following: “I think it is a valuable tool, but I don’t know we properly use it.” “Value is relatively small except it provides a basis for discussion where student feedback reinforces what classroom visits and other information has already pointed out.” “If I have a bad instructor, I am getting a ton of calls, a ton of emails before we do the evaluations. That influences my decision much more than the survey instrument.” One institution was actively engaged in examining its student evaluation philosophy and reviewing its instrument and procedures for collecting student input. Another college had recently begun a review process by organizing a committee to examine its student ratings practice, while the other three colleges had not meaningfully examined their instruments or procedures in the last eight or more years. In the words of one administrator, “I get a sense there is no real sense of validity to what it is we are doing right now. So that is why there are real questions about what questions we are asking, what is the use for these questions, what are we trying to find out. A lot of times these things just sort of grow on their own.” Some of the administrators sought to deemphasize the name of the instruments and referred to them as tools to collect student perceptions or student opinions rather than student evaluations of teachers. This was done as an effort to deflect the concerns of some faculty. Administrators emphasized the value of student feedback, but stressed the institutional challenges presented by the process of survey distribution, data analysis, and timely feedback to faculty. Further, administrators voiced the need to engage the students in the practice and in the importance of “getting the feedback to the students so that they feel like the process was worthwhile for them and didn’t waste their time”; “Students need to feel more part of the process. They don’t know what happens after that.” Further, administrators recognized their time limitations. “There is just not enough time in a semester to sit down with every adjunct and say ‘here’s your evaluation; this is what I think’.” Overall, the administrators believed student evaluations should be part of faculty self-evaluation. “The value comes from the faculty doing his/her own self-evaluation. That is the crux of being a professional.”
133
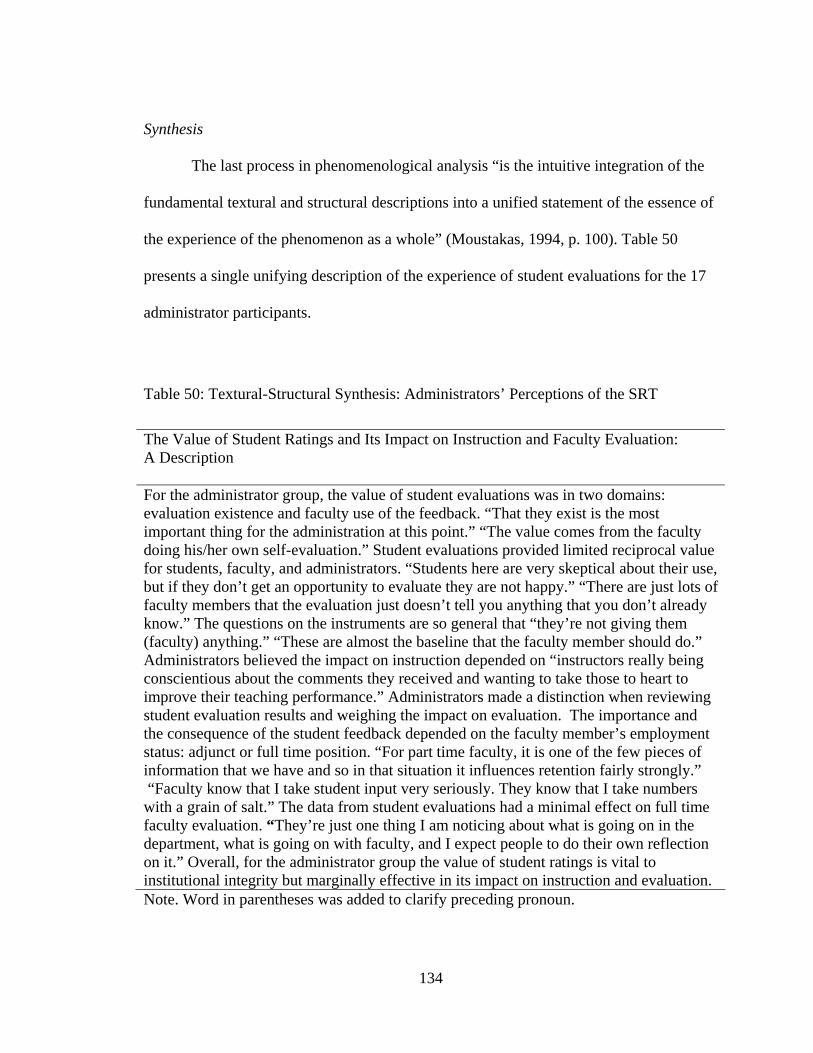
Synthesis
The last process in phenomenological analysis “is the intuitive integration of the
fundamental textural and structural descriptions into a unified statement of the essence of
the experience of the phenomenon as a whole” (Moustakas, 1994, p. 100). Table 50
presents a single unifying description of the experience of student evaluations for the 17
administrator participants.
Table 50: Textural-Structural Synthesis: Administrators’ Perceptions of the SRT
The Value of Student Ratings and Its Impact on Instruction and Faculty Evaluation: A Description For the administrator group, the value of student evaluations was in two domains: evaluation existence and faculty use of the feedback. “That they exist is the most important thing for the administration at this point.” “The value comes from the faculty doing his/her own self-evaluation.” Student evaluations provided limited reciprocal value for students, faculty, and administrators. “Students here are very skeptical about their use, but if they don’t get an opportunity to evaluate they are not happy.” “There are just lots of faculty members that the evaluation just doesn’t tell you anything that you don’t already know.” The questions on the instruments are so general that “they’re not giving them (faculty) anything.” “These are almost the baseline that the faculty member should do.” Administrators believed the impact on instruction depended on “instructors really being conscientious about the comments they received and wanting to take those to heart to improve their teaching performance.” Administrators made a distinction when reviewing student evaluation results and weighing the impact on evaluation. The importance and the consequence of the student feedback depended on the faculty member’s employment status: adjunct or full time position. “For part time faculty, it is one of the few pieces of information that we have and so in that situation it influences retention fairly strongly.” “Faculty know that I take student input very seriously. They know that I take numbers with a grain of salt.” The data from student evaluations had a minimal effect on full time faculty evaluation. “They’re just one thing I am noticing about what is going on in the department, what is going on with faculty, and I expect people to do their own reflection on it.” Overall, for the administrator group the value of student ratings is vital to institutional integrity but marginally effective in its impact on instruction and evaluation. Note. Word in parentheses was added to clarify preceding pronoun.
134
This statement, which includes verbatim quotations from administrator
transcripts, is a descriptive summary of the analysis regarding the participants’
perceptions of student evaluations and how the results from student evaluations impact
instruction and faculty evaluation.
To summarize the descriptions of administrator participants’ experiences with
student ratings, the following perceptions regarding the student evaluation practice were
noted: (a) administrators believed that engaging students in the faculty evaluation
practice had value; however, (b) this value appeared to be in the simple action of student
involvement rather than expecting to receive significant information concerning teaching
effectiveness; (c) SRT results were an important source of information when determining
the rehiring of adjunct instructors but of limited value in overall evaluation of full time
faculty.
Summary
The results from the descriptive and inferential statistics which were used to
analyze the quantitative and qualitative data were reported in Chapter 4. This research
examined the perceptions that 358 Florida community college students, faculty, and
administrators held regarding the student ratings practice. Data were collected through
survey and interview questionnaires administered at five Florida community colleges.
To assess how students in Florida community colleges perceived the value of their
role as faculty evaluators (Research Question 1), the researcher used seven survey items
identified through factor analysis that grouped under the construct, Beliefs about Student
Ratings. Descriptive analysis for the seven survey items indicated the following: Results
135
of the student surveys demonstrated that a large majority of the students (88.1%, n = 282)
agreed or strongly agreed that students should complete formal evaluations of their
instructors. However, 96 students (30%) did not believe that students took the process of
evaluating their teachers seriously, yet 145 students (45.3%) agreed or strongly agreed
that students took the process of evaluating their instructors seriously. The majority of
students (67.2%, n = 215) agreed or strongly agreed with the survey statement that
student surveys were a valuable method of evaluating instructors. Furthermore, students
were equally divided between those who believed students provided fair evaluations of
their instructors (50.3%, n = 161) and those who did not believe this to be a fact or did
not know (49.4%, n = 158). A large majority of students (79.4%, n = 242) agreed or
strongly agreed with the statement that students knew the qualities of an effective teacher.
The great majority of students (95%, n = 304) agreed or strongly agreed with the
statement that administrators should inform professors about the results from the student
ratings. The large majority of community college students (79.7%, n = 255) agreed or
strongly agreed with the statement that a summary of the results from the student
evaluations should be available online for students to review. In addition, descriptive
analysis of the data from the composite profile of the seven statements underlying the
Beliefs about Student Ratings construct indicated that the large majority of the sample
group of community college students (72.2%) believed that student ratings had value,
and, thus their role as teacher evaluator was important.
A one-way analysis of variance (ANOVA) was conducted to determine if there
were any statistically significant differences between the overall Beliefs Scale mean
(dependent variable) and students’ gender and program of study. Although there was no
136
statistically significant difference between the student’s program of study and Beliefs
Scale mean, results indicated a statistically significant differences (p < .01) between
gender and the Beliefs Scale mean. The mean female student response was 4.01 (SD =
.542), whereas the mean male student response was 3.73 (SD = .601).
Simple linear regression indicated that there was not a lot of practical significance
between the demographic variables of age or credits earned as predictors of a student’s
score for the Beliefs Scale. The regression equation for age predicted that a change in age
resulted in a slight increase in Beliefs Scale score of .012. The regression equation for
credits earned predicted that a change in credits earned resulted in a slight increase in
Beliefs Scale score of .001.
To determine if there was a statistically significant relationship between students’
perceptions of the relevance or importance of the student survey for evaluating professors
and how students believed the survey results were used (Research Question 2),
correlational analyses were conducted. First, a Pearson product-moment correlation
coefficient was computed to assess the degree that the total score from the four-item
Importance of Student Ratings Scale and the total score from the four-item Effects of
Student Ratings Scale were related. The correlation between the Importance of Student
Ratings Scale and the Effects of Student Ratings Scale was statistically significant, r(318)
= .397, p < .01. This suggested a medium relationship existed between students’
perceptions of the relevance or importance of the student survey for evaluating professors
and how students believed the survey results were used. Next, Spearman’s rank
correlation coefficients were calculated to describe the correlation among the variables
within each set of ranked data for perceived importance and perceived effects. In general,
137
the results indicated moderate to strong relationships. Measures of association between
the survey items from the Importance of Student Ratings Scale and the Effects of Student
Ratings Scale suggested a low to moderate association between student perceptions about
the importance of student ratings and the effects of student ratings. Analysis for Research
Question 2 continued with descriptive statistics provided for the 8 individual survey
factors underlying the 2 scales. Finally, descriptive measures were used to describe the
students’ general opinions about the importance of student ratings and the effects of
student ratings. The majority of the sample group of students (61%) believed that student
ratings had importance. However, the majority of the sample group of students (84.1%)
believed that student ratings had an uncertain or no effect. It was noteworthy that 124
students, which represented 39% of the 320 respondents, entered comments on the
survey. The most frequent written comment indicated that students perceived student
ratings as having an uncertain value (n = 38, 31%).
The data from the faculty responses to the survey and to the interview questions
were used to address Research Question 3. First, an independent-samples t test was used
to test the null hypothesis that there was no statistically significant mean difference on the
total Grading Faculty survey responses between student and faculty. Although the student
response was slightly more positive than the faculty response, the mean total survey
response indicated no statistically significant total mean difference.
To analyze the transcribed data from the questionnaires which were used during
the 5 faculty interview sessions and to describe the value of the student evaluation
practice for the 21 Florida community college faculty participants, the researcher used the
Moustakas (1994) method for organizing and analyzing phenomenological data.
138
Descriptive analysis of the lengthy data suggested that a significant relationship between
the results from the student evaluations being used as a method to impact instruction was
not demonstrated through the currently adopted student evaluation practices among the
five participating community colleges.
The Moustakas method (1994) was also used to analyze the transcribed data from
the questionnaires which were used during the 5 administrator interview sessions and to
describe the value of the student evaluation practice for the 17 Florida community college
administrator participants. Overall, for the administrator group the value of student
ratings was vital to institutional integrity but marginally effective in its impact on
instruction and evaluation. Of significance was the fact that two of the five colleges had
begun the process to examine their student evaluation practices. One of the community
colleges had revised its philosophy to include the critical role of students in the teaching
and learning process. This college had revamped its student evaluation tool in order to
reflect the responsibility that the students must have to affect learning.
139
CHAPTER 5
DISCUSSION OF FINDINGS AND RECOMMENDATIONS
Introduction
Chapter 5 provides discussion and proposes an interpretation of the data analyses
from Chapter 4. The chapter begins with an overview of the statement of the problem and
the purpose for this research; the chapter continues with discussion of the previous
chapter’s data analyses of the four research questions advancing this study. This chapter
offers implications for student evaluation practices and concludes with recommendations
for future student ratings research.
Statement of the Problem
Colleges and universities have invested time, personnel, and money into the
process of students’ evaluation of faculty through the use of various forms of the student
ratings of teaching. These data provide one measure of evaluating the quality and
effectiveness of instruction. Despite there being positive uses of the data from student
ratings, Ory and Ryan (2001) noted that there are unintended uses of the data. One
example of an unintended consequence stated by Ory and Ryan was that “the rating
process becomes a meaningless activity that is performed by students and instructors only
because it is mandated” (2001, p. 40). Penny (2003) raised the issue that ratings research
has been limited due to the research focus on “…issues pertaining to the validity and
reliability, rather than how best to use student ratings…” (p. 399).
140
This research responded to the lack of emphasis on more effective use of the data
for the purpose of improving teaching effectiveness by questioning the opinions and
practices of the three stakeholder groups: students, faculty, and administrators. More
importantly, this research raised the question of the value of SRTs: Is the effort of doing
SRTs worth the institutional investment or is it simply a routine process which has little
or no effect on improving teaching effectiveness?
Purpose of the Study
Students in the higher education system have assumed a major role in the
evaluation of faculty. Data from the student ratings become part of the faculty member’s
file and can have a direct impact on personnel decisions. Results from the student ratings
can affect annual evaluations, merit pay, advancement in faculty rank, and tenure
opportunities. Students may or may not be aware of the influence their responses have in
the evaluation of faculty. Therefore, in order to improve the process of formal student
evaluation of faculty, it is important to examine the perceptions students have about
SRTs. The purposes of this research were to: (a) assess community college students’
perceptions of the student evaluation practice; (b) assess community college faculty
members’ responses to student evaluations of teachers and the extent to which
instructional modifications result from student ratings; and (c) assess community college
administrators’ responses to student evaluations of teachers, the extent student ratings
influence administrators’ evaluations of faculty, and how the results from student ratings
are used to promote instructional effectiveness.
141
Summary and Discussion of Statistical Findings
A total of 358 student, faculty, and administrator participants from 5 Florida
community colleges contributed their opinions on the value of student ratings of teaching.
The student sample consisted of 320 participants; the faculty sample consisted of 21
faculty members and the administrator sample consisted of 17 volunteers. The researcher
studied each group’s perceptions about the value of student ratings through personal
contact with each participant. To examine and understand the phenomenon or the
meaning of the experience of student ratings for each stakeholder group (students, faculty
members, and administrators), the researcher became one of the three instruments for
data collection. The other instruments for data collection were surveys and interview
questionnaires. Each survey and interview session was conducted on location at the
respective participating community college.
In conducting this quantitative and qualitative study, the researcher consciously
set aside personal experiences with student evaluations in order for the interview sessions
and data interpretation processes to be understood through the experiences of the
participants (Moustakas, 1994). The researcher had personal experiences with SRTs as
both a faculty member, who had been evaluated by students for more than 10 years, and
as a department chairperson, who used results from SRTs when evaluating full time and
adjunct faculty within the department. Using the principles for survey design
recommended by Dillman (1999), the researcher developed the Grading Faculty survey
and interview questionnaires to address the four research questions. Moreover, the
phenomenological methodology outlined by Moustakas (1994) was used to organize and
analyze the qualitative data.
142
Research Question 1
How did students in Florida community colleges perceive the value of their role
as faculty evaluators? For this study, the definition of value referred to participants’
beliefs about the usefulness, importance, or general worth of the SRT practice. The
student sample included 320 participants who were asked to complete a 19-item survey.
The survey was administered by the researcher during a regularly scheduled class
session. In addition to the 15 survey statements, the student version of the survey asked
students to respond to 4 demographic questions: gender, age, program of study, and
approximate number of college credits earned. There were more female participants
(n = 203) than male participants (n = 116). The mean age for the student group was 25.13
years and the ages ranged from 18 to 56 years. The most frequent age reported was 21
(n = 57). Seven students did not respond to the age question. The demographics of
gender and age were comparable to the community college system student profile
(American Association of Community Colleges, 2004). The majority of students (60%)
identified the associate of arts as their program of study. The associate of science
program was identified by 27.2% of the students followed by the associate of applied
science (8.4%), personal interest (3.4%), and vocational certificate programs (0.6%).
Nearly 8% (n = 25) of the students did not answer or misunderstood this question
regarding the number of college credits or semester hours earned. Of the 295 students
who responded with usable data, the mean number of credits earned was 47.03 semester
hours.
Results from data analyses from survey statements, 1-5, 10, and 15 were used to
describe the 320 community college students’ perceived value of their role as faculty
143
evaluators. These seven statements comprised the scale, Beliefs about Student Ratings.
The students rated the survey statements on a scale of 1 to 5: (1 = strongly disagree,
2 = disagree, 3 = neither agree nor disagree, 4 = agree; and 5 = strongly agree). Research
Question 1 was examined in three phases using descriptive and inferential statistics.
Survey statement 1 asked if students should complete formal evaluations of their
instructors. A large majority of the students (88.1%) agreed or strongly agreed that
students should complete formal evaluations of their instructors.
Survey statement 2 asked if students took the process of evaluating their
instructors seriously. Overall, nearly half of the community college students (45.3%)
believed that students took the process of evaluating their teachers seriously, but slightly
over half of the students did not believe this to be a fact or did not know (54.7%).
Survey statement 3 asked if student surveys were a valuable method of evaluating
instructors. Overall, 67.2% of the students believed that student surveys were an
important system of teacher evaluation.
Survey statement 4 asked if students provided fair evaluations of their instructors.
Students were almost evenly divided between those who believed students provided fair
evaluations of their instructors (50.3%) and those who did not believe this to be a fact or
did not know (49.4%).
Survey statement 5 asked if students knew the qualities of an effective teacher.
Overall, 79.4% of the community college student respondents believed that students
knew the characteristics of an effective teacher.
144
Survey statement 10 asked if administrators should inform professors about the
results. The great majority of students (95%) agreed or strongly agreed that college
administrators should tell faculty members about the student ratings results.
Survey statement 15 asked if a summary of the results from student evaluations
should be available online for students to review. Overall, 79.7% of the community
college students believed that a summary of student ratings should be accessible through
online resources.
In summarizing the seven statements underlying the construct, Beliefs about
Student Ratings, the researcher developed the following conclusions: the large majority
of community college students strongly believed that students should complete formal
evaluations of their instructors, that administrators should inform faculty about the
ratings, and that a summary of the results should be available online. Furthermore,
participants believed that students, in general, took the process of evaluating their
instructors seriously, that student surveys were a valuable method of evaluating
instructors, that students provided fair evaluations of their instructors, and that students
knew the qualities of an effective teacher.
In the second analysis phase for Research Question 1, students’ responses from
the 7 statements were categorized according to perceived value to describe the composite
variable, Beliefs about the Value of Student Ratings. Based on descriptive analysis of the
2237 responses to the 7 survey statements underlying scale 1, the large majority of the
sample group of community college students (72.2%) believed that student ratings had
value, and, thus their role as teacher evaluator was important.
145
The third analysis phase for Research Question 1 examined the effects that the
student demographic variables (gender, program of study, age, and credits earned) had on
the dependent variable (scale mean for the seven beliefs underlying Scale 1, Beliefs about
Student Ratings). A one-way analysis of variances (ANOVA) indicated a statistically
significant difference between gender and the Beliefs Scale mean, F(1, 317) = 17.61, p <
.01. There was a statistically significant difference in the means between the male (M =
3.7, SD = .60) and female (M = 4.0, SD = .54) respondents. The female respondents
tended to respond slightly more positive than the male respondents. A one-way analysis
of variances (ANOVA) indicated no statistically significant difference between program
of study and the Beliefs Scale mean. This finding suggested that a student’s program of
study does not bias the student’s perceptions regarding student evaluations. This sample
of students held similar beliefs about student ratings. This finding was different from
previous research which indicated that student ratings were slightly biased by discipline.
However, it is important to note that the present study focused on general perceptions
regarding the student evaluation practice and not the evaluation of a specific course.
Furthermore, simple linear regression indicated that neither age nor credits earned
accounted for a lot of practical significance in predicting the Beliefs Scale mean score.
This finding supported previous research that student age does not bias ratings. Centra
(1993) reported that a common myth was that more mature students provided more valid
student ratings than younger students. For this group of community college students,
gender affected the responses to the Beliefs Scale, but program of study, age, and credits
earned had slight or no significance to the Beliefs Scale mean score.
146
McKeachie (1997) noted that students have not been trained to be teacher
evaluators nor were students’ concepts of effective teaching similar. Findings from this
study indicated that this student sample believed their role in the evaluation of faculty
was important and that they recognized the characteristics of effective instructors.
However, training students to be more effective evaluators could enhance the quality of
feedback particularly the written comments that faculty in this study indicated that they
preferred.
Dunegan and Hrivnak (2003) raised important concerns about deficiencies in the
SET process including the possibility that the procedures may be creating the mindless
manner in which students respond. In offering recommendations to improve the system,
these two researchers suggested that “most academic institutions have not been very
active in making students feel their SET input is being used or valued” (p.299).
Therefore, affirming the purpose of student evaluation, training students to provide
meaningful feedback, and affirming the value of the students’ opinions could improve the
quality of responses and reward the institutional effort. Although the findings from this
study indicated that students believed students, in general, took the evaluation process
seriously and were generally fair in their assessment of teachers, student feedback may be
improved if the institution confirmed the value of their role in the faculty assessment
process.
Research Question 2
Was there a statistically significant relationship between students’ perceptions of
the relevance or importance of the student survey for evaluating professors and how
147
students believed the survey results were used? Students’ responses to survey items 6-9
and 11-14 were used to provide the data for Research Question 2. Importance of Student
Ratings included survey items 6-9, and Effects of Student Ratings included survey items
11-14. A Pearson product-moment correlation coefficient was computed to assess the
degree that the total score from the Importance of Student Ratings Scale was related to
the total score from the Effects of Student Ratings Scale to provide a measure of the
relationship between perceived importance and perceived effects of student ratings. The
correlation between the Importance of Student Ratings Scale and the Effects of Student
Ratings Scale was statistically significant, r(318) = .397, p < .01. A significant linear
relationship existed between the two scales. Results indicated a medium positive
relationship between students’ perceptions of the relevance or importance of the student
survey for evaluating professors and how students believed the survey results were used.
Descriptive statistics were used to analyze the responses to each of the eight
survey statements which described the eight variables underlying the two dimensions.
Survey statement 6 asked if student evaluations were important to the college
administrators. The majority of students (62.2%) believed that college administrators
valued student evaluations.
Survey statement 7 asked if student evaluations were important to the instructor.
The large majority of students (72.2%) believed that instructors valued student ratings.
Survey statement 8 asked if professors cared about the opinions of their students.
The majority of community college student participants (63.1%) believed that teachers
valued their opinions.
148
Survey statement 9 asked if professors used class evaluations to improve their
teaching. Student responses reflected that less than a majority (45.9%) believed that
student ratings were valued by professors as a resource to improve their teaching. Most
notable was the fact that 123 students (38.4%) neither agreed nor disagreed with this
statement.
Survey statement 11 asked if professors changed their grading system based on
feedback from the evaluations. The large majority of students (83.7%) believed that
results from student evaluations had an uncertain or no effect on professors’ adjustments
to a course grading system. Most notable was the fact that 155 students (48.4%) neither
agreed nor disagreed with this statement.
Survey statement 12 asked if results from student evaluations were used to
dismiss professors. The overwhelming majority of students (89.1%) believed that results
from student evaluations had an uncertain or no effect on dismissal status for faculty
members. Most notable was the fact that 172 students (53.8%) disagreed or strongly
disagreed with this statement.
Survey statement 13 asked if results from student evaluations were used to
promote professors. The overwhelming majority of students (77.5%) believed that results
from student evaluations had an uncertain or no effect on promotion status for teachers.
Most notable was the fact that 141 students (44.1%) neither agreed nor disagreed with
this statement.
Survey statement 14 asked if results from student evaluations influenced faculty
salary increases. The overwhelming majority of students (85%) believed that results from
student evaluations had an uncertain or no effect on salary increases for teachers. Most
149
notable was the fact that 142 students (44.4%) neither agreed nor disagreed with this
statement, and 130 students (40.6%) disagreed or strongly disagreed with this statement.
In summarizing the eight statements underlying the two constructs, Importance of
Student Ratings and Effects of Student Ratings, the researcher developed the following
conclusions: the large majority of community college students believed that student
evaluations were important to the college administrators, that student evaluations were
important to the instructor, and that professors cared about the opinions of their students.
However, it was evident that participants, in general, did not know how the results from
the student evaluations were being used. Students most frequently responded neither
agree nor disagree to the following statements: professors used class evaluations to
improve their teaching, professors changed their grading system based on feedback from
the evaluations, results from student evaluations were used to promote professors, and
results from student evaluations influenced faculty salary increases. In fact, more than
half of the respondents (53.8%) generally did not believe that student ratings results were
used to dismiss professors. The findings from these survey factors supported the
principles of Theall and Franklin (2001) who suggested a comprehensive and effective
evaluation system should establish the purpose of the evaluation and the uses and users of
ratings. Students in this study believed ratings were important, but they did not know the
consequences of their involvement.
Descriptive statistics were used to describe the students’ general opinions about
the perceived value of the importance of student ratings. Based on the 1278 responses to
the 4 survey statements underlying dimension 2, Importance of Student Ratings Scale, the
majority of the sample group of community college students (61%) believed that student
150
ratings had importance for administrators and faculty. Conversely, based on the 1276
responses to the 4 survey statements underlying dimension 3, Effects of Student Ratings
Scale, the majority of the sample group of community college students (84.1%) believed
that student ratings had an uncertain effect (43.2%) or no effect (40.9%). This finding
offers an explanation as to why some students may hurriedly complete a student
evaluation form. Their not knowing what effects the ratings could have on faculty
assessment may lead to the mindless completion of the evaluation form. This fact lends
support to the research of Dunegan and Hrivnak (2003) on student cognition. Their
research suggested that “students might not be completing the SET instruments as
deliberately and mindfully as we would hope” (p. 300). Marsh and Roche (1997) reported
that when the purpose of the evaluation is known to be for tenure or promotion students
tend to rate higher.
In addition to the survey statements and demographic questions on the survey
form, there was additional space for students to enter comments. Analyses of written
comments which were provided by 124 students indicated that students were divided on
the perceived value of student ratings; 25% believed student ratings had no value; 27%
believed student evaluations had value; 31% believed student evaluations had uncertain
value. Comments not related to student ratings were assigned to a general comments
category and were not assigned a value.
Overall, the majority of students believed that student evaluations had importance
for faculty and administrators. However, students were unaware of the effects that student
evaluations had on professors changing their grading systems, faculty promotions, and
teacher salary increases. Interestingly, students overwhelming believed results from
151
student evaluations were not used to dismiss professors. Although a Pearson product-
moment correlation coefficient indicated that there was a statistically significant medium
positive relationship between the Importance of Student Ratings Scale and the Effects of
Student Ratings Scale, this correlation accounted for approximately 16% of the common
variance. Furthermore, almost 84% of the variance between the 2 scales was influenced
by other factors. Ory and Ryan (2001) suggested that there needed to be research on
understanding the ratings process and its consequences to improve validity. Based on
this research study, students believed ratings were important but did not know the effects
of the evaluations. Their knowing how the student evaluations affected the teaching and
learning process could enhance students’ efforts while completing the evaluation forms.
Research Question 3
What were the Florida community college faculty member respondents’
perceptions of the student evaluation process and its impact on instruction? In this study,
process and practice were terms used to denote the customary action or series of actions
leading to the use of student rating forms to evaluate teaching effectiveness. The
researcher enlisted the assistance from each community college academic vice president
to secure faculty participants. Data were collected from 21 Florida community college
faculty members during 5 interview sessions. Each interview session was conducted at
the participating college location. At the conclusion of the 90-minute interview session,
each faculty participant was asked to respond to the same 15 survey statements which
were administered to the student participants. However, the faculty version of the survey
asked faculty to respond to 6 demographic questions including identifying their gender;
152
faculty employment status—adjunct or full time; faculty position—non-tenured or
tenured; faculty rank—instructor, assistant professor, associate professor, professor, or
senior professor; and area of primary instruction—college preparatory, associate of arts
general education, associate of science/associate of applied science, vocational certificate,
or combination of the above; and total years teaching in higher education. Descriptive
results indicated that the faculty group included more female (61.9%) than male (38.1%)
participants. Faculty members were primarily full time (95.2%). One part time instructor
contributed to the study. The majority of teachers indicated that they were tenured
(66.7%). The most frequent rank identified was associate professor (38.1%). Most of the
faculty taught either in the associate of arts general education programs (38.1%) or the
associate of science/associate of applied science programs (28.6%). The average number
of years of higher education teaching was 16.48; the years of higher education teaching
ranged from 2 years to 31 years.
The data from the faculty responses to the survey and to the interview questions
were used to address Research Question 3. Two analysis procedures were used,
inferential statistics and phenomenological inquiry. Inferential statistics tested the
hypothesis that the student group and the faculty group were similar in their overall
perceptions regarding the student evaluation practice. Results of the independent-samples
t test was not statistically significant, t(339) = .924, p = .356. The effect size (d = .21)
indicated a small difference between the means of the two groups. The average mean
response for the 15 survey items for the student group was 3.5 (SD=.51), and the average
mean response for the faculty group was 3.4 (SD=.62). The average total mean survey
response between the faculty and student groups indicated no statistically significant total
153
mean difference; therefore, the null hypothesis was not rejected. Although student
responses were slightly more positive than faculty responses, the total mean response
from both groups suggested more uncertainty than certainty regarding the general value
of SRTs.
The Moustakas (1994) method for organizing and analyzing phenomenological
data was used to analyze the transcribed data from the interview sessions and to develop
a composite statement highlighting the essence of student ratings for the faculty group. In
order to construct the composite or essence statement, each interview experience was
analyzed through a series of processes: Epoch, Phenomenological Reduction, Imaginative
Variation, and Synthesis (Moustakas, 1994). Analysis of the lengthy data from the five
interview sessions suggested that a significant relationship between the results from the
student evaluations being used as a method to impact instruction was not demonstrated
through the currently adopted student evaluation practices among the five participating
community colleges. This finding supported Centra (1993) who indicated that student
ratings feedback will improve teaching if teachers learn something new and important
from the results. The findings from this study indicated that ambiguous protocols,
inadequate instruments, feelings of faculty trust juxtaposed with feelings of faculty
distrust, and limited or non-existent feedback cast doubt on garnering significant data,
and, thus student evaluation results had little effect on promoting teaching effectiveness.
A common belief among the community college faculty participants can be summarized
with the following: “If you took all of the evaluations on campus, the average would
probably be agree.” A unanimous sense of frustration surfaced with the “lousy
instrument” and “wrong questions.” Many teachers devised their own methods for
154
finding out “what works in the classroom and what doesn’t.” Most teachers felt “written
information is much more effective than just the number information.” Overall, for this
group of community college faculty participants, their perceptions of the student
evaluation process and its impact on instruction could be described as lacking
effectiveness. Research by Marsh (1987) and Marsh and Roche (1993) indicated that
student evaluations could influence teaching effectiveness provided appropriate
consultation was awarded. For many of the participants in the current study, they
described their frustration with receiving minimal and timely feedback. The
institutionalized student evaluation practice for these faculty participants appeared to be a
directive which held nominal significance.
Research Question 4
What were the Florida community college administrators’ perceptions of the
student evaluation process and its impact on instruction and faculty evaluation? With the
assistance of the academic vice presidents from each of the 5 participating community
colleges, data were collected from 17 Florida community college administrator
participants during 5 administrator interview sessions. For purposes of this research,
administrator was defined as a community college program manager, department chair,
dean, and vice-president whose job function included supervising and evaluating faculty.
There was almost equal representation between female (52.9%) administrators and male
(47.1%) administrators. More deans or assistant deans (41.2%) participated in the
interview sessions. Vice presidents from three of the five community colleges joined in
one of the interview sessions. At one of the community colleges, the evaluation of faculty
155
was not conducted at the department chair level. That duty was reserved for the level of
dean. At another community college, program managers were involved in the evaluation
of faculty.
The data from the responses to the interview questions were used to address
Research Question 4. The phenomenological data analysis approach advanced by
Moustakas (1994) was used to organize and analyze the data in order to construct the
composite or essence statement. Overall, for the administrator group the value of the
student ratings practice was in its existence. Having a process which gave students a
voice was vital to institutional integrity. However, results from student evaluations were
marginally effective in their impact on instruction and evaluation. The following excerpts
were taken from the administrators’ transcripts. “That they exist is the most important
thing for the administration at this point.” “Students here are very skeptical about their
use, but if they don’t get an opportunity to evaluate they are not happy.” “There are just
lots of faculty members that the evaluation just doesn’t tell you anything that you don’t
already know.” “The value comes from the faculty doing his/her own self-evaluation.”
Administrators believed the impact on instruction depended on “instructors really being
conscientious about the comments they received and wanting to take those to heart to
improve their teaching performance.” However, the administrators made a distinction
when reviewing student evaluation results and weighing the impact on faculty evaluation.
The importance and the consequence of the student feedback depended on the faculty
member’s employment status. Results from student evaluations were typically of greater
value when deciding whether to rehire an adjunct instructor. The following is a comment
which described the belief of many administrators: “For part time faculty, it is one of the
156
few pieces of information that we have and so in that situation it influences retention
fairly strongly.”
The data from student evaluations had a minimal effect on full time faculty
evaluation. The following comment represents a common perception: “They’re just one
thing I am noticing about what is going on in the department, what is going on with
faculty, and I expect people to do their own reflection on it.” In view of current student
ratings research, this philosophy suggested prudence on the part of this group of
community college administrators. The data from student evaluations at their institutions
were not being used as the sole criteria for judging teaching effectiveness which was an
issue raised by Cashin (1999), and Theall and Franklin (2001). Abrami, Theall, and Mets
(2001) and Ory (2001) maintained that data from student ratings provide one important
factor in the evaluation of teaching effectiveness. Abrami and d’Apollonia (1999)
encouraged caution when using ratings in judging faculty and advocated “the use of
ratings to make only gross distinctions regarding teaching effectiveness” (p. 519). The
findings from this study supported that this was how the data were being used.
Of additional significance to this study was the fact that two of the five colleges
had begun the process to examine their student evaluation practices. One of the
community colleges had revised its philosophy to include the critical role of students in
the teaching and learning process. This college had revamped its evaluation tool in order
to reflect the responsibility that the students must have to affect learning.
157
Research Limitations
This study had two important limitations. Participants for the three sample groups
were volunteers who may not have completely represented each of the sample
populations. Thus, the assumption of independence may have been violated since this
was not a simple random sample. Further, analysis and interpretation of the qualitative
data were completed by a researcher who holds a faculty position which includes
supervisory duties of evaluating faculty as a community college department chairperson.
Another researcher may have been examined the phenomenological data differently.
Implications for Student Evaluation Practices
This research posed the core question of the value of SRTs: Is the effort of doing
SRTs worth the institutional investment or is it simply a routine process which has little
or no effect on improving teaching effectiveness? Results from this study suggested that
although the 320 community college students perceived their role as faculty evaluators as
important and that student ratings had value, they were unsure of the overall effects that
their evaluations had on faculty. Based upon the descriptions provided by the faculty
participants, a significant relationship between the results from the student evaluations
being used as a method to impact instruction was not demonstrated. Finally, for the
administrator group although the value of student ratings was vital to institutional
integrity, the results from student evaluations were marginally effective in their impact on
enhancing instruction and of limited value in faculty evaluation. Of significance was the
fact that the community college administrators in this study did not rely exclusively on
158
student ratings when making decisions on teaching performance; ratings were viewed as
one source of information.
This study was conducted to examine the perceptions that community college
students, faculty, and administrators had of the student evaluation practice. Implications
for student evaluation practices drawn from this study included the need for institutions
to: (a) assess the value of their student evaluation practice and its impact on teaching
effectiveness; (b) define and clearly articulate a statement of purpose for conducting
student evaluations; (c) refine procedures for administering the student evaluation
practice; (d) examine their student evaluation practices and instrument on a regular
review cycle; (e) adopt alternative methods for collecting and disseminating student
feedback; (f) implement student evaluation measures that reflect the varied teaching
approaches and diverse learning environments.
Recommendations for Future Studies
Although there has been extensive research in the area of student ratings as a
measure of teaching effectiveness, there has been limited research on the usefulness of
the data to promote teaching effectiveness and students’ attitudes regarding their role. To
advance knowledge in the area of student evaluation of teaching effectiveness, the
following research suggestions are offered:
1. Conduct an investigation at other colleges and universities throughout the United
States to determine how student evaluation data are used to promote teaching
effectiveness.
159
2. Conduct a study among the academic departments of an institution to compare the
following: the methods used for providing student ratings feedback to faculty and
students, the extent ratings information is used for faculty development, and the
value of the student evaluation practice.
3. Design a study to investigate what general teaching behaviors students identify as
effective and how they believe students could be more engaged in the assessment
of the teaching and learning process.
4. Design a study to investigate the seriousness and fairness with which students
evaluate their instructors and identify factors that may affect their judgment.
5. Examine online instructional evaluation models. An online evaluation system
would decrease the manual processing of data and provide more timely feedback.
These two issues were presented as primary problems for the current paper-based
student evaluation system used by the community colleges in this study.
160
APPENDIX A
FLORIDA COMMUNITY COLLEGES
161
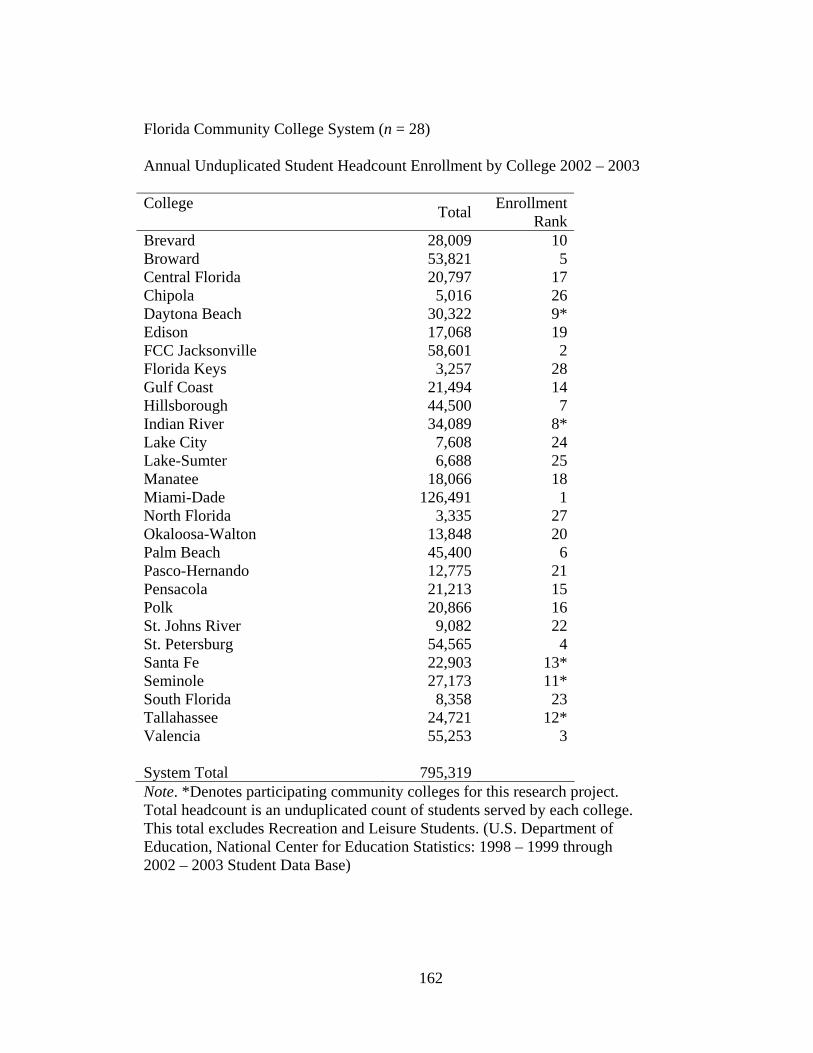
Florida Community College System (n = 28)
Annual Unduplicated Student Headcount Enrollment by College 2002 – 2003
College Total EnrollmentRank
Brevard 28,009 10Broward 53,821 5Central Florida 20,797 17Chipola 5,016 26Daytona Beach 30,322 9*Edison 17,068 19FCC Jacksonville 58,601 2Florida Keys 3,257 28Gulf Coast 21,494 14Hillsborough 44,500 7Indian River 34,089 8*Lake City 7,608 24Lake-Sumter 6,688 25Manatee 18,066 18Miami-Dade 126,491 1North Florida 3,335 27Okaloosa-Walton 13,848 20Palm Beach 45,400 6Pasco-Hernando 12,775 21Pensacola 21,213 15Polk 20,866 16St. Johns River 9,082 22St. Petersburg 54,565 4Santa Fe 22,903 13*Seminole 27,173 11*South Florida 8,358 23Tallahassee 24,721 12*Valencia 55,253 3 System Total 795,319Note. *Denotes participating community colleges for this research project. Total headcount is an unduplicated count of students served by each college. This total excludes Recreation and Leisure Students. (U.S. Department of Education, National Center for Education Statistics: 1998 – 1999 through 2002 – 2003 Student Data Base)
162

APPENDIX B
NOTIFICATION LETTER
163
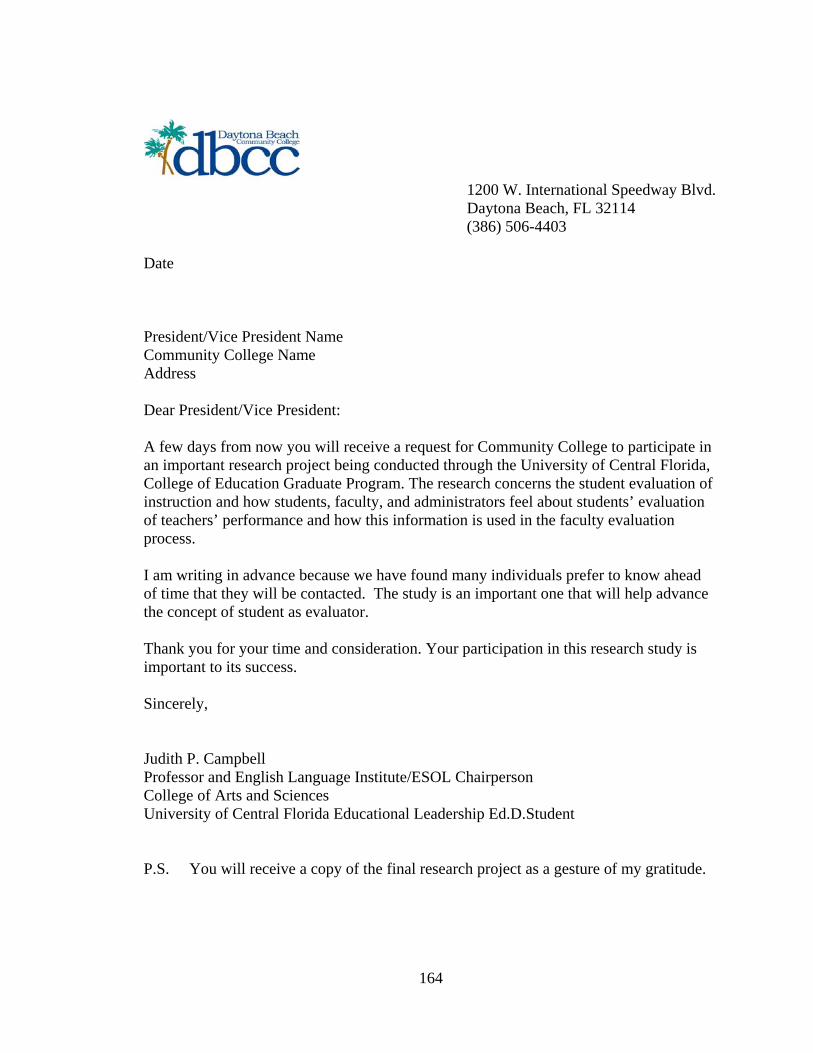
1200 W. International Speedway Blvd.
Daytona Beach, FL 32114 (386) 506-4403
Date
President/Vice President Name Community College Name Address
Dear President/Vice President:
A few days from now you will receive a request for Community College to participate in an important research project being conducted through the University of Central Florida, College of Education Graduate Program. The research concerns the student evaluation of instruction and how students, faculty, and administrators feel about students’ evaluation of teachers’ performance and how this information is used in the faculty evaluation process. I am writing in advance because we have found many individuals prefer to know ahead of time that they will be contacted. The study is an important one that will help advance the concept of student as evaluator. Thank you for your time and consideration. Your participation in this research study is important to its success. Sincerely,
Judith P. Campbell Professor and English Language Institute/ESOL Chairperson College of Arts and Sciences University of Central Florida Educational Leadership Ed.D.Student
P.S. You will receive a copy of the final research project as a gesture of my gratitude.
164

APPENDIX C
LETTER OF REQUEST
165
1200 W. International Speedway Blvd.
Daytona Beach, FL 32114 Date President/Vice President Name Community College Name Address Dear President/Vice President: I am writing to ask your help in a study being conducted through the University of Central Florida, College of Education Graduate Program. This study is part of an effort to examine the perceptions that students, faculty, and administrators have of the student evaluation process and how they believe the data impact instruction and evaluation. This evaluation process is commonly referred to as student ratings of teaching. This study is limited to Florida community colleges which are similar in annual 2002-2003 unduplicated enrollment according to the National Center for Education Statistics. Therefore, the participation of your Community College will complement the research efforts. Results from the study will be used to enhance existing knowledge in the research area of student ratings of teaching particularly the use of the results to improve teaching effectiveness. With your assistance, I would like to arrange a visit to your campus during October or November. The study will involve surveying students and faculty. In addition, the project will include interviewing a small group of faculty and administrators. I will contact you by phone within the next week to schedule the visit. If you have any questions or comments about this study, I would be happy to talk with you. Please contact me at DBCC (386) 506-4403 or by e-mail at [email protected]. Sincerely, Judith P. Campbell Professor and English Language Institute/ESOL Chairperson College of Arts and Sciences University of Central Florida Educational Leadership Ed.D.Student
166
APPENDIX D
INTERVIEW QUESTIONS – ADMINISTRATORS
167
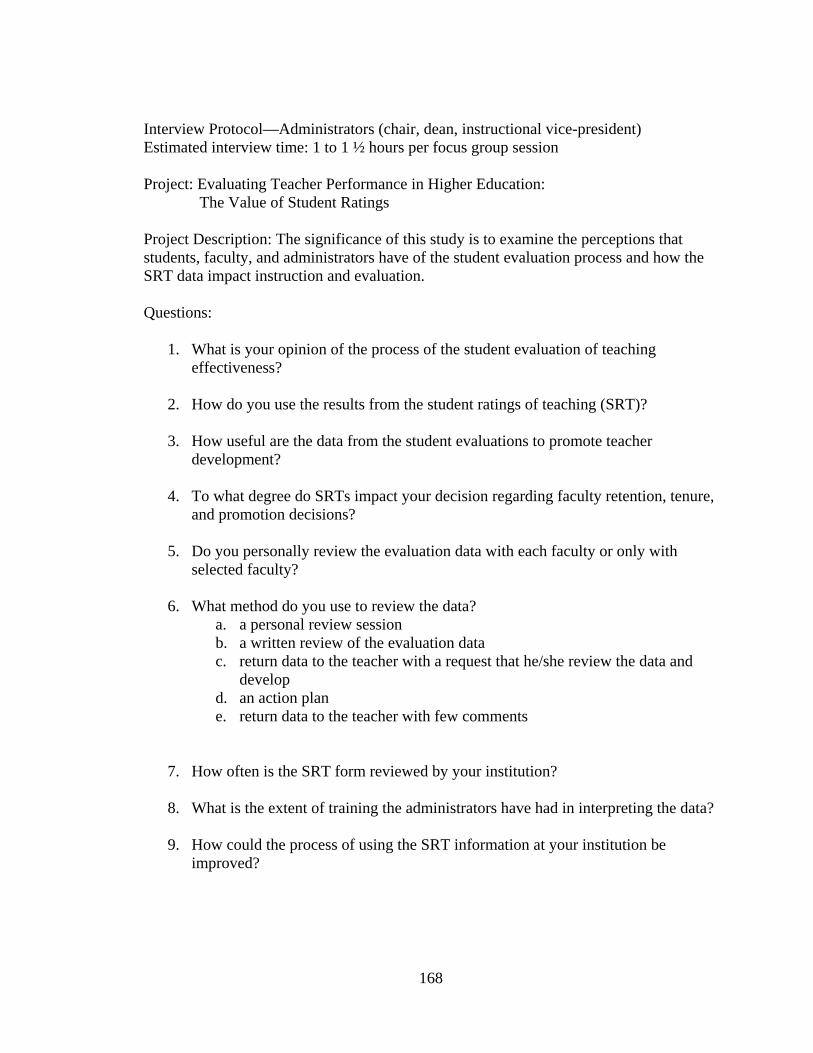
Interview Protocol—Administrators (chair, dean, instructional vice-president) Estimated interview time: 1 to 1 ½ hours per focus group session Project: Evaluating Teacher Performance in Higher Education:
The Value of Student Ratings Project Description: The significance of this study is to examine the perceptions that students, faculty, and administrators have of the student evaluation process and how the SRT data impact instruction and evaluation. Questions:
1. What is your opinion of the process of the student evaluation of teaching effectiveness?
2. How do you use the results from the student ratings of teaching (SRT)? 3. How useful are the data from the student evaluations to promote teacher
development? 4. To what degree do SRTs impact your decision regarding faculty retention, tenure,
and promotion decisions? 5. Do you personally review the evaluation data with each faculty or only with
selected faculty? 6. What method do you use to review the data?
a. a personal review session b. a written review of the evaluation data c. return data to the teacher with a request that he/she review the data and
develop d. an action plan e. return data to the teacher with few comments
7. How often is the SRT form reviewed by your institution? 8. What is the extent of training the administrators have had in interpreting the data? 9. How could the process of using the SRT information at your institution be
improved?
168
APPENDIX E
INTERVIEW QUESTIONS – FACULTY
169
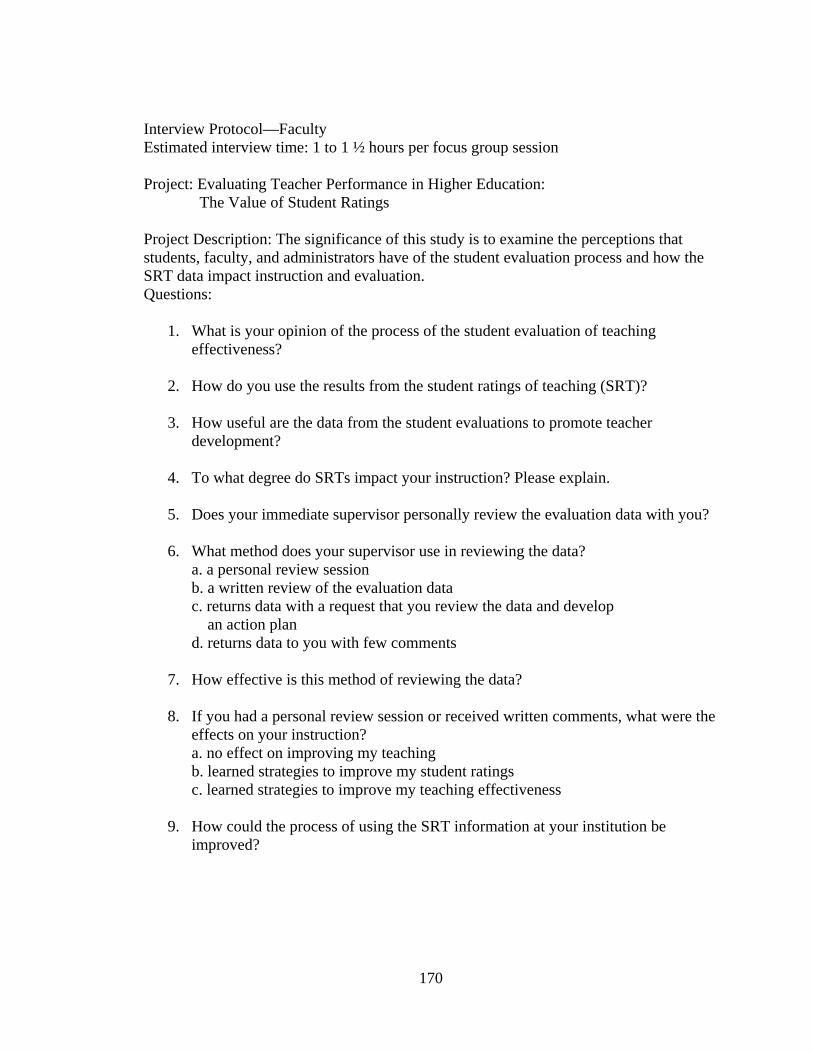
Interview Protocol—Faculty Estimated interview time: 1 to 1 ½ hours per focus group session Project: Evaluating Teacher Performance in Higher Education:
The Value of Student Ratings Project Description: The significance of this study is to examine the perceptions that students, faculty, and administrators have of the student evaluation process and how the SRT data impact instruction and evaluation. Questions:
1. What is your opinion of the process of the student evaluation of teaching effectiveness?
2. How do you use the results from the student ratings of teaching (SRT)? 3. How useful are the data from the student evaluations to promote teacher
development? 4. To what degree do SRTs impact your instruction? Please explain. 5. Does your immediate supervisor personally review the evaluation data with you? 6. What method does your supervisor use in reviewing the data?
a. a personal review session b. a written review of the evaluation data c. returns data with a request that you review the data and develop an action plan d. returns data to you with few comments
7. How effective is this method of reviewing the data? 8. If you had a personal review session or received written comments, what were the
effects on your instruction? a. no effect on improving my teaching b. learned strategies to improve my student ratings c. learned strategies to improve my teaching effectiveness
9. How could the process of using the SRT information at your institution be improved?
170
APPENDIX F
GRADING FACULTY SURVEY – STUDENT VERSION
171
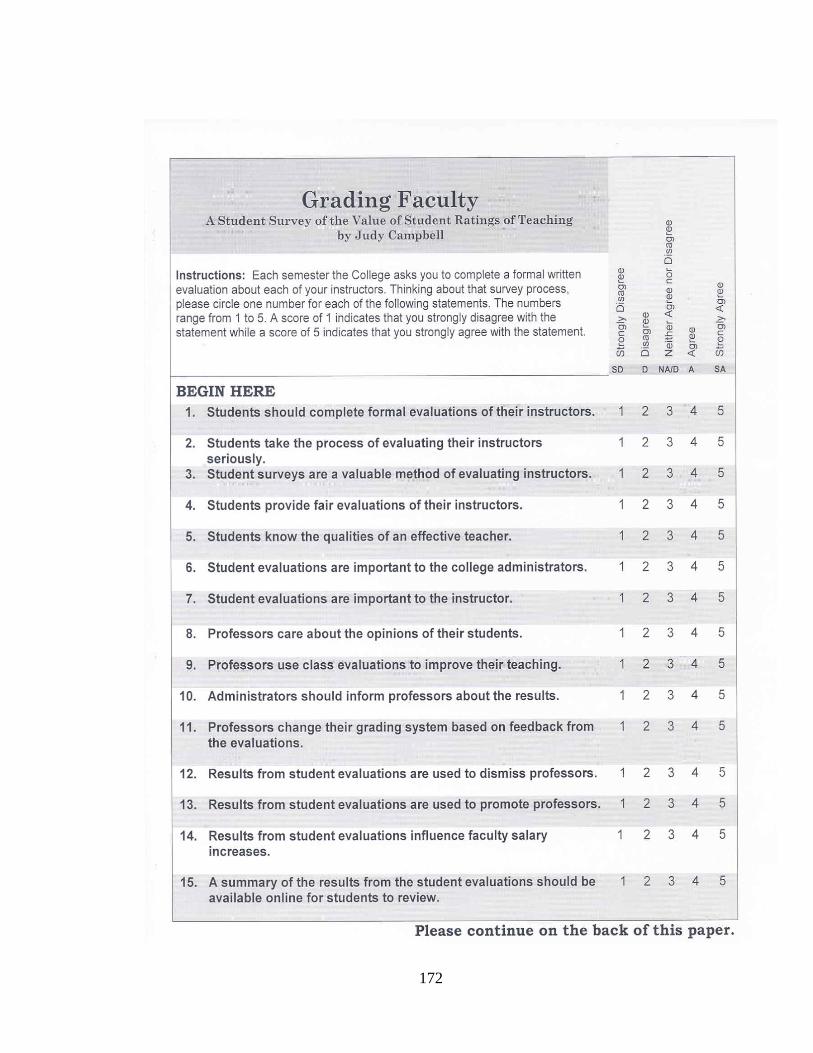
172
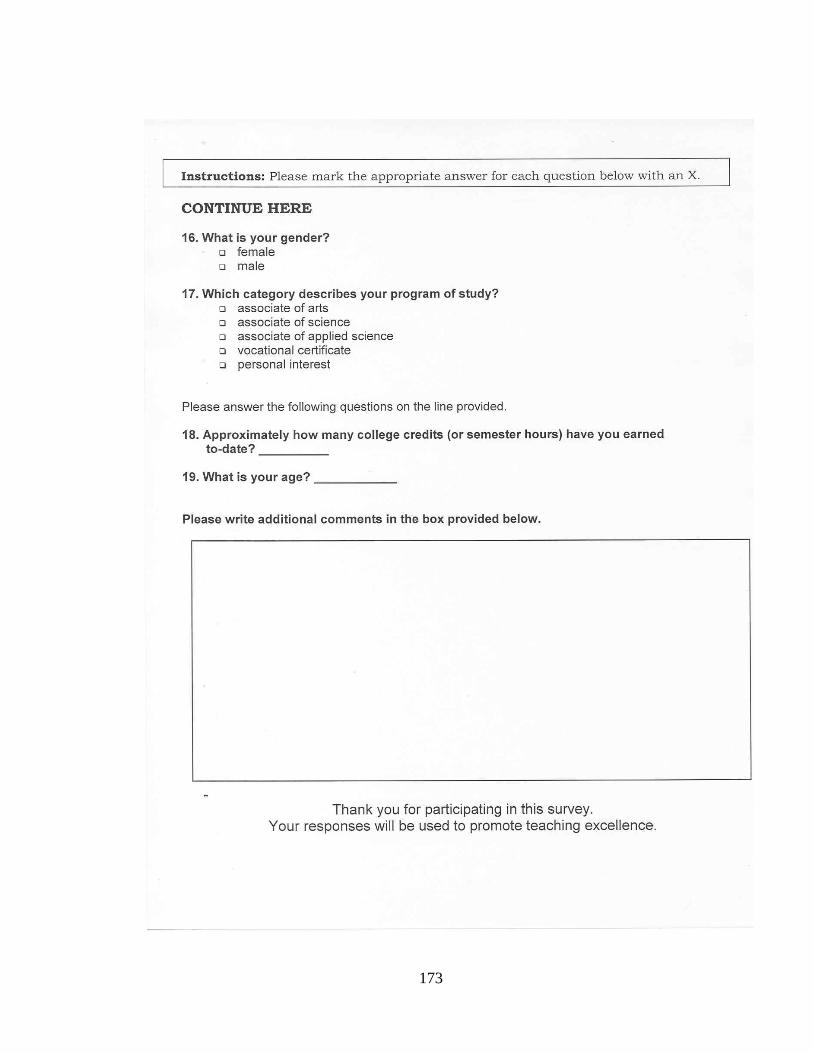
173
APPENDIX G
GRADING FACULTY SURVEY – FACULTY VERSION
174
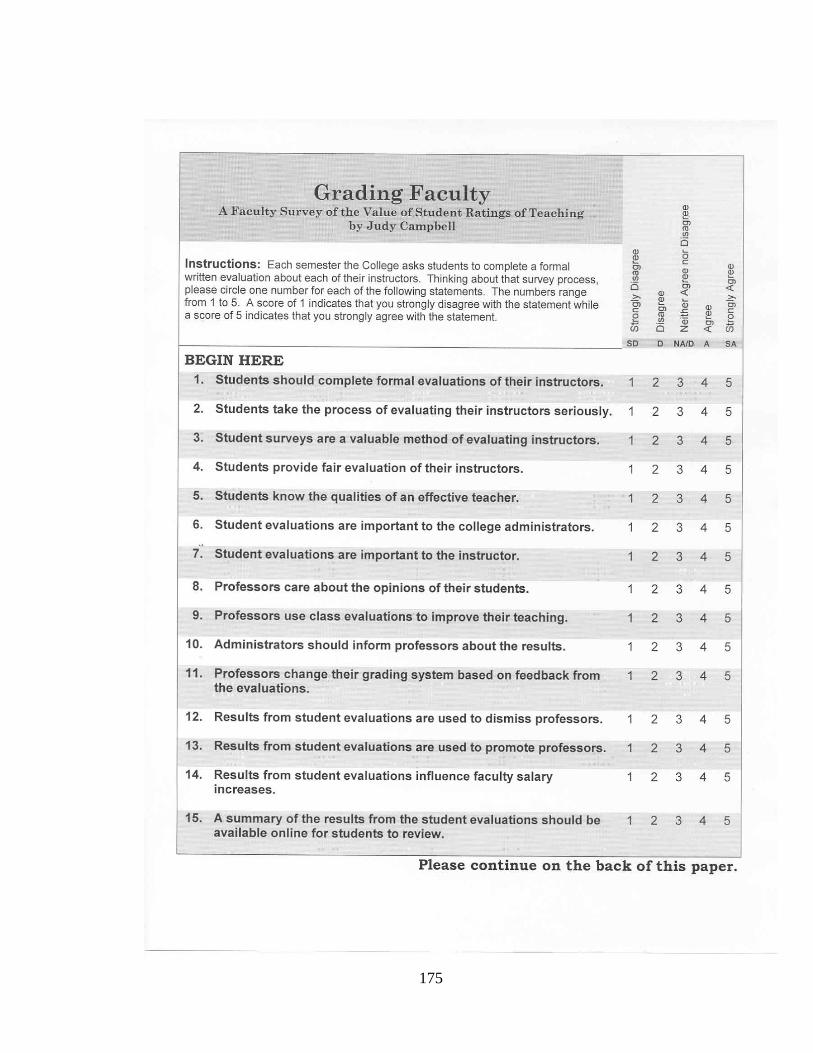
175
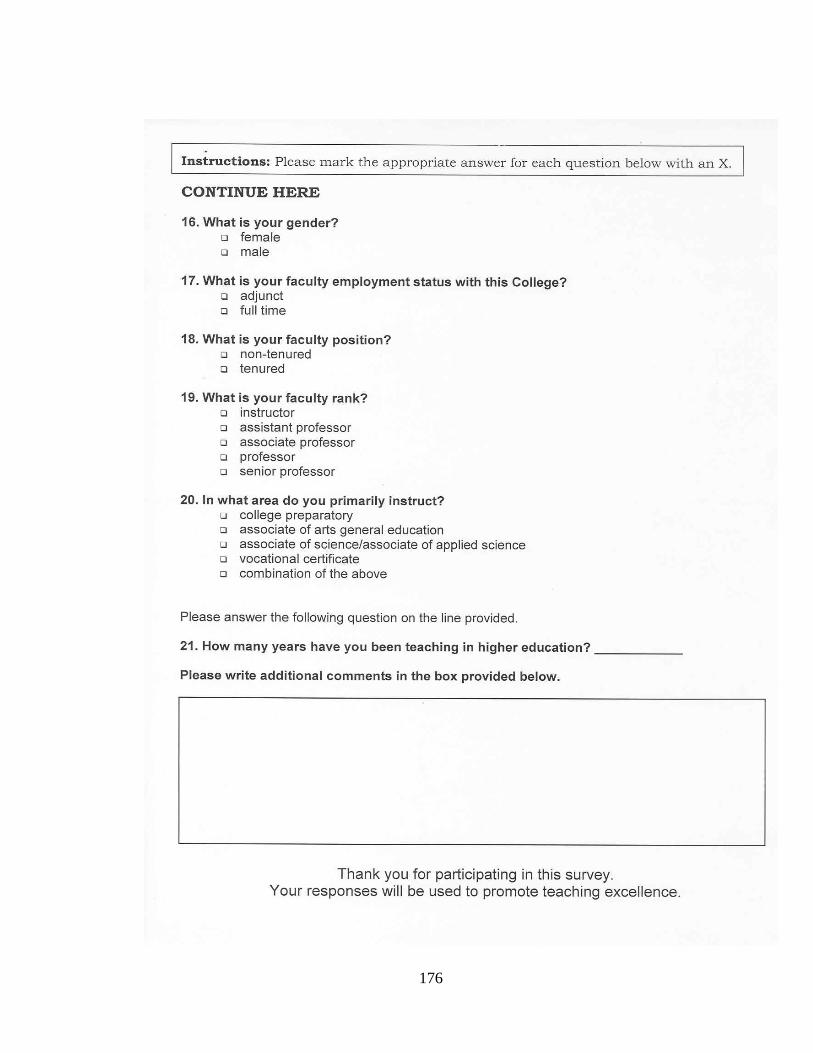
176
APPENDIX H
INFORMED CONSENT – STUDENT GROUP
177
College Classroom Participant Verbal Consent Hello. My name is Judy Campbell, and I am a graduate student at the University of Central Florida in the Department of Education. I am working on a research project supervised by faculty member Dr. William Bozeman. Our project is studying how students feel about evaluating teachers’ performance and how students believe this information is used. If you have previously completed a Student Evaluation of Instruction, I would like to ask you to participate in this survey that will take about ten minutes of your time. Participation is anonymous. I will not ask for your name or identifying information. You do not have to answer any question you do not wish to answer, and you may discontinue participation or withdraw your data at any time without consequence. There is no anticipated risk or direct benefit to participants. Although I cannot compensate you for your time, your participation is greatly appreciated. If you have any questions about the survey, you may contact Dr. Bozeman at (407) 823-1471. If you have any questions about research participants' rights, you may contact the University of Central Florida Institutional Review Board at (407) 823-2901. If you have previously completed a Student Evaluation of Instruction survey and are willing to answer some questions for our research project, let’s begin. Thank you for your willingness to participate.
178
APPENDIX I
INFORMED CONSENT – FACULTY GROUP
179
Dear Community College Educator: I am a graduate student at the University of Central Florida. As part of my research study, I am conducting a survey and interview of students, faculty, and administrators. The purpose of the study is to learn how students, faculty, and administrators feel about students evaluating teachers’ performance and how each group believes this information is used. I am asking you to participate in this interview as a faculty member of Community College. The interview, which will last approximately 90 minutes, will be conducted in a small faculty focus group of approximately four to five representatives. The interview will be held in an area designated by your Faculty Senate president after I receive your letter of consent. For your review, the list of questions is enclosed with this letter. You will not have to answer any question you do not wish to answer. With the group’s permission, I would like to audiotape the interview. I will be the only person to have access to the tape, which I will personally transcribe. All identifiers will be eliminated during transcription. The tape will then be erased. Your identity will be kept confidential; it will not be revealed in the final manuscript. Immediately following the interview session, you will be asked to complete a brief survey. There are no anticipated risks, compensation, or other direct benefits to you as a participant in this interview and survey. However, I will provide Community College a copy of the final research project. You are free to withdraw your consent to participate and may discontinue your participation in the interview and/or survey at any time without consequence. If you have any questions about this research project, please contact me at (386) 506-4403 or by e-mail at [email protected]. My faculty supervisor is Dr. William Bozeman. Questions or concerns about research participants' rights may be directed to the UCFIRB office, University of Central Florida Office of Research, Orlando Tech Center, 12443 Research Parkway, Suite 207, Orlando, FL 32826. The phone number is (407) 823-2901. Please sign and return one copy of the letter in the enclosed envelope. A second copy is provided for your records. By signing this letter, you give me permission to report your responses anonymously in the final manuscript to be submitted to my faculty advisor as part of my research. Sincerely, Judith P. Campbell Professor and English Language Institute/ESOL Chairperson I have read the procedure described above for the faculty small group interview. I voluntarily agree to participate in the interview and complete the survey. / Participant Date
180
APPENDIX J
INFORMED CONSENT – ADMINISTRATOR GROUP
181
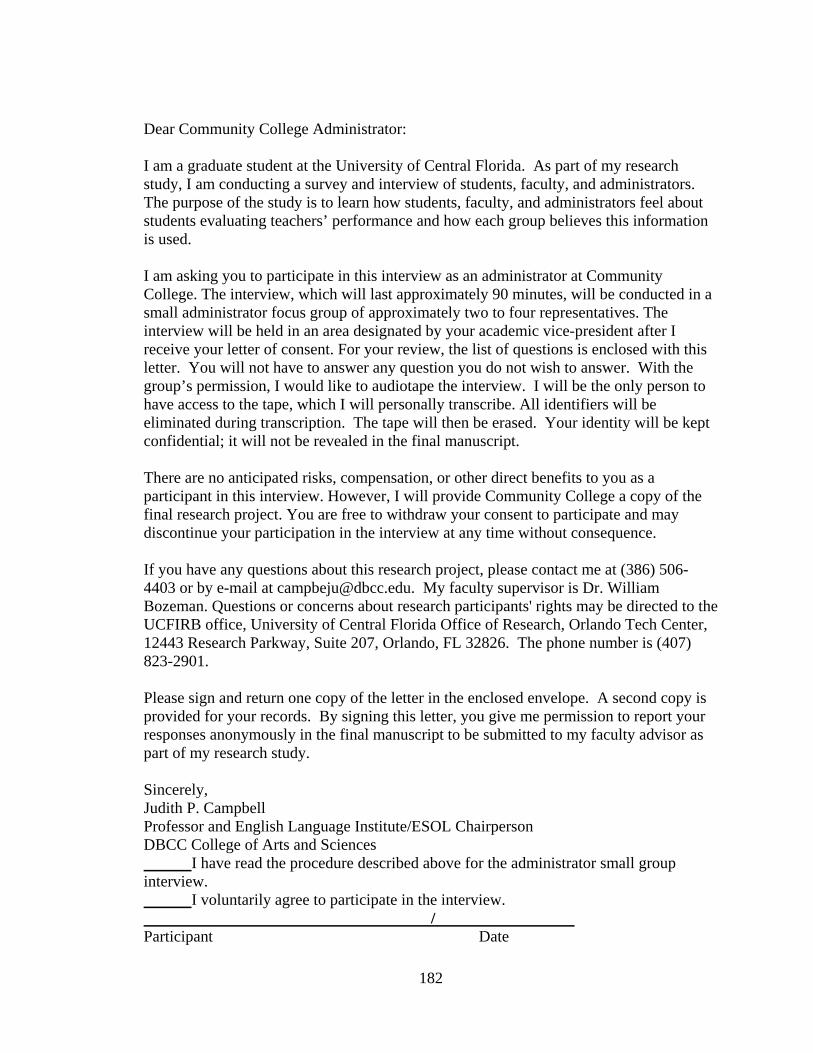
Dear Community College Administrator: I am a graduate student at the University of Central Florida. As part of my research study, I am conducting a survey and interview of students, faculty, and administrators. The purpose of the study is to learn how students, faculty, and administrators feel about students evaluating teachers’ performance and how each group believes this information is used. I am asking you to participate in this interview as an administrator at Community College. The interview, which will last approximately 90 minutes, will be conducted in a small administrator focus group of approximately two to four representatives. The interview will be held in an area designated by your academic vice-president after I receive your letter of consent. For your review, the list of questions is enclosed with this letter. You will not have to answer any question you do not wish to answer. With the group’s permission, I would like to audiotape the interview. I will be the only person to have access to the tape, which I will personally transcribe. All identifiers will be eliminated during transcription. The tape will then be erased. Your identity will be kept confidential; it will not be revealed in the final manuscript. There are no anticipated risks, compensation, or other direct benefits to you as a participant in this interview. However, I will provide Community College a copy of the final research project. You are free to withdraw your consent to participate and may discontinue your participation in the interview at any time without consequence. If you have any questions about this research project, please contact me at (386) 506-4403 or by e-mail at [email protected]. My faculty supervisor is Dr. William Bozeman. Questions or concerns about research participants' rights may be directed to the UCFIRB office, University of Central Florida Office of Research, Orlando Tech Center, 12443 Research Parkway, Suite 207, Orlando, FL 32826. The phone number is (407) 823-2901. Please sign and return one copy of the letter in the enclosed envelope. A second copy is provided for your records. By signing this letter, you give me permission to report your responses anonymously in the final manuscript to be submitted to my faculty advisor as part of my research study. Sincerely, Judith P. Campbell Professor and English Language Institute/ESOL Chairperson DBCC College of Arts and Sciences I have read the procedure described above for the administrator small group interview. I voluntarily agree to participate in the interview. / Participant Date
182
APPENDIX K
MEMO OF NEEDS FOR COLLEGE PARTICIPATION
183
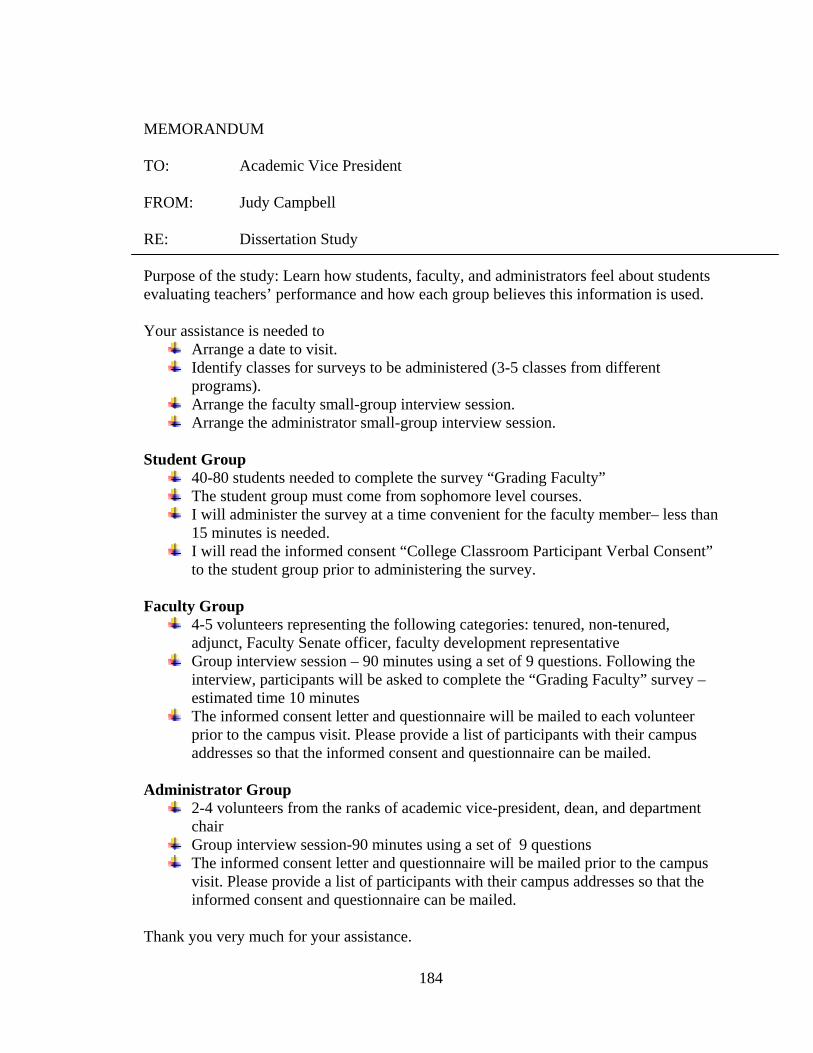
MEMORANDUM
TO: Academic Vice President FROM: Judy Campbell RE: Dissertation Study Purpose of the study: Learn how students, faculty, and administrators feel about students evaluating teachers’ performance and how each group believes this information is used. Your assistance is needed to
Arrange a date to visit. Identify classes for surveys to be administered (3-5 classes from different
programs). Arrange the faculty small-group interview session. Arrange the administrator small-group interview session.
Student Group
40-80 students needed to complete the survey “Grading Faculty” The student group must come from sophomore level courses. I will administer the survey at a time convenient for the faculty member– less than
15 minutes is needed. I will read the informed consent “College Classroom Participant Verbal Consent”
to the student group prior to administering the survey. Faculty Group
4-5 volunteers representing the following categories: tenured, non-tenured, adjunct, Faculty Senate officer, faculty development representative
Group interview session – 90 minutes using a set of 9 questions. Following the interview, participants will be asked to complete the “Grading Faculty” survey – estimated time 10 minutes
The informed consent letter and questionnaire will be mailed to each volunteer prior to the campus visit. Please provide a list of participants with their campus addresses so that the informed consent and questionnaire can be mailed.
Administrator Group
2-4 volunteers from the ranks of academic vice-president, dean, and department chair
Group interview session-90 minutes using a set of 9 questions The informed consent letter and questionnaire will be mailed prior to the campus
visit. Please provide a list of participants with their campus addresses so that the informed consent and questionnaire can be mailed.
Thank you very much for your assistance.
184

APPENDIX L
INSTITUTIONAL REVIEW BOARD PERMISSION LETTER
185
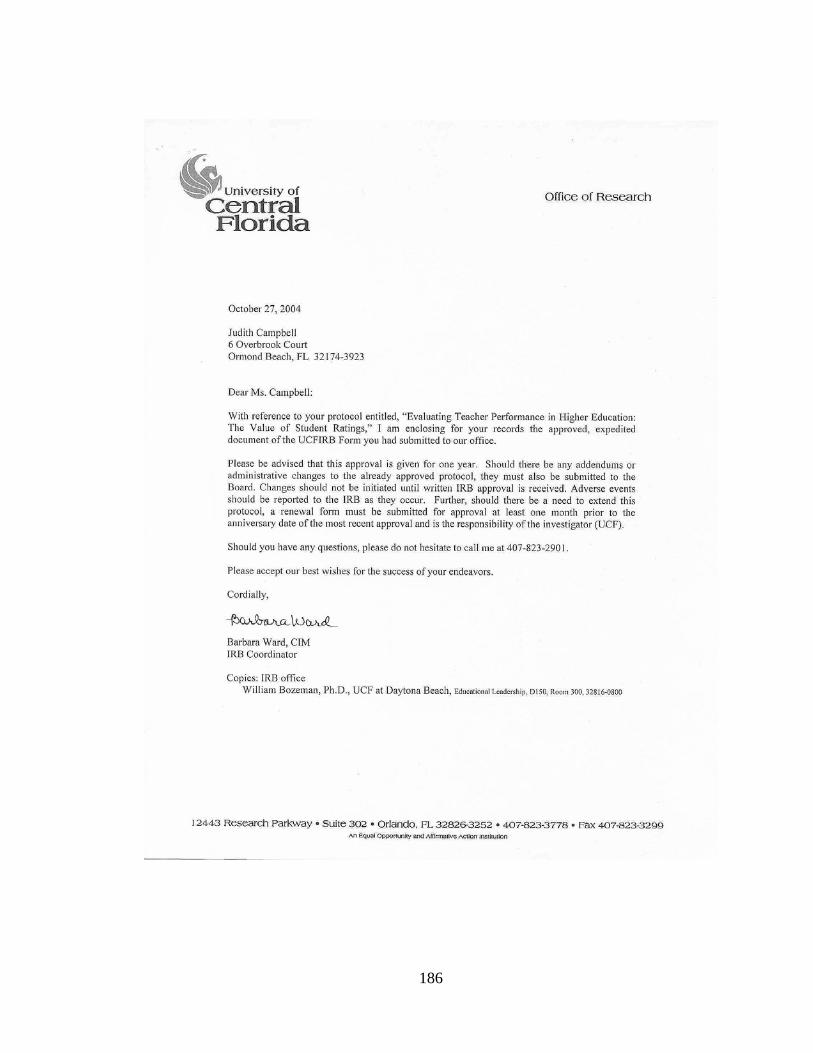
186
LIST OF REFERENCES
Abrami, P.C., & d’Apollonia, S. (1999). Current concerns are past concerns. American Psychologist, 54 (7), 519-520.
Abrami, P.C., Theall, M., & Mets, L.A. (Eds.). (2001). The student ratings debate: Are they valid? How can we best use them? New Directions for Institutional Research, no.109, (pp. 1-6). San Francisco: Jossey-Bass.
American Association of Community Colleges (n.d.). Community college fact sheet. Retrieved December 13, 2004, from http://www.aacc.nche.edu
Armstrong, J.S. (1998). Are student ratings of instruction useful? [Electronic version]. American Psychologist, 53 (11), 1223-1224.
Braskamp, L.A. & Ory, J.C. (1994). Assessing faculty work. San Francisco, CA: Jossey-Bass.
Cashin, W.E. (1999). Student ratings of teaching: Uses and misuses. In P.Selden (Ed.), Changing practices in evaluating teaching. Bolton, MA: Anker.
Centra, J.A. (1979). Determining faculty effectiveness. San Francisco, CA: Jossey-Bass.
Centra, J.A. (1993). Reflective faculty evaluation. San Francisco, CA: Jossey-Bass.
Centra, J.A. (2003). Will teachers receive higher student evaluations by giving higher grades and less course work? Research in Higher Education, 44 (5), 495-518.
Creswell, J. W. (1998). Qualitative inquiry and research design: Choosing among five traditions. Thousand Oaks, CA: Sage.
d’Apollonia, S., & Abrami, P.C. (1997). Navigating student ratings of instruction. American Psychologist, 52 (11), 1198-1208.
Dielmam, T. (2004). Applied regression analysis: A second course in business and economic statistics. Belmont, CA: Thomson.
Dillman, D.A. (1999). Mail and internet surveys: The tailored design method. New York, NY: Wiley.
187
Downey, J.A. (2003). Emotional awareness as a mediator of community college student satisfaction ratings. Community College Journal of Research and Practice, 27, 711-720.
Dunegan, K.J., & Hrivnak, M.W. (2003). Characteristics of mindless teaching evaluations and the moderating effects of image compatibility. Journal of Management Education, 27 (3), 280-303.
Edwards, C.H. (2000). Grade inflation: The effects on educational quality and personal well being. [Electronic version]. Education, 120 (3), 538-547.
Franklin, J. (2001). Interpreting the numbers: Using a narrative to help others read student evaluations of your teaching accurately. In K.G. Lewis (Ed.), Techniques and strategies for interpreting student evaluations. New Directions for Teaching and Learning, no. 87, (pp. 85-99). San Francisco: Jossey-Bass.
Forsyth, D. R. (2003). The professor’s guide to teaching: Psychological principles and practices. Washington, DC: American Psychological Association.
Gillmore, G.M., & Greenwald, A.G. (1999). Using statistical adjustment to reduce biases in student ratings. American Psychologist, 54 (7), 518-519.
Green, S.B., & Salkind, N.J. (2005). Using spss for windows and macintosh: Analyzing and understanding data (4th ed.). Upper Saddle River, New Jersey: Pearson.
Greenwald, A. G. (1997). Validity concerns and usefulness of student ratings of instruction. [Electronic version]. American Psychologist, 52 (11), 1182-1186.
Greenwald, A.G., & Gillmore, G.M. (1997). Grading leniency is a removable contaminant of student ratings. [Electronic version]. American Psychologist, 52 (11), 1209-1217.
Heppner, P.P., & Heppner, M.J. (2004). Writing and Publishing your thesis, dissertation research: A guide for students in the helping professions. Belmont, CA: Thomson.
Kulik, J.A. (2001). Student ratings: Validity, utility, and controversy. In M. Theall, P. Abrami, & L. Mets (Eds.), The student ratings debate: Are they valid? How can we best use them? New Directions for Institutional Research, no.109, (pp.9-25). San Francisco: Jossey-Bass.
Lesser, D., & Ferrand, J. (2000). Effect of class size, grades given, and academic field on student opinion of instruction. Community College Journal of Research and Practice, 24, 269-277.
Lomax, R. G. (2001). An introduction to statistical concepts for education and behavioral sciences. Mahwah, New Jersey: Lawrence Erlbaum Associates.
188
Marsh, H. W. (1987). Students’ evaluations of university teaching: Research findings, methodological issues, and directions for future research. International Journal of Educational Research, 11 (3), 253-388.
Marsh, H. W. & Roche, L. A. (1993). The use of students’ evaluations and an individually structured intervention to enhance university teaching effectiveness. American Educational Research Journal, 30 (1), 217-251.
Marsh, H. W. & Roche, L.A. (1997). Making students evaluations of teaching effectiveness effective: The critical issues of validity, bias, and utility. [Electronic version]. American Psychologist, 52 (11), 1187-1197.
Marsh, H.W., & Roche, L.A. (1999). Rely upon set research. American Psychologist, 54 (7), 517-518.
McKeachie, W.J. (1997). Student ratings: The validity of use. [Electronic version]. American Psychologist, 52 (11), 1218-1225.
Merriam-Webster’s collegiate dictionary (10th ed.). (1993). Springfield, MA: Merriam-Webster.
Messick, S. (1995). Validity of psychological assessment: Validation of inferences from persons responses and performances as scientific inquiry into score meaning. American Psychologist, 50 (9), 741-749.
Miller, R.I., Finley, C., & Vancko, C.S. (2000). Evaluating, improving, and judging faculty performance in two-year colleges. Westport, CT: Greenwood.
Moustakas, C. (1994). Phenomenological research methods. Thousand Oaks, CA:Sage.
Naftulin, D.H., Ware, J.E., & Donnelly, F.A. (1973). The doctor fox lecture: A paradigm of educational seduction. Journal of Medical Education, 48, 630-635.
Olivares, O.J. (2003). A conceptual and analytic critique of student ratings of teachers in the USA with implications for teacher effectiveness and student learning. Teaching in Higher Education, 8 (2), 233-245.
Ory, J. C. (2001). Faculty thoughts and concerns about student ratings. In K.G. Lewis (Ed.), Techniques and strategies for interpreting student evaluations. New Directions for Teaching and Learning, No. 87, (pp. 3-15). San Francisco: Jossey Bass.
Ory, J.C., & Ryan, K. (2001). How do student ratings measure up to a new validity framework? In M. Theall, P. Abrami, & L. Mets (Eds.), The student ratings debate: Are they valid? How can we best use them? New Directions for Institutional Research, no.109, (pp. 27-44). San Francisco: Jossey-Bass.
189
Paulsen, M.B. (2002). Evaluating teaching performance. New Directions for Institutional Research, no.114, (pp. 5-18). San Francisco: Jossey-Bass.
Penny, A.R. (2003). Changing the agenda for research into students’ views about university teaching: Four shortcomings of SRT research. Teaching in Higher Education, 8 (3), 399-411.
Seldin, P. (1984). Changing practices in faculty evaluation: A critical assessment and recommendations for improvement. San Francisco, CA: Jossey-Bass.
Seldin, P. (1999). Changing practices in evaluating teaching: A practical guide to improved faculty performance and promotion/tenure decisions. Bolton, MA: Anker.
SPSS, Version 11.5 (2002). SPSS for windows. Chicago, IL: SPSS Inc.
Theall, M. & Franklin, J. (2001). Looking for bias in all the wrong places: A search for truth or a witch hunt in student ratings of instruction. In M. Theall, P. Abrami, & L. Mets (Eds.), The student ratings debate: Are they valid? How can we best use them? New Directions for Institutional Research, no.109, (pp. 45-56). San Francisco: Jossey-Bass.
Trout, P. (2000). Flunking the test: The dismal record of student evaluations. [Electronic version]. Academe, 86(4), 58-61.
U.S. Department of Education, National Center for Education Statistics. Integrated Postsecondary Education Data System. 2004 [Data file]. Available from IPEDS College Opportunities Web site, http://nces.ed.gov/ipeds/cool
Van Dalen, D.B. (1966). Understanding educational research. New York: McGraw-Hill.
190