evaluating the relative efficiency of commercial banks in
TRANSCRIPT

International Business Research; Vol. 6, No. 4; 2013 ISSN 1913-9004 E-ISSN 1913-9012
Published by Canadian Center of Science and Education
129
Evaluating the Relative Efficiency of Commercial Banks in Turkey: An Integrated AHP/DEA Approach
Ilker Murat Ar1 & Ahmet Kurtaran1
1 Department of Business Administration, Karadeniz Technical University, Trabzon, Turkey
Correspondence: Ahmet Kurtaran, Department of Business Administration, Karadeniz Technical University, Trabzon, Turkey. Tel: 90-462-377-8779. E-mail: [email protected]
Received: January 29, 2013 Accepted: March 1, 2013 Online Published: March 11, 2013
doi:10.5539/ibr.v6n4p129 URL: http://dx.doi.org/10.5539/ibr.v6n4p129
Abstract
This study measures the relative efficiency of 13 commercial banks in Turkey for the year of 2011 with an integrated approach includes Analytic Hierarchy Process and Data Envelopment Analysis. It uses two inputs (personnel expenditures and number of branch) and four outputs (deposits-national currency, deposits-foreign currency and precious metal, cash loans, and non-cash loans) in terms of production approach. According to empirical result, state-owned commercial banks are efficient in both CCR (Charnes-Cooper-Rhodes) and BCC (Banker-Charnes-Cooper) model. However, foreign-owned commercial banks have the lower efficiency scores than both state-owned and private-owned commercial banks. The results also suggest that inefficient banks should especially improve their non-cash loans and should focus on their annual personnel expenditure. Moreover, more than half of the commercial banks are scale inefficiency. The results of the study may be useful for the bank managers in assessing their performance.
Keywords: efficiency analysis, data envelopment analysis, analytic hierarchy process, weight restrictions, commercial banks, Turkey
1. Introduction
Banking sector in transition and developing economies has experienced major transformations since the 1990s. Over the last few decades, the banking sectors around the world have experienced financial globalization, technological changes, and competition. Banks are also faced with increasing competition and rising costs as a result of regulatory requirements, financial and technological innovation, and challenges of the recent financial crisis. Moreover, banking sector has changed with the advanced applications in computer and communications technology and introduction of new financial instruments. Such changes have significantly modified bank production. In this regard, a frequently asked question is about the effect of these changes on the efficiency of banks (Grigorian & Manole, 2002). So, efficiency analysis of banks has received increasing attention from researchers in recent years. It has also become important to assess the relative role of different institutional and policy settings in explaining the difference between banks (Grigorian & Manole, 2002).
Due to the increased competition in developed countries, financial institutions look for expanding their market shares in developing countries as Turkey. The banking system in Turkey is the most common instrument in exercising economic and monetary policy. Thus, efficiency analysis of the banks is the key issue in the Turkish managers’ agenda. Also, efficiency measurement of the banks has an important role in the efficiency of Turkish financial system. It is not surprising that the banking sector and its efficiency is one of the most popular issues in Turkey.
Turkey has a notably (8.5%) economic growth while average economic growth rate of the world is 3.9% in 2011 (The Banks Association of Turkey, 2012). Therefore, Turkish banking sector has been taken attention all over the world. According to data from The Banks Association of Turkey (2012), Figure 1 presents proportion of size Turkish banking sector to Gross Domestic Product (GDP) by years. As shown the Figure 1, proportion of total assets, loans and deposits to GDP invariably in last seven years exception for decrease deposit rate in 2011. Especially it can be said that increase of asset/GDP with 90% is most remarkable growing. Consequently, Turkish banking sector has grown as far as GDP upward.

www.ccsen
Turkish babanks, andRegulationAgency (2have an imin the econcheckable overall peinvestors,
Data Envecommonlythat are opin which pmethods inallows us banks. Thimultiple cr
This studyfollows: Soutputs in the model the study.
2. Literatu
Effective wa lot of stunon-paramregression approacheenvironme
Non-parammost favorpopular todecision-mmost commreliable too
There are (VassilogloPastor, 19
et.org/ibr
anking systemd development n and Supervi2011), they reamportant role innomies for two
deposit liabilerformance anmanagers and,
elopment Anay used non-parperating more poorly performn order to meato measure anis study has criteria decision
y aims to meaSection 2 gives
similar studieused in this st
ure Review
working of banudies on efficie
metric methodanalysis, an
s specify a funental factors, an
metric techniqured approach ools for perf
making-unit (Dmonly used nool for determin
numerous apou & Giokas, 97; Golany &
Figu
m constitutes tht and investmension Agency,
ached the total n Turkish banko reasons. Firstlities representnd monitoring , of course, reg
alysis (DEA), rametric approefficiently in c
ming firms neeasure the relativn individual baombined the An making and D
sure the relatis a brief revies. Section 3 gitudy and intro
nking sector haency of banks
ds for efficiennd stochastic nctional form nd allow for ra
ues do not req(AlKhathlan &formance mea
DMU) by comon-parametric ning banks ope
pplications of 1990; Al-Faraj
& Storbeck, 19
Internationa
ure 1. Turkish b
hree functionant banks. The 2011). Accordassets of 1217king system. Atly, they providt the bulk of their financi
gulators (Yue,
which is a moach to estimacomparison to ed to improve ve efficiency oank performanAnalytic HieraDEA to create
ve efficiency ew of the relevives a theoreticduces the data
as a substantiain the literatur
ncy measuremfrontier analfor the cost, p
andom error (A
quire the spec& Malik, 2010asurement. It
mparing how wtechnique in theration efficien
DEA in the aj et al., 1993; 999; Dekker &
al Business Res
130
banking sector
al banking gronumber of theding to statisti7.7 billion TRYAccording to Yde a major southe nation’s mal condition i1992).
mathematical pating the effici
other firms in(Malhotra et
of financial insnce by measurarchy Process a suitable perf
of commerciavant literaturecal backgrouna. Results are g
al position on dre. There are t
ment of bankslysis are genprofit, or prodAlKhathlan &
ification of an0). DEA, as a t determines
well the DMU he banking sencies.
bank performSherman & La
& Post, 2001;
earch
r (2002-2011)
oups such as ese banks is 31ics from BankY by the year oYue (1992), cource of financiamoney stock. is important t
programming aient frontier. Dn the industry. al., 2009). So
stitutions. In thring its efficie(AHP) which
formance eval
al banks in Tur and specificad on the reseagiven in sectio
development otwo measurems in the liter
neral parametrduction relationMalik, 2010).
n a priori funcnon-parametrthe productivconverts inpuctor. Barr et al
mance literaturadino, 1995; APorembski et
commercial b1, 4 and 13 respking Regulatioof 2011. Thus,
ommercial bankal intermediatiMeasuring an
to depositors,
approach, hasDEA clearly brMoreover, it p, it is also the
he banking secncy compared
h is a popular tuation model.
rkey by DEA.ally variables urch methods. S
on 5. Finally, s
of financial mament techniquesrature. Financric methods. nship among i
ctional form aric technique, ve efficiency
uts into outputl. (2002) indic
re. For exampAthanassopoult al., 2005; M
Vol. 6, No. 4;
banks, particippectively (Ban
on and Superv commercial bks have a vitalion. Secondly, nd evaluating
owners, pote
become the rings out the fpoints out the e most widely ctor, DEA apprd to the peer gtool in the fie
. It is organizeused as inputsSection 4 descsection 6 concl
arkets. So, thers as parametriccial ratio anal
These paraminputs, outputs
nd therefore iis one of the
of a systemts. DEA is alsocated that DEA
ple many schos, 1997; Lov
Mansoury & Sa
2013
ation nking vision banks l role their their
ential
most firms areas used
roach group eld of
ed as s and cribes ludes
re are c and lysis,
metric s and
is the most
m or o the
A is a
holars ell & alehi,

www.ccsenet.org/ibr International Business Research Vol. 6, No. 4; 2013
131
2011) evaluated the branch efficiency. They focused on branches of the only one bank.
DEA was also used to measure the bank efficiency for various countries by many researchers (Berg et al., 1993; Altunbas & Molyneux, 1996; Allen & Rai, 1996; Pastor et al., 1997; Kuosmanen & Post, 2001; Grigorian & Manole, 2002; Maudos et al., 2002; Maea, 2010). They aimed to present the effects of country’s regulatory environments on bank efficiency.
This study focuses on the efficiency measurement of commercial banks in Turkey. So, its literature review was restricted with studies using DEA models for efficiency measurement of commercial banks. As a conclusion, much information about selected studies is given in Table 1. Table 1. Selected studies focus on the efficiency measurement of commercial banks
Study Sample Inputs Outputs Model
Yue (1992) 60 Missouri (USA)
commercial banks
-Interest expenses
-Non-interest expenses
-Transaction deposits
-Non-transaction deposits
-Interest income
-Non-interest income
-Total loans
CCR
Taylor et al.
(1997)
13 Mexican
commercial banks
-Total deposits
-Non-interest expense
-Total income (interest income plus
non-interest income)
CCR and
BCC-Input
oriented
Al-Shammari
and Salimi
(1998)
16 Jordan
commercial banks
No inputs were specified -Return on investment
-Return on equity
-Earnings per share
-Credits to total assets
-Credits to deposits
-Cash and portfolio investment to deposits
DEA - Ratio
model
Avkiran (1999) 23 Australian
trading banks
Model A DEA
-Interest expense
-Non-interest expense
-Deposits
-Staff numbers
Model B
-Net-interest income
-Non-interest income
-Net loans
-Non-interest income
Saha and
Ravisankar
(2000)
25 Indian
commercial banks
-Number of branches
-Number of employees
-Establishment expenditure
-Non-establishment expenditure
-Deposits
-Advances
-Investments
-Spread
-Total income
-Interest income
-Non-interest income
-Working funds
CCR-Input
oriented
model
Barr et al.
(2002)
50 US commercial
banks
-Laboring costs
-Fixed assets
-Interest and Non-interest costs
-Deposits
-Revenues
-Interest incomes
-Non-interest incomes
CCR-Input
oriented
Sathye (2003) 94 Indian
commercial banks
Model A BCC- Input
oriented -Interest expenses
-Non-interest expenses
-Net interest income
-Non-interest income
Model B
-Deposits
-Staff numbers
-Net loans
-Non-interest income
Halkos and
Salamouris
(2004)
15, 17, and 19
Greek commercial
banks for each
No inputs were specified -Return difference of interest bearing
assets
-Return on equity
-Return on total assets
-Efficiency ratio
-Net interest margin
CCR and
BCC- Ratio
model
Portela and
Thanassoulis
(2005)
60 Portuguese
bank branches
-Number of staff
-Value current accounts
-Supply costs
-Value other resources
-Value credit by bank
-Value credit associates
BCC-Input
oriented

www.ccsenet.org/ibr International Business Research Vol. 6, No. 4; 2013
132
Li (2006) 14 Chinese commercial banks
-Employees -Capital -Operating charge rate
-Profit -Rate/person -Income rate of assets -Returning rate of capital -Trading volume by cards/person
CCR
Chen-guo et al. (2007)
14 Chinese commercial banks
-The average number of workers -Net amount of fixed capital -The total amount of costs (cost of interest)
-Total amount of deposit -Total amount of loan -Total amount of profit before paying tax
BCC
Navabakhsh et al. (2007)
20 Iranian commercial banks
-Payable interest -Personnel -Non-performing loans -Number of branch
-Main deposits -Other deposits -Loans granted -Received interest -Fee
CCR-Input
and Output
oriented
Chansarn (2008)
13 Thai commercial banks
Operational Approach CCR
-Interest expenses -Labor related expenses -Capital related expenses
-Interest and dividend incomes -Non-interest incomes
Intermediation Approach
-Total deposits -Total expense
-Total loans -Net investments
Weiguo and Ming (2008)
5 American and 4 Chinese commercialbanks
American Banks CCR and
BCC -Operational expense -Total deposit -Provision for bad debt
-Net profit -Total loan
Chinese Banks
-Work force -Physical assets -Loanable funds
-Interest income -Non-interest income
Subramanyam and Reddy (2008)
63 Indian commercial banks
-Number of employees -Fixed assets
-Deposits -Loans and advances -Investments -Non-interest income
CCR
Moffat and Valadkhani (2009)
10 major banks in Botswana
Value-added approach CCR and
BCC -Labour (salaries) -Capital related operating expenses -Interest expenses
-Loans -Investment -Deposits
Intermediation approach
-Deposits -Labour (salaries) -Capital related operating expenses
-Loans -Investment
Operating approach
-Interest expenses -Labour (salaries) -Capital related operating expenses
-Interest income -Non-interest income
Tahir et al. (2009)
22 Malaysian commercial banks
-Total deposits -Total overhead expenses
-Total earning assets BCC-Input
oriented
AlKhathlan and Malik (2010)
10 Saudi Arabian commercialbanks
-Operating expenses -Equity capital -Deposits
-Loans and advances (net) CCR and
BCC- Input
oriented
Akhtar et al. (2011)
12 commercial banks in Pakistan
-Operating expense -Advances -Capital
-Operating income -Net-interest income
CCR andBCC
- Input
oriented
Varias and Sofianopoulou (2012)
19 biggest Greek commercial banks
-Interest expenses/deposits -Other overhead expenses/fixed assets -Personnel expenses/total assets
-Loans -Other earning assets -Deposits
BCC-Input
oriented
Ji et al. (2012) 17 Chinese commercial banks
-Number of employees -Interest expense -Non-interest expenses -Total assets
-Non-interest income -Interest income -Non-performing loan ratio
CCR-Input
Oriented

www.ccsenet.org/ibr International Business Research Vol. 6, No. 4; 2013
133
Rao and Lakew (2012)
8 and 12 Ethiopian commercialbanks
-Total expenditures on employees -Book value of physical capital and premises
-Total customer loans less provision for doubtful -Loans -Total customer deposits
BCC-Input
oriented
There are a number of studies about commercial banks in Turkey. Denizer et al. (2000) employed the DEA to estimate the relative efficiency of 49 commercial banks in Turkey for each year from 1970 to 1994. Jackson and Fethi (2000) investigate the performance of Turkish commercial banking sector. Isik and Hassan (2002) investigated input and output efficiency in the Turkish banking industry to understand the impact of various measures. They also estimated the efficiency of Turkish banks over the 1988-1996 periods. Yunten and Caner (2004) investigated the relative efficiencies of 19 Turkish commercial banks that have been operated between 1999 and 2002.Ozkan-Gunay and Tektas (2006) determined the relative technical efficiency of non-public commercial banks in Turkey between 1990 and 2001 by DEA model. Percin and Ayan (2006) evaluated the efficiency of 31 commercial banks in Turkey using DEA and Malmquist Productivity Index methodologies for the year 2003 and 2004. Ayranci (2011) analyzed the private Turkish commercial banking sector (48 banks) with DEA.
AHP is a tool at the hands of decision makers as one of the most widely used multiple criteria decision making tools. Many studies have been done based on AHP including applications of AHP in different fields such as planning, selecting a best alternative, resource allocations, resolving conflict, optimization, etc. (Vaidya & Kumar, 2006). Many studies have indicated that AHP can be applied form an AHP/DEA ranking model for improving DEA usability by deriving comparative weight from inputs/outputs via AHP pair wise comparison (Tseng & Lee, 2009).
Efficiency analysis via a combined method with AHP and DEA can be performed by two approaches. In the first approach, DEA is run for each pair of units separately and then the pair wise evaluation matrix generated DEA stage is utilized to rank scale the units via AHP approach. This approach was used in many fields such as 3PL vendor selection (Zhang et al., 2006) and hotel ranking (Rouyendegh & Erkan, 2010).
In the second approach, AHP was used to determine the weight of any qualitative criteria (input or outputs) verified and then, the DEA model was used for solving the multi-objective model to identify the best alternatives. AHP is used for the weight determination or restriction in this approach. It was used in warehouse operators selection (Korpela et al., 2007), bridge risks assessment (Wang et al., 2008),relative efficiency of greenhouse gas technologies (Lee et al., 2008), supplier performance (Yuan et al., 2008), the efficiency of R&D management activities in universities (Feng et al., 2004) and also hydrogen R&D programs (Lee et al., 2010), smartphone comparisons (Peaw & Mustafa, 2006), evaluating the flexible manufacturing systems (Rezaie at al., 2010), measuring the agility of manufacturing systems (Saleeshya & Babu, 2012).
As shown in literature review, there is no study focus on relative efficiency of commercial banks by integrated with AHP and DEA approach. Furthermore, such a study that analyzes the relative efficiency of commercial banks in Turkey can be considered an important contribution to the literature.
3. Research Method
3.1 Data Envelopment Analysis
Data Envelopment Analysis (DEA) is a non-parametric approach to efficiency measurement of similar organizational units called Decision Making Units (DMUs). Its basic foundation was generated from Farrell’s (1957) original work that was later popularized by Charnes et al. (1978). DEA provides a single measure and easily deals with multiple inputs and multiple outputs (Agha et al., 2011).
DEA has two models as CCR and BCC. CCR (Charnes-Cooper-Rhodes) model is the basic DEA model which assumes constant returns to scale (CRS) was proposed by Charnes et al. (1978). This model assumes that all DMUs are operating at an optimal scale. However, Banker et al. (1984) suggested BCC (Banker-Charnes-Cooper) model as an extension of the CRS model to account for variable returns to scale (VRS) situation.
DEA models typically measure technical efficiency in one of two ways. Input oriented models measure how much each DMU can reduce its inputs while producing the original level of output. However, output oriented models measure how much each DMU can expand its output while holding inputs unchanged.
Assuming n DMUs with m inputs and s outputs, the primal output CCR and BCC model related to DMUk are as shown in Equations 1 and 2. Efficiency score is less than or equal to 1. When the efficiency score is 1, DMU is

www.ccsenet.org/ibr International Business Research Vol. 6, No. 4; 2013
134
regarded as an efficient frontier.
Output Oriented CCR Model Output Oriented BCC Model
min E v x 1
u y 1
u y v x 0
u , v
j 1, … . , n r 1, … , s i 1, … . . , m
min E v x µ 2
u y 1
u y v x µ 0
u , v µ serbest
j 1, … . , n r 1, … , s i 1, … . . , m
Ek=the efficiency score of kth DMU
vik: weight given to ith input by kth DMU
xik: amount of ith input utilized by kth DMU
urk: weight given to rth output by kth DMU
yrk: amount of rth output produced by kth DMU
xij: ith input of the jth DMU
yrj: rth output of the jth DMU
ε: sufficiently small positive number (e.g. 0,00001)
According to Bobe (2009), DEA is a powerful tool in that because (i) it evaluates the efficiency performance of a DMU relative to other DMUs either for a period or over number of periods (benchmarking); (ii) it provides monitoring information for a specific DMU over a period of time; (iii) it suggests the benchmark DMUs (reference set) that can be used to estimate the efficient amount of resources required to achieve the same level of outputs; and (iv) it estimates the potential reductions in inputs needed to achieve the same level of outputs and/or the potential increase in outputs using the same level of inputs. There are, however, some limitations of DEA. First, the efficiency score obtained by a DMU is sensitive to the number of inputs and outputs used in the analysis. Second, classical DEA does not provide statistical inferences. Third, DEA results may be misleading. An efficiency score of 1 does not necessarily mean that the performance of a DMU is the best. It only indicates, relative to the other DMUs in the group, that the DMU is considered to be efficient. Fourth, specification of inputs and outputs may appear to be more subjective.
3.2 Analytic Hierarchy Process
The Analytic Hierarchy Process (AHP) enables decision makers to structure a complex problem in the form of a simple hierarchy and to evaluate a large number of quantitative and qualitative factors in a systematic manner under multiple conflicting criteria (Lee et al., 2008).
According to Saaty (2008), to make a decision in an organized way to generate priorities we need to decompose the decision into the following steps: (i) Define the problem and determine the kind of knowledge sought. (ii) Structure the decision hierarchy from the top with the goal of the decision, then the objectives from a broad perspective, through the intermediate levels (criteria) to the lowest level (alternatives). (iii) Construct a set of pairwise comparison matrices. Each element in an upper level is used to compare the elements in the level immediately below with respect to it. (iv) Use the priorities obtained from the comparisons to weight the priorities in the level immediately below. Then for each element in the level below add its weighted values and obtain its global priority.
To make comparing, AHP uses the scale for pairwise comparisons. The numbers 1, 3, 5, 7, and 9 are used as

www.ccsenet.org/ibr International Business Research Vol. 6, No. 4; 2013
135
scaling ratios, and correspond to the strength of preference for one element over another. For example, the number 9 indicates a case of extreme importance over another element. After pairwise comparisons are conducted, the weights of the criteria are calculated and checked for consistency. Then, a review of the consistency ratio (CR) is conducted in order to ensure that it falls between 0 and 0.10. CR is determined to be the ratio of Consistency Index (CI) to Random Index (RI). The fact that CR is determined to be greater than 0 but less than 0.10 implies a satisfactory degree of consistency in the pairwise comparisons matrix. We then aggregate the weights.
3.3 Integrated with AHP and DEA
Efficiency that refers to the relationship between output and input does not employ multiple inputs to produce multiple outputs because it is limited only to a single output and a single input. Hence, it is extended into weighted sum of outputs and weighted sum of inputs. So, it can be said that the key issue is how to assign weights to each input and output in the efficiency analysis. Thus, the weights, uj and vj, are determined by solving the DEA model. These weights developed by DEA may not represent the same relative subjective weights that management might apply as to the relative importance of the variables (especially the output variables) used in the DEA models (Al-Delaimi & Al-Ani, 2006). This is a significant point to management when evaluating the performance of a DMU. Thus, weights have an important effect on the efficiency of the DMU.
Literature proposes to several approaches to determine weights. Majority of them can be classified into subjective approaches and objective approaches (Ma et al., 1999). Subjective approaches determine the weights according to the preferential judgments of decision maker. Eigenvector method, weighted least square method, and Delphi method can be example for these approaches (Ma et al., 1999).On the other hand, objective approaches determine the weights by making use of mathematical models, but they neglect subjective judgment (Liu, 2003). They include principal element analysis, entropy method, and multiple objective programming model (Ma et al., 1999; Ginevicius & Podvezko, 2004).
This paper proposes AHP as a subjective method to determine weights. The AHP approach was employed to ascertain the relative weights of the criteria. It makes use of pairwise comparison matrices, hierarchical structures, and ratio scaling to apply weights to attributes (Lee et al., 2008). The advantage of this method is that experts can reasonably identify the weight index that corresponds to the real problems (Liu, 2003). Thus, despite the different placement of weights on the index, the method can still determine the order of priority and avoid conflicts between the reality and the index weights (Liu, 2003). Furthermore,AHP which is technically valid and practically useful does not need to large sample (Lam & Zhao, 1998). It also can be used in combination with other methods. DEA is proposed in this study to generate local weights of criteria from pairwise comparison judgment matrices used in the AHP.
4. Model and Data
4.1 Input and Output Variables
Using DEA model in measuring bank efficiency requires selection of appropriate input and output variables. However, there is no consensus in the banking literature regarding the proper selection of inputs and outputs (Rao & Lakew, 2012). Furthermore, commercial banking is a very difficult service industry in which to measure output, technical change, or productivity growth (Berger & Humphrey, 1992).
The choice of output and input variables is the first difficult question that must be addressed by any study on banking. Such a choice will be influenced by the selected concept of banking firm, by the particular question under consideration and, also, by the availability of data (Pastor et al., 1997). Two different approaches appear in the literature regarding the measurement of banks inputs and outputs, popularly known as production approach and intermediation approach (Berger & Humphrey, 1997). The production approach views banks as using purchased inputs to produce deposits and various categories of bank assets. It considers to banks as institutions that use capital and labor to produce loans and deposit account services. In this approach, labor, capital and operating costs are treated as inputs and loans, deposits, and transactions are considered the outputs.
The intermediation approach, on the other hand, views banks as financial intermediaries whose primary business is to borrow funds from depositors and lend those funds to others for profit (Yue, 1992). It generally uses loans as output and various costs such as interest expense, labor, capital and operating as outputs. It views the banks as using deposits together with purchased inputs to produce various categories of bank assets. However, there is still no current consensus on which of the two methodologies outlined above should be utilized in bank efficiency analysis. We have used production approach with restricted choice of variables.

www.ccsenet.org/ibr International Business Research Vol. 6, No. 4; 2013
136
To obtain input and output variables in this study, a preliminary list was composed using all input and output variables used in the literature. This list was shown to three branch managers of different banks who were asked to give their feedback whether the list is reasonable. Further, they were asked to add, delete or combine variables. Based on these responses, a refined list was compiled and shown again to bank administration until a consensus was reached on what variables should be used to better represent the efficiency of the department. Thus, a final list of variables was obtained. These variables are shown in Table 2. It also gives more details about the measures. Table 2. Variables and descriptions
Variables Description Code
Input Personnel Expenditures It is the total annual expenditure of each bank (Million TRY) PE Number of Branch It is the total number of branches which operated during the study period NB Output Deposits-National Currency It is composed of saving deposits with Interbank, Public Sector, and Commercial
Institutions Deposits (Million TRY) DNC
Deposits-Foreign Currency and Precious Metal
It is composed of foreign exchange and precious metal as Gold (Million TRY) DFCPM
Cash Loans It is loans have been used as cash in current period (Million TRY) CL Non-Cash Loans It is loans have been used as non-cash in current period (Million TRY) NCL
4.2 Sample Selection
Turkish banking system consists of three functional bank types such as commercial banks, development and investment banks, and participation banks (noninterest banking). The goal of the sample selection was to find comparable banks. Thereby, we decided to include only commercial banks and to neglect other types of banks. Commercial banks produce 92% of the Turkish banking sector’s total assets (Banking Regulation and Supervision Agency, 2011). Thus, commercial banks have an important role in Turkish banking system. Bank sample was also restricted to large banks which are more than one percent market share. As the market share, it has been taken account of total assets.As a result, the thirteen of 31 commercial banks operated in Turkey were chosen as the sample. Thus, this study applies DEA to compare operational performance of 13 commercial banks in Turkey. Much information about these banks according to 2011 statistics can be seen in Table 3. Table 3. Much information about the sample
Banks* Ownership Assets
(Million TRY)
General Market
Share (%)**
Banks* Ownership Assets
(Million TRY)
General Market
Share (%)
İşbankası Private-owned 161775 14.45 Finansbank Foreign-owned 46199 4.13
Ziraat State-owned 160681 14.35 Teb Private-owned 38092 3.40
Garanti Private-owned 146642 13.09 Denizbank Foreign-owned 36032 3.22
Akbank Private-owned 133552 11.93 Hsbc Foreign-owned 24172 2.16
Yapıkredi Private-owned 108103 9.65 Ing Foreign-owned 21066 1.88
Halkbank State-owned 91404 8.16 Şekerbank Private-owned 14400 1.29
Vakıfbank State-owned 89465 7.99
Source: Banking Regulation and Supervision Agency (2011)
Notes: *Ordered by general market share. **According to total assets.
To ensure meaningful efficiency scores, the number of DMUs must be large enough relative to the number of input and output variables. A rule of thumb is given by Boussofiane et al. (1991) and Ramanathan (2003) as [N ≥ 2*(s+m)], where s is the number of output variables, m is the number of input variables, and N is the number of DMUs. In this research, the number of DMUs (13) is more than twice the sum of the number of input and output variables. However, small sample size in this study can be compared with some of the other small sample sizes in the DEA literature (Oral & Yolalan, 1990; Haag & Jaska, 1995; Li, 2006; Cronje, 2007; Chen-guo et al., 2007; Akhtar et al., 2011; Rao & Lakew, 2012).
4.3 Data
We use annual data compiled mainly from balance sheet and income statements of banks in database of The Banks Association of Turkey (2011) and The Banking Regulation and Supervision Agency (2012). We cover

www.ccsenet.org/ibr International Business Research Vol. 6, No. 4; 2013
137
only thirteen out of 31 commercial banks operating in Turkey which can be seen in Table 4. It also includes data of each bank and descriptive statistics of each variable. Table 4. Data and descriptive statistics
Banks*
Code
Inputs Outputs
PE NB DNC DFCPM CL NCL
Akbank DMU1 1002 927 52084 24730 70213 14635
Denizbank DMU2 670 588 14486 5580 22196 9745
Finansbank DMU3 752 522 21446 7830 30435 6986
Garanti DMU4 1248 914 49087 35456 83533 21022
Halkbank DMU5 732 771 47836 18411 55236 17846
Hsbc DMU6 455 330 8214 5033 13662 2824
Ing DMU7 383 322 9129 2402 15265 5864
İşbankası DMU8 1819 1201 61727 36586 91621 25850
Şekerbank DMU9 228 272 6596 2482 8500 4794
Teb DMU10 579 507 14923 7963 25444 8063
Vakıfbank DMU11 834 680 46023 14916 57201 15664
Yapıkredi DMU12 1138 907 35395 28122 67045 26135
Ziraat DMU13 1313 1458 89866 23200 71173 11979
Mean 858 723 35139 16362 47040 13185
SD 439 355 25335 12283 28835 7793
Min. 228 272 6596 2402 8500 2824
Max. 1819 1458 89866 36586 91621 26135
Note: * Alphabetical order.
Due to the fact that operational performance was measured by outputs in banks, this study employs the output-oriented model. Efficiency Measurement System (EMS) software version 1.3 (Scheel, 2000) is used in this research to measure the technical efficiency of the departments based on both CCR and BCC models.
5. Results
5.1 Weight Restrictions
Pairwise comparison matrix should be done before the generate weight restriction. Thus, constrained weighting vectors were obtained from the AHP pairwise matrix. Then, in order to take the decision maker’s preferences into the evaluation, extra constraints were added to model.
Pairwise comparison matrix were constituted based on data from three experts from three commercial banks. They work as a department manager in their banks. Data collection phase are combined using the geometric mean approach to obtain the corresponding consensus pairwise comparison judgment matrices. Finally, AHP pairwise matrix can be seen in Table 5. All the consistency rates are less than 0.10. Table 5. Pairwise comparison matrix for inputs and outputs
PE NB DNC DFCPM CL NCL
PE - 1.00
NB 1.00 -
DNC - 2.29 1.00 3.63
DFCPM 0.44 - 0.37 1.26
CL 1.00 2.70 - 3.63
NCL 0.27 0.79 0.28 -
Based on this matrix, new eight constraints were added to DEA models. One of them is about inputs while other is about outputs. These constraints were formed as follows:
vv
1 uu
1 uu
2.29 uu
1 uu
3.63uu
0.37uu
1.26 uu
3.63
5.2 Efficiency Scores
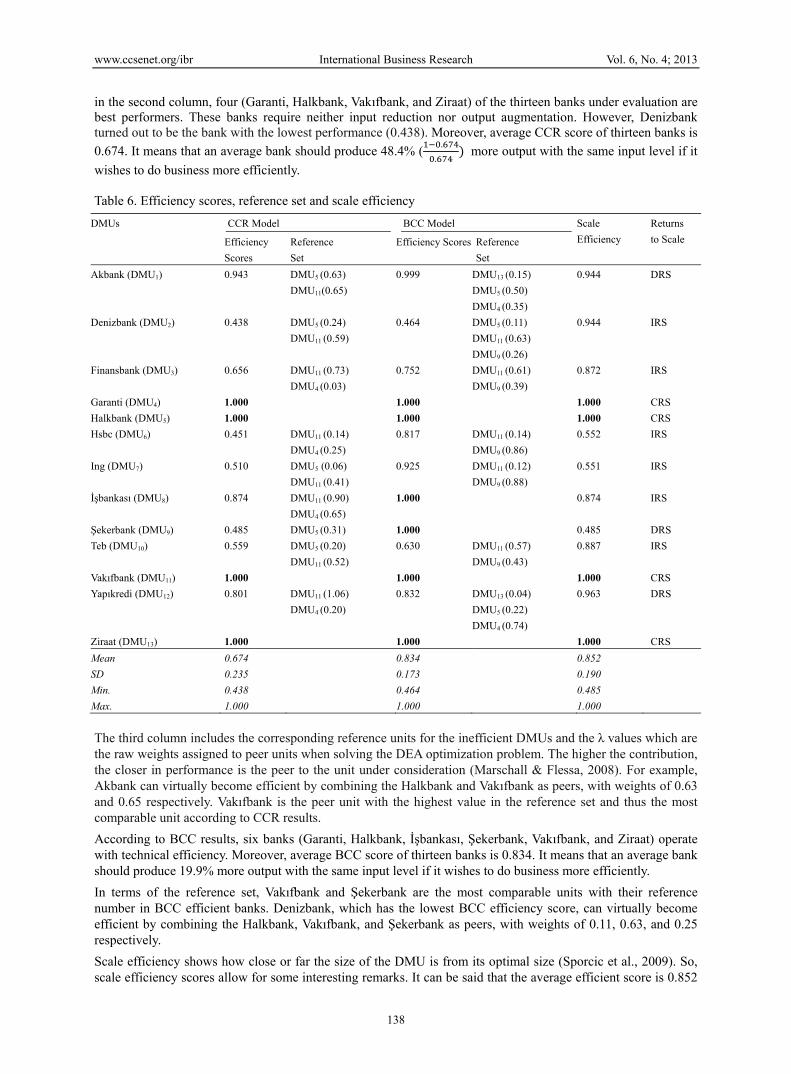
Table 6 shows the efficiency scores and the reference set(s) for each DMU. According to CCR efficiency scores
www.ccsenet.org/ibr International Business Research Vol. 6, No. 4; 2013
138
in the second column, four (Garanti, Halkbank, Vakıfbank, and Ziraat) of the thirteen banks under evaluation are best performers. These banks require neither input reduction nor output augmentation. However, Denizbank turned out to be the bank with the lowest performance (0.438). Moreover, average CCR score of thirteen banks is
0.674. It means that an average bank should produce 48.4% (.
. more output with the same input level if it
wishes to do business more efficiently. Table 6. Efficiency scores, reference set and scale efficiency
DMUs CCR Model BCC Model Scale
Efficiency
Returns
to Scale Efficiency
Scores
Reference
Set
Efficiency Scores Reference
Set
Akbank (DMU1) 0.943 DMU5 (0.63)
DMU11(0.65)
0.999 DMU13 (0.15)
DMU5 (0.50)
DMU4 (0.35)
0.944 DRS
Denizbank (DMU2) 0.438 DMU5 (0.24)
DMU11 (0.59)
0.464 DMU5 (0.11)
DMU11 (0.63)
DMU9 (0.26)
0.944 IRS
Finansbank (DMU3) 0.656 DMU11 (0.73)
DMU4 (0.03)
0.752 DMU11 (0.61)
DMU9 (0.39)
0.872 IRS
Garanti (DMU4) 1.000 1.000 1.000 CRS
Halkbank (DMU5) 1.000 1.000 1.000 CRS
Hsbc (DMU6) 0.451 DMU11 (0.14)
DMU4 (0.25)
0.817 DMU11 (0.14)
DMU9 (0.86)
0.552 IRS
Ing (DMU7) 0.510 DMU5 (0.06)
DMU11 (0.41)
0.925 DMU11 (0.12)
DMU9 (0.88)
0.551 IRS
İşbankası (DMU8) 0.874 DMU11 (0.90)
DMU4 (0.65)
1.000 0.874 IRS
Şekerbank (DMU9) 0.485 DMU5 (0.31) 1.000 0.485 DRS
Teb (DMU10) 0.559 DMU5 (0.20)
DMU11 (0.52)
0.630 DMU11 (0.57)
DMU9 (0.43)
0.887 IRS
Vakıfbank (DMU11) 1.000 1.000 1.000 CRS
Yapıkredi (DMU12) 0.801 DMU11 (1.06)
DMU4 (0.20)
0.832 DMU13 (0.04)
DMU5 (0.22)
DMU4 (0.74)
0.963 DRS
Ziraat (DMU13) 1.000 1.000 1.000 CRS
Mean 0.674 0.834 0.852
SD 0.235 0.173 0.190
Min. 0.438 0.464 0.485
Max. 1.000 1.000 1.000
The third column includes the corresponding reference units for the inefficient DMUs and the λ values which are the raw weights assigned to peer units when solving the DEA optimization problem. The higher the contribution, the closer in performance is the peer to the unit under consideration (Marschall & Flessa, 2008). For example, Akbank can virtually become efficient by combining the Halkbank and Vakıfbank as peers, with weights of 0.63 and 0.65 respectively. Vakıfbank is the peer unit with the highest value in the reference set and thus the most comparable unit according to CCR results.
According to BCC results, six banks (Garanti, Halkbank, İşbankası, Şekerbank, Vakıfbank, and Ziraat) operate with technical efficiency. Moreover, average BCC score of thirteen banks is 0.834. It means that an average bank should produce 19.9% more output with the same input level if it wishes to do business more efficiently.
In terms of the reference set, Vakıfbank and Şekerbank are the most comparable units with their reference number in BCC efficient banks. Denizbank, which has the lowest BCC efficiency score, can virtually become efficient by combining the Halkbank, Vakıfbank, and Şekerbank as peers, with weights of 0.11, 0.63, and 0.25 respectively.
Scale efficiency shows how close or far the size of the DMU is from its optimal size (Sporcic et al., 2009). So, scale efficiency scores allow for some interesting remarks. It can be said that the average efficient score is 0.852

www.ccsenet.org/ibr International Business Research Vol. 6, No. 4; 2013
139
based on the scale efficiency results. It means that an average bank should increase their relative efficiency on average by 17.4% if it adapted their size or volume of activities to the optimal value. The size and volume of activities of four banks (Garanti, Halkbank, Vakıfbank, and Ziraat) are well balanced because they have the efficiency of 100%. However, other banks, which have the efficiency values lower than 100%, partly under influence of size or volume of activities.
The issue of scale inefficiencies is explored with greater detail by considering returns to scale indicators. Among 13 banks, 6 banks operate under increasing returns to scale (IRS), 4 banks operate under constant returns to scale (CRS), and the remaining 3 banks operate under decreasing returns to scale (DRS). Both CCR efficiency and scale efficiency are equal to 1 are considered as operating at the most productive scale size.
Relatively scale efficient banks are also efficient according to CCR model. However, two banks (İşbankası & Şekerbank) are efficient only according to the BCC model. They do not show the same efficiency level in terms of scale efficiency. According to it, it can be said that their inadequate size or volume of activities expressed by the main parameters of their performance (Sporcic et al., 2009). In other words, the banks of İşbankası and Şekerbank which are efficient on BCC model but inefficient on CCR model have been efficiently operated except the effect of scale. The major causes of inefficiency are from scale inefficiency. In other words, they operate locally efficiently whereas its overall technical inefficiency is caused by its failure to achieve scale efficiency. These banks should enhance their own efficiency by increasing their input level as these have IRS characteristics.
Akbank, Şekerbank, and Yapıkredi showing DRS characteristics should decrease of their inputs or the increase of their outputs because they have been operated by the inputs over optimal scale. In the cases of the banks of which both BCC efficiency and scale efficiency is less than 1, both can be the causes of inefficiency (So et al., 2007).
5.3 Potential Improvements
One of the attractiveness of DEA is that it provides reference set so that inefficient DMUs have benchmark DMU to learn from their experiences (Bobe, 2009). So, in addition to providing efficiency measures, DEA also provides other information relevant for the inefficient DMUs. Because efficient DMUs do not have any slack, this information is only of interest for inefficient DMUs (Tongzon, 2011).
Table 7 shows the banks’ target input/output data and projection obtained from the DEA calculations. A DMU is BCC efficient if it has no input excesses and no output shortfalls. Thus, the difference between original data and projection is 0.00%. So, it can be seen the potential improvements for the seven inefficient banks under BCC model (Marschall and Flessa, 2008). Table 7. Target values (%) for inefficient banks according to BCC model
Inputs Outputs
DMUs
PE NB DNC DFCPM CL NCL
Target % Target % Target % Target % Target % Target %
DMU1 1002 0 927 0 52152 0.1 24762 0.1 70305 0.1 18048 23.3
DMU2 670 0 588 0 31195 115.4 12017 115.4 47800 115.4 20985 115.4
DMU3 599 -20.3 522 0 28506 32.9 10408 32.9 40454 32.9 11454 64.0
DMU6 314 -31.0 330 0 10059 22.5 6163 22.5 16731 22.5 6339 124.5
DMU7 302 -21.0 322 0 9865 8.1 2596 8.1 16495 8.1 6337 8.1
DMU10 577 -0.4 507 0 23685 58.7 12639 58.7 40382 58.7 12796 58.7
DMU12 1138 0 907 0 42545 20.2 33803 20.2 80588 20.2 31414 20.2
The projections suggest that particularly the analyzed banks are too big to be efficient. The results demonstrate that the efficiency of Denizbank which is the most inefficient can be improved when the personnel expenditure (PE) is reduced by 53.6%. Similarly, its efficiency can be attained if all of the output values are increased by 115.4%. When the number of branches (NB) is analyzed, it is seen that any DMU doesn’t have to decrease it. So, it can be said that banks are working with optimal number of branches.
For inefficient banks to benefit from the study, the amounts by which these DMUs should increase their outputs to become efficient are calculated using the BCC model. In this study, the targeted value of a variable represents the amount to which a given DMU can increase its production of that specific variable. In the following figures (Figure 2-3-4-5), the light columns indicates the actual value of outputs while dark column indicates potential improvements to enhance required output amount.

www.ccsen
Figure 2. A
Figure 4. A
Figure 2 shnoticed thAkbank, Fvalue in or
As for Depthis outpulevels, theHsbc, Ing,
When poteYapıkredi However, A
In figure 5closer to tfrom targe
et.org/ibr
Actual values deposits-natio
Actual values cash
hows the actuahat Denizbank Finansbank, Hsrder to be effic
posits-Foreignut. If inefficienen, they would and Akbank n
ential improveare the banks Akbank and In
5, it is demonstarget values thet values by 11
and potential ional currency (
and potential ih loans (CL)
al values and tand Teb requ
sbc, Ing, and Ycient. Akbank i
n Currency andnt departmentsd become morneed to enhanc
ement of Cashneed to the m
ng need to less
strated actual vhan other inef240 million TR
Internationa
improvements(DNC)
improvements
the potential imuires the highYapıkredi shouis the nearest b
d Precious Mets can enhancere efficient. Ince their DFCPM
h Loans (CL) imost improvems improvement
value and potefficient banks RY.
al Business Res
140
of Figure 3dep
of Figure 5
mprovements ohest increase ruld increase thebank to target v
tal (DFCPM), e their outputsn parallel with M respectively
is analyzed inments as 24604ts of CL than o
ential improvemin terms of N
earch
3. Actual valueposits-foreign c
5. Actual valuenon-c
of the Depositsrespectively aseir DNC by cevalue by 68 mi
Figure 3 shows to the corres
this, Denizbay in order to be
n Figure 4, it i4, 14138, and other inefficien
ment of non-caNCL. However
es and potentiacurrency and p(DFCPM)
es and potentiacash loans (NC
s-National Curs 16709 and 8ertain amountsillion TRY.
ws the actual ansponding poteank, Yapıkrediecome more ef
is seen that De13543 million
nt banks.
ash loans (NCr, Denizbank i
Vol. 6, No. 4;
al improvemenprecious metal
al improvemenCL)
rrency (DNC)8761 million Ts to reach the t
nd target valueential improvei, Teb, Finansbfficient.
enizbank, Tebn TRY respecti
CL). Akbank iss the farthest
2013
nts of
nts of
. It is TRY. target
es for ment bank,
, and ively.
s also bank

www.ccsen
Figure 6 inof the fourNCL haveinterestingby ineffici
6. Discuss
This studycreate a susimilar forin efficienfollowing
Nine bankaccording to two reasnumerator constraint.CCR or BC
Three statMoreover,similar to state-owneprivate-ow
The resultnon-cash l(64.3%) oworking re
This studytowards idchoice of tshould alsoutputs suinvestigatimultipliersinvestigateparticipatio
Another limbank efficito manage
et.org/ibr
Figure 6. A
ndicates the avr outputs, DNC been expande
g note that inefent banks. Thu
sion and Conc
y measure the ruitable performr all banks ensncy should be findings and in
ks are identifieto the BCC. Itsons according
r in CCR. Sec. Further, the vCC may be ad
te-owned bank these banks oempirical re
ed banks. Howwned banks.
ts of the analyloans. Furthermof the banks aegion (IRS or D
y has some limdentifying fututhe input/outpuso be includeduch as customing their produs, based on pee whether the on, developme
mitation is theiency analysis ement judgmen
Average improv
verage improvC, DFCPM, aned to average 5fficient banks hus, these banks
clusion
relative efficiemance evaluatisures maximumexplained by nsights from C
ed as being int is noted that Bg to Agha et alcondly, BCC values of CCRopted for this r
ks (Halkbankoperate at the sults from Ay
wever, foreign-
ysis show a firmore, they shoare scale ineffDRS).
mitations that ure research avut measures. Sd to the modelmer satisfactiouctivity impacersonnel salarysame conclusi
ent and investm
e choice of variwith DEA. Th
nt, there shoul
Internationa
vement rate (%
vement rates ofnd CL, have sa59.17% by inehave not to chs can produce
ency of 13 comion model for m feasible comdifferences in
CCR and BCC
nefficient accoBCC yields ml. (2011). Firstrelaxes the sl
R and BCC effresearch.
k, Ziraat, and most productivydin et al. (2-owned banks
st insight into ould focus on tficiency. These
need to be acvenues. First oo, quality relatls. In this regaon, customer ct. Furthermory, were used toions can be rement and/or co
iables for incluhese studies usld be a more r
al Business Res
141
%) of input and
f both inputs aame (36.84%) efficient banks.ange their NBsame level out
mmercial bankthese banks.
mparability amn technical eff
model are sum
ording to the more efficient b
t, theoretically lack variablesficiencies are c
Vakıfbank) ave scale size a
2009) shows thave the lowe
the inefficientheir annual pee banks shoul
cknowledged, of all, the qualted measures sard, future sturesponsivenes
re, models thao identify cost
eplicated and gountries.
usion in a DEAse various inpurigorous metho
earch
d output value f
and outputs foaverage impro
. With respect s. However, Ptputs with less
ks in Turkey. ItThe fact that
mong banks. Thficiency and nmmarized.
CCR model wanks than CCRthe numerator
to be greateclose to each o
are efficient iaccording to sthat the moster efficiency s
nt banks. Theyersonnel expenld improve tac
but which at lity of the DEAsuch as customudies could alsss, and servicat further add t efficient bangeneralized in
A analysis. In luts and outputod for selectin
for inefficient
r efficient. Acovement rate. to average inpE should reduPE.
t combines theall the produc
herefore, any oot in lack of c
while seven baR. These resultr of BCC ratior than zero a
other, which im
in both CCR cale efficiencyt efficient banscores than bot
y should especnditure. Moreovctical actions
the same timA results depe
mer satisfactionso try to devece quality ansimilar constr
nks. Future resdifferent bank
literature a lot s set. While th
ng input and o
Vol. 6, No. 4;
banks
ccording to it, On the other h
put decreasinguce average 10.
e AHP and DEcts and serviceobserved differcomparability.
anks are identts are expected
o is greater thaand adding lammply that eithe
and BCC my. These resultnks in Turkeyth state-owned
ially improve ver, more thanaccording to
me lend themseends heavily onn or responsiveelop for qualitd apply DEAraints on the isearches couldk segments suc
of studies focuhis is largely leoutput variable
2013
three hand, , it is .37%
EA to es are rence . The
tified d due an the mbda er the
model. ts are y are d and
their n half
their
elves n the eness tative A for input
d also ch as
us on eft up es for

www.ccsenet.org/ibr International Business Research Vol. 6, No. 4; 2013
142
productivity assessment. Therefore, future researchers may focus on developing a framework for input/output variable selection.
One limitation is that this study has not implications from a customer’s perspective. Technical efficiency can vary widely across commercial banks. So, in future studies, the model should be expanded to customer perspective with including related outputs such as customer satisfaction, transactions time.
A last limitation is about some special problems of DEA. Since it is a deterministic procedure, it does not provide fit statistics such as r-square or p-value that can be used for statistical inferences. Moreover, there is no role for statistical error in the calculations and a number of questions need to be answered about the validity of the DEA score.
Managerial relevance of our research is quite important. It is widely accepted that to succeed a company must perform well. Moreover, the simplicity of the results, and the fact that they arise directly from observed input/output data that allow for better acceptance of the results by the bank managers. Bank management should pay more attention to personnel expenditure among the input variables and non-cash loans among the output variables. Furthermore, managers can use DEA to compare their business units.
References
Agha, S. R., Kuhail, I., Abdelnabi, N., Salem, M., & Ghanim, A. (2011). Assessment of academic departments efficiency using data envelopment analysis. Journal of Industrial Engineering and Management, 4(2), 301-3235. http://dx.doi.org/10.3926/jiem.2011.v4n2.p301-325
Akhtar, M. F., Ali, K., & Sadaqat, S. (2011). Performance efficiency of commercial banks of Pakistan: nonparametric technique data envelopment analysis (DEA). Asian Journal of Business and Management Sciences, 1(2), 150-156.
Al-Delaimi, K. S. K., & Al-Ani, A. H. B. (2006). Using data envelopment analysis to measure cost efficiency with an application of Islamic banks. Scientific Journal of Administrative Development, 4, 134-156.
Al-Faraj, T., Alidi, A., & Bu-Bshait, K. (1993). Evaluation of bank branches by means of data envelopment analysis. International Journal of Operations & Production Management, 13(9), 45-52. http://dx.doi.org/10.1108/01443579310043628
AlKhathlan, K., & Malik, S. A. (2010). Are Saudi banks efficient? Evidence using data envelopment analysis (DEA). International Journal of Economics and Finance, 2(2), 53-58.
Allen, L., & Rai, A. (1996). Operational efficiency in banking: an international comparison. Journal of Banking and Finance, 20, 655-672. http://dx.doi.org/10.1016/0378-4266(95)00026-7
Al-Shammari, M., & Salimi, A. (1998). Modeling the operating efficiency of banks: a nonparametric methodology. Logistics Information Management, 11, 5-12. http://dx.doi.org/10.1108/09576059810202196
Altunbas, Y., & Molyneux, P. (1996). Economies of scale and scope in European banking. Applied Financial Economics, 6, 367-375. http://dx.doi.org/10.1080/096031096334187
Athanassopoulos, A. D. (1997). Service quality and operating efficiency synergies for management control in the provision of financial services: evidence from Greek bank branches. European Journal of Operational Research, 98, 300-313. http://dx.doi.org/10.1016/S0377-2217(96)00349-9
Avkiran, N. K. (1999). The evidence on efficiency gains: the role of mergers and the benefits to the public. Journal of Banking and Finance, 23, 991-1013. http://dx.doi.org/10.1016/S0378-4266(98)00129-0
Aydin, N., Yalama, A., & Sayim, M. (2009). Banking efficiency in developing economy: empirical evidence from Turkey. Journal of Money, Investment and Banking, 8, 49-70.
Ayranci, E. (2011). The efficiency of the private commercial banking sector in Turkey: a managerial approach. Journal of International Business and Cultural Studies, 4, 1-25.
Banker, R. D., Charnes, A., & Cooper, W. W. (1984). Some models for estimating technical and scale inefficiencies in data envelopment analysis. Management Science, 30(9), 1078-1092. http://dx.doi.org/10.1287/mnsc.30.9.1078
Banking Regulation and Supervision Agency. (2011). Bankacılıkta yapısal gelişmeler. Retrieved from http://www.bddk.org.tr/WebSitesi/turkce/Raporlar/Bankacilikta_Yapisal_Gelismeler/11085bygr_2011.pdf
Banking Regulation and Supervision Agency. (2012). Fintürk [Data file]. Retrieved from http://ebulten.bddk.org.tr/haritalama/harita.aspx

www.ccsenet.org/ibr International Business Research Vol. 6, No. 4; 2013
143
Barr, R. S., Killgo, K. A., Siems, T. F., & Zimmel, S. (2002). Evaluating the productive efficiency and performance of U.S. commercial banks. Managerial Finance, 28(8), 3-25. http://dx.doi.org/10.1108/03074350210767988
Berg, S. A., Forsund, F. R., Hjalmarsson, L., & Suominen, M. (1993). Banking efficiency in the Nordic countries. Journal of Banking and Finance, 17, 371-88. http://dx.doi.org/10.1016/0378-4266(93)90038-F
Berger, A. N., & Humphrey, D. B. (1992). Measurement and efficiency issues in commercial banking. In Z. Griliches (Ed.), Output Measurement in the Service Sectors. University of Chicago Press.
Berger, A. N., & Humphrey, D. B. (1997). Efficiency of financial institutions: international survey and directions for future research. European Journal of Operational Research, 98(2), 175-212. http://dx.doi.org/10.1016/S0377-2217(96)00342-6
Bobe, B. (2009). Evaluating the efficiencies of university faculties: adjusted data envelopment analysis. Paper for Accounting and Finance Association of Australia and New Zealand (AFAANZ) 2009 Conference, Adelaide, Australia, 5-7 July.
Boussofiane, A., Dyson, R., & Rhodes, E. (1991). Applied DEA. European Journal of Operational Research, 2(6), 1-15. http://dx.doi.org/10.1016/0377-2217(91)90331-O
Chansarn, S. (2008). The relative efficiency of commercial banks in Thailand: DEA approach. International Research Journal of Finance and Economics, 18, 53-68.
Charnes, A., Cooper, W. W., & Rhodes, E. (1978). Measuring the efficiency of DMUs. European Journal of Operational Research, 2, 429-444. http://dx.doi.org/10.1016/0377-2217(78)90138-8
Chen-guo, D., Ting, L., & Jie, W. (2007). Efficiency analysis of China’s commercial banks based on DEA: negative output investigation. Chine-USA Business Review, 6(2), 50-56.
Cronje, T. (2007). Assessing the relative efficiency management of South African banks. Management Dynamics, 16, 11-23.
Dekker, D., & Post, T. (2001). A quasi-concave DEA model with an application for bank branch performance evaluation. European Journal of Operational Research, 132, 296-311. http://dx.doi.org/10.1016/S0377-2217(00)00153-3
Denizer, C., Dinç, M., & Tarimcilar, M. (2000). Measuring Banking Efficiency in the Pre- and Post-Liberalization Environment: Evidence from the Turkish Banking System. World Bank Research Working Papers, No. 2476.
Farrell, M. J. (1957). The measurement of productive efficiency. Journal of the Royal Statistical Society, 120(3), 253-281. http://dx.doi.org/10.2307/2343100
Feng, Y. J., Lu, H., & Bi, K. (2004). An AHP/DEA method for measurement of the efficiency of R&D management activities in universities. International Transactions in Operational Research, 11, 181-191. http://dx.doi.org/10.1111/j.1475-3995.2004.00450.x
Ginevicius, R., & Podvezko, V. (2004). Objective and subjective approaches to determining the criterion weight in multicriteria models. Proceedings of International Conference RelSat, 04, 133-139.
Golany, B., & Storbeck, J. E. (1999). A data envelopment analysis of the operational efficiency of bank branches. Interfaces, 2(3), 14-26. http://dx.doi.org/10.1287/inte.29.3.14
Grigorian, D. A., & Manole, V. (2002). Determinants of commercial bank performance in transition: an application of data envelopment analysis. World Bank Policy Research Working Paper2850, June.
Haag, S. E., & Jaska, P. V. (1995). Interpreting inefficiency rating: an application of bank branch operating efficiencies. Managerial and Decision Economics, 16, 7-14. http://dx.doi.org/10.1002/mde.4090160103
Halkos, S. E., & Salamouris, D. S. (2004). Efficiency measurement of the Greek commercial banks with the use of financial ratios: A data envelopment analysis approach. Management Accounting Research, 15(2), 201-224. http://dx.doi.org/10.1016/j.mar.2004.02.001
Isik, I., & Hassan, M. K. (2000). Technical, scale and allocative efficiencies of Turkish banking industry. Journal of Banking and Finance, 26(4), 719-766. http://dx.doi.org/10.1016/S0378-4266(01)00167-4
Jackson, P. M., & Fethi, M. D. (2000). Evaluating the efficiency of Turkish commercial banks: an application of dea and tobit analysis. Efficiency and Productivity Research Unit (EPRU) Discussion Paper, University of Leicester, UK.

www.ccsenet.org/ibr International Business Research Vol. 6, No. 4; 2013
144
Ji, K., Song, W., & Wang, R. (2012). Research on China’s commercial banks rating and ranking based on DEA. American Journal of Operations Research, 2, 122-125. http://dx.doi.org/10.4236/ajor.2012.21014
Korpela, J., Lehmusvaara, A., & Nisonen, J. (2007). Warehouse operator selection by combining AHP and DEA methodologies. International Journal of Production Economics, 108(1-2), 135-142. http://dx.doi.org/10.1016/j.ijpe.2006.12.046
Kuosmanen, T., & Post, T. (2001). Measuring economic efficiency with incomplete price information: with an application to European commercial banks. European Journal of Operational Research, 134, 43-58. http://dx.doi.org/10.1016/S0377-2217(00)00237-X
Lam, K., & Zhao, X. (1998). An application of quality function deployment to improve the quality of teaching. International Journal of Quality Reliability Management, 15(4), 389-413. http://dx.doi.org/10.1108/02656719810196351
Lee, S. K., Mogi, G., Shin, S. C., & Kim, J. W. (2008). Measuring the relative efficiency of greenhouse gas technologies: an AHP/DEA hybrid model approach. Proceedings of the International MultiConference of Engineers and Computer Scientists, 2, 19-21 March, Hong Kong.
Lee, S., Kim, J., Mogi, G., & Hui, K. S. (2010). Fuzzy AHP/ DEA approach with scale efficiency for measuring the relative efficiency of hydrogen R&D programs in the sector of developing hydrogen energy technologies. Proceedings of the 18th World hydrogen energy conference, May 16-21, Essen, Germany.
Li, Z. (2006). The assessment analysis of efficiency of commercial banks based on DEA model. International Management Review, 2(4), 60-66.
Liu, C. C. (2003). Simulating weights restrictions in data envelopment analysis by the subjective and objective integrated approach. Web Journal of Chinese Management Review, 6(1), 68-78.
Lovell, C. A. K., & Pastor, J. T. (1997). Target setting: an application to a bank branch network. European Journal of Operational Research, 98, 290-299. http://dx.doi.org/10.1016/S0377-2217(96)00348-7
Ma, J., Fan, Z. P., & Huamg, L. H. (1999). A subjective and objective integrated approach to determine attributeweights. European Journal of Operational Research, 112, 397-404. http://dx.doi.org/10.1016/S0377-2217(98)00141-6
Maea, S. F. (2010). The efficiency of the commercial banks in six pacific island countries, doctorate dissertation in school of economics and finance, Massey University. Palmerston North, New Zealand.
Malhotra, R., Malhotra, D. K., & Lafond, C. A. (2009). Analyzing financial services industry using data envelopment analysis. International Journal of Applied Management Science, 1(3), 217-246. http://dx.doi.org/10.1504/IJAMS.2009.023703
Mansoury, A., & Salehi, M. (2011). Efficiency analysis and classification of bank by using data envelopment analysis (DEA) model: evidence of Iranian bank. International Journal of the Physical Sciences, 6(13), 3205-3217.
Marschall, P., & Flessa, S. (2008). Assessing the efficiency of rural health centers in Burkina Faso: an application of data envelopment analysis. Journal of Public Health, 17(2), 87-95. http://dx.doi.org/10.1007/s10389-008-0225-6
Maudos, J., Pastor, J. M., Perez, F., & Quesada, J. (2002). Cost and profit efficiency in european banks. Journal of International Financial Markets, Institutions and Money, 12, 33-58. http://dx.doi.org/10.1016/S1042-4431(01)00051-8
Moffat, B., & Valadkhani, A. (2009). A data envelopment analysis of financial institutions in Botswana. Oxford Business & Economics Conference, June 24-26, St. Hugh’s College, Oxford University, Oxford, UK.
Navabakhsh, M., Jahanshahloo, G. R., Lotfi, F. H., Allahviranloo, T., Balf, F. R., & Rezai, H. Z. (2007). Finding suitable benchmark for inefficient commercial bank branches, application of DEA. International Journal of Contemporary Mathematic Sciences, 2(4), 183-193.
Oral, M., & Yolalan, R. (1990). An empirical study on measuring operating efficiency and profitability of bank branches. European Journal of Operational Research, 46, 282-294. http://dx.doi.org/10.1016/0377-2217(90)90002-S
Ozkan-Gunay, E. N., & Tektas, A. (2006). Efficiency analysis of the Turkish banking sector in precrisis and crisis period: a DEA approach. Contemporary Economic Policy, 24(3), 418-431.
www.ccsenet.org/ibr International Business Research Vol. 6, No. 4; 2013
145
http://dx.doi.org/10.1093/cep/byj028
Pastor, J. M., Perez, F., & Quesada, J. (1997). Efficiency analysis in banking firms: an international comparison. European Journal of Operational Research, 98, 395-407. http://dx.doi.org/10.1016/S0377-2217(96)00355-4
Peaw, T. L., & Mustafa, A. (2006). Incorporating AHP in DEA analysis for smartphone comparisons. Proceedings of the 2nd IMT-GT Regional Conference on Mathematics, Statistics, and Applications, Universiti Sains Malaysia, June 13-15, Penang, Malaysia.
Percin, S., & Ayan, T. Y. (2006). Measuring efficiency of commercial banks in a developing economy. Investment Management and Financial Innovations, 3(2), 217-231.
Porembski, M., Breitenstein, K., & Alpar, P. (2005). Visualizing efficiency and reference relations in data envelopment analysis with an application to the branches of a German bank. Journal of Productivity Analysis, 23, 203-221. http://dx.doi.org/10.1007/s11123-005-1328-5
Portela, M. C. A. S., & Thanassoulis, E. (2005). Profitability of a sample of Portuguese bank branches and its decomposition into technical and allocative components. European Journal of Operational Research, 162, 850-866. http://dx.doi.org/10.1016/j.ejor.2003.10.018
Ramanathan, R. (2003). An introduction to data envelopment analysis. Sage Publications.
Rao, K. R. M., & Lakew, T. B. (2012). Cost efficiency and ownership structure of commercial banks in Ethiopia: an application of non-parametric approach. European Journal of Business and Management, 4(10), 36-47.
Rezaie, K., Nazari-Shirkouhi, S., Alem, S. M., & Hatami-Shirkouhi, L. (2010). Using data envelopment analysis and analytical hierarchy process model to evaluate flexible manufacturing systems. Australian Journal of Basic and Applied Sciences, 4(12), 6461-6469.
Rouyendegh, B. D., & Erkan, T. E. (2010). The DEA-AHP hybrid ranking model applied 4 star hotels in Ankara. Gazi Üniversitesi İktisadi Ve İdari Bilimler Fakültesi Dergisi, 12(3), 69-90.
Saaty, T. L. (2008). Decision making with the analytic hierarchy process. International Journal of Services Sciences, 1(1), 83-98. http://dx.doi.org/10.1504/IJSSCI.2008.017590
Saha, A., & Ravisankar, T. S. (2000). Rating of Indian commercial banks: a DEA approach. European Journal of Operational Research, 124, 187-203. http://dx.doi.org/10.1016/S0377-2217(99)00167-8
Saleeshya, P. G., & Babu, A. S. (2012). A combined AHP–and DEA–based approach to measure agility of manufacturing systems. International Journal of Business and Systems Research, 6(4), 431-455. http://dx.doi.org/10.1504/IJBSR.2012.049472
Sathye, M. (2003). Efficiency of banks in a developing economy: the case of India. European Journal of Operational Research, 148, 662-671. http://dx.doi.org/10.1016/S0377-2217(02)00471-X
Scheel, H. (2000). Efficiency Measurement System Software EMS. (Version 1.3.0) [Computer Software]. Retrieved from http://www.holger-scheel.de/ems/ems_130.zip
Sherman, H., & Ladino, G. (1995). Managing bank productivity using data envelopment analysis (DEA). Interfaces, 25, 60-73. http://dx.doi.org/10.1287/inte.25.2.60
So, S. H., Kim, J. J., Cho, G., & Kim, D. K. (2007). Efficiency analysis and ranking of major container ports in northeast Asia: an application of data envelopment analysis. International Review of Business Research Papers, 3(2), 486-503.
Sporcic, M., Martinic, I., Landekic, M., & Lovric, M. (2009). Measuring efficiency of organizational units in forestry by nonparametric model. Crotia Journal for Engineering, 30(1), 1-13.
Subramanyam, T., & Reddy, C. S. (2008). Measuring the risk efficiency in Indian commercial banking-a DEA approach. East-West Journal of Economics and Business, 11(1-2), 76-105.
Tahir, I. M., Abu Bakar, N. M., & Haron, S. (2009). Evaluating efficiency of Malaysian banks using data envelopment analysis. International Journal of Business and Management, 4(8), 96-106.
Taylor, W. M., Thompson, R. G., Thrall, R. M., & Dharmapala, P. S. (1997). DEA/AR efficiency and profitability of Mexican banks a total income model. European Journal of Operational Research, 98, 346-363. http://dx.doi.org/10.1016/S0377-2217(96)00352-9
The Banks Association of Turkey. (2012). Banks in Turkey. Retrieved from

www.ccsenet.org/ibr International Business Research Vol. 6, No. 4; 2013
146
http://www.tbb.org.tr/tr/banka-ve-sektor-bilgileri/istatistiki-raporlar/--2011---bankalarimiz-kitabi---/1145
Tongzon, J. (2001). Efficiency measurement of selected Australian and other international ports using data envelopment analysis. Transportation Research Part A, 35, 107-122. http://dx.doi.org/10.1016/S0965-8564(99)00049-X
Tseng, Y. F., & Lee, T. Z. (2009). Comparing appropriate decision support of human resource practices on organizational performance with DEA/AHP Model. Expert Systems With Applications, 36(3, Part 2), 6548-6558. http://dx.doi.org/10.1016/j.eswa.2008.07.066
Vaidya, O. S., & Kumar, S. (2006). Analytic hierarchy process: an overview of applications. European Journal of Operational Research, 169, 1-29. http://dx.doi.org/10.1016/j.ejor.2004.04.028
Varias, A. D., & Sofianopoulou, S. (2012). Efficiency evaluation of Greek commercial banks using DEA. Journal of Applied Operational Research, 4(4), 183-193.
Vassiloglou, M., & Giokas, D. (1990). A study of the relative efficiency of bank branches: an application of data envelopment analysis. Operation Research Society, 41, 591-597.
Wang, Y. M., Liu, J., & Elhag, T. M. S. (2008). An integrated AHP-DEA methodology for bridge risk assessment. Computers & Industrial Engineering, 54, 513-525. http://dx.doi.org/10.1016/j.cie.2007.09.002
Weiguo, X., & Ming, L. (2008). Empirical research of M&A impact on Chinese and American commercial banks’ efficiency based on DEA method. Management Science and Engineering, 2(1), 38-47.
Yuan, S., Liu, X., Tu, Y., & Xue, D. (2008). Evaluating supplier performance using DEA and piecewise triangular fuzzy AHP. Journal of Computing and Information Science in Engineering, 8, 1-7. http://dx.doi.org/10.1115/1.2956997
Yue, P. (1992). Data envelopment analysis and commercial bank performance: a primer with applications to Missouri banks. The Federal Reserve Bank of St. LouisReview, 92(1), 31-45.
Yunten, P., & Caner, S. (2004). Efficiency of Turkish commercial banks. Working paper, Sabanci university, Turkey. Retrieved from http://www.bilkent.edu.tr/~caner/file/EFFICIENCY%20OF%20TURKISH%20COMMERCIAL%20BANKS.pdf
Zhang, H., Li, X., & Liu, W. (2006). An AHP/DEA methodology for 3PL vendor selection in 4PL. Lecture Notes in Computer Science, 3865, 646-655. http://dx.doi.org/10.1007/11686699_65