geosphere evaluating relative tephra fall hazard and risk in the … · reer per geosphere | volume...
TRANSCRIPT
Research Paper
1Jenkins et al. | Evaluating relative tephra fall hazard and risk in the Asia-Pacific regionGEOSPHERE | Volume 14 | Number 2
Evaluating relative tephra fall hazard and risk in the Asia-Pacific regionSusanna F. Jenkins1, Christina R. Magill2,3, and Russell J. Blong3,4
1Earth Observatory of Singapore/Asian School of the Environment, Nanyang Technological University, 639798, Singapore2Department of Environmental Sciences, Faculty of Science and Engineering, Macquarie University, NSW 2109, Australia3Risk Frontiers, Level 2, 100 Christie Street, St Leonards, NSW 2065, Australia4Aon Benfield, Level 33, 201 Kent Street, Sydney, NSW 2000, Australia
ABSTRACT
With increasing population densities and expanding urban boundaries, the potential for explosive volcanic eruptions to have adverse impacts upon urban areas is on the rise. This is particularly true for volcanoes along subduction zones, because they are almost exclusively explosive and often coincident with large populations. Explosive eruption hazards such as tephra fall have the po-tential to affect very large areas and numbers of people; populations in volcanic areas may therefore be exposed to tephra falls from more than one volcano. In this study we have simulated large numbers of plausible explosive eruptions of Volcanic Explosivity Index (VEI) 4 or greater for each of 141 volcanoes in the Asia-Pacific region. Tephra fall footprints are aggregated for 16 major cities, according to their probability of occurrence. This addresses an emerging need for international agencies and organizations to conduct regional-scale assess-ments, where at-risk areas can be compared on a like-for-like basis. Hazard in cities near subduction zones is two to three orders of magnitude greater than for those farther away. By combining our hazard estimates with indicators describing the exposure and vulnerability of people and infrastructure, tephra fall risk scores were calculated for each city. Risk is evaluated separately for human populations and potential economic impact, with the highest human risk scores calculated for Manila and the highest economic scores for Tokyo. The volcanoes with the greatest hazard contribution in the very populous cities of Manila, Tokyo, and Jakarta were identified as Taal (Manila), Fujisan (Tokyo), and six volcanoes equally (Jakarta). While this study provides a transparent and consistent method for assessing regional volcanic hazard and risk, there are challenges associated with the data-poor setting and we conclude by dis-cussing what is required in order to improve regional tephra fall hazard and risk assessments. This study provides a regional-scale assessment that cannot replace hazard and risk information provided locally by official organizations.
INTRODUCTION
This paper describes a study to quantify and rank relative volcanic hazard and, via indicators of exposure and vulnerability, risk across 16 major cities in the western arm of the Pacific Rim, here described as the Asia-Pacific
region. The study was developed to address an emerging need for inter-national agencies, industries, and governments to obtain regional hazard and risk information that allows at-risk areas to be compared on a like-for-like basis, highlighting areas where further study or support should be fo-cused. It is not intended to replace the official hazard and risk information provided by individual country organizations, a list of which are provided at the end of this paper. The Asia-Pacific region contains some of the most explosive and active volcanoes worldwide (Simkin and Siebert, 2000), and is also home to high levels of growth in urban populations and infrastructure. Many of the region’s cities are therefore located in active volcanic areas and threatened by explosive volcanic activity from more than one volcano. Our study focuses on tephra fall as the most frequent and widespread volcanic hazard (Newhall and Hoblitt, 2002) with the potential to directly or indirectly affect the largest numbers of people. Assessments of tephra fall hazard are typically carried out on a volcano-by-volcano basis, rather than for a given location. However, there is geological evidence for tephra falls from at least nine different volcanoes in the Chubu and Kanto regions close to Tokyo, Japan (Machida and Arai, 2003), and from more than five different vol-canoes in Auckland, New Zealand (Shane and Hoverd, 2002; Zawalna-Geer et al., 2016). A key focus of this work is therefore to account for regional variation in the compounded site-specific tephra fall hazard and risk from multiple volcanoes. The hazard from airborne tephra or more proximal flow hazards is not assessed, and risk is considered as the potential for exposed people, property, services, livelihoods, and the environment on which they depend, to be harmed (United Nations International Strategy for Disaster Reduction, 2009, p. 26), rather than an absolute assessment of financial loss or loss of lives.
In the following we describe previous studies that have worked toward assessing volcanic hazard and risk at a regional level. We then describe our assessment in the Asia-Pacific region; the methods and results separately con-sider the main components of risk, i.e., hazard, exposure, and vulnerability. Given the inherent problems with quantifying hazard and risk in data-poor set-tings, we dedicate the latter parts of this paper to discussing the sensitivities of our findings, and key data and studies required to improve regional volcanic assessments.
GEOSPHERE
GEOSPHERE; v. 14, no. 2
doi:10.1130/GES01549.1
8 figures; 3 tables; 1 supplemental file
CORRESPONDENCE: susanna .jenkins@ntu .edu.sg
CITATION: Jenkins, S.F., Magill, C.R., and Blong, R.J., 2018, Evaluating relative tephra fall hazard and risk in the Asia-Pacific region: Geosphere, v. 14, no. 2, p. 1–18, doi:10.1130/GES01549.1.
Science Editor: Shanaka de SilvaGuest Associate Editor: Robert Stern
Received 25 April 2017Revision received 28 September 2017Accepted 8 January 2018
OPEN ACCESS
GOLD
This paper is published under the terms of the CC-BY-NC license.
© 2018 The Authors
THEMED ISSUE: Subduction Top to Bottom 2
Research Paper
2Jenkins et al. | Evaluating relative tephra fall hazard and risk in the Asia-Pacific regionGEOSPHERE | Volume 14 | Number 2
Previous Studies
Previous studies that have constructed regional or global volcanic hazard or risk assessments have mostly employed indices. The first global volcanic hazard and risk study was carried out by Yokoyama et al. (1984), who em-ployed 10 hazard and 7 risk factors to identify high-risk volcanoes globally. Small and Naumann (2001) assessed the distribution of human populations relative to active volcanoes worldwide (updated in Holmberg and Small, 2016); this essentially ranked volcanoes, regardless of the hazard they posed, by their population exposure. The Munich Re Group (Munich-Re, 2004) as-sessed 50 global metropolises for their combined natural hazards risk as de-fined by material loss: volcanic eruptions were grouped with bushfire and frost as other hazards. The World Bank natural disaster hotspots project ( Dilley et al., 2005) assessed volcanic risk by considering economic losses and mortality from volcanoes on a global grid by averaging global loss esti-mates across 20 yr of eruption data (1981–2000). Ewert (2007) developed a method to score U.S. volcanoes according to 15 hazard and 9 exposure indi-cators. Aspinall et al. (2011) similarly used hazard indicators (n = 8) to score volcanoes within 16 developing countries identified as priorities by the World Bank. Auker et al. (2015) used fatality data to build upon the Ewert (2007) and Aspinall et al. (2011) hazard scores by updating indicators and weightings, and accounting for record incompleteness. The updated hazard scores were spe-cific to volcanic hazard over the next 30 yr, and were applied globally. Brown et al. (2015) further built upon this global volcanic hazard index by estimating volcanic threat to life on a country-by-country scale, based on the number of active volcanoes, an estimate of exposed population, and the volcanic hazard indices of Auker et al. (2015).
While these studies provided important steps toward regional and global volcanic hazard and risk assessment, they all applied concentric circles to de-note hazard around each volcano and did not account for varying eruption magnitude or local environmental conditions such as wind speed and direc-tion. Tephra falls only form a concentric circle around the volcano where wind is absent (Volentik et al., 2010); more typically, they are elongated in the di-rection of prevailing winds during the eruption. A small number of regional tephra hazard assessments have considered the hazard to a site or region from multi ple volcanoes, and incorporated the likely variability in eruption source and environmental conditions through probabilistic tephra dispersal model-ing. The first probabilistic treatment of multisource regional tephra fall hazard was developed by Hoblitt et al. (1987) for the northwestern United States. One-dimen sional tephra fall thinning relationships with distance, and prevailing wind conditions, were used to inform annual probabilities of exceeding 10, 100, and 1000 mm tephra fall thicknesses. For New Zealand, tephra fall de-posits, which are particularly well preserved in peat bogs and lakes close to Auckland, have been used to inform probabilistic national (Hurst and Smith, 2004, 2010) and city level (conditional upon an eruption from any of the vol-canoes surrounding Auckland; Magill et al., 2006) tephra fall hazard assess-ments. For many other areas in the world, tephra fall records are either not
preserved well enough to contribute to comprehensive hazard assessments, or areas have not been subject to the same level of identification and study. For volcanoes where data were not present, Jenkins et al. (2012a, 2012b) de-veloped a fully probabilistic assessment method where a volcano’s eruption history was supplemented with information from analogous volcanoes to cal-culate volcano frequency-magnitude relationships. Multiyear records of wind speeds and directions with height above each volcano were then used to sim-ulate tephra falls from 190 sources across the Asia-Pacific region, aggregat-ing (by their probability of occurrence) the resulting tephra fall footprints to a regional 1 km2 grid. Outputs were in the form of maps displaying the average recurrence intervals of tephra falls exceeding thickness thresholds of 1, 10, and 100 mm. The exposure of populations within the areas of hazard was also calculated to provide one of the first regional views of likely tephra fall hazard and threat. Site-specific hazard assessments and disaggregation by volcanic source have been presented for the Asia-Pacific region (see Jenkins, 2009; Jen-kins et al., 2015; Aspinall and Blong, 2015). A subsequent tephra fall hazard assessment for the Asia-Pacific region (Bear-Crozier et al., 2016; Miller et al., 2016) used a statistical tephra dispersal emulator and monthly averaged wind conditions at the tropopause (250 mbar pressure level) to model regional and site-specific tephra fall hazard from Holocene active volcanoes. Results were provided as regional maps of tephra load at set return periods, with hazard fur-ther dis aggre gated at a number of cities in the region so that the contribution by volcano and eruption size could be identified.
In this paper we build upon previous indicator-based risk assessments by using the probabilistic regional hazard assessment methodology of Jenkins et al. (2012a, 2012b), with some refinements, to calculate site-specific tephra fall hazard for the region’s cities and move this toward an assessment of risk by incorporating exposure and vulnerability indicators of people and infrastruc-ture. After a brief overview of the cities analyzed we describe our hazard and risk assessment approach, followed by results and discussion.
ANALYZED CITIES
Within the Asia-Pacific region, nine countries contain active volcanoes, i.e., those that have at least one confirmed eruption recorded within the Holo cene (approximately the past 10 k.y.; Global Volcanism Program, 2013). For each of the 9 countries, we assess the risk to 2 cities within 500 km of a Holocene active volcano: the capital city and another city of high popula-tion (Fig. 1; Table 1). The capital city is analyzed on the supposition that it is the seat of government, an administrative center, and in most cases, the economic stronghold for the country. We only consider eastern China as we are concerned with the Asia-Pacific region. The capital cities of Australia and China are more than 500 km from an active volcano and so we do not con-sider these; however, their distance does not exempt them from tephra haz-ard and their absence should imply low, but not zero, hazard. The second city contains the highest population outside of the capital (using UN Statis-
Research Paper
3Jenkins et al. | Evaluating relative tephra fall hazard and risk in the Asia-Pacific regionGEOSPHERE | Volume 14 | Number 2
tics Division Demographic Statistics, http:// data .un .org /Data .aspx ?d =POP &f =tableCode %3A240 [accessed December 2016]), and within 500 km of any Holocene active volcano (Fig. 1; Table 1). Cities in the Democratic People’s Republic of Korea (PRK, or North Korea) may be threatened by tephra falls from Changbaishan-P’aektu-san on the border of China and PRK, although these are nearly 400 km from Pyongyang, and potentially from volcanoes in eastern China, but we have not assessed tephra fall risk for PRK cities here as vulnerability indices are not available for this country.
Consistent definitions for city and urban boundaries do not exist at the regional scale. For this study, central coordinates for the analyzed cities were taken from the United Nations Statistics Division (2016), and greater urban area boundaries sourced either from Open Street Map, and converted to shape-
files using mapshaper.org, or from the Global Administration spatial data base ( Table 1; Supplemental Table S11). Populations for the city were taken from the United Nations Statistics Division (2016), and populations for greater urban areas were calculated using global information system (GIS) and gridded 2015 population data (Center for International Earth Science Information Network, 2016). The physical boundaries employed in the United Nations (UN) popu-lation estimates for the city proper are unknown. Where the city proper and greater urban area population estimates are similar (Jakarta, Seoul, Busan, Kaohsiung, Auckland), the UN boundaries for the former must be defined simi-larly to those derived for the latter. The discrepancy between values for other cities suggests that the boundaries of the city proper are smaller than those of the greater urban area, as may be expected. The city proper values are not used within our assessment, but are useful to highlight the challenges associ-ated with sourcing data at the city scale.
For our chosen cities, we consider the hazard only from air fall tephra. The proximity of seven of the cities to active volcanoes means that they may also be subject to other more acute volcanic hazards such as pyroclastic density currents, lahars, or lava flows, the assessment of which is beyond the scope of this paper. Auckland in New Zealand is within the Auckland Volcanic Field, Taipei in Taiwan is 15 km from the Tatun Group, and Surabaya in Indonesia is 40 km to the north of Arjuno-Welirang. In exceptional cases, volcanic flows may extend as much as 100 km from a volcano, and in this case volcanic haz-ard in the cities of Surabaya (5 volcanoes), Manila (n = 4), Jakarta (n = 3), Tokyo, Taipei, and Davao (all n = 2), and Auckland (n = 1) may be better characterized by including these threats and assessing drainage channels and the likely di-rectionality and volume of future volcanic flows. In addition, some of the cities extend for large distances beyond the centroids noted, and thus some greater urban areas may be exposed to additional volcanoes or more proximal haz-ards. This potential is not explicitly accounted for here because the hazard for each city is assessed at a single point and more proximal hazards are not considered.
METHODS
Volcanic risk is a complex function comprising at least three components: hazard, exposure, and vulnerability. Given equal weight and independence be-tween the components, and taken at its simplest form with reference to natural hazards, risk can be written mathematically (Alexander, 2000; Fournier d’Albe, 1979) as:
Risk = hazard × exposure × vulnerability. (1)
In this definition, the hazard is quantified as the annual probability of the area under consideration being impacted; exposure as the number or value of elements at risk, and vulnerability as a value or ratio describing the suscepti-bility of the exposed elements to the hazard.
La�t
ude
40° -
20° -
0° -
–20° -
–40° -
Longitude100° 120° 140° 160° 180°
-----
TOKYOOsaka
Shenyang
SEOUL
TAIPEIKaohsiung
Davao
MANILA
JAKARTASurabaja
PORT MORESBY
Lae
Melbourne AucklandWELLINGTON
Busan
City population:
< 1 million1 to 2.5 million2.5 to 5 million5 to 7.5 million
> 7.5 million
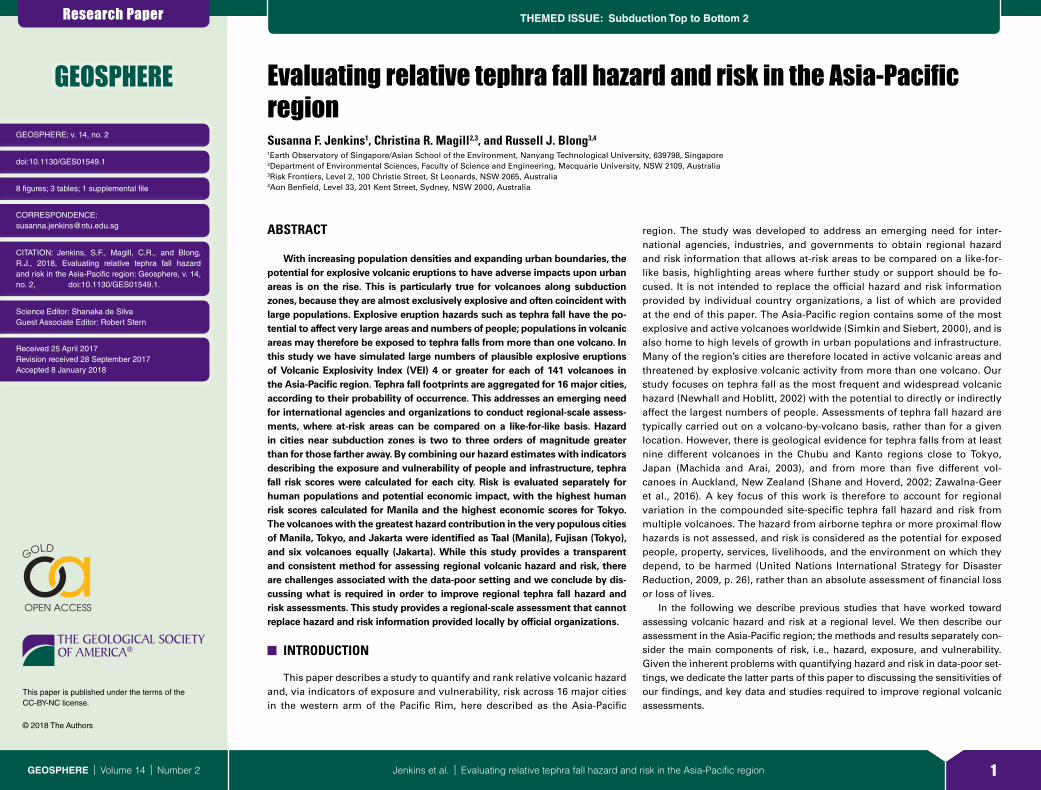
Figure 1. Asia-Pacific region showing the locations of the 141 volcanoes and 16 cities consid-ered. Filled blue circle size reflects the greater urban area population (see legend and Table 1). Capital cities are capitalized. Triangles represent the volcanoes assessed and dotted lines show 500 km boundaries surrounding the selected cities.
Table SM1: City greater urban boundaries were sourced from Open Street Map (ID shown) or, where
appropriate boundaries weren’t available, the Global Administra ve Areas spa al database
(www.gadm.org) according to the following zones.
City Country OSM ID Alterna�ve name Administra�ve zonesMelbourne Australia 4246124 Greater Melbourne 31 municipali�esShenyang Eastern China 2769604 -
JAKARTAIndonesia
6362934 Jabodetabek Jakarta, Bogor, Depok, Tangerang andBekasi
Surabaya - Zona Surabaya Raya Surabaya, Gresik, SidoarjoTOKYO
Japan- Tokyo-to prefecture Not including Izu/Ogasawara island
Osaka 341906 Osaka prefecture
WELLINGTONNew Zealand
- Wellington urban area Wellington city, Porirua, Hu� city, Upper Hu�
Auckland 2094141 Auckland urban area Auckland, Waitakere, Rodney, Manukau, parts of Franklin
Lae Papua New Guinea
- -PORT MORESBY 269423 Na�onal capital district
MANILAPhilippines
147488 Manila metropolitan area
17 zones including Manila city, Quezon city and Maka� CBD
Davao - Davao metropolitan area
Carmen, Davao city, Digos, Panabo, Samal, Santa Cruz, Tagum
SEOULSouth Korea
- Seoul special city 25 districts
Busan - Busan metropolitan city 15 districts
TAIPEITaiwan
- Taipei–Keelung metropolitan area
New Taipei city, Taipei, Taoyuan, Keelung
Kaohsiung - - -
1Supplemental Tables. Table S1: City greater urban boundaries. Table S2: Eruption probabilities. Please visit http:// doi .org /10 .1130 /GES01549 .S1 or the full-text article on www .gsapubs .org to view the Supple-mental Tables.

Research Paper
4Jenkins et al. | Evaluating relative tephra fall hazard and risk in the Asia-Pacific regionGEOSPHERE | Volume 14 | Number 2
The following sections describe how we established independent scores for each of tephra fall hazard, exposure, and vulnerability in order to provide a risk score using Equation 1.
Hazard
We considered the potential impact from all terrestrial active volcanoes within 500 km of an analyzed city (141 in total) within the Asia-Pacific region (Fig. 1). Tephra falls from volcanoes beyond this distance can occur but are expected to be thin, rare, or of limited consequence relative to those from vol-canoes closer to the city in question.
We used the tephra modeling method in Jenkins et al. (2012a, 2012b), which employed the advection-diffusion model ASHFALL (Hurst, 1994) to inform our hazard scores. Simulated eruptions were limited to Volcanic Explosivity Index (VEI) 4 and higher with the rationale that these are the eruptions with the po-tential to generate thicker and more widely dispersed tephra falls, and there-fore greater disruption for impacted communities. ASHFALL (Hurst, 1994) is an analytical advection-diffusion-sedimentation (ADS) model that assumes an instantaneous release of tephra distributed within a vertical eruption column above the vent. Tephra is then transported away from the volcano according to wind speeds and directions with height above the volcano with the tephra particles settling out and depositing by gravity. Thus, such models do not ac-count for the development of gravity-driven umbrella clouds in high-flux rate eruptions (Sparks et al., 1997); however, the diffusion coefficient used in ADS
models is deliberately larger than the actual atmospheric turbulent diffusion to partly account for this. This coefficient is usually chosen by calibrating the model against past large eruption deposits, and as a result ADS models are able to emulate the tephra deposits observed in large-magnitude eruptions (Costa et al., 2013).
Eruption frequency-magnitude relationships for the volcanoes assessed in our study followed the method in Jenkins et al. (2012a, 2012b), but using the updated 2016 Holocene eruption database (Global Volcanism Program, 2013), and with some revisions as described here. As in Jenkins et al. (2012a), the number of large (VEI ≥ 4) and small (VEI ≤ 3) magnitude eruptions at each volcano, within the record considered complete (see Jenkins et al., 2012a, for method; Supplemental Table S2 for values [see footnote 1]), and the num-ber of eruptions with no assigned VEI were aggregated to a consistent record length to give an averaged annual probability (λ) for an eruption of any magni-tude (λ = total number of eruptions/consistent record length). Where very few eruption data were available for a volcano, the conditional probability of that eruption then being small or large magnitude was inferred from the volcano type assigned by the Global Volcanism Program, with proportions derived from global analyses of eruption records by type (caldera, large cone, small cone, shield, and lava domes, as in Jenkins et al., 2012a). However, where there were enough eruptions in the volcano’s complete history, we chose to refine eruption probabilities. Three criteria allowed refinement of the annual eruption probability.
1. The volcano had at least three large-magnitude eruptions recorded in the complete database, meaning that the probability for such eruptions could
TABLE 1. ANALYZED CITIES AND THE NUMBER OF HOLOCENE ACTIVE (WITH CONFIRMED ERUPTIONS) VOLCANOES WITHIN 500 km AND 1000 km OF THE CITY
Country City Long, lat
Population(thousands) Number of active volcanoes within:
City proper Greater urban area 500 km 1000 km
Philippines MANILA 121.00, 14.58 1652 12,742 9 21Japan TOKYO 139.75, 35.69 8946 12,485 40 62Indonesia JAKARTA 106.75, –6.13 9608 9728 19 34Taiwan TAIPEI 121.51, 25.04 2675 9484 2 9South Korea SEOUL 127.00, 37.57 9820 9382 2 21Japan Osaka 135.52, 34.64 2665 9204 24 64eastern China Shenyang 123.88, 41.73 5303 8971 2 7Indonesia Surabaya 112.68, –7.39 2765 5794 19 34Australia Melbourne 145.08, –37.85 3848 4394 1 1South Korea Busan 129.03, 35.10 3524 3014 14 28Taiwan Kaohsiung 120.29, 22.61 2779 2660 6 11Philippines Davao 125.61, 7.08 1449 2237 11 30New Zealand Auckland 174.76, –36.90 1507 1466 11 11New Zealand WELLINGTON 174.78, –41.28 202 390 10 11Papua New Guinea PORT MORESBY 147.18, –9.48 254 309 7 23Papua New Guinea Lae 147.00, –6.72 101 110 15 23
Note: Capital cities are capitalized; all cities ordered by descending greater urban area population counts.

Research Paper
5Jenkins et al. | Evaluating relative tephra fall hazard and risk in the Asia-Pacific regionGEOSPHERE | Volume 14 | Number 2
be calculated independently. For example, Raung in Indonesia produced VEI 4 eruptions in A.D. 1817 and 1638 and a VEI 5 eruption in 1593. The average recurrence interval (ARI, the inverse of the annual probability) between erup-tions of VEI 4 or greater was calculated as 112 yr (1817 – 1593/2).
2. The volcano had at least four small-magnitude eruptions and at least one large-magnitude eruption recorded in the complete eruption history, allowing us to calculate a volcano-specific ratio between small- and large-magnitude eruptions. For example, Babuyan Claro volcano in the Philippines has a record of 6 small-magnitude eruptions in 208 yr and 1 large-magnitude eruption in 676 yr (at A.D. 1831). The large-magnitude ARI was calculated as 643 yr, with an annual probability of 1.56 × 10⁻³ [the probability of any magnitude eruption: 6/208 + 1/676, multiplied by the conditional probability of a large-magnitude eruption: (1/676)/(6/208)].
3. The volcano had at least 10 small-magnitude events, but no recorded large-magnitude events in the complete eruption history, implying that the vol-cano is preferentially producing small-magnitude events, and that eruptions are well recorded. For these volcanoes, the large-magnitude ARI is taken as the length of the complete record for large-magnitude eruptions, rounded up to the nearest 10 yr. For example, the Global Volcanism Program (www.volcano.si.edu; accessed December 2016) has a record of 24 small-magnitude erup-tions since A.D. 1872 and zero large-magnitude eruptions for Langila volcano in Papua New Guinea. A large-magnitude ARI was calculated as 1710 yr (the rounded length of the record considered complete for large-magnitude erup-tions in Papua New Guinea).
If a volcano’s eruption history fulfilled any of these criteria, then the refined values were used in modeling, with a preference shown by the order of criteria. Those volcanoes for which ARIs were refined using criteria 1 (n = 12), cri teria 2 (n = 14), and criteria 3 (n = 22) are highlighted in Table S2 (see footnote 1). For Taupo, Tatun Group, Norikuradake, Takaharayama, and Yonemaru-Sumi-yoshiike volcanoes, all eruptions in the catalogue had been assigned a VEI, but the eruptions were outside of the record deemed complete. For these vol-
canoes, we considered their entire eruption history in assigning a probability for an eruption of any magnitude, with the assumption that a total assignation of VEIs denotes an eruption history that is well known. Where few eruptions are produced over long time scales (e.g., 3 in ~10 k.y. at Norikuradake), the an-nual probabilities are very small and unlikely to significantly affect the hazard, especially where more frequently erupting volcanoes with better constrained histories are present, as in Japan. For Taupo, we calculated the probability of a large-magnitude eruption from the last three large-magnitude eruptions to give a large-magnitude ARI of 620 yr. For the remaining vol canoes, we in-ferred the probability of a large-magnitude eruption from those defined for the corresponding volcano type (as defined by the Global Volcanism Program, with the higher level type categories and associated probabilities calculated by Jenkins et al., 2012a). No volcanoes had a history with enough eruptions to de-rive reliable proportions between VEIs 4, 5, 6, and 7, and thus the proportions were assigned as before according to global analogue types (Jenkins et al., 2012a), but based upon an assessment of the updated 2016 global eruption record. This adaptation to the Jenkins et al. (2012a) method revised the erup-tion frequencies for 23 volcanoes, typically acting to reduce the probability of a large-magnitude eruption.
Modeling input parameters are shown in Table 2. For a given simulated eruption, the thickness of tephra fall in any city centroid depends upon the dis-tance to the volcano, the wind conditions acting on the tephra plume, the size and style of the eruption, and the physical characteristics of the erupted tephra, all captured within the dispersal modeling. Probabilistic methods employed in conjunction with numerical simulation are particularly important because they account for the range of potential eruption frequencies, volumes, and styles as well as variability in wind conditions, and can be condensed to arrive at a single average annual hazard value for one location. For any one location, hazard scores can be calculated by summing the probabilities associated with all simulations (from all volcanoes) that exceed a certain thickness threshold of interest at the particular site (as in Jenkins et al., 2012a).
TABLE 2. TEPHRA ADVECTION-DIFFUSION MODEL ASHFALL INPUTS, DERIVATIONS, RANGES, AND REFERENCES USED IN THIS STUDY
Input Derivation Minimum Maximum Source
Eruption probability Annual probability of any eruption sourced from the volcano’s complete eruption record Method from Jenkins et al. (2012a), with values updated for this study using the 2016 Global Volcanism Program eruption database (Global Volcanism Program, 2013)
VEI The proportion of each VEI category simulated; determined from analogous volcano types 4 7
Eruption volume (V ) Sampled from a power law distribution with limits determined by VEI classification 0.1 km3
(low VEI 4)1000 km3
(high VEI 7)Newhall and Self (1982)
Column height (Z ) Related to eruption volume (V ) by Z = 8.67 log10 (V ) + 20.2 11.5 km 46 km Carey and Sigurdsson (1989); Jenkins et al. (2007)Settling velocities Mean and standard deviation varied for each simulation to give truncated lognormal
distribution0.3 m/s 9.5 m/s Walker et al. (1971)
Wind conditions Stochastically sampled from the 10 yr (6 h interval) National Centers for Environmental Prediction–National Center for Atmospheric Research reanalysis record closest to each volcano (2.5° grid).
Wind speeds and directions were interpolated from 17 pressure levels to 35 km at 1 km height intervals.
Kalnay et al. (1996)
Note: VEI—Volcanic Explosivity Index. Advection-diffusion model ASHFALL is after Hurst (1994). The horizontal diffusion coefficient (6000 m2/s) and Suzuki constant (5) were not sampled and remained constant for all simulations. For further details, see Jenkins et al. (2012a, 2012b).
Research Paper
6Jenkins et al. | Evaluating relative tephra fall hazard and risk in the Asia-Pacific regionGEOSPHERE | Volume 14 | Number 2
For the purposes of this assessment, 3 hazard scores for each city were drawn from the model outputs, representing the annual probability of tephra falls exceeding 1, 10, and 100 mm thickness. Hazard scores across the entire greater urban area may show some limited spread around the value at the city centroid depending upon the distance and bearing of each grid cell from sur-rounding volcanoes. Additional tephra fall hazard may arise from vol canoes more than 500 km from the city, and from smaller magnitude (VEI ≤ 3) erup-tions, although the contribution is expected to be small for most cities.
Exposure
Elements that may be adversely affected by tephra fall include human and animal populations, agriculture, infrastructure, buildings and socioeconomic activities (Blong, 1984; Jenkins et al., 2015; Magill et al., 2013; Wilson et al., 2012). We focus here on two distinct measures of exposure to reflect the po-tential impacts of tephra fall for human populations and infrastructure assets (including buildings).
Human Population
We used the total number of people in each city greater urban area (see discussion of Analyzed Cities; Table 1; Table S1 [see footnote 1]) as our expo-sure score for human populations. Values were calculated using GIS and 1 km2 gridded 2015 population data (Center for International Earth Science Informa-tion Network, 2016).
Infrastructure Value
To provide an indicative economic value of the exposure of infrastructure and building assets, we used the Global Exposure database (GEG 2013) de-veloped for the United Nations 2013 Global Assessment Report (De Bono and Mora, 2014). The data set was specifically designed to assess the potential for economic losses as a consequence of natural hazards globally and is very ap-propriate for our purposes. Capital stock estimates of machinery, structures, and urban land, and information on building types were proportionally dis-aggregated from the country scale to a 5 km2 grid using the socioeconomic indicators of population density, income, employment, health, and education (for more information see De Bono and Mora, 2014). The exposure score for economic value is then taken as the total GEG 2013 value (U.S. $ millions within each greater urban area. Where the area boundary divided a grid cell, the value of the entire cell was counted.
Vulnerability
Trying to capture vulnerability to tephra fall by a single index is challenging as impacts vary for each of the hazard score thresholds (≥ 1, 10, and 100 mm). Tephra falls of 1 mm may cause temporary disruption through reduced visibil-
ity and/or infiltration of tephra into electrical components (Wilson et al., 2012), and will require costly clean up (Hayes et al., 2015). For example, data collected from past eruptions (predominantly for Kagoshima in Japan) has shown that a tephra fall of just 1 mm in an urban area will require the coordinated removal and collection of tephra from roads, as well as munici pal assistance in collect-ing tephra from properties, at costs of U.S. $150,000 to $400,000 per km2 (in 2013 U.S.$ values, calculated from Hayes et al., 2015, their figure 4 therein). Under tephra falls of ~10 mm, short-circuiting of power networks is more likely (Wardman et al., 2012), repair may be required for critical infrastructure services and nonstructural building elements such as gutters (Jenkins et al., 2015; Wilson et al., 2012), and estimated clean-up costs escalate to U.S.$1.2–3 million per km2 (Hayes et al., 2015). Thicker falls (>100 mm) can lead to struc-tural building and infrastructure damage (Jenkins et al., 2015), threatening the lives of any building occupants and requiring significant reconstruction and rehabilitation before normal activities can resume (Blong, 1984). As well as the thickness thresholds, the impacts can also vary for different assets, e.g., human health, buildings, infrastructure, and with differing tephra characteristics, con-texts and environmental conditions. In the absence of anything finer, we have used national vulnerability indices that correspond with the previously deter-mined exposure scores. National scores are acceptable on a regional level, but we do not recommend that these indices be used for local-scale assessments; improved asset-specific vulnerability estimates at higher resolution would en-able a more comprehensive investigation of risk.
Human Populations
Income and education have been identified as key factors in limiting a per-son’s capacity to respond to natural hazard impacts (Jenkins and Haynes, 2011; United Nations International Strategy for Disaster Reduction, 2007). Therefore, those communities that are less economically advanced may be expected to have a higher vulnerability. We apply the United Nations World Risk Index (WRI; Welle and Birkmann, 2015), which provides a measure of human vulner-ability to natural hazards using indicators that describe a country’s susceptibil-ity, coping capacity, and adaptive capacity. The WRI includes an indicator for population exposure to natural hazards and we removed this to leave only the vulnerability component. This vulnerability component is inversely correlated with the Human Development Index (HDI; United Nations Development Pro-gramme, 2015), so that those more vulnerable in the WRI have lower HDI scores, as derived from indicators for life expectancy, education, and gross domestic product per capita. The WRI vulnerability score for Taiwan is inferred from Japan’s value (as Japan exhibits a very similar HDI).
Infrastructure Value
In contradiction to the WRI vulnerability score described here, societies that are strongly reliant upon technology and industry to support urban livelihoods and socioeconomic activities may be less willing or able to adapt to volcanic
Research Paper
7Jenkins et al. | Evaluating relative tephra fall hazard and risk in the Asia-Pacific regionGEOSPHERE | Volume 14 | Number 2
hazards and may therefore also be vulnerable (Pyle, 1995). A number of indices to describe the technological advancement of a country were developed in the mid-2000s. We use the ArCo index, which considers three dimensions of technological advancement: innovative activity, technology infrastructure, and human capital (see Archibugi and Coco, 2004, for more details). A higher ArCo index is used to imply a higher economic, or technological, vulnerability. The ArCo index builds upon a number of previous indices, which all show similar patterns across the Asia-Pacific region, is the only technology index with a value for Papua New Guinea, and is the most recently available index of this nature. As the index is more than 10 yr old, it may underestimate the current technological vulnerability, particularly in rapidly developing countries. An up-dated index with a focus particularly on natural, if not volcanic, hazards would be valuable, as would finer-than-national resolution estimates.
RESULTS
Hazard
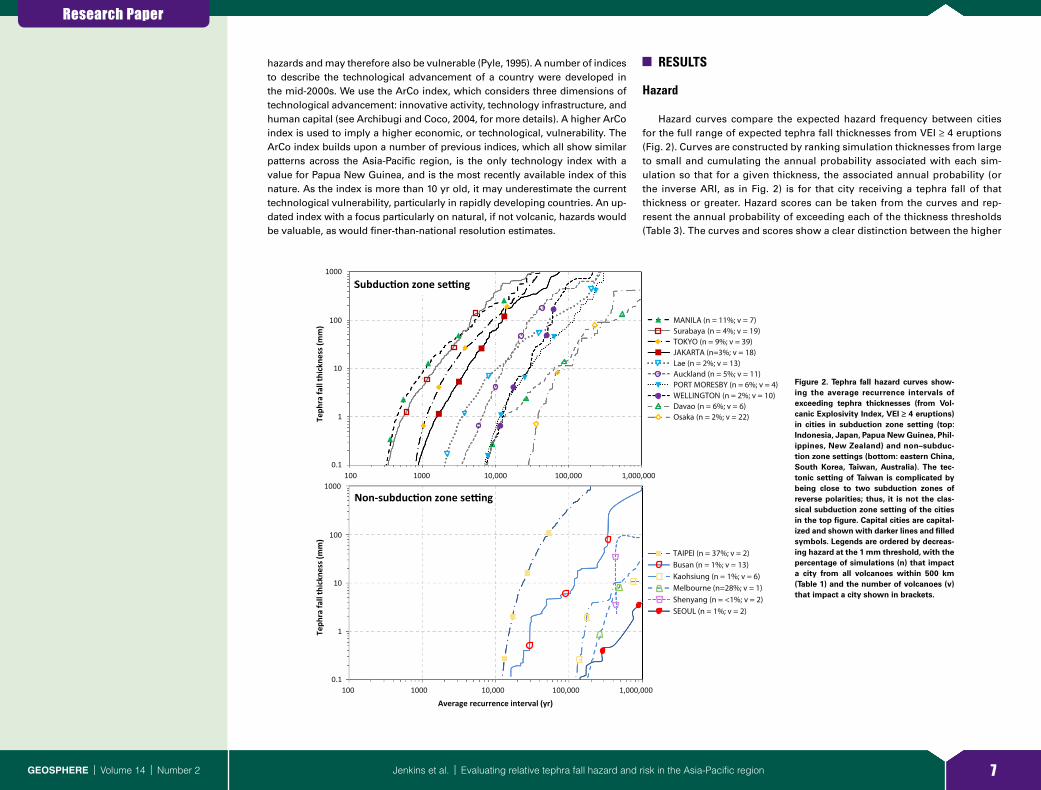
Hazard curves compare the expected hazard frequency between cities for the full range of expected tephra fall thicknesses from VEI ≥ 4 eruptions (Fig. 2). Curves are constructed by ranking simulation thicknesses from large to small and cumulating the annual probability associated with each sim-ulation so that for a given thickness, the associated annual probability (or the inverse ARI, as in Fig. 2) is for that city receiving a tephra fall of that thickness or greater. Hazard scores can be taken from the curves and rep-resent the annual probability of exceeding each of the thickness thresholds (Table 3). The curves and scores show a clear distinction between the higher
1000
100
10
1
0.1
100
10
1
0.1
1000
Teph
ra fa
ll th
ickn
ess (
mm
)Te
phra
fall
thic
knes
s (m
m)
100 1000 10,000 100,000 1,000,000
100 1000 10,000 100,000 1,000,000
Average recurrence interval (yr)
TAIPEI (n = 37%; v = 2)Busan (n = 1%; v = 13)Kaohsiung (n = 1%; v = 6)Melbourne (n=28%; v = 1)Shenyang (n = <1%; v = 2)SEOUL (n = 1%; v = 2)
MANILA (n = 11%; v = 7)Surabaya (n = 4%; v = 19)TOKYO (n = 9%; v = 39)JAKARTA (n=3%; v = 18)Lae (n = 2%; v = 13)Auckland (n = 5%; v = 11)PORT MORESBY (n = 6%; v = 4)WELLINGTON (n = 2%; v = 10)Davao (n = 6%; v = 6)Osaka (n = 2%; v = 22)
Subduc�on zone se�ng
Non-subduc�on zone se�ng
Figure 2. Tephra fall hazard curves show-ing the average recurrence intervals of exceeding tephra thicknesses (from Vol-canic Explosivity Index, VEI ≥ 4 eruptions) in cities in subduction zone setting (top: Indonesia, Japan, Papua New Guinea, Phil-ippines, New Zealand) and non–subduc-tion zone settings (bottom: eastern China, South Korea, Taiwan, Australia). The tec-tonic setting of Taiwan is complicated by being close to two subduction zones of reverse polarities; thus, it is not the clas-sical subduction zone setting of the cities in the top figure. Capital cities are capital-ized and shown with darker lines and filled symbols. Legends are ordered by decreas-ing hazard at the 1 mm threshold, with the percentage of simulations (n) that impact a city from all volcanoes within 500 km (Table 1) and the number of volcanoes (v) that impact a city shown in brackets.
Research Paper
8Jenkins et al. | Evaluating relative tephra fall hazard and risk in the Asia-Pacific regionGEOSPHERE | Volume 14 | Number 2
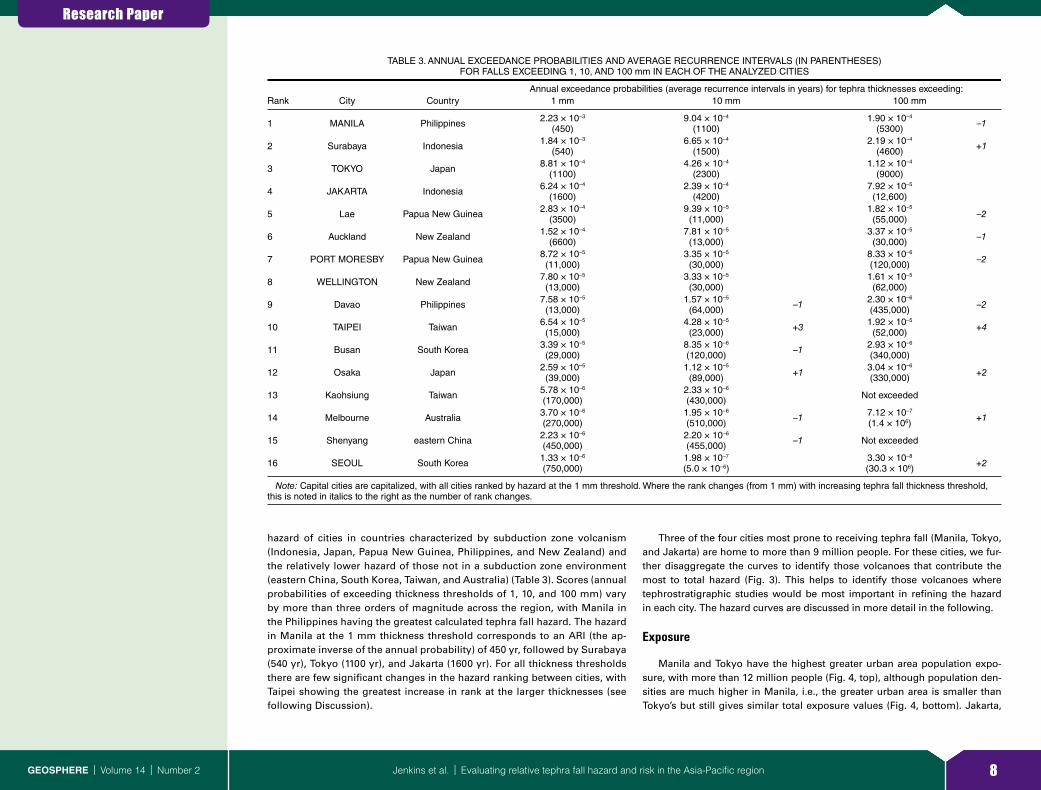
hazard of cities in countries characterized by subduction zone volcanism (Indonesia, Japan, Papua New Guinea, Philippines, and New Zealand) and the relatively lower hazard of those not in a subduction zone environment (eastern China, South Korea, Taiwan, and Australia) (Table 3). Scores (annual probabilities of exceeding thickness thresholds of 1, 10, and 100 mm) vary by more than three orders of magnitude across the region, with Manila in the Philippines having the greatest calculated tephra fall hazard. The hazard in Manila at the 1 mm thickness threshold corresponds to an ARI (the ap-proximate inverse of the annual probability) of 450 yr, followed by Surabaya (540 yr), Tokyo (1100 yr), and Jakarta (1600 yr). For all thickness thresholds there are few significant changes in the hazard ranking between cities, with Taipei showing the greatest increase in rank at the larger thicknesses (see following Discussion).
Three of the four cities most prone to receiving tephra fall (Manila, Tokyo, and Jakarta) are home to more than 9 million people. For these cities, we fur-ther disaggregate the curves to identify those volcanoes that contribute the most to total hazard (Fig. 3). This helps to identify those volcanoes where tephro stratigraphic studies would be most important in refining the hazard in each city. The hazard curves are discussed in more detail in the following.
Exposure
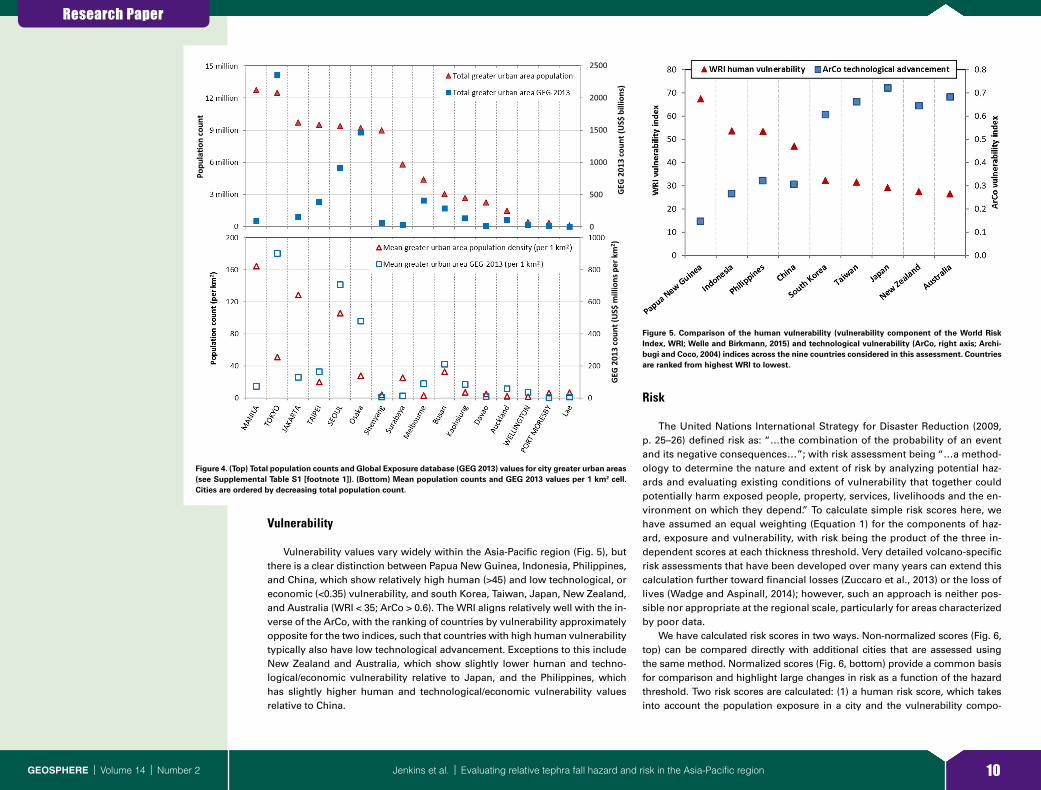
Manila and Tokyo have the highest greater urban area population expo-sure, with more than 12 million people (Fig. 4, top), although population den-sities are much higher in Manila, i.e., the greater urban area is smaller than Tokyo’s but still gives similar total exposure values (Fig. 4, bottom). Jakarta,
TABLE 3. ANNUAL EXCEEDANCE PROBABILITIES AND AVERAGE RECURRENCE INTERVALS (IN PARENTHESES) FOR FALLS EXCEEDING 1, 10, AND 100 mm IN EACH OF THE ANALYZED CITIES
Rank City CountryAnnual exceedance probabilities (average recurrence intervals in years) for tephra thicknesses exceeding:
1 mm 10 mm 100 mm
1 MANILA Philippines 2.23 × 10⁻³
(450)9.04 × 10⁻⁴
(1100)1.90 × 10⁻⁴
(5300) –1
2 Surabaya Indonesia 1.84 × 10⁻³
(540)6.65 × 10⁻⁴
(1500)2.19 × 10⁻⁴
(4600) +1
3 TOKYO Japan 8.81 × 10⁻⁴
(1100)4.26 × 10⁻⁴
(2300)1.12 × 10⁻⁴
(9000)
4 JAKARTA Indonesia 6.24 × 10⁻⁴
(1600)2.39 × 10⁻⁴
(4200)7.92 × 10⁻⁵
(12,600)
5 Lae Papua New Guinea 2.83 × 10⁻⁴
(3500)9.39 × 10⁻⁵
(11,000)1.82 × 10⁻⁵
(55,000) –2
6 Auckland New Zealand 1.52 × 10⁻⁴
(6600)7.81 × 10⁻⁵
(13,000)3.37 × 10⁻⁵
(30,000) –1
7 PORT MORESBY Papua New Guinea 8.72 × 10⁻⁵
(11,000)3.35 × 10⁻⁵
(30,000)8.33 × 10⁻⁶
(120,000) –2
8 WELLINGTON New Zealand 7.80 × 10⁻⁵
(13,000)3.33 × 10⁻⁵
(30,000)1.61 × 10⁻⁵
(62,000)
9 Davao Philippines 7.58 × 10⁻⁵
(13,000)1.57 × 10⁻⁵
(64,000) –1 2.30 × 10⁻⁶
(435,000) –2
10 TAIPEI Taiwan 6.54 × 10⁻⁵
(15,000)4.28 × 10⁻⁵
(23,000) +3 1.92 × 10⁻⁵
(52,000) +4
11 Busan South Korea 3.39 × 10⁻⁵
(29,000)8.35 × 10⁻⁶
(120,000) –1 2.93 × 10⁻⁶
(340,000)
12 Osaka Japan 2.59 × 10⁻⁵
(39,000)1.12 × 10⁻⁵
(89,000) +1 3.04 × 10⁻⁶
(330,000) +2
13 Kaohsiung Taiwan 5.78 × 10⁻⁶
(170,000)2.33 × 10⁻⁶
(430,000) Not exceeded
14 Melbourne Australia 3.70 × 10⁻⁶
(270,000)1.95 × 10⁻⁶
(510,000) –1 7.12 × 10⁻⁷
(1.4 × 10⁶) +1
15 Shenyang eastern China 2.23 × 10⁻⁶
(450,000)2.20 × 10⁻⁶
(455,000) –1 Not exceeded
16 SEOUL South Korea 1.33 × 10⁻⁶
(750,000)1.98 × 10⁻⁷
(5.0 × 10⁻⁶)3.30 × 10⁻⁸
(30.3 × 10⁶) +2
Note: Capital cities are capitalized, with all cities ranked by hazard at the 1 mm threshold. Where the rank changes (from 1 mm) with increasing tephra fall thickness threshold, this is noted in italics to the right as the number of rank changes.

Research Paper
9Jenkins et al. | Evaluating relative tephra fall hazard and risk in the Asia-Pacific regionGEOSPHERE | Volume 14 | Number 2
Taipei, Seoul, Osaka, and Shenyang all show similarly high population expo-sures of nine to ten million people with exposures declining steadily for the remaining cities.
With regard to the GEG 2013 values, Tokyo has by far the greatest score with U.S. $2.36 trillion in capital stock and land value exposed across the greater urban area (Fig. 4, top). The second assessed Japanese city of Osaka
has the next largest value at U.S. $1.46 trillion; Seoul, Taipei, Melbourne, and Busan all contain more than U.S. $250 billion. Tokyo, Seoul, and Osaka also stand out as having an average of more than U.S. $480 million exposed within each 1 km2 (Fig. 4, bottom). The exposure of the remainder of the cities is less than a total of U.S. $250 billion and an average of U.S. $215 million per km2 (Fig. 4).
Total hazardTaalMayonPinatuboSan PabloBulusan
Total hazardFujisanAsamayamaOntakesanIzu-OshimaYakedake
Total hazardTangkubanparahuPerbak�-GagakGede-PangrangoSalakCereme
MANILA7 volcanoes
JAKARTA19 volcanoes
0 100 km 0 100 km
TOKYO39 volcanoes
Fujisan (1)
Asamayama (2)Yakedake (5)
Izu-Oshima (4)
Ontakesan (3)
0 100 km
Taal (1)
Bulusan (5)
Mayon (2)
Pinatubo (3)
San Pablo (4)
Perbak�-Gagak (2)Tangkubanparahu (1)
Salak (4)
Gede-Pangrango (3) Cereme (5)
Average recurrence interval (yr) Average recurrence interval (yr) Average recurrence interval (yr)
Teph
ra fa
ll th
ickn
ess (
mm
)
1,000
100
100 1,000 10,000 100,000 1,000,000 1,000 10,000 100,000 1,000,000 1,000 10,000 100,000 1,000,000
10
1
0.1
Figure 3. (Top) City locations (light blue circles) and surrounding volcanoes (red triangles); larger triangles show the five volcanoes contributing the most to the city hazard (rank at the 1 mm threshold in brackets). The number of volcanoes that produce simulated tephra falls in each city is shown below the city name. (Bottom) Total tephra fall hazard curves (from Volcanic Explosivity Index, VEI ≥ 4 eruptions; bold black lines) for Manila (left), Tokyo (center), and Jakarta (right), with the disaggregated curves shown for all volcanoes that impact the city. The five volcanoes with the highest annual probabilities of exceeding 1 mm are shown in the legend and with dashed colored lines in the plots.
Research Paper
10Jenkins et al. | Evaluating relative tephra fall hazard and risk in the Asia-Pacific regionGEOSPHERE | Volume 14 | Number 2
Vulnerability
Vulnerability values vary widely within the Asia-Pacific region (Fig. 5), but there is a clear distinction between Papua New Guinea, Indonesia, Philippines, and China, which show relatively high human (>45) and low technological, or economic (<0.35) vulnerability, and south Korea, Taiwan, Japan, New Zealand, and Australia (WRI < 35; ArCo > 0.6). The WRI aligns relatively well with the in-verse of the ArCo, with the ranking of countries by vulnerability approximately opposite for the two indices, such that countries with high human vulnerability typically also have low technological advancement. Exceptions to this include New Zealand and Australia, which show slightly lower human and techno-logical/economic vulnerability relative to Japan, and the Philippines, which has slightly higher human and technological/economic vulnerability values relative to China.
Risk
The United Nations International Strategy for Disaster Reduction (2009, p. 25–26) defined risk as: “…the combination of the probability of an event and its negative consequences…”; with risk assessment being “…a method-ology to determine the nature and extent of risk by analyzing potential haz-ards and evaluating existing conditions of vulnerability that together could potentially harm exposed people, property, services, livelihoods and the en-vironment on which they depend.” To calculate simple risk scores here, we have assumed an equal weighting (Equation 1) for the components of haz-ard, exposure and vulnerability, with risk being the product of the three in-dependent scores at each thickness threshold. Very detailed volcano- specific risk assessments that have been developed over many years can extend this calculation further toward financial losses (Zuccaro et al., 2013) or the loss of lives (Wadge and Aspinall, 2014); however, such an approach is neither pos-sible nor appropriate at the regional scale, particularly for areas characterized by poor data.
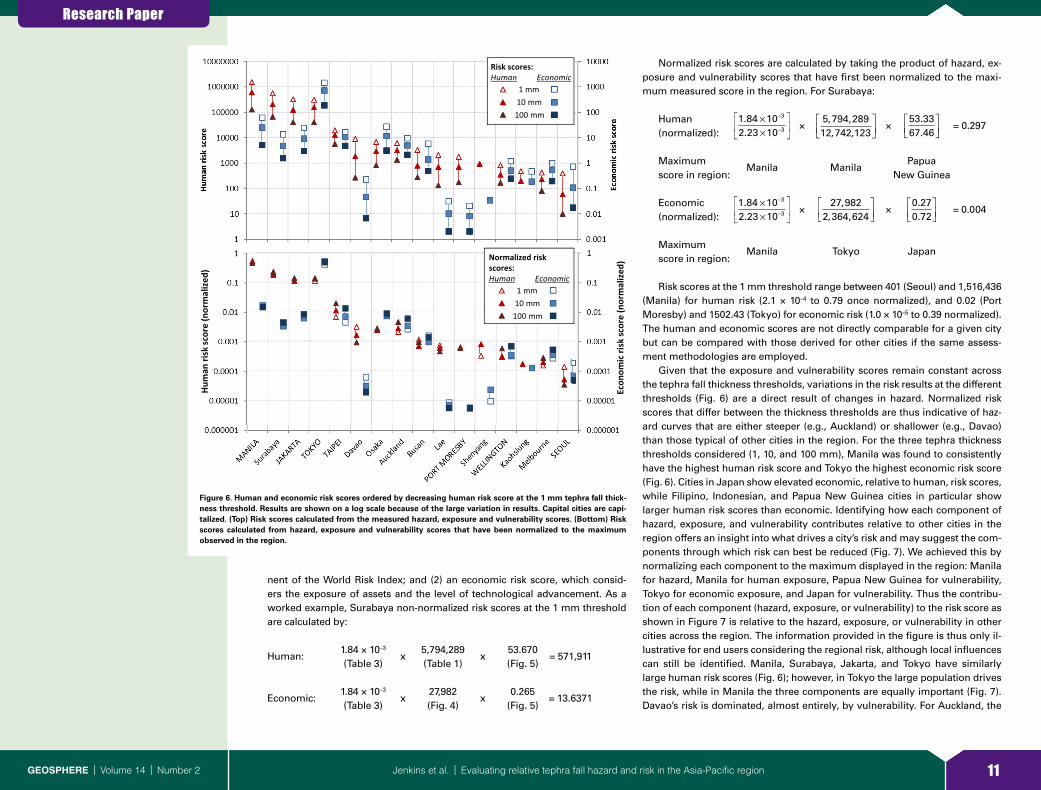
We have calculated risk scores in two ways. Non-normalized scores (Fig. 6, top) can be compared directly with additional cities that are assessed using the same method. Normalized scores (Fig. 6, bottom) provide a common basis for comparison and highlight large changes in risk as a function of the hazard threshold. Two risk scores are calculated: (1) a human risk score, which takes into account the population exposure in a city and the vulnerability compo-
2
2
Popu
la�o
n co
unt
GEG
201
3 co
unt (
US$
bill
ions
)GE
G 20
13 co
unt (
US$
mill
ions
per
km
2 )
2500
2000
1500
1000
500
0
Figure 4. (Top) Total population counts and Global Exposure database (GEG 2013) values for city greater urban areas (see Supplemental Table S1 [footnote 1]). (Bottom) Mean population counts and GEG 2013 values per 1 km2 cell. Cities are ordered by decreasing total population count.
Figure 5. Comparison of the human vulnerability (vulnerability component of the World Risk Index, WRI; Welle and Birkmann, 2015) and technological vulnerability (ArCo, right axis; Archi-bugi and Coco, 2004) indices across the nine countries considered in this assessment. Countries are ranked from highest WRI to lowest.
Research Paper
11Jenkins et al. | Evaluating relative tephra fall hazard and risk in the Asia-Pacific regionGEOSPHERE | Volume 14 | Number 2
nent of the World Risk Index; and (2) an economic risk score, which consid-ers the exposure of assets and the level of technological advancement. As a worked example, Surabaya non-normalized risk scores at the 1 mm threshold are calculated by:
Human: 1.84 × 10–3
x 5,794,289
x 53.670
= 571,911 (Table 3) (Table 1) (Fig. 5)
Economic: 1.84 × 10–3
x 27,982
x 0.265
= 13.6371 (Table 3) (Fig. 4) (Fig. 5)
Normalized risk scores are calculated by taking the product of hazard, ex-posure and vulnerability scores that have first been normalized to the maxi-mum measured score in the region. For Surabaya:
Human 1 84 102 23 10
3
3
.
.××
−
− × 5 794 28912 742 123, ,, ,
×
53 3367 46
.
.
= 0.297
(normalized):
Maximum Manila Manila
Papua score in region: New Guinea
Economic 1 84 102 23 10
3
3
.
.××
−
− × 27 982
2 364 624,
, ,
×
0 270 72
.
.
= 0.004
(normalized):
Maximum Manila Tokyo Japan
score in region:
Risk scores at the 1 mm threshold range between 401 (Seoul) and 1,516,436 (Manila) for human risk (2.1 × 10⁻⁴ to 0.79 once normalized), and 0.02 (Port Moresby) and 1502.43 (Tokyo) for economic risk (1.0 × 10⁻⁵ to 0.39 normalized). The human and economic scores are not directly comparable for a given city but can be compared with those derived for other cities if the same assess-ment methodologies are employed.
Given that the exposure and vulnerability scores remain constant across the tephra fall thickness thresholds, variations in the risk results at the different thresholds (Fig. 6) are a direct result of changes in hazard. Normalized risk scores that differ between the thickness thresholds are thus indicative of haz-ard curves that are either steeper (e.g., Auckland) or shallower (e.g., Davao) than those typical of other cities in the region. For the three tephra thickness thresholds considered (1, 10, and 100 mm), Manila was found to consistently have the highest human risk score and Tokyo the highest economic risk score (Fig. 6). Cities in Japan show elevated economic, relative to human, risk scores, while Filipino, Indonesian, and Papua New Guinea cities in particular show larger human risk scores than economic. Identifying how each component of hazard, exposure, and vulnerability contributes relative to other cities in the region offers an insight into what drives a city’s risk and may suggest the com-ponents through which risk can best be reduced (Fig. 7). We achieved this by normalizing each component to the maximum displayed in the region: Manila for hazard, Manila for human exposure, Papua New Guinea for vulnerability, Tokyo for economic exposure, and Japan for vulnerability. Thus the contribu-tion of each component (hazard, exposure, or vulnerability) to the risk score as shown in Figure 7 is relative to the hazard, exposure, or vulnerability in other cities across the region. The information provided in the figure is thus only il-lustrative for end users considering the regional risk, although local influences can still be identified. Manila, Surabaya, Jakarta, and Tokyo have similarly large human risk scores (Fig. 6); however, in Tokyo the large population drives the risk, while in Manila the three components are equally important (Fig. 7). Davao’s risk is dominated, almost entirely, by vulnerability. For Auckland, the
Risk scores:Human Economic
1 mm10 mm
100 mm
Normalized risk scores:Human Economic
1 mm10 mm
100 mm
Hum
an ri
sk sc
ore
(nor
mal
ized
)
Econ
omic
risk
scor
e (n
orm
aliz
ed)
Figure 6. Human and economic risk scores ordered by decreasing human risk score at the 1 mm tephra fall thick-ness threshold. Results are shown on a log scale because of the large variation in results. Capital cities are capi-talized. (Top) Risk scores calculated from the measured hazard, exposure and vulnerability scores. (Bottom) Risk scores calculated from hazard, exposure and vulnerability scores that have been normalized to the maximum observed in the region.
Research Paper
12Jenkins et al. | Evaluating relative tephra fall hazard and risk in the Asia-Pacific regionGEOSPHERE | Volume 14 | Number 2
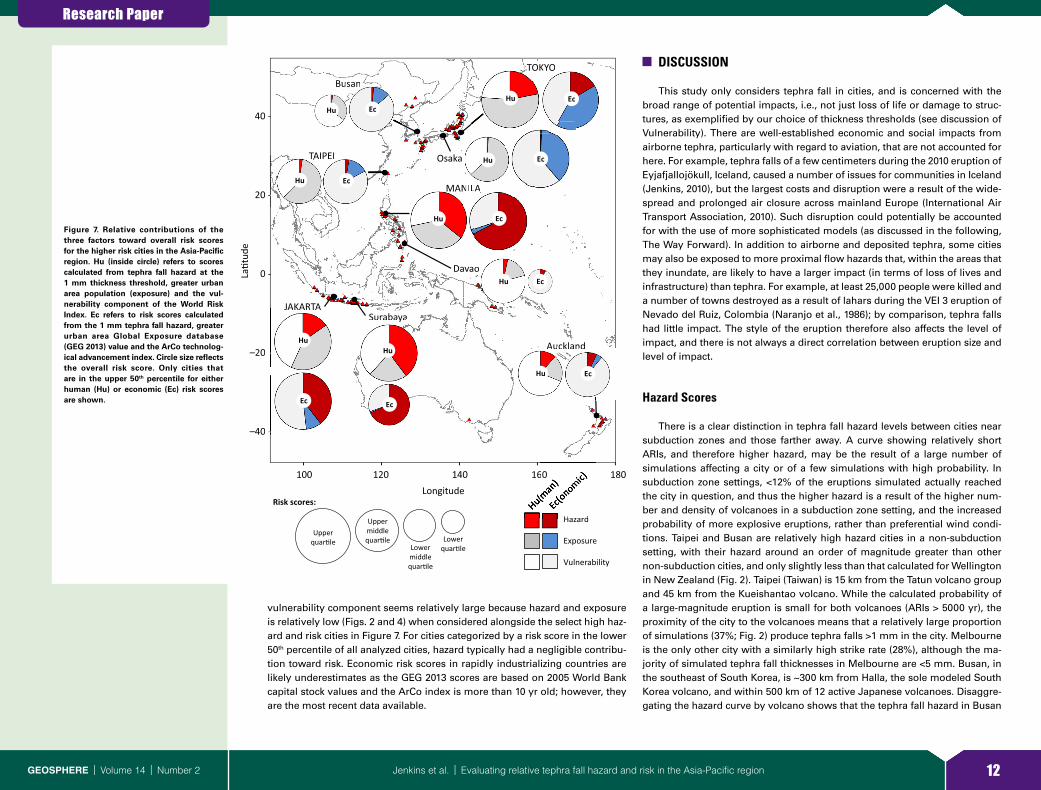
vulnerability component seems relatively large because hazard and exposure is relatively low (Figs. 2 and 4) when considered alongside the select high haz-ard and risk cities in Figure 7. For cities categorized by a risk score in the lower 50th percentile of all analyzed cities, hazard typically had a negligible contribu-tion toward risk. Economic risk scores in rapidly industrializing countries are likely underestimates as the GEG 2013 scores are based on 2005 World Bank capital stock values and the ArCo index is more than 10 yr old; however, they are the most recent data available.
DISCUSSION
This study only considers tephra fall in cities, and is concerned with the broad range of potential impacts, i.e., not just loss of life or damage to struc-tures, as exemplified by our choice of thickness thresholds (see discussion of Vulnerability). There are well-established economic and social impacts from airborne tephra, particularly with regard to aviation, that are not accounted for here. For example, tephra falls of a few centimeters during the 2010 eruption of Eyjafjallojökull, Iceland, caused a number of issues for communities in Iceland (Jenkins, 2010), but the largest costs and disruption were a result of the wide-spread and prolonged air closure across mainland Europe (International Air Transport Association, 2010). Such disruption could potentially be accounted for with the use of more sophisticated models (as discussed in the following, The Way Forward). In addition to airborne and deposited tephra, some cities may also be exposed to more proximal flow hazards that, within the areas that they inundate, are likely to have a larger impact (in terms of loss of lives and infrastructure) than tephra. For example, at least 25,000 people were killed and a number of towns destroyed as a result of lahars during the VEI 3 eruption of Nevado del Ruiz, Colombia (Naranjo et al., 1986); by comparison, tephra falls had little impact. The style of the eruption therefore also affects the level of impact, and there is not always a direct correlation between eruption size and level of impact.
Hazard Scores
There is a clear distinction in tephra fall hazard levels between cities near subduction zones and those farther away. A curve showing relatively short ARIs, and therefore higher hazard, may be the result of a large number of simulations affecting a city or of a few simulations with high probability. In subduction zone settings, <12% of the eruptions simulated actually reached the city in question, and thus the higher hazard is a result of the higher num-ber and density of volcanoes in a subduction zone setting, and the increased probability of more explosive eruptions, rather than preferential wind condi-tions. Taipei and Busan are relatively high hazard cities in a non-subduction setting, with their hazard around an order of magnitude greater than other non-subduction cities, and only slightly less than that calculated for Wellington in New Zealand (Fig. 2). Taipei (Taiwan) is 15 km from the Tatun volcano group and 45 km from the Kueishantao volcano. While the calculated probability of a large-magnitude eruption is small for both volcanoes (ARIs > 5000 yr), the proximity of the city to the volcanoes means that a relatively large proportion of simulations (37%; Fig. 2) produce tephra falls >1 mm in the city. Melbourne is the only other city with a similarly high strike rate (28%), although the ma-jority of simulated tephra fall thicknesses in Melbourne are <5 mm. Busan, in the southeast of South Korea, is ~300 km from Halla, the sole modeled South Korea volcano, and within 500 km of 12 active Japanese volcanoes. Dis aggre-gating the hazard curve by volcano shows that the tephra fall hazard in Busan
JAKARTA
La�t
ude
40 -
20 -
0 -
–20 -
–40 -
Longitude100 120 140 160 180
-----
Surabaya
Risk scores:
Hazard
Exposure
Vulnerability
Upper quar�le
Upper middle quar�le
Lower middle quar�le
MANILA
16
H
Hu
Auckland
Davao
H d
60
H
Busan
Osaka
TOKYO
TAIPEI
Lower quar�le
NNIILLA
Ec
Surabaya
Hu
Ec
JAKARTATT
0 ---
0 ---
Ec
Hu
YOTOKYOKY
Hu Ec
---
TAT IPEITATT IPE
EcHu
oHu Ec
AN
a
NILA
Hu Ec
andAuckluckl
Hu Ec
usan
Hu Ec
Figure 7. Relative contributions of the three factors toward overall risk scores for the higher risk cities in the Asia-Pacific region. Hu (inside circle) refers to scores calculated from tephra fall hazard at the 1 mm thickness threshold, greater urban area population (exposure) and the vul-nerability component of the World Risk Index. Ec refers to risk scores calculated from the 1 mm tephra fall hazard, greater urban area Global Exposure database (GEG 2013) value and the ArCo technolog-ical advancement index. Circle size reflects the overall risk score. Only cities that are in the upper 50th percentile for either human (Hu) or economic (Ec) risk scores are shown.
Research Paper
13Jenkins et al. | Evaluating relative tephra fall hazard and risk in the Asia-Pacific regionGEOSPHERE | Volume 14 | Number 2
is dominated by explosive volcanism in southern Japan due to the larger number of volcanoes with greater eruption frequencies, and the westerly wind directions at high altitudes (>30 km). Long ARIs (>100 k.y.) such as those cal-culated for Kaohsiung, Melbourne, Shenyang, and Seoul may either reflect genuinely low probabilities, or a limitation of using the Holocene (last 10 k.y.) eruption record to inform future hazard. However, that the cities exhibit rela-tively low hazard scores is a valid finding.
In general, a smoother curve is indicative of more data points (i.e., more simulations reaching the city in question). A steeper curve is indicative of the hazard being sourced in part from a volcano or volcanoes capable of producing larger thicknesses in the city at ARIs not significantly longer than for smaller thicknesses: a function of the distance of volcanoes to the city centroid, prevail-ing wind conditions, potential eruption volume of each volcano, and the proba-bility of eruption. For example, Lae in Papua New Guinea and Auckland in New Zealand have relatively similar ARIs for VEI ≥ 4 tephra fall thicknesses exceed-ing 20 mm (~20 k.y.), but the Auckland curve is much steeper than that of Lae (Fig. 2). Disaggregating the curves shows that the larger thicknesses in Auck-land are dominated by Taupo, a caldera ~225 km to the southeast that has had 5 large-magnitude eruptions (VEI ≥ 4) in the past 3500 yr, and the Auckland vol-canic field, which is directly under the city. For Lae, the volcanoes contributing the greatest hazard at >10 mm (Witori, Dakataua, Krummel-Garbuna-Welcker, and Lolobau) have, on average, large-magnitude eruption frequencies com-parable to Taupo (400–800 yr) but at least an order of magnitude shorter than the Auckland volcanic field (~11 k.y.; Table S2 [see footnote 1]); however, the volcanoes are more than 350 km from Lae and therefore less likely to deposit the larger thicknesses, leading to a lower probability at these large thicknesses (and a shallower curve) when compared to the Auckland curve.
For those cities with the greatest tephra fall hazard and risk (Manila, Tokyo, and Jakarta), the disaggregated hazard curves show the contribution of indi-vidual volcanoes to the hazard (Fig. 3), identifying those where detailed tephro-stratigraphic studies should be focused to better understand the city’s hazard and risk. Tephra in the Philippines is expected to be dispersed to the east or west, depending on the season (Fig. 8). The 1991 VEI 6 eruption of Pinatubo volcano, 90 km to the northwest of Manila, deposited 4 mm of tephra in Manila due to unusual wind conditions associated with tropical storm Yunya (Ran-tucci, 1994). A 4 mm or greater Pinatubo tephra fall in Manila is estimated to have an average recurrence interval of ~70 k.y.), nearly two orders of magni-tude longer than for the same thickness, or greater, from Taal (~750 yr). For Manila, Taal dominates the hazard because of its proximity (65 km) and rela-tively high eruption frequency: there have been 4 large-magnitude eruptions at Taal in the past 300 yr. This is despite the volcano not being directly upwind from the city (Figs. 3 and 8). Taal tephra falls of more than 1 mm in Manila are simulated to occur on average every 500 yr, around an order of magnitude shorter than for high hazard volcanoes affecting Tokyo or Jakarta. Tokyo’s haz-ard is sourced from 39 different volcanoes, much more than in Manila (n = 7) and Jakarta (n = 19), and the largest number for any city in the region. Tokyo is on the eastern coast of Honshu; given the prevailing wind directions to-
ward the east, this means that it is downwind of many of Honshu’s volcanoes (Figs. 3 and 8). Fujisan volcano, ~100 km west-southwest of the city, is the most likely to produce tephra falls in greater Tokyo. During the 1707 Hoei eruption, Fujisan deposited tephra thicknesses of ~40 mm in central Tokyo (Magill et al., 2015; Miyaji et al., 2011), a >10,000 yr event for our simulations. For Jakarta, the hazard is not dominated by one particular volcano (Fig. 3). Instead, sim-ulations from at least 6 volcanoes (Tangkubanparahu, Perbakti-Gagak, Gede- Pangrango, Salak, Cereme, and Krakatau) produce tephra falls of 1 mm or greater with ARIs of between 7 k.y. and 15 k.y. (Fig. 3). Prevailing wind con-ditions are not conducive to dispersing tephra from surrounding volcanoes toward Jakarta, with winds predominantly blowing due west, or to the south or east at certain times of year; Jakarta is to the north and northwest of most volcanoes (Fig. 8). As a result, only 3% of simulations produce tephra falls in Jakarta, but the hazard is large relative to the rest of the region because of the high eruption frequencies and the numbers and proximity of the volcanoes.
Comparison to Other Studies
There are very few comparable studies of tephra fall hazard in the Asia- Pacific region that take into account multiple volcanoes: Hurst and Smith (2010) produced tephra fall maps for New Zealand at the 500 and 1000 yr ARI, and Miller et al. (2016) provided site-specific hazard information for a small number of cities in the region. We would expect variation between their find-ings and ours because of differences in the approaches, such as the full use of the time-varying wind profile in this study and that of Hurst and Smith (2010), and the inclusion of smaller VEI eruptions in the Hurst and Smith (2010) and Miller et al. (2016) studies. Compared with the findings of Hurst and Smith (2010), our thickness estimates are similarly small in Auckland and Wellington at the 500 year ARI, but at least 12 mm smaller in Auckland (~4 mm versus >16 mm) and ~5 mm smaller (~0.5 mm versus 4–8 mm) in Wellington at the 10 k.y. ARI. The inclusion of smaller eruptions (VEI < 4) in the Hurst and Smith (2010) study are particularly important in Auckland, which is directly above a volcanic field, and may explain some of the disparity. Differences in volcano frequency-magnitude relationships and the maximum eruption volume esti-mated are also likely to be a factor. Hurst and Smith (2010) derived frequency- magnitude relationships from dated tephra records, supplemented with expert judgement and inference from analogue volcanoes in New Zealand to deter-mine annual eruption probabilities and minimum and maximum bounds on likely eruption volumes. This is the preferred method for establishing such re-lationships when required for one or a small number of volcanoes and where well-studied volcanoes are being considered. Such an approach generally acts to reduce the spread in ARIs across multiple volcanoes; however, it cannot be consistently replicated across large numbers of volcanoes or in data-poor areas, which is where the method of Jenkins et al. (2012a) is more valuable. For cities where tephra hazard information is available at the 100, 1000, and 10,000 year ARI in Miller et al. (2016), i.e., Manila, Tokyo, Jakarta, and Port
Research Paper
14Jenkins et al. | Evaluating relative tephra fall hazard and risk in the Asia-Pacific regionGEOSPHERE | Volume 14 | Number 2
Direc�on wind blows towardEast South West North
JAKARTATOKYO
East South WestDirec�on wind blows toward
MANILA
East South West North NorthDirec�on wind blows toward
1000 yr ARI 10,000 yr ARI 1000 yr ARI 10,000 yr ARI 1000 yr ARI 10,000 yr ARI
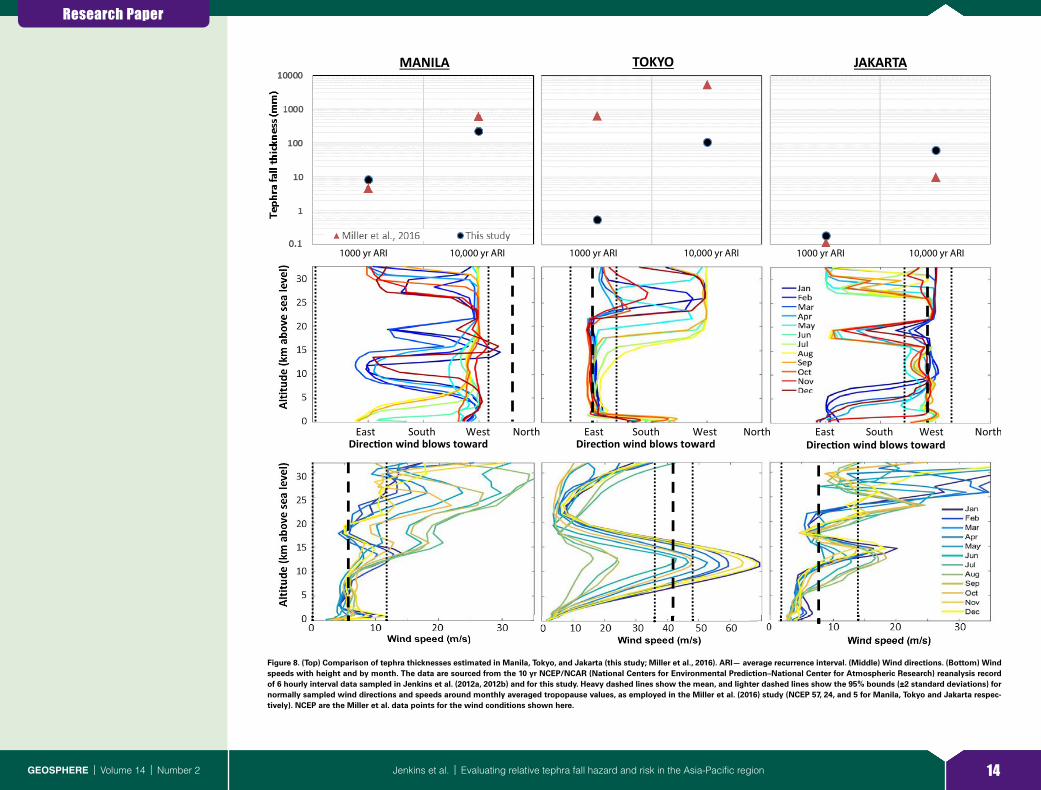
Figure 8. (Top) Comparison of tephra thicknesses estimated in Manila, Tokyo, and Jakarta (this study; Miller et al., 2016). ARI— average recurrence interval. (Middle) Wind directions. (Bottom) Wind speeds with height and by month. The data are sourced from the 10 yr NCEP/NCAR (National Centers for Environmental Prediction–National Center for Atmospheric Research) reanalysis record of 6 hourly interval data sampled in Jenkins et al. (2012a, 2012b) and for this study. Heavy dashed lines show the mean, and lighter dashed lines show the 95% bounds (±2 standard deviations) for normally sampled wind directions and speeds around monthly averaged tropopause values, as employed in the Miller et al. (2016) study (NCEP 57, 24, and 5 for Manila, Tokyo and Jakarta respec-tively). NCEP are the Miller et al. data points for the wind conditions shown here.
Research Paper
15Jenkins et al. | Evaluating relative tephra fall hazard and risk in the Asia-Pacific regionGEOSPHERE | Volume 14 | Number 2
Moresby, we have converted load to thickness assuming a tephra deposit den-sity of 1100 kg/m3 (as in Bear-Crozier et al., 2016). For Port Moresby, the haz-ard is similarly small in both studies (<1 mm at all ARIs). For Manila, Tokyo, and Jakarta, differences in hazard values are not consistently larger or smaller, and we provide more detail in Figure 8 to show the local wind conditions and hazard findings for the two studies. The largest methodological differences between the studies are with the model and wind conditions used to simu-late tephra dispersal. For example, the restricted wind conditions employed in Miller et al. (2016) will result in faster wind speeds and more favorable wind directions around Tokyo at certain times of year (Fig. 8) for depositing more tephra in the city. However, comparison of the volcano frequency-magnitude relationships employed in the two studies suggests that these are the source of most disparity. Both studies have a heavy, but unavoidable, reliance upon the Smithsonian Institution Global Volcanism Program Holocene eruption rec-ord, which is constantly evolving and subject to retrospective modifications that can affect frequency calculations. The two studies both use volcano types, e.g., caldera, large cone, as analogues for volcanoes with few eruption data, but in different ways. This study applies the analogue value only for the ratio between small- and large-magnitude eruptions (with the ARI for an eruption of any size inferred from the volcano eruption record; see Jenkins et al., 2012a), while the Miller et al. (2016) study applies the analogue wholly without using the particular volcano record (which they recognized as a limitation in their study). The main effect of this difference in method is that ARIs for eruptions of VEI 4 or above assigned by Miller et al. (2016) are shorter than those calcu-lated for this study. For example, Hakoneyama and Sanbesan are assigned a large-magnitude ARI of 31 yr in Miller et al. (2016) and ~9500 yr (Hakoneyama) and 31,000 yr (Sanbesan) in our study. Ongoing research in Japan that identi-fies and dates geological deposits will likely increase the estimated frequency (shorten the ARI) in our study. The focus going forward should therefore be on improving the stability of global eruption records and associated estimates of frequency-magnitude relationships through geological studies, interrogation of historical records, and potentially inference from analogous volcanoes and the application of expert judgement. An index that describes how well known an eruption history is at a volcano would also be valuable for better under-standing the uncertainty associated with frequency-magnitude estimates.
The Way Forward
Quantifying volcanic hazard and risk in data-poor environments, e.g., those characterized by incomplete eruption histories, and with limited information on exposure and vulnerability, is challenging. We have identified some key areas of future research that we believe will improve volcanic hazard and risk assessment at the local, national, and regional scale.
Detailed stratigraphic, petrological, geochemical, and historical studies at volcanoes should be conducted, with priority given to those identified as hav-ing the greatest potential to be hazardous to human activities, e.g., through
hazard assessments such as this (Fig. 3), or for volcanoes showing signs of unrest, close to major urban areas, or with morphological evidence of major explosive activity. This information can be used to improve knowledge on pre-vious eruptions and their ages, informing frequency-magnitude relationships and the range of future eruption characteristics such as grain-size distribution and erupted tephra volume.
Typically, frequency-magnitude estimates for one or a small number of volcanoes use the ideally formalized, but more likely subjective, judgement of experts who are very familiar with the volcano, as well as the eruption his-tory, geological record, recent trends in activity, and the greater tectonic and volcanological setting. This allows more detailed, potentially time dependent, analysis of trends such as clustering or cyclic eruption activity at individual volcanoes, and permits shorter term hazard and risk assessments that can be updated if unrest is observed. While clearly this is not feasible for a large number of volcanoes, further improvements in the characterization of frequen-cy-magnitude relationships from incomplete eruption catalogues, particularly those that use innovative statistical methods (e.g., Rougier et al., 2016) and incorporate the tectonic or volcanic setting (e.g., Sheldrake and Caricchi, 2016), will be invaluable.
Increases in the storage and processing capacity of computing resources will, in time, enable probabilistic multisource modeling to use more sophis-ticated (but data and resource intensive) three-dimensional dynamic disper-sal models. This was outside the scope of the current study, which simulated tephra falls from 141,000 eruptions at a resolution of 1 km2 (plus analysis and aggregation by site), but future studies should look to employ a model that uses spatially and temporally varying winds and can better represent the phys-ics behind large-magnitude eruptions. A three-dimensional model would also allow volcanoes more than 500 km from a city to be incorporated, and the tephra hazard through the atmospheric column to be accounted for, i.e., for the benefit of the aviation industry. Balancing the increased data input require-ments of such models with the greater information available in the outputs will be key to identifying the most appropriate way forward in data-poor en-vironments.
For exposure estimates, globally consistent definitions of, for example, city boundaries or what constitutes an urban area, would be valuable for like-for-like comparisons. Ideally a count of the specific assets that are being consid-ered within this area of interest would be carried out through ground surveys aimed at assessing the exposure of such components to volcanic hazards. The resource requirements of such surveys across large areas make this unat-tainable; however, the increased availability of satellite and aerial, e.g., drone, images means that remote surveys and automated image recognition ap-proaches may enable us to gather exposure information more rapidly across large areas. Combining approaches across natural hazards so that one survey can capture information of interest to multiple end users should be a priority.
For the vulnerability component, forensic post-eruption impact assess-ments will continue to supplement the sparse impact data set, and available data should be catalogued in a format that allows us to interrogate across multi-
Research Paper
16Jenkins et al. | Evaluating relative tephra fall hazard and risk in the Asia-Pacific regionGEOSPHERE | Volume 14 | Number 2
ple data sets to infer the level of impact from a given hazard intensity, with appropriate uncertainty bounds. Vulnerability is clearly more complex than can be described in one index and is instead hazard, context, socially, politically, and time dependent. Nevertheless, further efforts to investigate the feasibility of subnational quantitative vulnerability assessments would be useful.
In practice, the level of impact sustained by a tephra fall will also be in-fluenced by human or environmental actions such as vehicles, clean up, and wind remobilizing tephra fall deposits or moisture increasing the loading on structures. Local risk assessments, as yet unpublished, are beginning to ac-count for some of these factors and in time robust regional assessments may be possible.
In an increasingly connected world, an eruption that affects a major city such as Manila, Tokyo, or Jakarta is likely to have global implications. The cascading consequences from volcanic hazards and the effect of mitigation strategies in reducing the impact are valuable future areas of study, although capturing this level of detail in a multivolcano study will likely require large assumptions.
CONCLUSIONS
The Asia-Pacific is one of the world’s most densely populated and vol cani-cally active regions. As a result, many communities are at risk from tephra falls that originate at one or a number of volcanic sources. Quantifying the future hazard and risk from any one volcano requires a detailed understand-ing of the previous eruption history and the exposed assets and their vul-nerability. Unfortunately, data on previous eruptions across the Asia-Pacific region are characterized by varying degrees of availability and quality, and exposure and vulnerability information are only available at a basic level, posing a problem for comprehensive assessment. Here, in order to address the emerging need for hazard and risk information to be available and com-parable across large regions, we have developed a consistent and transpar-ent methodology to assess site-specific tephra fall hazard and risk across the Asia-Pacific region. Probabilistic multivolcano tephra dispersal model results have been combined with estimates of exposure and vulnerability for human populations and infrastructure to calculate relative tephra fall risk for 16 major cities in the region.
There is a clear contrast between the hazard estimated for cities in sub-duction zones relative to those in non–subduction zone settings (Fig. 2), al-though the contribution from hazardous volcanoes in neighboring countries, for example from Japan for Busan, South Korea, can increase a city’s haz-ard, highlighting the importance of considering regional sources of tephra. Manila was found to have the highest tephra fall hazard, followed by Sura-baya, Tokyo, and Jakarta, with simulated tephra falls of 1 mm or greater from VEI ≥ 4 eruptions occurring on average around every 500 yr for Manila and Surabaya and every 1100–1600 yr for Tokyo and Jakarta (Figs. 2 and 3). We are limited by the data available to us at the time of this assessment and the
values in our study should be considered relative and indicative, rather than absolute. It must be stressed that values are in no way intended to replace local hazard or risk assessments, which benefit from unpublished data and local knowledge and expertise. Hazard results taking into account height- and time-varying wind conditions are a significant improvement upon previous studies that applied equal hazard in all directions from the volcanoes in ques-tion, as is considering the contribution from multiple volcanoes in a site-spe-cific hazard assessment. Such advances allow at-risk areas to be compared on a like-for-like basis while accounting for as much information as possi-ble, highlighting areas where further study or support should be focused (e.g., Fig. 3). Future advances should simulate the tephra fall hazard using three-dimensional models that can account for varying wind conditions with distance from the volcano, and time after the eruption; this would permit assessment of the tephra fall hazard through the atmospheric column (im-portant for aviation), as well as the tephra fall hazard from volcanoes more than 500 km from a site.
To move the hazard assessment toward simple estimations of risk, we in-corporated exposure and vulnerability scores. Exposure scores were derived from greater urban area population counts and values describing the capital stock and urban land value in each city (Fig. 4). For vulnerability, we similarly used two indicators: the vulnerability component of the United Nations WRI and the ArCo index that describes technological capability (Fig. 5). Risk scores and ranking, the product of the 3 scores of hazard, at the 1, 10, and 100 mm thickness thresholds, and the exposure and vulnerability, represent the first at-tempt to quantify human and economic tephra fall risk in a consistent fashion across a large region. Tokyo shows high risk scores at all thickness thresholds and for both human and economic scores (Fig. 6), arising predominantly from the very large exposure of populations and economic assets (Fig. 7). Sura-baya, Manila, and Jakarta, by contrast, show high human risk scores but the economic risk scores are comparatively lower because of the smaller value of exposures and economic assets.
For this study, frequency-magnitude estimates were found to be one of the largest sources of uncertainty when compared to previous studies. Regional multisource hazard and risk assessments are thus sensitive to assumptions employed at volcanoes with few recorded eruptions and to revisions in the underlying eruption database. Continuing efforts into improving frequency- magnitude estimates where data are scarce and unreliable, and improving the accuracy and completeness of eruption records through geological and historical studies will improve the robustness of hazard estimates in future iter-ations. The limitations of remotely derived estimates of exposure and national level vulnerability data are equally as important for the calculation of risk, and advances are needed on all three fronts (hazard, exposure, and vulnerability) in order to improve risk assessments. Nevertheless, the transparent and con-sistent hazard and risk ranking methodology presented here uses all currently available data to provide an informed comparison of tephra fall hazard and risk for city populations across the Asia-Pacific region and will be useful for agencies requiring such large-scale information.
Research Paper
17Jenkins et al. | Evaluating relative tephra fall hazard and risk in the Asia-Pacific regionGEOSPHERE | Volume 14 | Number 2
APPENDIX. LIST OF OFFICIAL VOLCANO ORGANIZATIONS FOR THE COUNTRIES REPRESENTED IN THIS STUDY
The relative tephra fall hazard and risk information provided by this study is in no way in-tended to replace volcanic hazard and risk information provided by a country’s official institutions. Our study addresses a need from international organizations for like-for-like comparison of tephra fall hazard and risk at the regional scale. For local to national level assessments, tephra fall hazard and risk assessments should always be sought from the relevant country’s scientists.
We here provide a list of the official organizations responsible for volcanic studies in each of the countries represented in our study:
• Australia—Geoscience Australia, http:// www .ga .gov .au/;• Eastern China—the China Seismological Bureau (also known as the China Earthquake
Admini stration), http:// en .igl .earthquake .cn/;• Indonesia—Center for Volcanology and Geological Hazard Mitigation, http:// www .vsi
.esdm .go .id/;• Japan—Japan Meteorological Agency (with regard to tephra fall), http:// www .jma .go .jp /jma
/indexe .html;• New Zealand—GNS Science, https:// www .gns .cri .nz/;• Papua New Guinea—Rabaul Volcanological Observatory, P.O. Box 386, Rabaul, Papua
New Guinea;• Philippines—Philippine Institute of Volcanology and Seismology, http:// www .phivolcs .dost
.gov .ph/;• South Korea—Jeju Volcanological Institute in collaboration with the Korea Institute of Geo-
science and Mineral Resources, http:// www .kigam .re .kr/;• Taiwan—Taiwan Volcano Observatory, http:// tec .earth .sinica .edu .tw /TVO/.
ACKNOWLEDGMENTS
We thank John McAneney, Chris Newhall, and Antonio Costa for helpful reviews that helped to improve an early version of this manuscript. We also thank Victoria Miller and Adele Bear-Crozier, with whom we had valuable discussions on the disparity in hazard values between our two stud-ies. We are indebted to two anonymous reviewers, Bob Tilling, Robert Muir-Wood, and the editors for insightful comments that helped to improve the manuscript. We also thank Bob Tilling for his invitation to submit this research to Geosphere, and for his support and enthusiasm.
REFERENCES CITED
Alexander, D.E., 2000, Confronting Catastrophe: New Perspectives on Natural Disasters: New York, Dunedin Academic Press Ltd., 288 p.
Archibugi, D., and Coco, A., 2004, A new indicator of technological capabilities for developed and developing countries (ArCo): World Development, v. 32, p. 629–654, https:// doi .org /10 .1016 /j .worlddev .2003 .10 .008 .
Aspinall, W.P., and Blong, R., 2015, Volcanic risk assessment, in Sigurdsson, H., et al., eds., Ency-clopedia of Volcanoes (second edition): San Diego, California, Academic Press, p. 1215–1231, https:// doi .org /10 .1016 /B978 -0 -12 -385938 -9 .00070 -5 .
Aspinall, W.P., Auker, M.R., Hincks, T.K., Mahony, S.H., Pooley, J., Nadim, F., Syre, E., Sparks, R.S.J., and Bank, T.W., 2011, Volcano Hazard and Exposure in Track II Countries and Risk Mitigation Measures—GFDRR Volcano Risk Study: Bristol University Cabot Institute and NGI Norway for the World Bank, NGI Report 20100806, 309 p.
Auker, M.R., et al., 2015, Development of a new global Volcanic Hazard Index (VHI), in Loughlin, S.C., et al., eds., Global Volcanic Hazards and Risk: Cambridge, UK, Cambridge University Press, p. 349–358, https:// doi .org /10 .1017 /CBO9781316276273 .024 .
Bear-Crozier, A., Miller, V., Newey, V., Horspool, N., and Weber, R., 2016, Probabilistic Volcanic Ash Hazard Analysis (PVAHA) I: Development of the VAPAH tool for emulating multi-scale volcanic ash fall analysis: Journal of Applied Volcanology, v. 5, p. 1, https:// doi .org /10 .1186 /s13617 -016 -0043 -4 .
Blong, R.J., 1984, Volcanic Hazards: A Sourcebook on the Effects of Eruptions: North Ryde, Aca-demic Press Australia, 424 p.
Brown, S.K., Sparks, R.S.J., and Jenkins, S.F., 2015, Global distribution of volcanic threat, in Lough-lin, S.C., et al., eds., Global Volcanic Hazards and Risk: Cambridge, UK, Cambridge University Press, p. 359–370, https:// doi .org /10 .1017 /CBO9781316276273 .025 .
Carey, S., and Sigurdsson, H., 1989, The intensity of Plinian eruptions: Bulletin of Volcanology, v. 51, p. 28–40, https:// doi .org /10 .1007 /BF01086759 .
Center for International Earth Science Information Network, 2016, CIESIN-Columbia University. Gridded Population of the World, Version 4 (GPWv4): Population Count Adjusted to Match 2015 Revision of UN WPP Country Totals: Palisades, New York, NASA Socioeconomic Data and Applications Center (SEDAC).
Costa, A., Folch, A., and Macedonio, G., 2013, Density-driven transport in the umbrella region of volcanic clouds: Implications for tephra dispersion models: Geophysical Research Letters, v. 40, p. 4823–4827, https:// doi .org /10 .1002 /grl .50942 .
De Bono, A., and Mora, M.G., 2014, A global exposure model for disaster risk assessment: International Journal of Disaster Risk Reduction, v. 10, p. 442–461, https:// doi .org /10 .1016 /j .ijdrr .2014 .05 .008 .
Dilley, M., Chen, R.S., Deichmann, U., Lerner-Lam, A.L., Arnold, M., Agwe, J., Buys, P., Kjevstad, O., Lyon, B., and Yetman, G., 2005, Natural disaster hotspots: A global risk analysis: Washington, D.C., World Bank Hazard Management Unit, 148 p., http:// documents .worldbank .org /curated /en /621711468175150317 /Natural -disaster -hotspots -A -global -risk -analysis.
Ewert, J.W., 2007, System for ranking relative threats of U.S. volcanoes: Natural Hazards Review, v. 8, p. 112–124, https:// doi .org /10 .1061 / (ASCE)1527 -6988 (2007)8: 4 (112) .
Fournier d’Albe, E.M., 1979, Objectives of volcanic monitoring and prediction: Journal of the Geo-logical Society [London], v. 136, p. 321–326, https:// doi .org /10 .1144 /gsjgs .136 .3 .0321 .
Global Volcanism Program, 2013, Volcanoes of the World, v. 4.5.2: Washington, D.C., Smithsonian Institution, http:// dx .doi .org /10 .5479 /si .GVP .VOTW4 -2013 .
Hayes, J.L., Wilson, T.M., and Magill, C., 2015, Tephra fall clean-up in urban environments: Jour-nal of Volcanology and Geothermal Research, v. 304, p. 359–377, https:// doi .org /10 .1016 /j .jvolgeores .2015 .09 .014 .
Hoblitt, R.P., Miller, C.D., and Scott, W.E., 1987, Volcano Hazards with Regard to Siting Nuclear-Power Plants in the Pacific Northwest: U.S. Geological Survey Open-File Report 87-297, 196 p.
Holmberg, K., and Small, C., 2016, Quantifying populations in proximity to potentially active vol-canoes [abstract], in Proceedings, Cities on Volcanoes 9, Puerto Varas, Chile.
Hurst, A.W., 1994, ASHFALL, a computer program for estimating volcanic ash fallout: Report and users guide: Lower Hutt, New Zealand, Institute of Geological & Nuclear Sciences, 22 p.
Hurst, A.W., and Smith, W., 2004, A Monte Carlo methodology for modelling ashfall hazards: Journal of Volcanology and Geothermal Research, v. 138, p. 393–403, https:// doi .org /10 .1016 /j .jvolgeores .2004 .08 .001 .
Hurst, A.W., and Smith, W., 2010, Volcanic ashfall in New Zealand—Probabilistic hazard modelling for multiple sources: New Zealand Journal of Geology and Geophysics, v. 53, p. 1–14, https:// doi .org /10 .1080 /00288301003631129 .
International Air Transport Association, 2010, Volcano Crisis Cost Airlines $1.7 Billion in Revenue—IATA Urges Measures to Mitigate Impact: International Air Transport Association Press Re-lease no. 15, 21 April 2010.
Jenkins, S., and Haynes, K., 2011, Volcanic eruption, in Wisner, B., et al., eds., Handbook of Natural Hazards and Disaster Risk Reduction and Management: Abingdon, Virginia, Routledge, p. 880.
Jenkins, S., Magill, C., McAneney, J., and Blong, R., 2012a, Regional ash fall hazard I: A probabi-listic assessment methodology: Bulletin of Volcanology, v. 74, p. 1699–1712, https:// doi .org /10 .1007 /s00445 -012 -0627 -8 .
Jenkins, S., McAneney, J., Magill, C., and Blong, R., 2012b, Regional ash fall hazard II: Asia-Pacific modelling results and implications: Bulletin of Volcanology, v. 74, p. 1713–1727, https:// doi .org /10 .1007 /s00445 -012 -0628 -7 .
Jenkins, S.F., 2009, Probabilistic tephra fall hazard and risk assessment [Ph.D. thesis]: Sydney, New South Wales, Macquarie University, 209 p.
Jenkins, S.F., 2010, Observations of the explosive Eyjafjallajökull eruption: Cambridge, Cambridge Architectural Research Ltd., 10 p., http:// www .carltd .com /sites /carwebsite /files /Observations %20of %20the %20Eyjafjallajokull %20Eruption .pdf.
Jenkins, S.F., Magill, C.R., and McAneney, K.J., 2007, Multi-stage volcanic events: A statistical in-vestigation: Journal of Volcanology and Geothermal Research, v. 161, p. 275–288, https:// doi .org /10 .1016 /j .jvolgeores .2006 .12 .005 .
Jenkins, S.F., Wilson, T.M., Magill, C.R., Miller, V., Stewart, C., Blong, R., Marzocchi, W., Boulton, M., Bonadonna, C., and Costa, A., 2015, Volcanic ash fall hazard and risk, in Loughlin, S.C., et al., eds., Global Volcanic Hazards and Risk: Cambridge, Cambridge University Press, p. 173–222, https:// doi .org /10 .1017 /CBO9781316276273 .005.
Kalnay, E., Kanamitsu, M., Kistler, R., Collins, W., Deaven, D., Gandin, L., Iredell, M., Saha, S., White, G., and Woollen, J., 1996, The NCEP/NCAR 40-year reanalysis project: American Meteoro-
Research Paper
18Jenkins et al. | Evaluating relative tephra fall hazard and risk in the Asia-Pacific regionGEOSPHERE | Volume 14 | Number 2
logical Society Bulletin, v. 77, p. 437–471, https:// doi .org /10 .1175 /1520 -0477 (1996)077 <0437: TNYRP>2 .0 .CO;2 .
Machida, H., and Arai, F., 2003, Atlas of tephra in and around Japan: Tokyo, University of Tokyo Press, 336 p. (in Japanese).
Magill, C., Mannen, K., Connor, L., Bonadonna, C., and Connor, C., 2015, Simulating a multi-phase tephra fall event: Inversion modelling for the 1707 Hoei eruption of Mount Fuji, Japan: Bulletin of Volcanology, v. 77, no. 81, 18 p., https:// doi .org /10 .1007 /s00445 -015 -0967 -2 .
Magill, C.R., Hurst, A.W., Hunter, L.J., and Blong, R.J., 2006, Probabilistic tephra fall simulation for the Auckland Region, New Zealand: Journal of Volcanology and Geothermal Research, v. 153, p. 370–386, https:// doi .org /10 .1016 /j .jvolgeores .2005 .12 .002 .
Magill, C.R., Wilson, T.M., and Okada, T., 2013, Observations of tephra fall impacts from the 2011 Shinmoedake eruption, Japan: Earth, Planets, and Space, v. 65, p. 677–698, https:// doi .org /10 .5047 /eps .2013 .05 .010 .
Miller, V., Bear-Crozier, A.N., Newey, V., Horspool, N., and Weber, R., 2016, Probabilistic Volcanic Ash Hazard Analysis (PVAHA) II: Assessment of the Asia-Pacific region using VAPAH: Journal of Applied Volcanology, v. 5, p. 4, https:// doi .org /10 .1186 /s13617 -016 -0044 -3 .
Miyaji, N., Kan’no, A., Kanamaru, T., and Mannen, K., 2011, High-resolution reconstruction of the Hoei eruption (AD 1707) of Fuji volcano, Japan: Journal of Volcanology and Geothermal Re-search, v. 207, p. 113–129, https:// doi .org /10 .1016 /j .jvolgeores .2011 .06 .013 .
Munich-Re, 2004, Megacities – Megarisks: Trends and challenges for insurance and risk manage-ment: Munich, Munich Re Group, 83 p., http:// www .preventionweb .net /files /646 _10363 .pdf.
Naranjo, J.L., Sigurdsson, H., Carey, S.N., and Fritz, W., 1986, Eruption of the Nevado Del Ruiz Volcano, Colombia, on 13 November 1985: Tephra fall and lahars: Science, v. 233, no. 4767, p. 961–963, https:// doi .org /10 .1126 /science .233 .4767 .961 .
Newhall, C., and Self, S., 1982, The Volcanic Explosivity Index (VEI)—An estimate of explosive magnitude for historical volcanism: Journal of Geophysical Research, v. 87, p. 1231–1238, https:// doi .org /10 .1029 /JC087iC02p01231 .
Newhall, C.G., and Hoblitt, R.P., 2002, Constructing event trees for volcanic crises: Bulletin of Vol-canology, v. 64, p. 3–20, https:// doi .org /10 .1007 /s004450100173 .
Pyle, D.M., 1995, Reduction of urban hazards: Nature, v. 378, no. 6553, p. 134–135, https:// doi .org /10 .1038 /378134a0 .
Rantucci, G., 1994, Geological Disasters in the Philippines; The July 1990 Earthquake and the June 1991 Eruption of Mount Pinatubo: Description, Effects and Lessons Learned: Rome, Presidenza del Consiglio Dei Ministri, Dipartimento Per L’Informazione e L’Editoria, 154 p.
Rougier, J., Sparks, S.R., and Cashman, K.V., 2016, Global recording rates for large eruptions: Jour-nal of Applied Volcanology, v. 5, p. 11, https:// doi .org /10 .1186 /s13617 -016 -0051 -4 .
Shane, P., and Hoverd, J., 2002, Distal record of multi-sourced tephra in Onepoto Basin, Auckland, New Zealand: Implications for volcanic chronology, frequency and hazards: Bulletin of Vol-canology, v. 64, p. 441–454, https:// doi .org /10 .1007 /s00445 -002 -0217 -2 .
Sheldrake, T., and Caricchi, L., 2016, Regional variability in the frequency and magnitude of large explosive volcanic eruptions: Geology, v. 45, p. 111–114, https:// doi .org /10 .1130 /G38372 .1 .
Simkin, T., and Siebert, L., 2000, Earth’s volcanoes and eruptions: An overview, in Sigurdsson, H., et al., eds., Encyclopedia of Volcanoes: San Diego, Academic Press, p. 249-261.
Small, C., and Naumann, T., 2001, The global distribution of human population and recent vol-canism: Environmental Hazards, v. 3, p. 93–109, https:// doi .org /10 .3763 /ehaz .2001 .0309 .
Sparks, R.S.J., Bursik, M.I., Carey, S.N., Gilbert, J.S., Glaze, L., Sigurdsson, H., and Woods, A.W., 1997, Volcanic Plumes: New York, John Wiley and Sons, 574 p.
United Nations Development Programme, 2015, Human Development Reports: Human Develop-ment Index (HDI): United Nations Development Programme Human Development Report Of-fice, http:// hdr .undp .org /en /composite /HDI (accessed 9 December 2016).
United Nations International Strategy for Disaster Reduction, 2007, Hyogo Framework for Action (HFA) 2005–2015: Building the resilience of nations and communities to disasters: United Nations International Strategy for Disaster Reduction, 25 p., https:// www .unisdr .org /we /coordinate /hfa.
United Nations International Strategy for Disaster Reduction, 2009, UNISDR Terminology on Disaster Risk Reduction: Geneva, Switzerland, United Nations International Strategy for Disaster Reduc-tion (UNISDR), p. 26, http:// www .unisdr .org /files /7817 _UNISDRTerminologyEnglish .pdf.
United Nations Statistics Division, 2016, City population by sex, city and city type: United Na-tions Statistics Division, 1039 p., http:// data .un .org /Data .aspx ?d =POP &f =tableCode %3A240 (accessed December 2016).
Volentik, A.C.M., Bonadonna, C., Connor, C.B., Connor, L.J., and Rosi, M., 2010, Modeling tephra dispersal in absence of wind: Insights from the climactic phase of the 2450 BP Plinian erup-tion of Pululagua volcano (Ecuador): Journal of Volcanology and Geothermal Research, v. 193, p. 117–136, https:// doi .org /10 .1016 /j .jvolgeores .2010 .03 .011 .
Wadge, G., and Aspinall, W.P., 2014, A review of volcanic hazard and risk-assessment praxis at the Soufrière Hills Volcano, Montserrat from 1997 to 2011, in Wadge, E., et al., eds., The Eruption of Soufrière Hills Volcano, Montserrat from 2000 to 2010: Geological Society of London Memoir 39, p. 439–456, https:// doi .org /10 .1144 /M39 .24 .
Walker, G., Wilson, L., and Bowell, E., 1971, Explosive volcanic eruptions—I. The rate of fall of pyroclasts: Royal Astronomical Society Geophysical Journal, v. 22, p. 377–383, https:// doi .org /10 .1111 /j .1365 -246X .1971 .tb03607 .x .
Wardman, J.B., Wilson, T.M., Bodger, P.S., Cole, J.W., and Johnston, D.M., 2012, Investigating the electrical conductivity of volcanic ash and its effect on HV power systems: Physics and Chem-istry of the Earth, v. 45–46, p. 128–145, https:// doi .org /10 .1016 /j .pce .2011 .09 .003 .
Welle, T., and Birkmann, J., 2015, The World Risk Index—An approach to assess risk and vulner-ability on a global scale: Journal of Extreme Events, v. 2, 1550003, https:// doi .org /10 .1142 /S2345737615500037 .
Wilson, T.M., Stewart, C., Sword-Daniels, V., Leonard, G.S., Johnston, D.M., Cole, J.W., Wardman, J., Wilson, G., and Barnard, S.T., 2012, Volcanic ash impacts on critical infrastructure: Physics and Chemistry of the Earth, v. 45–46, p. 5–23, https:// doi .org /10 .1016 /j .pce .2011 .06 .006 .
Yokoyama, I., Tilling, R.I., and Scarpa, R., 1984, International mobile early-warning system(s) for volcanic eruptions and related seismic activities: Paris, United Nations Educational, Scientific and Cultural Organization FP/2106-82-01(2286), 102 p.
Zawalna-Geer, A., Lindsay, J.M., Davies, S., Augustinus, P., and Davies, S., 2016, Extracting a pri-mary Holocene crytoptephra record from Pupuke maar sediments, Auckland, New Zealand: Journal of Quaternary Science, v. 31, p. 442–457, https:// doi .org /10 .1002 /jqs .2866 .
Zuccaro, G., Leone, M.F., Del Cogliano, D., and Sgroi, A., 2013, Economic impact of explosive vol-canic eruptions: A simulation-based assessment model applied to Campania region vol canoes: Journal of Volcanology and Geothermal Research, v. 266, p. 1–15, https:// doi .org /10 .1016 /j .jvolgeores .2013 .09 .002 .