evaluating the spillway capacity of the morning glory ... · the preliminary spillway design by...
TRANSCRIPT
1
Evaluating the Spillway Capacity of the Morning Glory
Spillway at Harriman Dam
Damian M. Gomez, P.E., CFM, Gomez and Sullivan Engineers, D.P.C.
Dan Gessler, Ph.D., P.E., D.WRE, Alden Research Laboratory, Inc.
Justin (Jud) Donaghy, P.E., Great River Hydro, LLC.
Abstract-- Harriman Dam is a 217.5 foot high earthen hydropower dam which was built in 1924 and has
since been raised three times. Excess inflows to the dam are discharged through a morning glory spillway with an
outside diameter of approximately 160 feet transitioning into a 22.5 foot diameter drop shaft and discharge tunnel.
Following recent high flows produced by Hurricane Irene, questions were raised regarding the discharge
capacity of the morning glory spillway. Prior to construction, the hydraulic capacity of the spillway design had been
evaluated through a theoretical analysis and a series of scale model tests performed at the Alden Hydraulic
Laboratory and at a rebuilt crib dam on Sadawga Brook, near the dam site. The scaling and design of morning glory
spillways was novel at the time resulting in the 1924 ASCE Journal Article (paper 1551). In the current study,
Gomez and Sullivan Engineers performed an updated theoretical analysis of the spillway capacity, including
development of a tailwater rating curve for evaluating tailwater impacts on discharge capacity. A detailed three
dimensional computation fluid dynamics (CFD) model was also developed by Gomez and Sullivan, for analysis of
the spillway capacity, with a peer review performed by Alden Research Laboratory.
Analysis of the Harriman spillway revealed a number of unique characteristics of the hydraulic response.
The Harriman spillway was found to transition directly from weir control at the crest to full pipe flow, without an
orifice condition occurring in the inlet throat. Additionally, the spillway was found to exhibit sub-atmospheric
pressures within the drop shaft under high flow conditions, leading to a siphon-like condition in the spillway.
This paper will discuss the evolution (1924 to 2017) of the hydraulic analyses of the spillway capacity
identifying similarities and differences between the resulting rating curves. One area of focus will be the presence
of sub-atmospheric pressures within the drop shaft and the implications on computed capacity. The advantages and
disadvantages of physical and computer based models will also be discussed in the context of the study.
I. INTRODUCTION
The Harriman Dam in Whitingham, Vermont is owned by Great River Hydro, LLC., and has a morning
glory spillway. Following recent high flows produced by Hurricane Irene, questions were raised regarding the
spillway discharge capacity.
Prior to construction in 1924, the hydraulic capacity of the spillway design had been evaluated through a
theoretical analysis and a series of scale model tests. These physical model studies were performed both at the
Alden Hydraulic Laboratory, in Holden, Massachusetts, and at a rebuilt crib dam on Sadawga Brook, near the dam
site. The scaling and design of morning glory spillways was novel at the time and resulted in the 1924 ASCE
Journal Article (paper 1551).
In the current study, Gomez and Sullivan Engineers, DPC performed an updated theoretical analysis of the
spillway capacity, including development of a tailwater rating curve for evaluating tailwater impacts on discharge
capacity. A detailed three dimensional computation fluid dynamics (CFD) model was also developed by Gomez and
Sullivan, for analysis of the spillway capacity. Peer review of this CFD model was performed by Alden Research
Laboratory.
Harriman Dam (formerly known as Davis Bridge Dam) is an approximately 1,250 foot long, 217.5 foot
high earthen embankment crossing the Deerfield River. The dam retains the nine mile long, 2,184 acre Harriman
Reservoir. With a drainage area of 184 square miles and a usable storage capacity of approximately 116,000 acre-
feet, the reservoir is the largest body of water entirely within the state of Vermont. The reservoir was constructed in
2
1924 to create an impoundment for a new hydro-electric power plant. In addition, the stored water would serve to
increase the dry season flow in the river for other hydroelectric power plants on the Deerfield River. Flows from the
reservoir are discharged either through the penstocks to the powerhouse, a minimum flow bypass pipe, or a morning
glory type spillway.
The morning glory spillway has a circular inlet with an outer crest diameter of approximately 160 feet, the spillway
transitions from the inlet to 22.5 foot diameter drop shaft, transits a 55 foot radius bend into a horseshoe shaped,
concrete lined tunnel which runs through bedrock below the left abutment of the dam back to the Deerfield River.
Flashboards, six feet high, are generally placed on top of the spillway crest from spring until fall using a stanchion
beam arrangement supported between piers on the spillway crest. The flashboards and stanchion beams are intended
to be removed prior to extreme flow events via the walkway over the spillway piers.
The valley at the dam site is so narrow and the valley walls so steep that the crest of the dam is about 50
feet shorter than the extreme base width of about 1300 feet. The hills surrounding the dam rise well above the dam
crest, with a low point in the surrounding hills that is 100 feet above the dam crest. Therefore, the nature of the
topography precluded construction of a spillway at the low divide in the surrounding hills, which was considered the
most economical spillway construction method at the time (1922). Typically, a masonry overflow section at one end
of the dam would be constructed for this case; however, the hydraulic problems associated with a re-entrant type
spillway could not be solved with enough confidence, leading to the need for a large amount of conservatism in the
design. The resulting excavation for the re-entrant type of spillway was very expensive, so the morning glory
spillway was investigated.
Cost estimates showed that the morning glory spillway would be effective and the plan was adopted
contingent on the results of a 1:36 scale model test. Prior to construction of the dam and the spillway, a theoretical
analysis of the spillway capacity was performed, as well as two series of model tests in order to verify that analysis.
A 1924 ASCE Journal Article (paper 1551) on the evaluation of the Harriman spillway capacity was written
documenting the innovative design and analysis; while not the first use of the morning glory spillway type, few had
been placed into operation prior to the construction of Harriman Dam. As part of the evaluation of the Probable
Maximum Precipitation (PMP) and Probable Maximum Flood (PMF) for the dam (completed in 1988), a Board of
Consultants (BOC) re-evaluated the capacity of the spillway under extremely high flows, where friction in the drop
shaft and tunnel would be expected to control discharge capacity.
During a 2013 inspection of the Harriman spillway tunnel, it was discovered that there was some damage to
the tunnel lining. Upon further review, it was concluded that the damage to the tunnel lining was likely a result of the
extreme discharges that occurred during Tropical Storm Irene, which produced an estimated peak outflow of 22,150
cfs through the spillway. In order to further investigate the cause of the damage to the tunnel lining and the likelihood
of future damage, the owner requested that a re-evaluation of the discharge capacity of the Harriman morning glory
spillway be performed.
In late 2014 and early 2015, Gomez and Sullivan Engineers, DPC (Gomez and Sullivan) performed an
independent theoretical analysis of the capacity of the morning glory spillway as well as a computational fluid
dynamics (CFD) model of the spillway under various headwater elevations to confirm the existing rating curve or
develop an updated rating curve. Following Gomez and Sullivan’s initial analysis, Alden Research Laboratory
(Alden) performed a peer review of the CFD model.
II. 1922 PRELIMINARY DESIGN
The preliminary spillway design by J.G. White Engineering Corporation was for 27,000 cfs with a water
height of 7 feet on the spillway crest. The spillway crest was assumed to have a clear crest with no piers. The final
design has 16 crest piers and a water depth of 8 feet over the crest. The crest piers allow the use of flashboards to
increase the headwater elevation and usable storage of the reservoir while maintaining a higher discharge capacity of
the spillway.
The horseshoe shaped diversion tunnel has an area and hydraulic radius that are approximately the same as
that of a 22.5 feet diameter tunnel, so a vertical drop shaft 22.5 feet in diameter was planned. The diameter of the
drop shaft was tapered from the 80 foot radius weir crest to 22.5 feet as soon as the water could be accelerated to the

3
required velocity. The connection to the diversion tunnel was with a 90 degree elbow with a bend radius of 55 feet
(about 2.5 pipe diameters).
The required velocity in the drop shaft is 68 ft/s to achieve a discharge of 27,000 cfs. A drop of 72 feet
occurring over about 2.12 seconds is required to get to the speed. The nappe shape of the free fall crest in the
original design was parabolic and with 7 feet of head the maximum velocity was 17.5 ft/s with a unit discharge of 74
cfs. The resulting crest radius was 58 feet. The time required for the water to cover the distance from the crest to
the circular drop shaft in this design is 3 seconds. Because this differs from the 2.12 seconds, the lip of the spillway
was redesigned to be flatter than parabolic. The slope of the flat section was designed such that rate of acceleration
matched the rate of convergence of the flow, giving a constant depth of water on the downward slope. Figure 1
shows a drawing of the spillway model.

4
Figure 1: Drawing of Spillway Model. (Kurtz)
1
2
3
4
5
6 7
5
The spillway can be described as having seven sections:
1) A circular converging weir section with a gradual slope such that a constant water depth is maintained as
the water accelerates.
2) The section containing the open free falling jet. The surface of the spillway curves to follow the lower
nappe of a free falling converging circular jet until the jet closes on itself.
3) The section containing the closed portion of the free falling jet beginning at the lower end of the open
portion and going to the top of the circular shaft.
4) A closed cylindrical drop shaft.
5) The elbow section.
6) A closed section on the bend forming the transition to the horseshoe shaped tunnel.
7) Straight horseshoe tunnel.
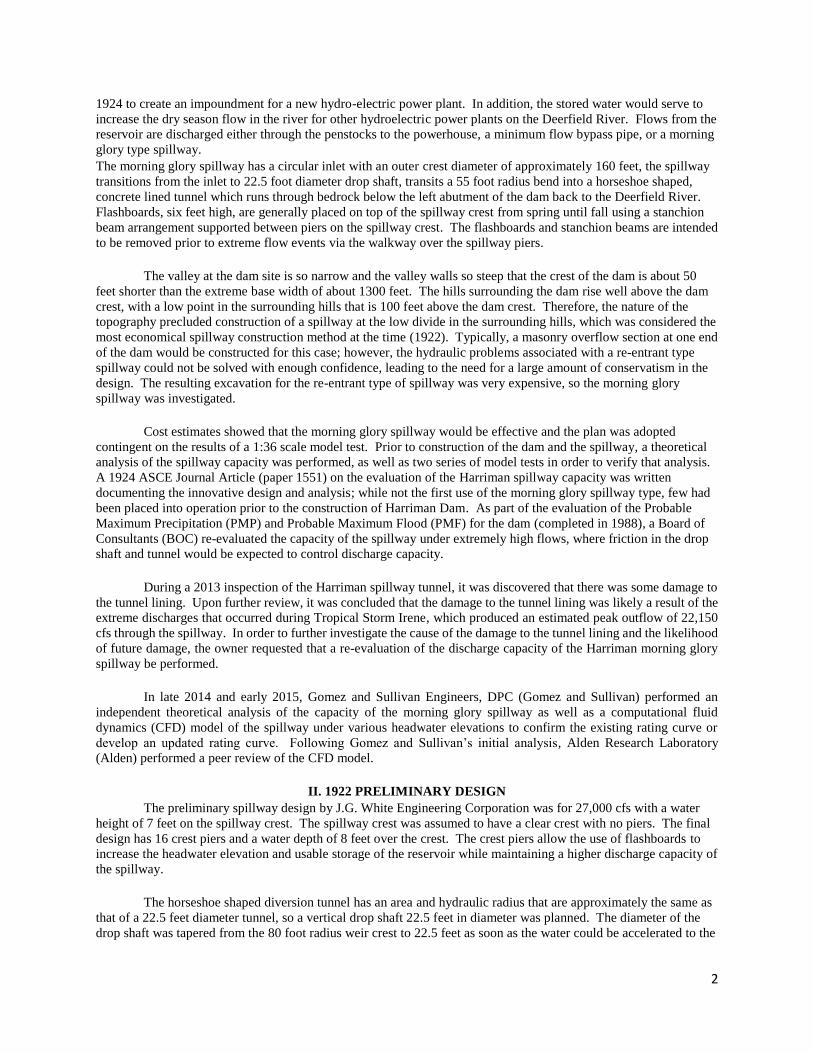
With the basic design features in mind, the design moved to a cut and try approach to discharge water with
as little head loss as possible. Based on previous experimental work for broad crested weirs, it was determined that
a weir length of 502 feet was required to maintain a design discharge of 27,000 cfs with a crest depth of 7 feet, or a
radius of 80 feet. Utilizing formulae from the contemporary literature, the headloss at the lip was computed and the
depth and velocity on the horizontal spillway section was determined to be 4.48 feet and 12 ft/s respectively. This
flow depth holds until the shaft radius is 66 feet where a free falling open jet occurs. Figure 2 shows the spillway
and computed water surface elevation. The remaining sections were designed to minimize head loss within the
constraints of the existing tunnel.
Figure 2: Shaft Spillway and General Dimensions. (Kurtz)
The location of the spillway near the southeastern bank of the reservoir is such that a spiral flow entering
the shaft is created; the location of the inlet is such that flow entering the spillway along the southeastern rim of the
weir approaches the weir tangentially rather than radially. Around part of the shaft the channel is only
approximately 12 feet deep. Based on simplified calculations, it was estimated that a tangential velocity of about 5
ft/s exists at the spillway entrance. This was observed in subsequent physical modeling.
6
III. 1922 FINAL DESIGN
A 1:36 Froude scale model study was constructed at Alden Research Laboratory (Holden, MA) in 1922 to
evaluate the spillway performance and capacity. The model scale was based on model costs and the available flow
to run the model. Flow was diverted from a stream through a flume to the model. The tunnel section of the spillway
was shortened from 26.3 feet for an undistorted model to 17 feet for the actual model. This was done because it was
shown that the friction loss in the tunnel was over represented even in a smooth tunnel, therefore the tunnel was
shortened to compensate. The tunnel was made of galvanized iron and the remaining portions of the spillway were
made of well varnished wood. The surface of the spiral approach channel was roughened using sand thrown into the
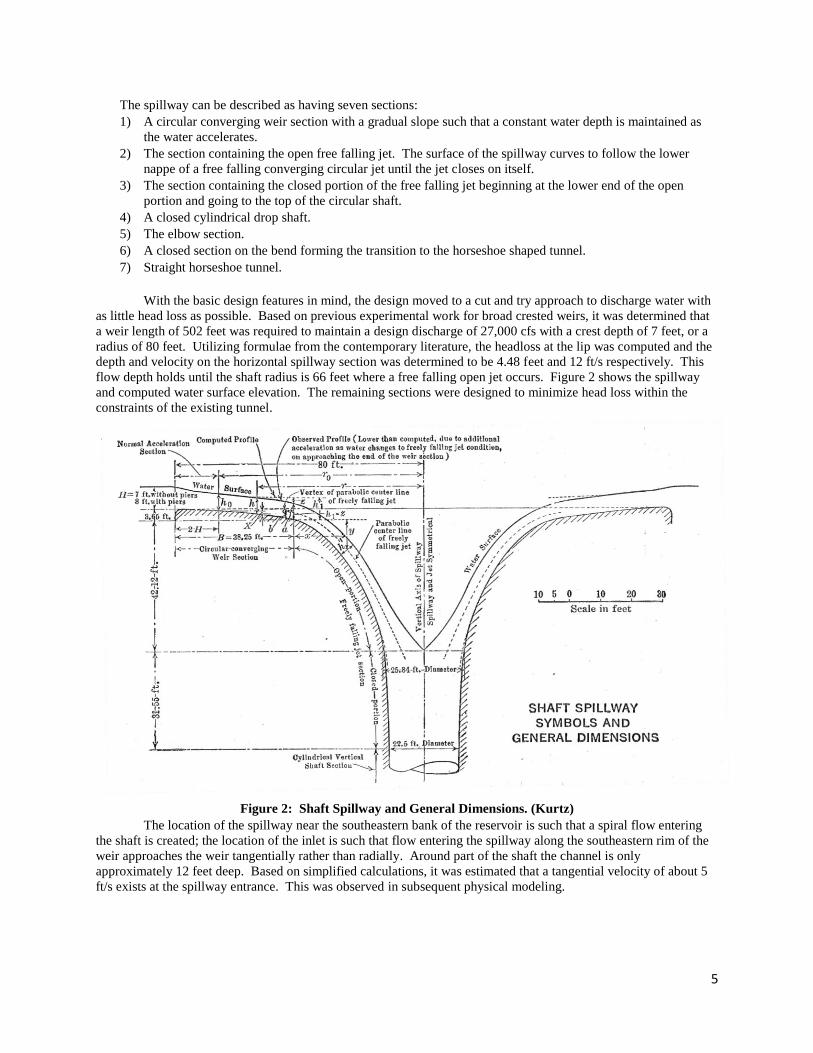
painted surface to better approximate the roughness of the excavated channel surface. Figure 3 shows a plan view of
the model and Figure 4 shows the finished model. Sixteen flashboard piers were later added to the final design and
physical model, which were not included in the preliminary design.
Figure 3: Finished Model at Alden Research Laboratory. (Kurtz)

7
Figure 4: Photograph of Alden model. (Kurtz)
IV. MODEL TESTING
Initial physical model testing was completed on June 7, 1922. The measured capacity at the design head
(2.33 inches in the model, 7 feet prototype) was about 96% of the expected capacity. The maximum flow (vertical
orifice flow) occurred at a head of 2.89 inches (8.67 feet) with a discharge of 32,000 cfs. Where the jet closed in on
itself a small disturbed ‘mushroom’ of water was observed as the open jet converged on itself (between sections 2
and 3). This was thought to be the result of destruction of the horizontal velocity component. The model report
notes that the jet of water coming from the end of the tunnel showed very little air entrainment, having negligible
effect on capacity. We now know that the model was too small to include the effects of air entrainment. Accurately
modeling the effects of air entrainment requires a model scale of 1:10 to 1:15.
The piezometer tube located at the top of the cylindrical section showed a negative pressure of 9.76 to
13.18 inches of water column when the spillway was near or at capacity. Therefore, four additional piezometers
were installed to better understand the low pressure region. Based on the pressure measurements, a study was made
of the natural Venturi tube effect of a free falling water jet. The computed jet diameter varied from 6.94 to 6.40
inches as compared to the shaft diameter of 7.5 inches, explaining the occurrence of negative pressures. On June 9,
1922 a confirmatory set of tests was completed at Alden Research Laboratory.
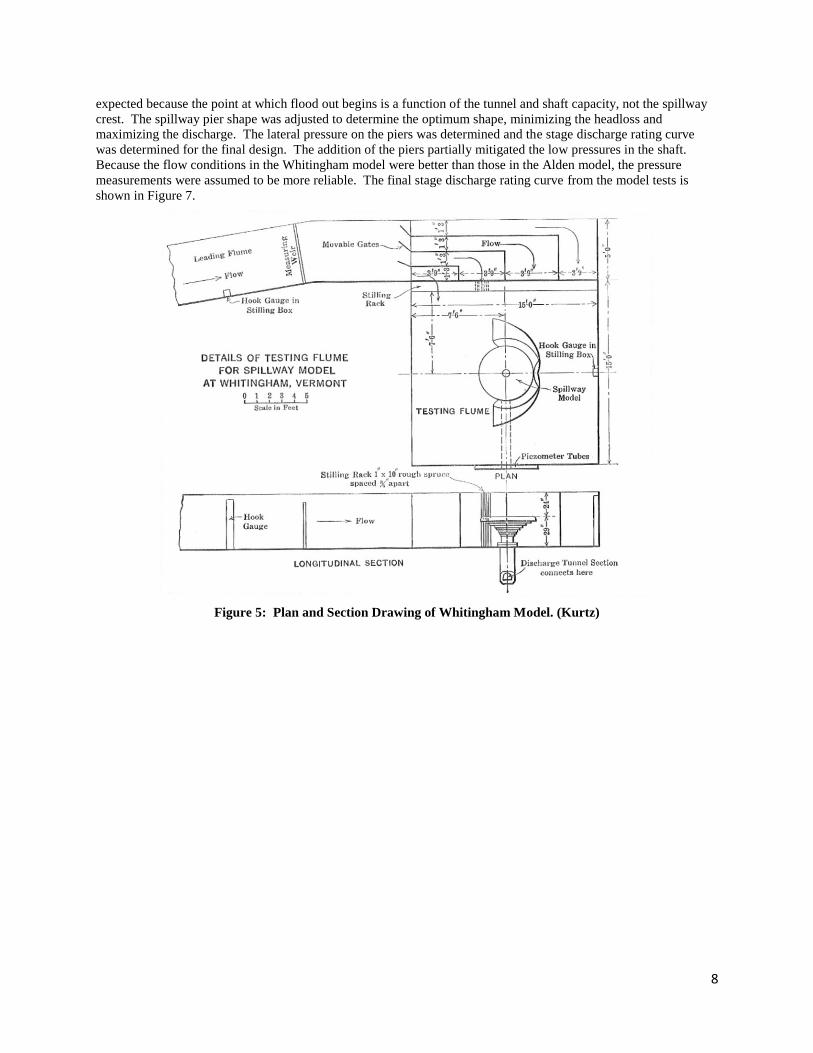
A second model study was completed under the guidance of the design engineer on Sadawga Brook near
Whitingham, VT on July 19 and 21, 1922. The purpose of these tests was to determine first, the effect of the spiral
approach on the spillway capacity and the flow conditions, second, to determine the effect of flashboard piers on the
spillway capacity, and third, the proper length and shape of the pier ends. Figure 5 and Figure 6 show a plan view
and a photograph of the model. The capacity curves for the testing on June 9 and July 19 are in very good
agreement for flows up to 0.8 cfs (6,000 cfs prototype), reduction in capacity beyond this point is attributed to losses
of head in the spiral approach.
The Whitingham tests also showed that the spillway floods out at practically the same flow, 4.3 cfs (33,400
cfs prototype) with or without the spiral approach channel and with or without the flashboard piers. This is as
8
expected because the point at which flood out begins is a function of the tunnel and shaft capacity, not the spillway
crest. The spillway pier shape was adjusted to determine the optimum shape, minimizing the headloss and
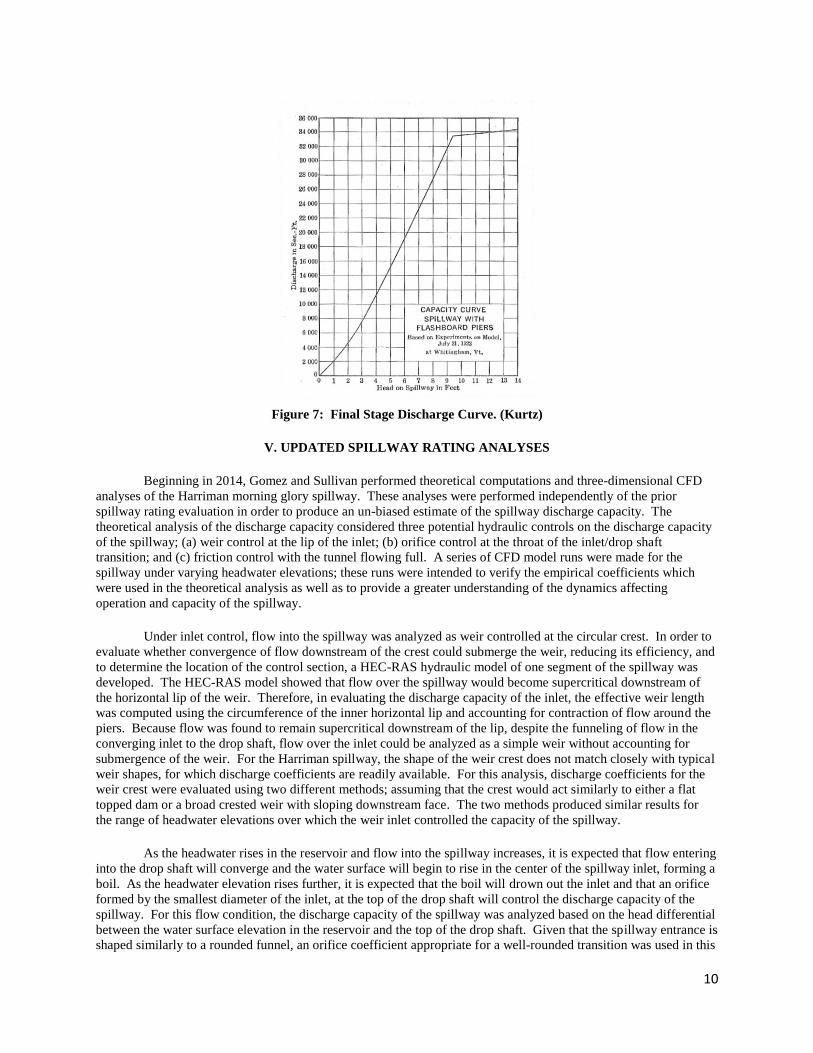
maximizing the discharge. The lateral pressure on the piers was determined and the stage discharge rating curve
was determined for the final design. The addition of the piers partially mitigated the low pressures in the shaft.
Because the flow conditions in the Whitingham model were better than those in the Alden model, the pressure
measurements were assumed to be more reliable. The final stage discharge rating curve from the model tests is
shown in Figure 7.
Figure 5: Plan and Section Drawing of Whitingham Model. (Kurtz)

9
Figure 6: Photo of Whitingham Model. (Kurtz)
The investigators for the 1922 physical model studies concluded that:
1) Shaft spillways if designed in accordance with hydraulic principals can be relied on to act as predicted
within the usual uncertainty associated with water flow.
2) The problem of reduction in spillway capacity due to air entrainment is not a serious one if proper design
methods are followed.
3) A partial or complete vacuum may exist in the converging section of the spillway, but this does not alter the
spillway capacity.
4) The introduction of radial piers greatly improves the flow conditions over the spillway when the approach
to the spillway is through a relatively narrow and shallow channel.
The stated conclusions from 1922 are interesting in that they do not address potential cavitation in the
spillway despite the measurement of negative pressures within the spillway. In addition, the interpretation of
capacity not being affect by air entrainment we now know may have been the result of scale effects.
10
Figure 7: Final Stage Discharge Curve. (Kurtz)
V. UPDATED SPILLWAY RATING ANALYSES
Beginning in 2014, Gomez and Sullivan performed theoretical computations and three-dimensional CFD
analyses of the Harriman morning glory spillway. These analyses were performed independently of the prior
spillway rating evaluation in order to produce an un-biased estimate of the spillway discharge capacity. The
theoretical analysis of the discharge capacity considered three potential hydraulic controls on the discharge capacity
of the spillway; (a) weir control at the lip of the inlet; (b) orifice control at the throat of the inlet/drop shaft
transition; and (c) friction control with the tunnel flowing full. A series of CFD model runs were made for the
spillway under varying headwater elevations; these runs were intended to verify the empirical coefficients which
were used in the theoretical analysis as well as to provide a greater understanding of the dynamics affecting
operation and capacity of the spillway.
Under inlet control, flow into the spillway was analyzed as weir controlled at the circular crest. In order to
evaluate whether convergence of flow downstream of the crest could submerge the weir, reducing its efficiency, and
to determine the location of the control section, a HEC-RAS hydraulic model of one segment of the spillway was
developed. The HEC-RAS model showed that flow over the spillway would become supercritical downstream of
the horizontal lip of the weir. Therefore, in evaluating the discharge capacity of the inlet, the effective weir length
was computed using the circumference of the inner horizontal lip and accounting for contraction of flow around the
piers. Because flow was found to remain supercritical downstream of the lip, despite the funneling of flow in the
converging inlet to the drop shaft, flow over the inlet could be analyzed as a simple weir without accounting for
submergence of the weir. For the Harriman spillway, the shape of the weir crest does not match closely with typical
weir shapes, for which discharge coefficients are readily available. For this analysis, discharge coefficients for the
weir crest were evaluated using two different methods; assuming that the crest would act similarly to either a flat
topped dam or a broad crested weir with sloping downstream face. The two methods produced similar results for
the range of headwater elevations over which the weir inlet controlled the capacity of the spillway.
As the headwater rises in the reservoir and flow into the spillway increases, it is expected that flow entering
into the drop shaft will converge and the water surface will begin to rise in the center of the spillway inlet, forming a
boil. As the headwater elevation rises further, it is expected that the boil will drown out the inlet and that an orifice
formed by the smallest diameter of the inlet, at the top of the drop shaft will control the discharge capacity of the
spillway. For this flow condition, the discharge capacity of the spillway was analyzed based on the head differential
between the water surface elevation in the reservoir and the top of the drop shaft. Given that the spillway entrance is
shaped similarly to a rounded funnel, an orifice coefficient appropriate for a well-rounded transition was used in this
11
analysis. The elevation at which the flow control will transition from the weir crest to the throat of the transition is
not known ahead of time. Therefore, the flow capacity was computed both for the assumption of weir and orifice
control over a range of headwater elevations; at any given headwater elevation the control condition which will
produce the lower flow rate will control the discharge of the spillway.
If the reservoir elevation continues to rise above the point at which the inlet throat controls the discharge
capacity, the discharge tunnel will begin to flow full. When the tunnel is flowing full, the discharge capacity is
controlled by friction losses in the tunnel and minor losses in the entrance, transition and bends. The flow rate under
this condition was computed utilizing the Bernoulli equation. Under high enough flow conditions, the capacity of
the downstream channel could lead to a condition in which the tunnel exit is submerged. The tailwater elevation
would affect the discharge capacity of the spillway tunnel when it is flowing full, reducing the effective head
differential between the inlet and outlet of the spillway system. In order to include the effects of tailwater elevation
on the discharge capacity of the spillway tunnel flowing full, a HEC-RAS hydraulic model was developed for the
segment of the Deerfield River downstream of the discharge tunnel. The HEC-RAS model was used to develop a
tailwater rating curve for the discharge tunnel over the range of flows expected to occur within the range of
headwater elevations being evaluated. The calculation of flow through the spillway tunnel as it is flowing full,
requires the evaluation of losses within the entrance transition (from the 80 foot radius of the weir crest to the 22.5
diameter drop shaft), the bend from vertical shaft to horizontal and the transition from the round drop shaft to the
horseshoe shaped tunnel. For bends and transitions, tables of loss coefficients are generally developed for small
diameter pipes however the coefficients can be scaled using a representative length scale. Information on losses
through large diameter pipe bends are available in the literature and were used in developing the loss coefficient for
the bend. For the inlet transition and the transition from the round drop shaft to the horseshoe tunnel were estimated
based on similar transition shapes available in the literature. Similar to the transition from weir control at the crest,
the headwater elevation at which flow control transitions from orifice control at the inlet throat to friction control in
the drop shaft and tunnel is not known prior to the completion of the analysis. Therefore, flow capacity through the
spillway was computed for a series of headwater elevations, assuming that friction and minor losses in the tunnel
would control the discharge; the elevation at which friction control produced a lower discharge is where the control
transitions from orifice control.
Friction and minor losses are dependent on the velocity of flow through the various spillway and tunnel
sections for which the losses are being computed. Additionally, tailwater elevations are known for specific
discharges from the spillway rather than corresponding headwater elevations. Therefore a direct computation of the
flowrate at a given headwater elevation would require an iterative procedure. For conditions of friction control in
the spillway shaft and tunnel, headwater elevations were computed for specific flow rates, and then flows at specific
headwater elevations were interpolated from the computed results. For weir and orifice control conditions, flowrates
were computed directly for specific headwater elevations.
Based on the results of the updated theoretical analysis of the Harriman spillway, it appeared that the
capacity would only be controlled by the circular weir crest and orifice conditions at the inlet throat, within the
range of possible headwater elevations. However, due to the unique shape of the spillway crest and limited
information on appropriate loss coefficients for the transitions and bend in the spillway, there was some uncertainty
in the capacity of the spillway. Additionally, it was noted that the discharges resulting from the original (1922)
rating curve analysis were significantly higher than the current analysis, at high headwater elevations. The results of
the original physical model tests indicated that the transition from the weir flow condition would occur at a
significantly higher headwater elevation. The report on the original physical model tests noted that a siphon
condition was observed at higher headwater elevations. However, it was unknown how that condition would change
when the results were scaled up to the full size spillway. Particular concern was noted with regard to the negative
pressures that were measured within the spillway throat, as those pressures would approach negative one atmosphere
in the full scale spillway. Upon further review, it appears that the existing spillway rating curve was based upon the
occurrence of a siphon condition, despite the concern that such a condition may not occur at full scale.
Therefore, Gomez and Sullivan recommended that a three-dimensional computational fluid dynamics
(CFD) model of the spillway be developed in order to better evaluate the discharge capacity under various flow
conditions. The model was intended to support the theoretical analysis; better defining the coefficients used in
12
evaluating the capacity under weir, orifice and friction control conditions, as well as evaluating the difference in
discharge capacity from the prior analysis at high headwater elevations.
The CFD model of the spillway was developed using the Flow Science FLOW3D® software. Model
geometry was developed based on available drawings for the spillway. For the purpose of this model, the reservoir
bottom was assumed to be flat in the vicinity of the spillway entrance. The exact shape of the reservoir bottom in
this area is not expected to have a notable effect on the discharge capacity, particularly at the high flows for which
this model was developed. Model geometry was developed for a square area of the reservoir, 440 feet on a side,
centered on the spillway entrance, and the entire drop shaft and spillway tunnel to its discharge into the Deerfield
River. The spillway entrance is located relatively close to the south bank of the reservoir, where the bedrock was
excavated to form the spillway approach channel. The original design of the spillway approach channel, as modeled
in the physical model tests, had a minimum width of 7.5 feet. The physical model tests concluded that this width
was sufficient to provide free flow to the spillway, without decreasing the discharge capacity of the spillway. As
constructed, the spillway approach channel has a minimum width of approximately 15 feet. In order to minimize the
complexity of the CFD model, the geometry of the spillway approach channel was not explicitly modeled. The
results of the physical model tests and the fact that the spillway approach channel was constructed larger than the
original design support the assumption that the presence of the reservoir’s south bank will not affect the spillway
discharge.
The CFD model was run at a series of headwater elevations, to evaluate the discharge capacity at that
elevation. For each run, the anticipated discharge for the specified headwater elevation (based on the theoretical
capacity analysis) was used to evaluate the appropriate tailwater elevation to use as the downstream boundary
condition. For these model runs, the applied boundary conditions included specified headwater elevations at each of
the four sides of the model domain within the reservoir and a specified tailwater elevation just downstream of the
tunnel exit. In order to decrease the computational time required to reach stability of the model, an initial condition
was set to fill the upper portion of the model (above the modeled reservoir bottom) with water. However, the lower
portion of the inlet, drop shaft and tunnel were modeled as initially dry and at atmospheric pressure in order to
eliminate the possibility of modeling an artificial transition to full tunnel flow or inducing a siphon condition that
could not occur within the reservoir where the headwater would rise over some period of time.
The FLOW3D® software allows for the modeling of various physical effects, which may or may not be
significant to the situation being modeled. For this analysis, gravitational forces, viscosity, turbulence, bubble
formation, phase change, and cavitation were modeled. These conditions were expected to have a significant impact
on the potential discharge capacity of the morning glory spillway. As negative pressures had been noted in the drop
shaft during the original physical model testing, it was expected that bubble formation and cavitation within the
spillway could both affect the discharge capacity and potentially damage the interior surfaces of the spillway.
Results of the CFD model confirmed the discharge capacity of the spillway under low headwater
conditions, corresponding well with flow computed for a flat topped dam. Under higher headwater elevations, the
discharges computed by the CFD model significantly exceeded Gomez and Sullivan’s theoretical computations
assuming orifice control at the inlet throat. Additionally, the spillway was found to be flowing full under the
headwater elevations being evaluated; such a condition would not be expected to occur if the discharge was
controlled by an orifice condition at the throat. A detailed review of the CFD results revealed that sub-atmospheric
pressures were being computed below the throat, which would produce a siphon condition in the spillway.
For low headwater elevations (up to approximately 4 or 5 feet), the results of the updated analysis produce
lower discharge estimates than the physical model tests, with the difference decreasing with increasing headwater
elevation. At intermediate headwater elevations (from approximately 5 or 6 feet over the crest to approximately 8
feet over the crest), the CFD model indicated a somewhat higher discharge capacity for the spillway (approximately
5%). At high headwater elevations (above approximately 8 feet over the crest), the CFD model showed a marked
difference in the discharge capacity of the spillway, as compared to the 1922 physical model tests. The results of the
CFD model indicate that the spillway would transition from free weir flow to pressure flow at a discharge of
approximately 2,500 cfs less than was predicted based on the physical model tests. Similar to the physical model
tests, the CFD results indicated that the rate at which the discharge capacity of the spillway would increase, with
rising headwater, would decrease significantly after the weir becomes drowned out.

13
VI. PEER REVIEW OF CFD MODEL
Alden conducted a peer review of the CFD model completed by Gomez and Sullivan in July 2016. The
review was conducted at the request of FERC and focused on three elements of the modeling:
1) Review of the CFD model parameters including but not limited to model inputs, mesh and results.
2) Review the spillway rating curve report and provide an engineering opinion if the rating curve was
calculated in accordance with best practices.
3) Perform a sensitivity study of the model.
At higher headwater elevations, GSE had identified the possibility of a siphoning phenomena within the
spillway drop shaft and tunnel elbow wherein sub-atmospheric pressure generates discharge values in excess of
those predicted to gravity-driven orifice controlled or full pipe flow. Modeling this phenomena is particularly
difficult due to its dependence on fluid cavitation, a micro scale process highly sensitive to individual roughness
elements, temperature, turbulence, and particulates within the fluid.
Another important source of uncertainty is the effect of surface roughness on discharge. Damage to the lining
of the spillway caused by an extreme flow event likely increased the effective roughness of the concrete surface.
This increased roughness could reduce the discharge capacity by increasing flow resistance. The goal of Alden’s
review was to identify the biggest sources of uncertainty in the CFD model and their impact on the discharge
through the morning glory spillway. Special emphasis was on a select simulation involving siphoning.
VII. PARAMETERS TESTED BY ALDEN
A. Cavitation Pressure
The CFD analysis revealed that once the spillway tunnel is running full (water solid), sub-atmospheric
pressures can develop in the upper funnel section of the drop shaft and at the elbow. In acknowledgement that such
conditions could exist, GSE invoked the “Cavitation” and “Bubble and phase change” parameterizations in
FLOW3D®. These sub-models cause an air pocket to develop in the elbow (not the upper drop shaft). The air
pocket subsequently elongates horizontally downstream until it reaches the spillway outlet, at which point, the
horizontal tunnel of the spillway becomes vented to the atmosphere and siphoning within the elbow and horizontal
tunnel is temporarily broken. Breaking the siphon, thereby, decreases the flow rate. A portion of the horizontal
tunnel eventually refills to full pipe flow before the next siphon-cavitation event. In FLOW3D®, cavitation occurs
when the pressure drops below a threshold value known as the cavitation pressure. At this point, pressure can drop
no lower (approximately), and an air pocket can develop. Alden tested models that did not include cavitation, a low
cavitation pressure and a high cavitation pressure. When cavitation is not allowed, the spillway capacity increased
about 12 percent from that estimated by GSE. With a high cavitation pressure (minimum siphoning) a 10% decrease
in the spillway capacity was noted.
14
B. Run Duration
The siphon-cavitation cycling sets up an oscillatory behavior in the flow. Alden extended the model run to
determine how the oscillations changed with run duration. Alden also changed the initial conditions of the
simulation to determine if the cycling is a result of the initial conditions in the model. The cycle averaged discharge
remained unchanged. Despite the negligible impact on the spillway rating curve, periodic pressurization and
depressurization of the spillway is undesirable as such cycling could damage the lining of the spillway.
C. Tailwater Elevation
The downstream boundary condition is prescribed using a discharge rating curve developed in a 1-D HEC-
RAS hydraulic model for the river below the spillway outlet. The downstream tailwater affects whether air can
enter the downstream end of the tunnel, breaking the siphon. As the modeled tailwater elevation is reliant on the
assumed roughness of the downstream channel, Alden tested both lower and higher tailwater elevations to determine
how the model performs. Lower tailwater elevations resulted in about a 1% increase in the discharge. The higher
tailwater elevations resulted in a negligible difference the discharge capacity. The higher tailwater did not lead to
any backwater effect in the tunnel due to the extremely high Froude number at the outlet.
D. Roughness Tests
To determine the model sensitivity to roughness, Alden conducted a roughness test using a circular pipe
with the same length, slope and cross sectional area as the horseshoe shaped tunnel. Theoretical head loss
calculations were compared to the CFD results using the same grid resolution being used in the Harriman model.
Results showed that the CFD model over predicted the discharge by less than 3%
VIII. CONCLUSIONS OF PEER REVIEW
The review conducted by Alden found that the approach used by Gomez and Sullivan was appropriate for
predicting the stage discharge rating curve. Alden identified the siphoning phenomenon and surface roughness as
two dominant sources of uncertainty. By simulating a condition of maximum siphoning (no cavitation) and a
condition of extremely weak siphoning (cavitation pressure = atmospheric pressure), Alden concludes that
uncertainty in the siphoning phenomenon may be approximately quantified as a ±10% variation in discharge from
the Gomez and Sullivan predictions.
With regard to the surface roughness, invoking a roughness scale typical of concrete, led to a 4% decrease
in the capacity of the spillway. Gomez and Sullivan subsequently revised the final CFD runs to utilize the
roughness scale recommended by the peer review.
IX. CONCLUSIONS
The hydraulic operation of the Harriman spillway is fairly unique in terms of typical design for morning
glory type spillways. Generally, it is anticipated that all three flow control conditions (weir, orifice and full pipe
flow) will occur over a range of headwater elevations. Results of the CFD model indicated that at relatively low
headwater elevations, the lower end of the discharge tunnel would begin to fill due to the tailwater elevation and the
loss of head due to friction in the long discharge tunnel. However the rise in water surface elevation within the
tunnel, necessary to drain the incoming spillway flow, is not sufficient to drown out the weir. As the headwater
continues to rise, therefore so does the level within the drop shaft, necessary to drive flow through the discharge
tunnel. By the time the headwater elevation at which orifice flow is expected to control is reached, the CFD model
indicates that the water surface will rise above the orifice elevation. At such time, the drop shaft will be flowing full
and sub-atmospheric pressures will exist below the orifice elevation resulting in a head acting on the orifice in
excess of the elevation head, drawing a greater flow through the spillway than would be expected from the orifice
computation. Consequently the Harriman spillway is expected to transition directly from a weir controlled regime to
full pipe regime, with free orifice conditions never being reached at the throat of the spillway transition. Figure 8
shows sample results of the CFD model under the full pipe flow condition. Further CFD model runs indicated that
flow in the spillway would transition directly from weir flow controlled to full pipe flow controlled. Thus the sharp
increase in rating curve slope would occur at a higher flow than expected based on the analysis of weir, orifice and
pipe full flow conditions.

15
Figure 8: Sample CFD Model Results
Comparing the relative sizes of the elements of the Harriman morning glory spillway to typical design
examples, the ratio of the outer spillway radius to the radius of the drop shaft is much larger for the Harriman
spillway. Additionally, the length and radius of the transition from the weir to the drop shaft is much larger,
providing support to the lower nappe for higher flows than would be expected in typical morning glory spillway
designs. It is believed that these two factors contribute to the flow transition directly from weir to full pipe control.
The small diameter and relatively shallow slope of the discharge tunnel lead to a condition where a standing water
surface must be maintained in the drop shaft to drain the inflow controlled by weir flow at intermediate flows. The
long entrance transition and relatively large diameter of the outer weir prohibits the convergence of the flow nappe,
which would result in the development of a free jet flow and subsequently an orifice flow condition, prior to the
transition to control by full pipe flow.
Comparison of the results computed by the updated theoretical analysis and CFD model indicate that the
1922 analysis resulted in an overly high estimate of the discharge capacity of the spillway under high headwater
elevations. The general physical phenomena reported in the description of the physical model tests were replicated
in the CFD analyses, including the boil formation as flows converged (described as a disturbed “mushroom” by the
model testers) and the presence of sub-atmospheric pressures within the drop shaft. The use of the CFD model
allowed for a more detailed analysis of the implications of the sub-atmospheric pressures, without the unknown
scaling issues noted in the original 1922 analysis. The CFD model also allowed for adjustment of roughness of the
spillway surface and the evaluation of such changes on the discharge capacity; the original model test noted issues in
producing an appropriately smooth discharge tunnel. A greater number of headwater elevations and subsequent
flow rates within the spillway could be evaluated with the CFD model; this range of results along with the ability to
easily view the flow patterns within the spillway and tunnel allowed for a more detailed understanding of the
phenomena affecting discharge capacity of the spillway.
The results of the updated spillway analysis provide a greater level of confidence in the estimated
discharges produced by high flow events and in the evaluation of peak headwater elevations under theoretical
events. The detailed analysis also helps to understand the likely causes of the deterioration of the tunnel lining
which appears to have occurred during Hurricane Irene.
X. REFERENCES
Kurtz, F. 1924. The Hydraulic Design of the Shaft Spillway for the Davis Bridge Dam, and Hydraulic
Tests on Working Models. American Society of Civil Engineers Transactions, Paper No. 1551.

16
XI. AUTHOR BIOGRAPHIES
Damian M. Gomez, P.E., CFM
Gomez and Sullivan Engineers, D.P.C.
288 Genesee Street
Utica, NY 13502
Damian Gomez is a Water Resources/Dam Safety Engineer with Gomez and Sullivan Engineers, P.C. in Utica, NY.
He has 14 years of professional experience focusing in hydrologic and hydraulic modeling, performing Probable
Maximum Flood, Dambreak and floodplain mapping studies. He is a licensed Professional Engineer and a Certified
Floodplain Manager. He has a B.S. in Civil Engineering from Penn State and a M.S. in Civil and Environmental
Engineering from the University of Buffalo.
Dan Gessler, Ph.D., P.E., D.WRE
Alden Research Laboratory, Inc.
2000 S. College Ave Suite 300
Fort Collins, CO 80525
Dr. Gessler is a registered professional engineer with over 25 years of experience in hydraulics, hydraulic modeling
and CFD. He is a practicing principal that provides technical leadership at Alden in the area of hydraulic physical
and numeric modeling. He has published multiple papers on the modeling of spillways using CFD. He has taught
short courses on numeric and physical model. Dr. Gessler received his PhD from Colorado State University.
Justin (Jud) Donaghy, P.E.
Great River Hydro, LLC.
4 Park Street - Suite 402
Concord, NH 03301
Jud Donaghy earned his engineering degree at Rensselaer Polytechnic Institute and has been fostering dam safety
for over 30 years. His present duties include developing, overseeing and managing Great River Hydro’s Owner’s
Dam Safety Program. Jud is active in the dam safety engineering profession, participating in ASDSO, and has co-
authored several technical papers. He is a registered professional engineer in Connecticut and New Hampshire.