evaluation of a high-resolution profiling instrument for
TRANSCRIPT

TRANSPORTATION RESEARCH RECORD 1291 93
Evaluation of a High-Resolution Profiling Instrument for Use in Road Roughness Calibration
c. BERTRAND, R. HARRISON, AND w. R. HUDSON
Response-type roughness measuring devices, now commonly used throughout the world to monitor the condition of low volume roads, require careful calibration to ensure the accuracy of their measurements. Yet there is no con ensus regarding the most appropriate instrumentation for such calibration. A recent World Bank publica tion. reporti ng the finding of a erie of experiments in a num ber of countries , proposed a hierarch of roughne.ss measuring instruments. the most accura te of which (termed Cla I) might be u ed for the calibration of response-type instrument~ (most of which are termed Clas Ill). Included among these Clas I instruments i the Face dipstick. an inexpensive high-resolution profilin g device who. e fea ture. commend it ror application on low-volume road . but who. e applicability for such use has not yet been properly demonstrated. By comparing two Class I profiling instrument for potential use in road roughness calibration, accepting the cla si 1cation scheme established by the World Bank, It was found that the face dip tick. in its manual form, is a fast, accurate, and cost-effective alternative to other methods, including the rod-and-level method .
Low-volume roads play a critical role in stimulating economic and social activities in both developed and developing nations. Typically , these roads are constructed according to relatively inexpensive design criteria and consequently require regular maintenance to ensure structural integrity, good running surfaces, and an adequate service life . Such maintenance is equally crucial in terms of economics, because as road conditions deteriorate, total system costs dramatically increase, principally as a result of user- and vehicle-related expenses .
Unfortunately, many low-volume roads are poorly maintained. World Bank staff (J) have estimated that about onethird of the unpaved roads and one-quarter of the paved roads outside of urban areas in the 85 countries receiving World Bank funding now need reconstruction and that such work could cost an estimated $45 billion ( 1988 U.S. prices). This figure, about four times the cost of a good preventive maintenance program , represents only the agency cost of the total financial burden. What is not known is the additional economic impact on users, though it is presumed that those costs will be significantly greater when estimated with a total-cost minimizing model (2) .
Thus, a program of preventive maintenance for low-volume roads is extremely important. And one of the key exercises within such a maintenance program is the assessing of the condition of these roads-specifically the running surface,
Cent~r for Transportation Research , University of Texas at Austin , Austm , Tex. 78712 .
which is commonly evaluated in terms of longitudinal (wheelpath) roughness .
Road surface roughness was known from early U .S. research (3) to exert a considerable influence on road-~ser costs; this influence has since been quantitatively investigated in a series of studies sponsored by a variety of national and international agencies ( 4). These study results now allow low-volume road planners to model the financial consequences of surface roughness deterioration with respect to both agencies and road users . Such models have stressed the link between maintenance , surface roughness, and user costs, and have focused attention on the benefits of the timely scheduling of maintenance and reconstruction . Although this is most effectively done within a pavement management system (5). the implementation of such a system requires a regular schedule for collecting roughness data.
There are many systems and instruments available for collecting surface roughness data. including response-type instruments, direct-profile measuring systems. indirect-profilemeasuring systems , and subjective panel assessments . Not all systems have proven effective . Many are simply not designed to provide the rapid and inexpensive assessment required by the extensive networks that characterize low-volume roads. Direct profiling and indirect systems are time-consuming and costly, and subjective panel ratings are not only slow but difficult to administer and inappropriate for the primary measurement of network surface roughness . Consequently, the preferred instrument for measuring regular roughness data on low-volume roads is a response-type instrument.
All response-type instruments, including the Bureau of Public Roads (BPR) roughometer , the U .K. Transport and Road Research Laboratory (TRRL) towed fifth wheel. the TRRL bump integrator unit, and the Mays ridemeter, measure the displacement of a wheel suspension relative to a vehicle body or towing frame . The BPR roughometer is a single-wheel device towed by a vehicle ; both the TRRL bump integrator unit and the Mays ridemeter are typically mounted in the rear of a light vehicle, usually an automobile , and measure the cumulative movements of the rear axle relative to the vehicle body. Data produced by vehicle-mounted systems are affected by several factors other than surface roughness, including vehicle speed, deteriorating suspension systems, tire pressure variations, uneven tire wear , and vehicle mass. In the Brazil study (6), a 5 percent change in vehicle mass or a 1 percent change in tire pressure altered the response count by around 2 percent. Therefore , if pavement management systems for low-volume roads are to be effective, these response-type

94
measuring devices must follow regular calibration procedures to ensure the accuracy and reliability of reported data.
Although this calibration requirement was comprehensively addressed in guidelines developed by Sayers et al. (7), earlier researchers had been following distinct calibration routines in their studies. For example. the Brazil study used nine Maysmeter-equipped vehicles that were regularly calibrated over 20 control sections for which a reference roughness standard had been determined (an activity that consumed up to 20 percent of available instrument time). Elevation data from longitudinal profiles were measured using a K. J. Law profilometer ; the data were then processed through a quartercar simulation of the BPR roughometer to give a quarter-car index (QI), or average rectified slope expressed in counts per kilometer. This statistic is similar to the recently recommended International Roughness Index (IRI) (8). For the majority of agencies, however, the use of a profilometer is not feasible because of its cost, maintenance requirements, and the need for highly trained staff. Accordingly, other instruments for determining low-cost reference roughness standards need to be investigated.
A hierarchy of such instruments was reported in World Bank guidelines (7). categorized by Paterson (9) , and adopted
TABLE 1 CLASSIFICATION OF PROFILING INSTRUMENTS
MAX. MEASUREMENT CLASS METHOD ERROR INTERVAL
MANUAL I ABSOLUTE 1.5% BIAS; LESS THAN
ELEVATION PRECISION OR EQUAL
PROFILES RELATIVE TO 19 INCH/MILE T01 FOOT TRUE HORIZONTAL
II ELECTRONICALLY MEASURED ELEVATION 5%BIAS; LESS THAN
DIRECT PROFILE FROM OR EQUAL TO PROFILING ARTIFICIAL 44 INCH/MILE 2FEET
MEASUREMENT "HORIZONTAL" DATUM
MEASURE Ill A DYNAMIC 10%BIAS; CONTINUOUS RESPONSE OF
A MECHANICAL OVER TEST RTRRMS 32-63 SECTION DEVICE TO INCHES'MILE LENGTH ROADWAY
SURFACE
MEASURE BLANKING Ill B DEVIATION OF BANDS USED CONTINUOUS
PROFILE TO FILTER OUT OVER TEST t.DVING RELATIVE TO A CONSTRUCTION SECTION DATUM DATUM MOVED TECHNIQUES LENGTH PROFILES ALONG~D SUCH AS TINING SURFACE
SUBJECTIVE ESTIMATES MADE
IV BY OBSERVER(S) USINGA DESCRIPTIVE SCALE
TRANSPORTATION RESEARCH RECORD 129/
in the recent FHW A requirements for roughness dat<t collection (10). These instruments are presented in Table 1. which shows that the highest profile resolution is provided by three devices (termed Class I). Using this categorization, researchers at the Center for Transportation Research (CTR) at the University of Texas at Austin investigated the feasibility of implementing a high-profile resolution method for the Texas State Department of Highway and Public Transportation (SDHPT). These results are of interest to highway agencies responsible for low-volume road management and contemplating using response-type devices requiring regular calibrntion against a high-resolution profiler.
A high-resolution Class I profiling instrument is evaluated for use in road roughness calibration of response-type instruments, comparing specifically the Face dipstick profiles with rod-and-level profiles (the TRRL beam was not available for evaluation). The dipstick and its operation are presented first. including a summary of features, an evaluation. and recommended checks. Next, the dipstick is evaluated in both its automatic-data-transfer mode and in its manual-transfer mode . Two dipsticks were used in all evaluations. enabling instrument-to-instrument variations to be determined . The dipstick's elevation output was compared also with the output
EXAMPLE INSTRUMENTS COMMENTS
ROD & LEVEL DATA COLLECTED MANUALLY AND
DIPSTICK PROCESSED TO GIVE ROUGHNESS
TRRLBEAM STATISTIC; VERY ACCURATE BUT
LABORIOUS AND SLOW
GM PROFILOMETER DATA COLLECTED FROM MOVING VEHICLE; DIFFER IN REFERENCE USED AND METHOD K.J. LAW PROFILOMETER OF SENSING; NOT ABSOLUTE PROFILE
TEXAS PROFILOMETER BECAUSE OF LACK OF LOW FREQUENCY
FRENCH APL RESPONSE; CAN BE UTILIZED FOR CALIBRATION
MAYS RIDE METERS MOST COMMON INSTRUMENTS; (1) MEASURE
ARAN OF AXLE-BODY MOVEMENTS USUALLY SUMMED TO GIVE CUMULATIVE "BUMPS" PER
BPR ROUGHMETER UNIT DISTANCE, OR (2) MEASURES
DYNATEST 5000 ROM ACCELERATIONS OF AXLE OR BODY VIA ACCELEROMETERS; DATA COLLECTED AT
COX ROADMETER HIGHWAY SPEEDS; REQUIRES CALIBRATION
ROLLING STRAIGHT EDGE INSENSITIVE TO WAVELENGTHS EQUAL TO INSTRUMENT BASELENGTH, PROFILOGRAPH
SLIDING STRAIGHT EDGE AVERAGES END REFERENCE POINTS; SIGNAL
PROFILOGRAPHS GAIN HIGHLY TUNED AND VARIABLE (IDEAL IS UNIFORM GAIN)
NOT SUITABLE FOR COLLECTING
ROUGHNESS DATA FOR HPMS

Bertrand et al.
from the rod-and-level surveys on several pavement sections. The elevations from both the dipstick and rod-and-level were used to calculate a number of roughness statistics in Texas. These statistics allow comparisons of roughness calculations on the basis of the data from the two survey techniques. Finally, recommendations are made concerning the use of the face dipstick as a high-resolution profiling instrument for use in calibrating response-type roughness devices.
OPERATION OF THE DIPSTICK
The dipstick, originally designed by the Face Company as a manually read instrument for evaluating the flatness of concrete floors, employs an inclinometer to determine the difference in elevation between its two feet (spaced 1 ft apart). This inclinometer acts as an electronic pendulum for determining and displaying the elevation differences. Providing readings to 0.001 in., the dipstick, according to its manufacturers, is accurate to ± 0.0015 in . per reading. Although the manual-read version requires two persons for proper operation (one person to move the dipstick down the survey line, the other to record the readings), the auto-read version of this instrument requires only one (readings are automatically read, captured, and stored by the onboard computer). By eliminating the requirement for a second operator, the autoread version reduces both the data transcription time and the possibility of transcription errors.
The computer onboard the auto-read dipstick uses an electronic interface built into the inclinometer circuitry, with a PC-2 installed on the dipstick's handle (Figure 1). The elevation data are captured and stored on the PC-2 for later transfer to an IBM-compatible computer by an RS-232 communications port. Once the raw elevation data are transferred to the IBM-type computer, a set of application programs is used to view, manipulate, or process the data into roughness statistics, one of which is the IRI.
In using the dipstick, an operator manually walks down a wheelpath (previously marked in some way to guide the operator). The operator rotates the dipstick from one elevation location to next, leaving the front foot of the dipstick on the pavement surface while the back foot is rotated forward . If the front foot is lifted from the pavement, the reference elevation will be lost and the procedure must be started over. In the manual version of the dipstick, as mentioned earlier, a second operator (transcriber) records the elevation readings displayed on the dipstick's display windows (Figure 1). The operator waits until the display has settled and then calls out the reading (displayed on the forward-pointing foot) for the transcriber to record. In the automatic version, the elevations are captured automatically on the PC-2. A series of beeps from the PC-2 indicates to the operator that the reading has been taken and that the computer is ready for the next location's reading.
The operation of both auto-read and manual-read dipstick has several drawbacks that can adversely affect the data collected. For example, the leveling of the dipstick's body can be a tedious process in situations where a smooth surface is unavailable. If the dipstick's feet are not level to within ± 0.003 in., as prescribed by the manufacturer, the cumulative error from reading to reading becomes significant. Calibration is
34•
8 1/4'
G) Compul•
® LCD Rudoul1
@ Adfu•llng Pini
© Adju1Ung Pin Sal Sa411w1
(§) Swtlch End Plug
@ e111wy End Plug
@ Compul• lnlwf1c1 Port
0 Olp1Uck OnfOll Swtlch
@Handle
@ Fool Pad1 wtlll Non-Slip Coaling•
FIGURE I Auto-read version of the dipstick.
another problem. Although the calibration of the inclinometer can be checked with the 0.125-in. gauge block included with the dipstick, if the calibration check fails, the user must return the dipstick to the manufacturer for proper adjustment.
Additionally, the dipstick's feet and foot pads can cause cumulative errors during a survey run. In particular, the balland-socket joints that allow the dipstick's feet to rotate smoothly have been a source of problems. These joints should be kept as clean as possible and lubricated with a heavy-duty oil (e.g .. SAE 30-WT); with proper lubrication, the feet will rotate freely and will not trip as the dipstick is rotated and placed for the next reading. Also, the adhesive used to cement the rubberized pads to the feet has tended to debond. When this occurs during a survey run, it can cause errors in the data. The pads themselves have come apart during multiple runs on newly constructed rigid pavements, a result of the rough microtexture placed on new rigid pavements.
Problems relating to the battery compartment on the dipstick's body can also result in data errors. If the compartment cover is not tightly pressed against the dipstick's body after the batteries are changed, a small space is created, which can cause distance errors during a survey run. For example, a space as small as YJ2 in. can cause a distance error of 33 ft over a 1,056-ft survey section.
Finally, there is no low-battery indicator on the dipstick. Experience with this instrument has shown that battery life is only 6 to 8 hr. If batteries fail in the middle of a survey

96
section. the section must be reevaluated. Therefore, it is recommended that the batteries be changed daily.
TEST SITE DESCRIPTION
Several test sites were used for evaluating both the auto-read and the manual-read versions of the Face dipstick. All sites were laid out using the same procedures. though some of the sites had. in addition. a rod-and-level survey performed for comparison. A detailed description of the test sites and their locations was given in a recent CTR Technical Report (11). The following presents the identification codes used for each test site and describes how each test site was laid out for the evaluation effort.
The initial evaluation of the prototype auto-read dipstick was performed on several asphaltic pavements located at the Balcones Research Center (BRC) of the University of Texas in Austin. These sites were of varying lengths and all had rod-and-level surveys performed at 2-ft intervals. All but one of these sites were used primarily for demonstration purposes . and the one site referred to is designated BRC and is 1.000 ft long.
The La Grange test site. selected to determine the dipstick's response on the rough microtexture on new rigid pavements, consisted of newly constructed concrete pavement on a bypass around the city of La Grange. Texas. Two 1.000-ft sections, each consisting of the travel lanes in each direction, were marked. Although the section was rod-and-leveled, a number of high-speed roughness instruments from the Texas SDHPT were run on the section for comparison . These instruments included the Class II profilometer and several Class III instruments . The Class Ill instruments consisted of the Highway Products International automatic road analyzer (HPI ARAN) . a Maysmeter, a Texas SI-ometer. and the McCracken California-type profilograph.
Another extensively used site was a 200-ft strip of a city street in Austin. Texas, that was rod-and-leveled at 6-in. intervals. The low traffic volume (traffic control consisted of a single flagman) permitted repeat runs to be performed and ensured that the rod-and-level survey results would remain relatively constant over time. This site is hereafter referred to as the Oakmont test site.
Additional test sites included a number of asphaltic county and state roadways around the Austin area. These sites had been used for a number of years by the Texas SDHPT as calibration sections for its high-speed roughness instrumentation (12) . All of these sections were 0.2 mi long and some had been surveyed using the rod-and-level. (These sections are referred to as "Austin Test Section." or A TS. followed with a discrete number as an identifier.) The majority of these sites required lane closure (with the associated traffic control). while some required flagmen only. The A TS sites were particularly useful in that they exhibited road surfaces ranging from very smooth to very rough .
Each of the wheelpaths in every test site except Oakmont was marked using the same technique. A start location was first painted on the pavement surface across each travel lane. ln determining the individual wheelpaths within the travel lane, an assumed 65-in. wheelbase width [established by the Strategic Highway Research Program (SHRP) so as to facil-
TRANSPORT AT/ON RESEARCH RE.CORD 1291
itate comparison with the profilometer. which has a 65-in. wheelbase width] was centered in the travel lane. with a string line stretched down both wheelpaths of each travel lane. A series of dots painted on the pavement surface along the string lines allowed the dipstick operators to follow approximately the same wheelpath during repeat runs. The distance of each test section was determined using a steel tape. with the end of the section designated by a stop line painted across the travel lane. The Oakmont section was marked using the same procedure except that the two wheelpaths were centered about the center of the entire pavement width .
AUTO-READ DIPSTICK EVALUATION
The purpose of the initial auto-read evaluation was to determine whether this dipstick version is reliable and repeatable as a Class I field instrument. Although there were other issues that presented themselves during the evaluation processissues that were briefly described above and that are reviewed elsewhere (J J)-only the major concerns with the performance of the auto-read dipstick are addressed.
Two dipsticks were used in this evaluation effort. One was purchased by CTR staff for the Texas SDHPT and is referred to as the UT dipstick; the other was purchased for the SHRP program (SHRP was interested in using the dipstick for profilometer calibration and substitution). and will be referred to as the SHRP dipstick.
Problems in the operation of the auto-read version of the dipstick included situations where the dipstick either (a) failed to take a reading or (b) took a reading that should not have been taken . The first situation will be referred to as "no readings"; the second situation will be referred to as "false readings."
No Readings
Occasionally, the dipstick fails to take readings . When this occurs, the screen does not go blank and the beep does not sound, even after the operator has rotated the dipstick to take a new reading. The operator must constantly look at the dipstick's display screens to determine if a reading has been taken. When the display screen blanks and a number reappears, the dipstick has settled and is ready for a new reading. When it is discovered that a reading has not been taken and the reference has not been lost, the operator can lean the dipstick's body to cause the instrument to take a reading. If the operator fails to detect a no-reading situation, the instrument will, for the remainder of the survey. read the wrong foot. This results in the loss of the reference elevation, and consequently the remainder of the elevations will be opposite in sign.
False Readings
False readings represent the most serious problem in the autoread version of the dipstick. False readings can cause the reported direction of the pavement's design slope to change several times during a single survey run. Figures 2-4 show

~ w ..J ii: 0 a: 11.
10
~ 0
w
= ~ 0 a: 11. -10 ,. ... ,,.1
; ~ / ,,/
False-Readings~~
Dipstick ..L J~ -~~·· .... ·
•' ..,.,1
,.I'"···
-20'-----------'-----------"'---------_... ________ __, 0 100
DISTANCE (FT)
FIGURE 2 Dipstick data with false readings versus rod-and-level survey.
150
100
50
0
-50 0 200 400 600 800
DISTANCE (FT)
200
FIGURE 3 Dipstick data with false readings.
z -w ..J
200
ii: 100 0 a: 11.
200 400 600 800 DISTANCE (FT)
FIGURE 4 Profile of surface shown in Figure 3 with proper slope.
1000
1000

98
the false-reading situation. representing the running sum (the section profile with the design slope intact) of the raw elevation data captured on a survey section. Figure 2 shows the dipstick evaluation of the Oakmont test site (previously rodand-leveled). with the two false readings labeled. These false readings caused the sign on all subsequent readings to be opposite, yielding results that were clearly erroneous. Another example of false readings can be seen in Figure 3, where seven false readings are shown . Compounding this problem was the fact that the new acquisition software, updated by the Face Company, reads first the foot opposite the one that the earlier version read first. Because the operator was unaware of this update, the initial elevations are opposite in sign. Figure 4 is the actual running-sum profile of the La Grange test section in Figure 3.
The most reliable and consistent auto-read Dipstick data are collected when there is more than one dipstick available to take readings along parallel wheelpaths and when the operators are able to constantly check each other's readings and orientation. Such an arrangement can make use of the edit software on the acquisition program to collect a reliable set of data , and, in addition, is psychologically helpful to the dipstick operators. It takes an experienced operator 80 to 90 min to dipstick 1,000 ft. At this pace, an operator's mind tends to wander, resulting in less attention being paid to the job of dips ticking. Consequently, the use of a single operator increases the likelihood that a false reading or a no reading will go unnoticed.
MANUAL-READ DIPSTICK EVALUATION
The manual-read version of the Face dipstick was evaluated as an alternative to the rod-and-level survey after the autoread version was determined to have problems with repeatability and reliability. The auto-read version of the dipstick can be used in the manual mode by reading and recording the I.CD displ;iys located on the dipstick's rnse (Figure 1) . The difference in sensitivity between the SHRP and UT dipsticks could still be a problem in the manual mode of operation. The manual-read evaluation concentrated on determining whether operation of different dipsticks showed different results. In addition, the manual-read version of the dipstick was compared with rod-and-level surveys on three different sites. These comparisons included raw elevations, runningsum differences, and calculated roughness statistics.
The operation of the manual-read version of the dipstick is the same as described in the auto-read version evaluation above. The same manufacturer's recommended leveling and calibration check procedures were followed . The dipstick's feet were kept well lubricated and the batteries were changed daily as precautions against erroneous data and abandoned runs. The data were read by one operator and recorded by a second crew member onto a form. The audio-tape method of recording the elevation data was also evaluated as an alternative to having the two-man crew usually associated with the operation of a dipstick.
This testing was concerned with comparing two different instruments on the same pavement sections. The repeatability of the same instrument on the same pavement sections was evaluated, along with the time needed to manually record the
TRANSPORTATION RESEARCH RECOIW /:!<JI
data and transcribe it onto a computer. The comparisons with the rod-and-level survey were based on the raw elevation data obtained from both instruments . along with the running-sum differences calculated from these data . Several roughness statistics were calculated from the data and comparisons were made between dipstick and rod-and-level interpretation of the pavement surface profile.
UT Dipstick Versus SHRP Dipstick
The manual-read versions of the UT and SHRP dipsticks were evaluated on three different test sites at three different lengths. with the data collection and transcription processes analyzed for time consumption . Two different methods of collecting the data were used during this process . The first method required a two-person crew (the dipstick operator would walk the dipstick down the wheelpath to be evaluated while reading and calling out the elevation numbers displayed on the dipstick"s LCD windows; the other crew member would manually write the elevation data on a form for later transcription) . The second method required a single operator only. A microphone attached to the operator's lapel and to an audiotape recorder was used to tape the elevation data.
The two data collection methods took approximately the same amount of time. The survey of the 500-ft BRC test site averaged 39.3 min, whereas the survey of the 200-ft Oakmont site averaged 15 .6 min and the 1,056-ft A TS 04 averaged 83 min. The average numbers of readings per minute for the data collected at the sites were as follows : the BRC site, 12 .8; the Oakmont site, 12.8; and the ATS 04 site, 12.7.
The audiotape-recorded data were transcribed directly to the computer and onto a recording form . This process not only provided a mechanism for determining if significnntly more time was needed to obtain a hard-copy of the raw data; it also could determine if significant translation errors occurred. The transcription of the raw taped data to the computer or to the recording forms took approximately the same amount of time as required for running the dipstick through the test site. Because the tape was running continually during the acquisition of the elevation data, it took the transcriber the same amount of time to listen to the tape as it did to run the section. Obviously, transcribing the data from the tape to the recording form then to the computer added both time and a greatest risk of transcription error, but it was considered prudent to have a hard copy of the raw data. The biggest problem with the tape recording method was traffic noise. Several of the taped readings were unintelligible because of the noise, and required operators to decide whether to recollect or interpolate the data from the surrounding elevation points .
The data that were hand recorded and then transcribed into the computer required less input time than the taped data, with the time differential approximately one-half that of the actual data acquisition for each test site length. The more proficient the transcriber became at entering data into a particular computer program, the faster and more reliable the data transcription became, though obviously, there is a limit to the speed at which a person can input data into a computer.
While the biggest disadvantages of hand-recording the raw data are the necessity of a two-person data collection crew and the greater expense that goes with it, these di sad-

Bertrand et al.
vantages are offset by the advantages of hand recording. rather than tape recording, the data . The transcription of the taperecorded data requires about twice the time it takes to transcribe the handwritten data. If a hard copy of the raw data is desirable, then the tape-recorded data must be transcribed twice, requiring more transcription time and increasing the risk of transcription error. Regardless of the recording method being used, the transcribed data must be checked before it can be considered reliable. The problem of trying to use data made unintelligible by traffic noise is the most serious disadvantage of the audiotape data recording method. If accuracy and reliability of the data are of paramount importance, then the handwritten recording method is recommended. The more costly tape recording method could be made reliable if traffic noise could be eliminated from the collected data.
The dipstick data should be verified by closing the loop. that is, using a methodology that ensures that a reliable set of data representing the true surface profile is obtained. A test site should be evaluated in one direction from beginning to end. Being careful not to life the dipstick from the surface, the operator should reevaluate the test site by walking the dipstick in the opposite direction down the same wheelpath (a process that provides the evaluator with a second set of data for comparison). The raw data and the running sums of the data can be plotted to find differences in the forward and reverse runs of the same wheelpath. Each individual dipstick has different responses to the same surface but these differences are in the 0.01-in. range. This magnitude of error is less than that associated with placing the dipstick's feet on exactly the same spot on the pavement surface during repeat runs. If transcription or dipsticking error is in the data sets, relatively large spikes or running sum differences will be found during the two runs. In this case, a third run would be required .
Dipstick Versus Rod-and-Level
Three test sites were used to compare the rod-and-level survey interpretation of the pavement surface profile with that of the manual-read version of the dipstick. In terms of the recently instituted IRI, these sites exhibited paved-road roughness ranging from 85 to 350 in./mi. They were marked with a series of guide dots every foot from the beginning to the end of each wheel path in a travel lane.
The rod-and-level crew were instructed to survey 200 ft at a time before moving the instrument to the next setup location. No benchmarks were established. The crew would take readings up one wheelpath and down the other wheelpath. The relative changes at the end of every 200-ft section were checked by reshooting the last 10 ft of both wheelpaths after moving to the next section. The elevations were read to the hundredth of a foot and estimated to the thousandth of a foot. A rod with a vernier was chosen to provide this survey with the best estimate.
The survey crew consisted of three people: one who ran the instrument and called out the readings, another who set the rod in position and made certain it was plumb while the readings were being taken, and a third person who adjusted the vernier and wrote the readings on the reporting form. The actual survey of each 0.2-mi section took the crew approximately 2 days to complete. Then the data had to be entered
99
into the computer for comparison and analysis. a process that took approximately 4 hr per wheelpath. Because the survey was conducted in 200-ft intervals. the readings for each 200-ft section started with different elevations. This meant that the data had to be adjusted so that the relative elevation differences were accurately carried through the transition section. Repeating the last 10 readings of each 200-ft section helped the data transcriber make the proper adjustment to the elevation data (i.e .. because the instrument was moved every 200 ft, the 10 readings served as a closure from one site to the next).
The transcribed data from the dipstick and the rod-andlevel survey were plotted so that the raw elevations and the running sums could be compared. The rod-and-level survey data were reported and transcribed with feet as the units (the dipstick data are reported in inches). To make the necessary comparisons, the rod-and-level data were converted to units of inches by multiplying the rod-and-level data by 12. Some of the rod-and-level survey data contained spikes, which meant that the process of multiplying by 12 magnified these spikes. The data transcriber located these spikes on the raw data forms and then attempted to determine if the data were transcribed properly or if the transcribed data actually represented what was written on the form. A determination was made whether the spiked data represented a hole or a rock in the road surface (in which case the data would be thrown out and replaced by averaging the elevations before and after the errant data). This situation was never encountered. The spiked data seem to represent either the instrument operator's reading mistake or the data being wrongly recorded on the form.
Figures 5 and 6 show the problem rod-and-level spikes cause in comparing the dipstick data. Figure 5 shows the dipstick elevations taken from the outside wheelpath of ATS 36, while Figure 6 shows the rod-and-level elevations of the same roadway. Although the scale of the y-axis on both figures is in inches, the ranges are different on the two figures. The range on Figure 5 is from 0.4 to -0.8 in., while the range on Figure 6 is 2 to - 2 in. The different ranges were caused by spikes encountered in the rod-and-level data. In contrast, if the plots of the inside wheelpath of ATS 36 are viewed, the ranges of
0.4
0.2 -z 0.0
z 0 -0.2 .... < > -0.4 w ...I w
-0.6
-0.8 0 200 400 600 800 1 000 1200
DISTANCE (FT)
FIGURE 5 Dipstick elevations from ATS 36 outside wheel path.

JOO
-z .._
z 0 i== < > LU -I LU
2
0
-1
-2 L-~_..__.__..___.__...___._....___._...___..___.
0 200 400 600 800 1 000 1200
DISTANCE (FT)
TRANSPORTATION RESEARCH RECORD 1291
the y-axis are the same. Figures 7 and 8 show plots of the dipstick and the rod-and-level data from the inside wheelpath of ATS 36. respectively.
FIGURE 6 Rod-and-level elevations or ATS 36 outside wheel path before corrections.
The spikes associated with rod-and-level data do not necessarily translate into large running sum differences when compared to the dipstick data. Figure 9 shows the running sums of both the rod-and-level survey and the dipstick data from the outside wheelpath on A TS 36 overlaid on the same plot. As indicated. the difference between the last readings of each instrument is 1.608 in. Figure IO shows the running sums of the inside wheelpath on ATS 36. The difference between the last readings is 3.605 in. As seen in Figure 5. many large spikes occurred in the raw elevations of the rod-and-level data from ATS 36 outside wheelpath. Most of these spikes seem to be opposite in magnitude. offsetting each other when the running sum is calculated, producing smaller differences when compared to the dipstick data. A comparison of Figures 7 and 8 indicates that the dipstick and rod-and-level elevations are similar, yet the difference in the running sums is 3.065 in.
0.0
-. -0.1 z .._
z 0 -0.2 i== < > LU -I -0.3 LU
-0.4 0 200 400 600 800 1000 1200
DISTANCE (FT)
FIGURE 7 Dipstick elevations from ATS 36 inside wheel path.
0.0
- -0.1 z .._
z 0 -0.2 j:: < > LU -I -0.3 LU
-0.4 0 200 400 600 800 1000 1200
DISTANCE (FT)
FIGURE 8 Rod-and-level elevations from ATS 36 inside wheel path.

Bertrand et al.
0
z
~ -100 u: 0 a: Q.
DIFFERENCE= 1.608 INCHES
-200 ---------~-------....._ ........ .___, 0 200 400 600 800 1000 1200
DISTANCE (FT)
FIGURE 9 Profile comparison of dipstick and rod-and-level on outside wheel path of A TS 36.
Roughness Statistics Comparisons
There are several roughness statistics that can be used to evaluate the surface roughness characteristics of the pavement. These statistics (as against raw profile data) are necessary for the calibration of response-type equipment. The correlation between the calculated values from Class I instruments are regressed against the output of an Individual RTRRM system. For this evaluation. the IRI, root mean square vertical acceleration (RMSVA), serviceability index (SI), and a simulated Maysmeter output (MO) were calculated. The IRI and RMSV A calculations are based on the raw elevation data from the dipstick and the rod-and-level survey. These statistics were calculated for each wheelpath in a test section. In addition, the dipstick was run in the reverse direction on each wheelpath, generating two sets of IRI and RMSY A statistics per wheelpath. The SI and MO statistics are based on the 4- and 16-ft wavelengths of the RMSV A statistic. The calculations for these wavelengths are averaged for both wheelpaths of a test section and the average is used for the calculations (I 3).
0
...... z --w -100 ...J Li: 0 a: Q.
DIFFERENCE = 3.605 INCHES
10 1
Tables 1-5 present the summary statistic results from the dipstick and rod-and-level surveys performed on ATS Sections 42, 36, and 04. These sections were chosen for comparison because they represented a range of pavement surface roughness. The areas where spikes were noticed in the rodand-level data had to be adjusted. and the process for adjusting this data involved averaging the data points before and after the spike and using this value as the adjusted data point. The shorter wavelengths from the rod-and-level survey data were affected to the greatest degree, even after the data were adjusted. Tables 4-6, which compare RMSY A by wavelength, indicate that, as the wavelength increases, the better the dipstick and the rod-and-level compare.
CONCLUSIONS AND RECOMMENDATIONS
Where response-type roughness devices are used to monitor the condition of low-volume highway networks, there is a distinct need for a high-resolution profile instrument to maintain paved calibration sections. Typically, such sections are. as described in this study, on paved highways having a full range of roughness and where truck usage is low. The relatively short length of calibration sections-normally 0.2 mimakes it feasible to employ labor-intensive methods of profile determination. Rod-and-level methods can be used (14) but are expensive, slow, and, consequently, troublesome. The dipstick appears to be a workable alternative to rod-and-level methods, and the CTR study has demonstrated its potential. The general conclusions are as follows:
1. The manual-read version of the dipstick is an effective Class I profiling instrument, as long as operational techniques, including loop-closing and repeat run , are followed. It is many times faster than the rod-and-level surveying method. and has a resolution 12 times better, making it an extremely accurate device.
2. The 1989 auto-read version of the dipstick was determined to be unsuitable as a Class I profiling instrument. In particular, the device frequently failed to record a change in elevation and, in addition , was susceptible to false readings;
-2001....-.___L-._.____.L--__.,____.L--___ .....___..____. _ __. _ __. _ __. 0 200 400 600 800 1000 1200
DISTANCE (FT)
FIGURE IO Profile comparison of dipstick and rod-and-level on inside wheel path of ATS 36.

TABLE 2 DIPSTICK VERSUS ROD-AND-LEVEL IRI STATISTICS
DIPSTICK ROD-AND-LEVEL
ATS Numhcr
04
36
42
Wheel Path I
IS(F)
IS(R)
OS(F)
OS(R)
IS(F)
IS(R)
OS(F)
OS(R)
IS(F)
IS(R)
OS(F)
OS(R)
IRI (in/mil~)
280.2
277.8
352.3
349.4
97.4
101.0
154.2
142.7
88.7
91.7
93 .6
93 .9
IRI (in/mile)
280.16
352.39
112.03
158.74
95.46
99.42
IJS(F) indicates inside wheel path forward direction, IS(R) indicates reverse direction, OS(F) indicates outside wheel
path forward direction, OS(R) indicates reverse direction.
TABLE 3 DIPSTICK VERSUS ROD-AND-LEVEL SI AND MO STATISTICS
DIPSTICK ROD-AND-LEVEL
ATS Number Wheel Path! SI MO SI MO
04 JS 1.365 194.82 1.34 196.67
OS 1.357 194.82
36 IS 3.26 72.87 3.26 72.79
OS 3.34 69.56
42 IS 4.068 40.75 3.88 47.57
OS 4.089 40.01
I JS indicates inside wheel path, OS indicates outside wheel path.
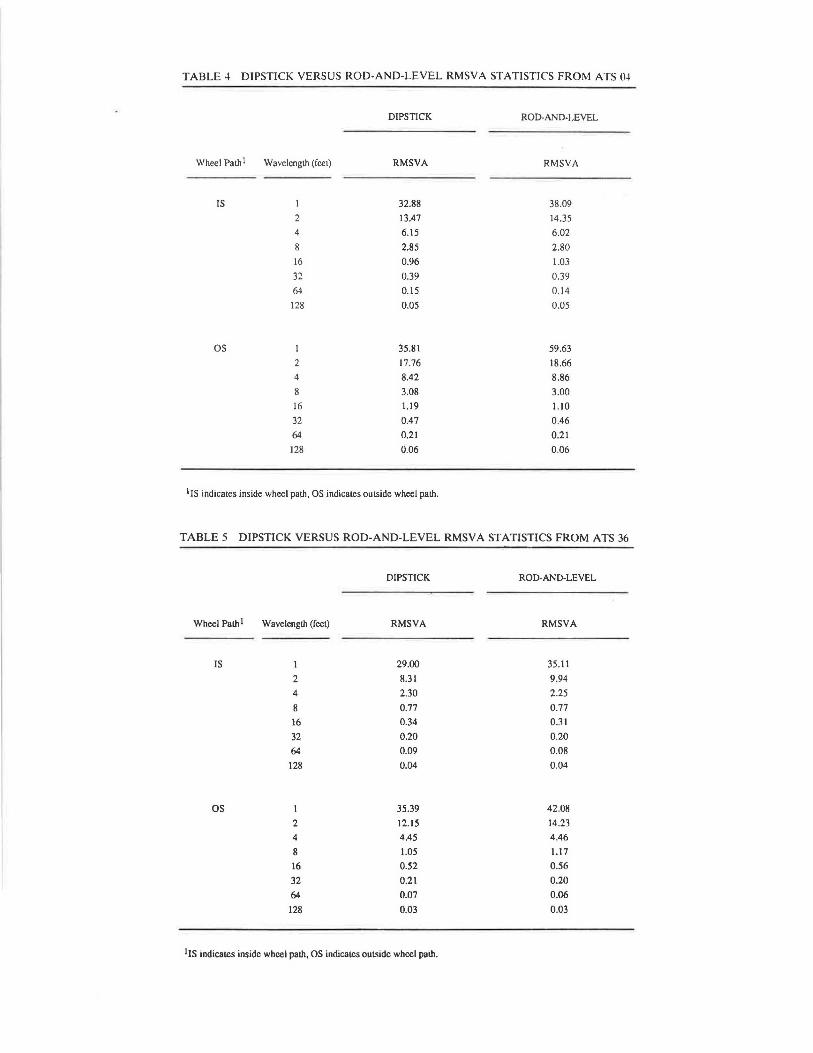
TABLE 4 DIPSTICK VERSUS ROD-AND-LEVEL RMSVA STATISTIC'S FROM ATS 04
DIPSTICK ROD-AND-LEVEL
Wheel Path! Wavelength (feet) RMSVA RMSVA
IS I 32.88 38.09
2 13.47 14.35
4 6.15 6.02
8 2.85 2.80
16 0.96 1.03
32 0.39 0.39
64 0.15 0.14
128 0.05 0.05
OS 1 35.81 59.63
2 17.76 18.66
4 8.42 8.86
8 3.08 3.00
16 1.19 1.10
32 0.47 0.46
64 0.21 0.21
128 0.06 0.06
I IS indicates inside wheel path, OS indicates outside wheel path.
TABLE 5 DIPSTICK VERSUS ROD-AND-LEVEL RMSVA STATISTICS FROM ATS 36
Wheel Path I Wavelength (feet)
IS I
OS
2 4
8
16
32
64
128
I
2
4
8 16
32
64
128
DIPSTICK
RMSVA
29.00
8.31
2.30
0.77
0.34
0.20
0.09
0.04
35.39
12.15
4.45
l.05
0.52
0.21
0.07
0.03
I IS indicates inside wheel path, OS indicates outside wheel path.
ROD-AND-LEVEL
RMSVA
35.11
9.94
2.25
0.77
0.31
0.20
0.08
0.04
42.08
14.23
4.46
1.17
0.56
0.20
0.06
0.03

104 TRANSPORTA TION RESEA RCH R ECOR D 1291
TAB LE 6 DIPSTICK VERSUS ROD-AND-LEVEL RMSVA STATISTICS FROM ATS 42
DIPSTICK ROD-AND-LEVEL
Wheel Path! Wavelength (feel) RMSVA RMSVA
IS 13.86 21.18
2 4.67 6.14
4 1.95 2.20
8 0.89 0.95
16 0.41 0.41
32 0.22 0.22
64 0.12 0.12
128 0.08 0.08
OS 16.84 21.67
2 5.63 6.97
4 2.08 2.42
8 0.91 0.99
16 0.36 0.37
32 0.21 0.19
64 0.13 0.12
128 0.08 0.07
I 15 indicates inside wheel path, OS indicates outside wheel path.
both problems pose severe drawbacks in terms of instrument repeatability and reliability. Even the use of two dipsticks on the same section did not entirely overcome these problems and, thus, the method did not represent a feasible operation . The manufacturer has been provided with a list of recommended design , hardware , and software changes the CTR staff consider necessary for upgrading this to a reliable Class I device. If the manufacturer incorporates these recommendations into a new model, the modified version should be fully evaluated before field use.
3. Both versions of the dipstick showed instrument-toinstrument differences in sensitivity that are believed to result from variations in production quality control related to the internal inclinometers. The manufacturer is aware of this problem, and current versions may provide more consistent inclinometer performance. Nevertheless, a user should check the calibration of each new dipstick and evaluate its performance against a rod-and-level survey, or against a proven dipstick before field use.
The need to calibrate response-type roughness measuring devices against high-resolution profiles of paved highway sections can therefore be addressed by using the manual dipstick . The instrument, when properly calibrated and operated, can give profiles as good as those from rod-and-level surveys at a fraction of the time and cost. Guidance on appropriate calibration and operation has been reported and can be supplemented by more detailed examination of a CTR report (15) . Those responsible for the effective management of low-
volume road systems, where response-type devices are employed to monitor surface condition, can use the manual dipstick as an integral part of the calibration process. Properly calibrated instruments will produce condition data that can be employed to enhance the effectiveness of the increasing number of low-volume pavement management systems now being instituted throughout the world .
REFERENCES
1. Road Deterioration in Developing Countries: Causes and Remedies . World Bank Policy Study. World Bank, Washington , D.C., 1988.
2. T. Watanatada , C. G. Harral. W. D. 0. Paterson , A. M. Dhareshwar, A . Bhandari , and K. Tsunokawa. The Highway Design and Maintenance S1andards Model (2 vols.). Johns Hopkins University Press, Baltimore, Md .. 1987.
3. R . A. Moyer and R. Winfrey. Cost of Operating Rural Mai/Carrier-Motor Vehicles on Pavement, Gravel and Earth Roads. Iowa Engineering Experiment Station Bulletin 143. Iowa State College, Ames, 1939.
4. A. Chesher and R. Harrison. Vehicle Operating Costs: Evidence from Developing Cowztries . Johns Hopkins Press, Baltimore , Md .. 1987.
5. R . Haas and W. R. Hudson. Pavement Management Systems. Robert E. Krieger Publishing, Malabar, Fla., 1978.
6. GEIPOT-Empresa Brasileira de Planejamento de Transportes. Research on the Interrelationships between Costs of Highway Construclion, Maintenance and U1ilization . (12 vols .) Ministerio de Transportes, Brasilia, 1982.

Bertrand et al.
7. M. W. Sayers, T. D. Gillespie. and W. D. 0. Paterson. Guidelines (or Co111luc1i11g f//u/ C11Ubrari11g Road Ro11g/111r . .5 tl'faasrm•mcm~. Technical Pilp~· r-16. World B<lnk. Washington. D .C .. !986.
8. W. 0 . . Paicrson. lmernmional Rouahncss Index: Relationship 111 O ther Measure of Roughness i md Riding Quality. In Tri111sporuuio11 Rese(lrclt Record 1084. TRB . National Resea rch Council. Washington. D.C.. 1986.
9. W. D. 0 . Pater on. Ro11d Dctc•riurt11io11 and Mai11te1w11ce Effects: Mo1/ds for l'l111111i11g "'"' M1111<1[ll!lll C'nt . Johns Hopkins ni\•cr ity Press. Bahimorc. Md .. 1987.
JO . Highway Performance Monitori11g Field Manual . FHWA Public;11ion 5600. IA. Appendix J. U.S. Department of Transportation. Dec. 1987.
11. C. Benrand . R. l·farri on . imd B. F. McCullough. £va!rtmio11 of th11 Perfomumce of tla• Auto·Rt!ad Versio11 o tile Fact! Dipstick. Research Report 969- 1. Ce nter for Tran ·ponation Research. Universi ty or Texas al Au tin . 1989.
105
12. W. Uddin . G. E. Elkin~. and W. R. Hudson . fi>as11remt•t11 11f Pavemem moml111t!s.1. Technical Report . Arizona Dcpanmcnt of Tran porllltion: Austin Re ·carch Engineer . Inc-. Austin. ex .. 1987.
13. D. W. McKenzie. W. R. Hudson. nd C. E. Lee . Tiie Use of Road Profile ·1atistits for Maysmeter Ct1libra1io11 . Re. carch Rc:port 25 1-1. Center for Transportation Resea rch. Univcrsuy or Texa. at Austin, Austin, 1982.
14 . . V. Quciroz. A Procedure for Obtainine a table R uehnc s cale from Rod-and-Level Prorncs. W.orklng Document ·22 . In
Research 011 the /111errelatio11ship. brtwce11 Cost of Highway Co11 -Str11ctio11 , Mt1i111e11a11ce. and Utilizarion . GEIPOT- mpresa Brasilci ra de Planejamcnto de Transpon cs. Brasilia. 1979.
15. . Bertrand. R. Harrison . and B. F. Mc ull ugh . E1·ahwtic>11 of the Performmtef of the A111o·Read Ve~ ion of till' fafe Dipstick. Research Report 969-2F. Center for Tr;111spor1ation Re carch . University of Texas at Austin . 1990.