evaluation of chemically regenerated activated … · carbon (sparac) for sugar decolourisation b...
TRANSCRIPT

EVALUATION OF CHEMICALLY REGENERATED ACTIVATED CARBON (SPARAC) FOR SUGAR DECOLOURISATION
B BARKER1, S B DAVIS1 and M SCHOLTEN2
1Sugar Milling Research Institute, University of Natal Durban, 4041, South Africa
2Norit Nederland BV, Nijverheidsweg-Noord 72 3812 PM Amersfoort E-mail: [email protected]
Abstract
Norit Carbon has developed a chemically regenerable activated carbon (SPARAC) that is suitable for sugar decolourisation. Previous evaluation of this activated carbon showed promising results, and Norit developed another grade of SPARAC that had faster adsorption kinetics. This carbon has been evaluated in terms of its colour removal performance after successive regenerations. Decolourisation trials were performed at the SMRI using brown liquor and a pilot plant supplied by Norit. The effects of suspended solids, different regeneration techniques and different throughputs on carbon performance were investigated. Results show that, although there is a large-drop off in carbon performance after the virgin cycle, fairly constant performance is obtained after further regenerations. The design of a larger scale pilot plant, based on the test data, is also discussed. Keywords: activated carbon, decolourisation, sugar colour, colour removal
Introduction Thermally regenerated granular activated carbon has proven a very effective way of removing colour during sugar refining (Debwe, 2001). However, this type of regeneration requires a large amount of energy and expensive equipment. Norit Nederland BV developed a carbon called SPARAC that can be chemically regenerated in situ offering considerable capital and carbon savings and ease of application. Extensive tests have already been completed with this type of carbon by Moodley et al. (2000), with promising results. Norit then developed a new type of SPARAC with faster adsorption kinetics that should be able to perform at higher throughputs than the previous grade. This new SPARAC needed to be evaluated in terms of its lifetime and colour removal performance. Results of initial tests performed were published by Barker and Davis (2002), and this paper presents the results of these and more extensive tests.
Experimental
Equipment All work was carried out at the Sugar Milling Research Institute (SMRI) on a pilot plant that was on loan from Norit. The pilot plant consists of four hot water jacketed glass columns which are designed to operate in series. The flow rate of the feed to the columns is controlled automatically by a peristaltic pump and a magnetic flow-meter which provides an accurate and consistent liquor flow. Each column can hold 2 L of liquid. The pilot plant is described in more detail by Barker and Davis (2002). Carbon preparation The SPARAC that was supplied by Norit had a size range from 0,7 to 1,2 mm, which is smaller than the previous grade of SPARAC that was used by Moodley et al. (2000).
Proc S Afr Sug Technol Ass (2003) 77
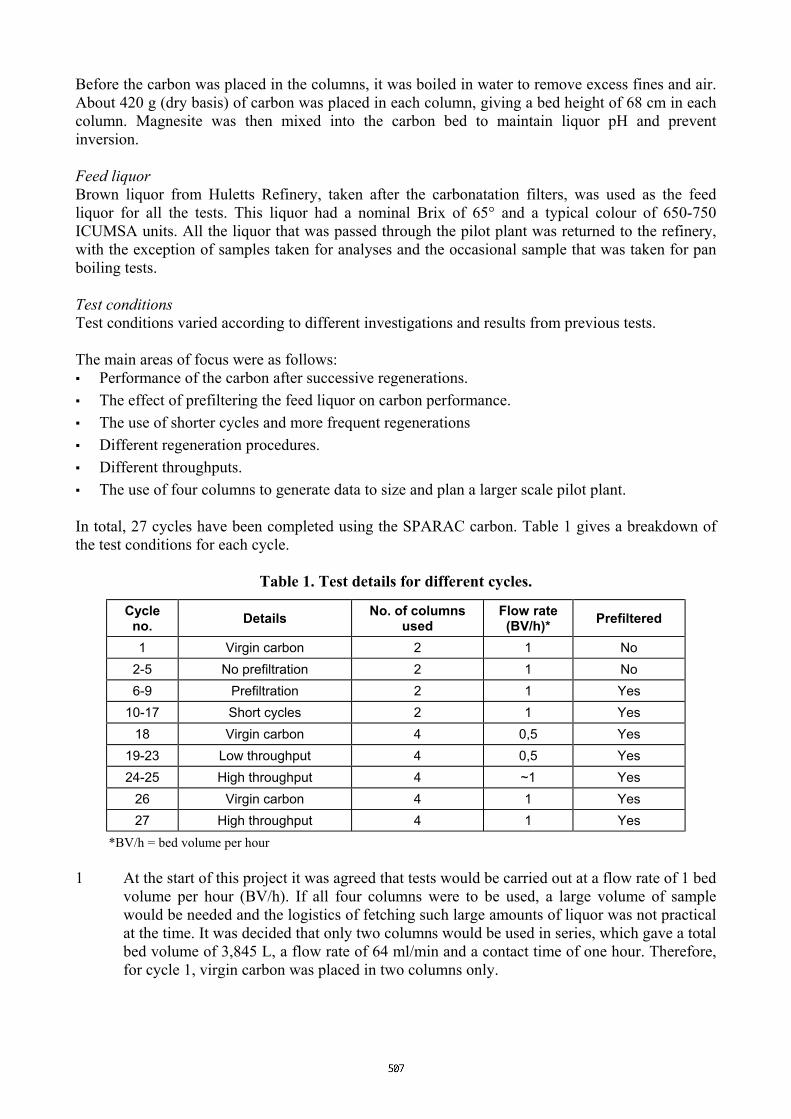
Before the carbon was placed in the columns, it was boiled in water to remove excess fines and air. About 420 g (dry basis) of carbon was placed in each column, giving a bed height of 68 cm in each column. Magnesite was then mixed into the carbon bed to maintain liquor pH and prevent inversion. Feed liquor Brown liquor from Huletts Refinery, taken after the carbonatation filters, was used as the feed liquor for all the tests. This liquor had a nominal Brix of 65° and a typical colour of 650-750 ICUMSA units. All the liquor that was passed through the pilot plant was returned to the refinery, with the exception of samples taken for analyses and the occasional sample that was taken for pan boiling tests. Test conditions Test conditions varied according to different investigations and results from previous tests. The main areas of focus were as follows: ▪ Performance of the carbon after successive regenerations. ▪ The effect of prefiltering the feed liquor on carbon performance. ▪ The use of shorter cycles and more frequent regenerations ▪ Different regeneration procedures. ▪ Different throughputs. ▪ The use of four columns to generate data to size and plan a larger scale pilot plant. In total, 27 cycles have been completed using the SPARAC carbon. Table 1 gives a breakdown of the test conditions for each cycle.
Table 1. Test details for different cycles.
Cycle no. Details No. of columns
used Flow rate (BV/h)* Prefiltered
1 Virgin carbon 2 1 No 2-5 No prefiltration 2 1 No 6-9 Prefiltration 2 1 Yes
10-17 Short cycles 2 1 Yes 18 Virgin carbon 4 0,5 Yes
19-23 Low throughput 4 0,5 Yes 24-25 High throughput 4 ~1 Yes
26 Virgin carbon 4 1 Yes 27 High throughput 4 1 Yes
*BV/h = bed volume per hour 1 At the start of this project it was agreed that tests would be carried out at a flow rate of 1 bed
volume per hour (BV/h). If all four columns were to be used, a large volume of sample would be needed and the logistics of fetching such large amounts of liquor was not practical at the time. It was decided that only two columns would be used in series, which gave a total bed volume of 3,845 L, a flow rate of 64 ml/min and a contact time of one hour. Therefore, for cycle 1, virgin carbon was placed in two columns only.
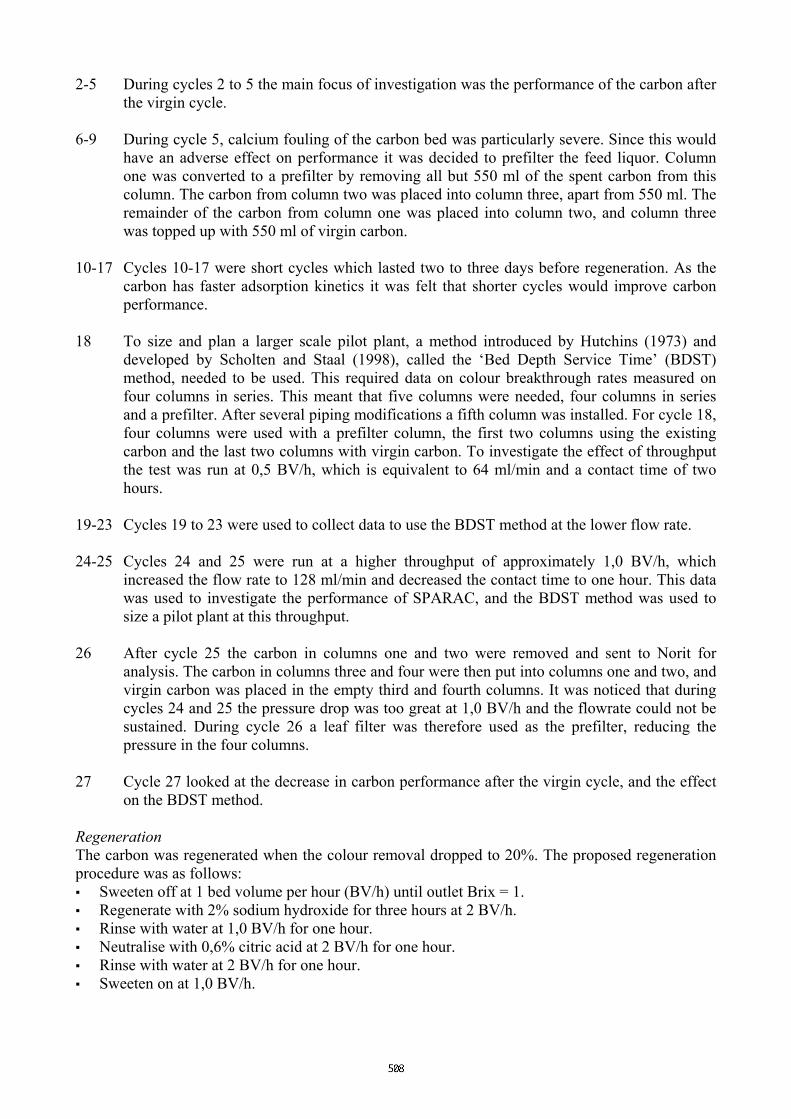
2-5 During cycles 2 to 5 the main focus of investigation was the performance of the carbon after the virgin cycle.
6-9 During cycle 5, calcium fouling of the carbon bed was particularly severe. Since this would
have an adverse effect on performance it was decided to prefilter the feed liquor. Column one was converted to a prefilter by removing all but 550 ml of the spent carbon from this column. The carbon from column two was placed into column three, apart from 550 ml. The remainder of the carbon from column one was placed into column two, and column three was topped up with 550 ml of virgin carbon.
10-17 Cycles 10-17 were short cycles which lasted two to three days before regeneration. As the
carbon has faster adsorption kinetics it was felt that shorter cycles would improve carbon performance.
18 To size and plan a larger scale pilot plant, a method introduced by Hutchins (1973) and
developed by Scholten and Staal (1998), called the ‘Bed Depth Service Time’ (BDST) method, needed to be used. This required data on colour breakthrough rates measured on four columns in series. This meant that five columns were needed, four columns in series and a prefilter. After several piping modifications a fifth column was installed. For cycle 18, four columns were used with a prefilter column, the first two columns using the existing carbon and the last two columns with virgin carbon. To investigate the effect of throughput the test was run at 0,5 BV/h, which is equivalent to 64 ml/min and a contact time of two hours.
19-23 Cycles 19 to 23 were used to collect data to use the BDST method at the lower flow rate. 24-25 Cycles 24 and 25 were run at a higher throughput of approximately 1,0 BV/h, which
increased the flow rate to 128 ml/min and decreased the contact time to one hour. This data was used to investigate the performance of SPARAC, and the BDST method was used to size a pilot plant at this throughput.
26 After cycle 25 the carbon in columns one and two were removed and sent to Norit for
analysis. The carbon in columns three and four were then put into columns one and two, and virgin carbon was placed in the empty third and fourth columns. It was noticed that during cycles 24 and 25 the pressure drop was too great at 1,0 BV/h and the flowrate could not be sustained. During cycle 26 a leaf filter was therefore used as the prefilter, reducing the pressure in the four columns.
27 Cycle 27 looked at the decrease in carbon performance after the virgin cycle, and the effect
on the BDST method. Regeneration The carbon was regenerated when the colour removal dropped to 20%. The proposed regeneration procedure was as follows: ▪ Sweeten off at 1 bed volume per hour (BV/h) until outlet Brix = 1. ▪ Regenerate with 2% sodium hydroxide for three hours at 2 BV/h. ▪ Rinse with water at 1,0 BV/h for one hour. ▪ Neutralise with 0,6% citric acid at 2 BV/h for one hour. ▪ Rinse with water at 2 BV/h for one hour. ▪ Sweeten on at 1,0 BV/h.

However, this procedure was modified during the cycles. Due to calcium salt fouling in the carbon bed, hydrochloric acid was used during some cycles before regeneration with NaOH. Removal of the calcium salts before the liquor entered the carbon bed was a better option and the HCl step was replaced with a prefiltration step. The regeneration step with NaOH was increased to six hours, as carbon performance was lower than expected. Barker and Davis (2002) also showed that the neutralisation step with citric acid caused a large pH drop when sweetening on, which could result in sugar losses. This step was thus removed and the rinsing step was increased until the pH of the rinse water was about 9. When four columns were being used the regeneration with NaOH was increased to 12 hours before rinsing. Operational problems There were a number of problems that were encountered during these trials. Air bubbles appeared occasionally in the carbon bed and had to be removed by backwashing the columns. Backwashing disrupted the breakthrough gradients but was necessary as air prevented contact between the carbon and the liquor and increased the pressure drop. Another problem was occasional dips in the power supply, as the hot water circulator, pumping hot water through the jacketed columns, would not reset itself, while the feed liquor pump did. This resulted in cold feed liquor being pumped through the carbon at lower than the required flowrate, due to the increase in pressure across the columns. Pilot plant boilings To investigate the colour transfer from mother liquor to sugar, samples of feed liquor and product liquor were taken for boiling in the SMRI pilot plan following their standard procedure. Samples of fine liquor were also taken and boiled for comparison.
Previous work A Short Communication by Barker and Davis (2002) has already been presented. The main conclusions were as follows: ▪ Overall carbon performance was lower than expected with decolourisations between 20 and
40%, at flowrates of 1,0 BV/h. ▪ There was a large drop in performance after the virgin cycle but successive cycles showed
consistent performance. ▪ The carbon performance can be improved by prefiltering the feed liquor and by running shorter
cycles. Results
Colour loading Carbon performance can best be visualised by investigating the amount of colour that has been adsorbed or ‘loaded’. Colour loading is the cumulative units of colour removed multiplied by the mass of Brix passed (kg) divided by the volume of carbon (L). This method gives information about the effectiveness of colour removal and can be linked to operating and regenerating procedures. The overall colour loadings for the various investigations are shown in Table 2.

Table 2. Colour loading (kg IU/L carbon) values for the different cycles.
Cycle no. Test condition 12 BV 25 BV 38 BV 50 BV 100 BV
1 Virgin carbon 9200 16800 21100 24000 31100
2-5 No prefiltration 3700 6100 8000 9600 15200
6-9 Prefiltration 3400 6000 8300 10200 17500
10-17 Short cycles 4100 7000 9600 11700
18 Virgin carbon 2900 6700 10800 14900
19-23 Low throughput 4900 9200 13300 16900
24-25 High throughput 2700 4900 6900 8600 15100
26 Virgin carbon 4900 8900 12600 15800 28000
27 High throughput 3100 5300 7300 9000 15000
The following comments can be made from the data: ▪ There is a significant decrease in the colour loading after the virgin cycle.
▪ There is an improvement in carbon performance with the prefilter, which is more evident with increasing bed volumes.
▪ The performance of the carbon is improved when the cycle times are reduced.
▪ Running at lower throughputs increases the colour loading of the carbon; however, the processing time doubles.
Data from the cycles run at 1,0 BV/hr and 0,5 BV/h were used to find the overall trend in colour loading. Data from the virgin cycles were excluded from the investigation, and only volumes up to about 120 BV were considered. The results are shown in Figure 1.
0
5000
10000
15000
20000
25000
30000
35000
40000
0 20 40 60 80 100 120 140
Bed volum es
0,5 BV/h
1,0 BV/h
Figure 1. Differences in colour loading between higher and lower throughputs. The results show a significant increase in carbon performance at the lower flowrate. This increase is due to the increased contact time of the liquor with the carbon from one hour to two hours.
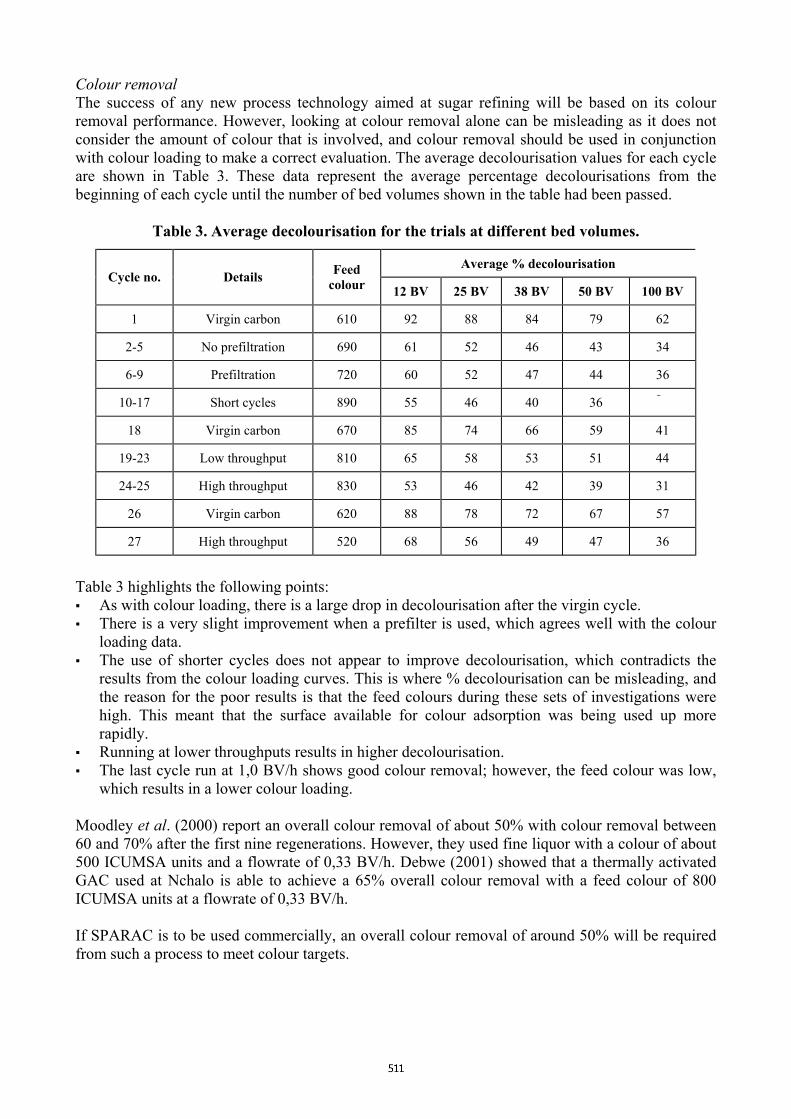
Colour removal The success of any new process technology aimed at sugar refining will be based on its colour removal performance. However, looking at colour removal alone can be misleading as it does not consider the amount of colour that is involved, and colour removal should be used in conjunction with colour loading to make a correct evaluation. The average decolourisation values for each cycle are shown in Table 3. These data represent the average percentage decolourisations from the beginning of each cycle until the number of bed volumes shown in the table had been passed.
Table 3. Average decolourisation for the trials at different bed volumes.
Average % decolourisation Cycle no. Details Feed
colour 12 BV 25 BV 38 BV 50 BV 100 BV
1 Virgin carbon 610 92 88 84 79 62
2-5 No prefiltration 690 61 52 46 43 34
6-9 Prefiltration 720 60 52 47 44 36
10-17 Short cycles 890 55 46 40 36
18 Virgin carbon 670 85 74 66 59 41
19-23 Low throughput 810 65 58 53 51 44
24-25 High throughput 830 53 46 42 39 31
26 Virgin carbon 620 88 78 72 67 57
27 High throughput 520 68 56 49 47 36
Table 3 highlights the following points: ▪ As with colour loading, there is a large drop in decolourisation after the virgin cycle. ▪ There is a very slight improvement when a prefilter is used, which agrees well with the colour
loading data. ▪ The use of shorter cycles does not appear to improve decolourisation, which contradicts the
results from the colour loading curves. This is where % decolourisation can be misleading, and the reason for the poor results is that the feed colours during these sets of investigations were high. This meant that the surface available for colour adsorption was being used up more rapidly.
▪ Running at lower throughputs results in higher decolourisation. ▪ The last cycle run at 1,0 BV/h shows good colour removal; however, the feed colour was low,
which results in a lower colour loading. Moodley et al. (2000) report an overall colour removal of about 50% with colour removal between 60 and 70% after the first nine regenerations. However, they used fine liquor with a colour of about 500 ICUMSA units and a flowrate of 0,33 BV/h. Debwe (2001) showed that a thermally activated GAC used at Nchalo is able to achieve a 65% overall colour removal with a feed colour of 800 ICUMSA units at a flowrate of 0,33 BV/h. If SPARAC is to be used commercially, an overall colour removal of around 50% will be required from such a process to meet colour targets.

Figure 2 gives an indication of cycle times that will be required to meet the 50% colour removal target for different feed colours.
70
Fig
Figure 2 ilflowrates. rapidly thafeed colouexpected bhours whil Bed depth The BDSTtool used tup calculatexit feed cpoints fromdeterminedbed. It has unfreasons: ▪ The ca
get eno▪ For the
cycle a▪ Backw Only two ctwo cycles
3 0
3 5
4 0
4 5
50
55
6 0
6 5
0 2 0 4 0 6 0 8 0 10 0
B ed vo lum es
50 0
8 0 0
70 0
8 50
0 ,5
ure 2. Average colour removal of cycles at higher and lower throughputs for different feed colours.
lustrates the difference in carbon performance at different feed colours and at different Overall colour removal with cycles run at 1,0 BV/h (shown in black) decrease more n cycles run at 0,5 BV/h (shown in grey). Feed colour also has an impact, with higher rs resulting in lower colour removal. If a 50% target line is drawn and an average rown liquor colour of about 700 is used, a cycle running at 1,0 BV/h will last about 30 e a cycle running at 0,5 BV/h will last about 100 hours.
service time method introduced by Hutchins (1973) and developed by Scholten and Staal (1998), is a o indicate the time taken for the carbon to be exhausted and this can be used for scaling ions. It requires breakthrough curves to be plotted for each column. The point where the olour from each column exceeds a specified limit is called a ‘breakthrough’ point. These
each column are then plotted against service time and an equation for the slope is . The slope of the BDST line represents the time required to exhaust 1 cm of the carbon
ortunately been very difficult to determine reliable BDST curves, for the following
rbon bed is exhausted very rapidly, especially the first two columns, making it difficult to ugh points to formulate the BDST equation. initial cycles using four columns, the feed liquor colour was not constant throughout the s different batches of feed liquor were collected at different times from the refinery. ashing of the columns upset the breakthrough profile.
ycles, one at 1,0 BV/h and another at 0,5 BV/h, gave reliable BDST curves, and these were used to determine approximate sizing for a larger scale pilot plant.
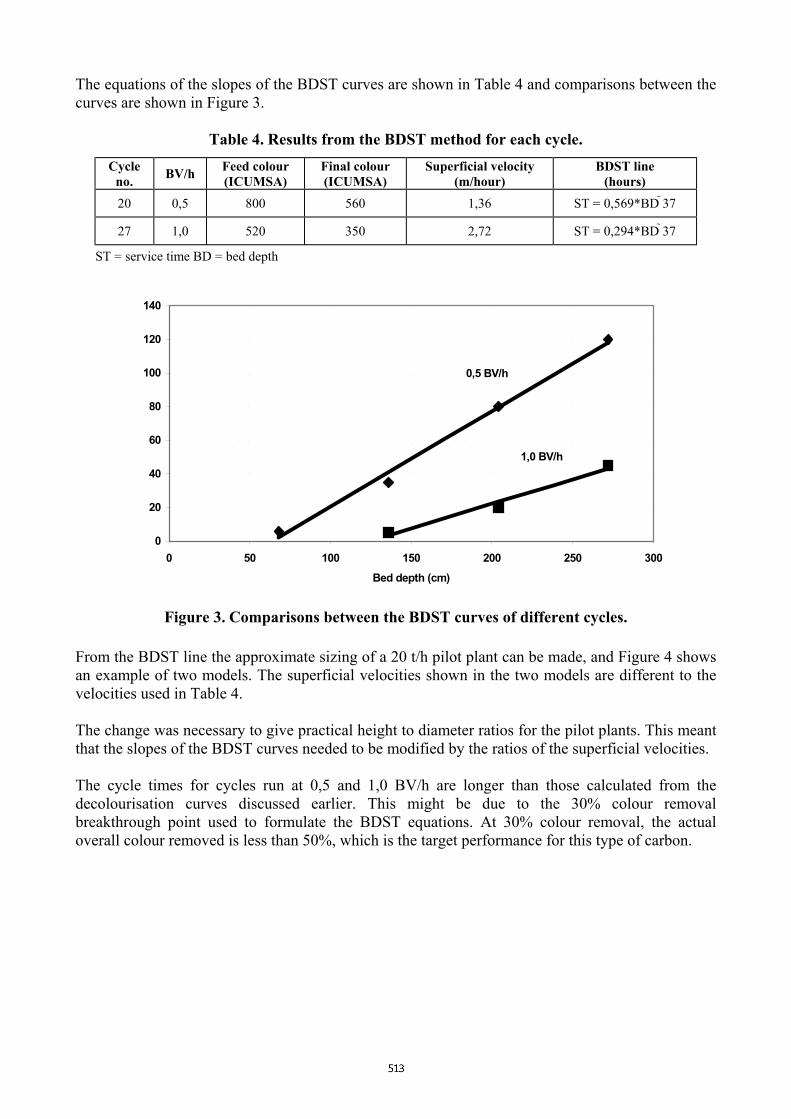
The equations of the slopes of the BDST curves are shown in Table 4 and comparisons between the curves are shown in Figure 3.
Table 4. Results from the BDST method for each cycle.
Cycle no. BV/h Feed colour
(ICUMSA) Final colour (ICUMSA)
Superficial velocity (m/hour)
BDST line (hours)
20 0,5 800 560 1,36 ST = 0,569*BD 37
27 1,0 520 350 2,72 ST = 0,294*BD 37
ST = service time BD = bed depth
Froman evelo Thethat Thedecobreaove
0
20
40
60
80
100
120
140
0 50 100 150 200 250 300Bed depth (cm)
0,5 BV/h
1,0 BV/h
Figure 3. Comparisons between the BDST curves of different cycles.
the BDST line the approximate sizing of a 20 t/h pilot plant can be made, and Figure 4 shows xample of two models. The superficial velocities shown in the two models are different to the cities used in Table 4.
change was necessary to give practical height to diameter ratios for the pilot plants. This meant the slopes of the BDST curves needed to be modified by the ratios of the superficial velocities.
cycle times for cycles run at 0,5 and 1,0 BV/h are longer than those calculated from the lourisation curves discussed earlier. This might be due to the 30% colour removal kthrough point used to formulate the BDST equations. At 30% colour removal, the actual
rall colour removed is less than 50%, which is the target performance for this type of carbon.

Figure 4. Dimensions for a proposed pilot plant according to the bed depth service time method.
Figure 5. Performance of the carbon after 17 regenerations.
Carbon life One of the main objectives of this project was to investigate the number of times the carbon could be regenerated before replacement. Unfortunately, this has been difficult since the performance of the carbon decreases substantially after the virgin cycle.

To determine the actual deterioration in performance of the carbon, cumulative colour loading was plotted against cumulative bed volumes (Figure 5). Only cycles using two columns at 1,0 BV/h were considered. Further cycles used four columns, new carbon and lower flowrates, which would have had an impact on the results. During the first cycle with virgin carbon there is a steep slope, indicating very good performance. During the next cycle there is a considerable drop in performance, but it remains fairly consistent for the rest of the cycles. There was a slight increase in performance around 1500 BV where shorter cycles were being used. What is interesting is that the slope does not plateau, indicating that the carbon performance is not deteriorating. Figure 5 shows that after 1950 BV has been passed through the carbon bed there was no deterioration. Based on a 30 hour cycle time at 1,0 BV/h (the amount of liquor passed will be 30 BV) the carbon would last for a minimum of 65 cycles (1950 BV/30 BV/cycle). The carbon that was used from the beginning of these trials was finally discarded after 2500 BV, which is equivalent to 3500 hours and 25 regenerations. This carbon was sent to Norit for analysis and it was compared to the original carbon. The results are shown in Table 5.
Table 5. Results of analyses of spent SPARAC carbon.
Spent SPARAC % change Analyses Measurement Virgin SPARAC
Col 1 Col 2 Col 1 Col 2
Apparent density kg/m3 265 382 420 +44 +58
Iodine no. 750 425 405 43 46
Calcium mass % 0,01 1,5 1,8
Ash mass % 2,4 14,2 25,4 +500 +1000
The following comparisons can be made between the spent carbon and the virgin carbon: ▪ The density of the spent carbon has increased. ▪ The iodine number of the carbon has decreased substantially; this indicates that the number of
micropores available for adsorption has decreased. ▪ The calcium has also increased, indicating that a large amount of calcium fouling has taken
place. ▪ The ash content of the carbon has also increased. A large part of the ash would come from the
magnesium which is present in magnesite, so this has to be taken into account. Overall, the results show that there has been a lot of calcium contamination within the micropores of the carbon. Carbon samples from both columns show a large degree of calcium fouling, suggesting that calcium ions are the source, as suspended calcium salts are unlikely to pass through the entire carbon bed. It is likely that dissolved residual calcium from the carbonatation process is being chemically precipitated within the carbon pores. Regeneration There have been several changes to the proposed regeneration procedure. The HCl step was removed once a prefilter was installed to remove most of the suspended solids. The rinsing cycle to remove the HCl from the carbon bed was then no longer necessary. However, results of the spent carbon analyses shown in Table 4 suggest that a prefilter may be unable to completely prevent calcium fouling. This would mean that the HCl step may need to be reincorporated into the regeneration procedure. Further investigations will be done.

The actual regeneration of the carbon was with a 2% NaOH solution. For the most part cycles that were run with two columns used a six hour regeneration cycle, and cycles run with four columns used a 12 hour regeneration cycle. However, it was noticed that, at the beginning of the regeneration cycle, a large amount of adsorbed colour is removed, producing a very dark effluent. Once this peak has moved through the carbon, the effluent becomes much lighter in colour and stays consistent throughout the cycle. The amount of colour being removed at this stage is very difficult to quantify, but it appears to be small. Further investigations are necessary to measure the concentrations of the colour removed from the carbon and use the information to decide when to stop the regeneration. In initial tests, a neutralisation step with acid was incorporated into the regeneration procedure to neutralise the NaOH. However, it was shown that the acid used caused a sharp drop in pH while sweetening on at the beginning of a cycle. This step was removed and a longer rinsing cycle was included, which would bring the pH of the effluent down to about 9 after regeneration. The rinsing cycle would last between three and four hours. Isopropyl alcohol, an organic solvent, was used as an extra regeneration step to investigate whether any colour that was not removed by the inorganic caustic would be removed by the alcohol. However, very little colour was removed and it had no impact on carbon performance. Colour transfer Another import aspect that needs to be considered when investigating a new decolourisation process is the amount of colour transfer from feed liquor to crystal. Lionnet (1990) showed that liquor colour is not always a good predictor of crystal colour. Samples of feed and product liquors were taken during certain cycles and boiled in the SMRI pilot plan under identical conditions. Periodic samples of fine liquor from the refinery were also taken for comparative investigations. The resulting sugars from the boiling were affinated and sent with the pan feed liquors for colour analyses. The correlations for the relationship between feed colour and crystal colour are as follows: SMRI Trial Crystal colour = 0,023* pan feed colour + 6,6 (R2 = 0,80; n = 30) Malelane trial** Crystal colour = 0,017* pan feed colour + 3,8 (R2 = 0,89; n = 12) Fine liquor Crystal colour = 0,021* pan feed colour + 6,7 (R2 = 0,84; n = 8)
**Moodley et al. (2000) Since the pan boiling, affination and analysis procedures were identical, the differences between the SMRI trial and the Malelane trial should be due to the different colour compounds present. The trials at Malelane used fine liquor from a carbonatation-sulphitation process, while fine liquor from the refinery was treated by carbonatation-ion exchange. The results from the pan boilings from the Malelane trial show a slightly lower colour transfer, probably due to the different colour bodies present in the liquors. There is also close agreement between the colour transfer results from the SMRI trial and the colour transfer results from the fine liquor, probably because both use the same brown liquor with the same colour impurities present.
Discussion
Overall, this new type of SPARAC has not performed as well as the previous grade of SPARAC and thermally regenerated GAC. Results show that the cycles that use virgin carbon will perform very well. However, during subsequent cycles there is an initial large drop in performance which thereafter remains constant.

It is difficult to give reasons why the performance decreases substantially after only one cycle. One reason may be the types of colours present in the brown liquor. Barker and Davis (2002) suggest that there are two types of colour in Huletts brown liquor, one for which the carbon has a high capacity (type 1) and one for which the carbon has a low capacity (type 2). During a virgin carbon cycle, type 1 is strongly adsorbed, while type 2 is not held as strongly. During regeneration, only the type 2 colour is removed, while the type 1 colour remains adsorbed. Therefore during following cycles the predominant decolourisation is the removal of only the type 2 colour. It is also evident that increasing the regeneration time with caustic, using HCl and using an organic solvent (isopropyl alcohol) were all insufficient to free extra capacity for the type 1 colour. There was also a decrease in performance during the Malelane trial (Moodley et al., 2000) where the colour removal dropped by about 30% after the first cycle. However, the overall performance after the virgin cycle was not constant, but decreased with successive regenerations. The differences in performance between the SMRI trial and the Malelane trial may be due to the different colour bodies present in the feed liquors. Results from the pan boilings and colour transfers from mother liquor to crystal have indicated that the feed liquors are different. Also, the trials at Malelane did not use a prefilter, and this may have led to the decrease in carbon performance due to calcium fouling. Another reason may be due to calcium fouling during the virgin cycle, where calcium ions precipitate chemically in the carbon. This will lead to a decrease in active adsorption sites and a lower colour removal. The calcium may be removed by using a strong acid such as HCl. Initial trials did regenerate with HCl to remove any calcium present and there was a slight increase in performance. However, the duration of the acid step was short and it is probable that the carbon would need to be soaked to allow the acid to reach the deeper pores before being rinsed. This would need further investigation.
Conclusions The results from these investigations have shown that the new type of SPARAC may not be suitable to run at 1,0 BV/h because of the short cycle times (30 hours), length of regeneration and low throughput. Results have shown that there is a substantial decrease in performance after a virgin cycle but the carbon has, however, shown consistent performance after further regenerations. Several other conclusions can be made from these investigations: ▪ The use of a prefilter improved the performance of the carbon slightly and may have extended
the life of the carbon. The prefilter may not be effective at preventing calcium ions from fouling the carbon.
▪ The use of shorter cycles also had a positive effect on carbon performance. ▪ Running at slower throughput increased performance. Results have shown that, in order meet an
overall 50% colour removal target, a cycle run at 0,5 BV/h would be able to run for about 100 hours, and a cycle run at 1,0 BV would be able to run for about 30 hours.
▪ The BDST method was used to size and plan a larger scale pilot plant of 20 t/h. A rough size and plan of a pilot plant has been given.
It must be noted that all 27 cycles used brown liquor from Huletts refinery as feed liquor. Refineries in different areas decolourise different raw sugars and use different decolourisation techniques.

This will result in feed liquors that have different colour bodies present, which could have an impact on carbon performance.
Further work
▪ Use data to design a factory scale pilot plant. ▪ Investigate the mechanism of calcium fouling and the most effective method of removal.
Acknowledgements
Norit Nederland BV for the supply of the pilot plant, carbon and technical advice; SMRI workshop staff for modifications to the pilot plant; Grace Madokwe for plant operation and colour analyses; Ramesh Ramsumer for pilot plant boilings.
REFERENCES Barker B and Davis SB (2002). Colour removal with the SPARAC process - preliminary results.
Proc S Afr Sug Technol Ass 76: 490-494. Debwe M (2001). Operation and performance of the granular activated carbon plant at Nchalo. Proc
S Afr Sug Technol Ass 75: 337-340. Hutchings RA (1973). New method simplifies design of activated carbon systems. Chem Eng
80(19): 133-138. Lionnet GRE (1990). The use of ion-exchange and sulphitation in the refining of cane raws.
Technical Report No 1570. Sugar Milling Research Institute, University of Natal, Durban, South Africa. 25 pp.
Moodley, M, Staal, E, Scholten, M and Heering, M (2000). Sugar decolourisation with alkali
regenerated activated carbon: pilot plant evaluation at the Malelane Refinery. Proc Sug Ind Technol 59: 1-18.
Scholten MTC and Staal EGJ (1998). New equipment and software enables easy pilot plant testing
of granular activated carbon. Proc Sug Ind Technol 57: 289-298; Poster 743.