evaluation of florida c&d debris groundwater monitoring data presentation discusses: results of...
TRANSCRIPT

Evaluation of Florida C&D Debris Groundwater Monitoring Data
Presentation discusses:• Results of analysis of
groundwater monitoring data
• Results of groundwater modeling exercise
• Original data set from FDEP– Primarily results from 1997 through 1999
• Additional data were collected by UF– Electronically from the district– Hardcopy upon visiting the district– Most recent data:
• End of 2002• Beginning of 2003
Groundwater Monitoring Data

The Data Set
Number of Landfills 81
Total number of sample points 2966
Total Parameters 67
Background sample points 651
Detection/Intermediate/Other sample points 1410
Compliance sample points 905

Data Evaluation Approach
• Step 1: Identify parameters of concern– Eliminate those inorganic parameters that
were rarely detected and also rarely exceeded a target level
– Eliminate those organic parameters that never exceeded a target level
– Remaining parameters: 20
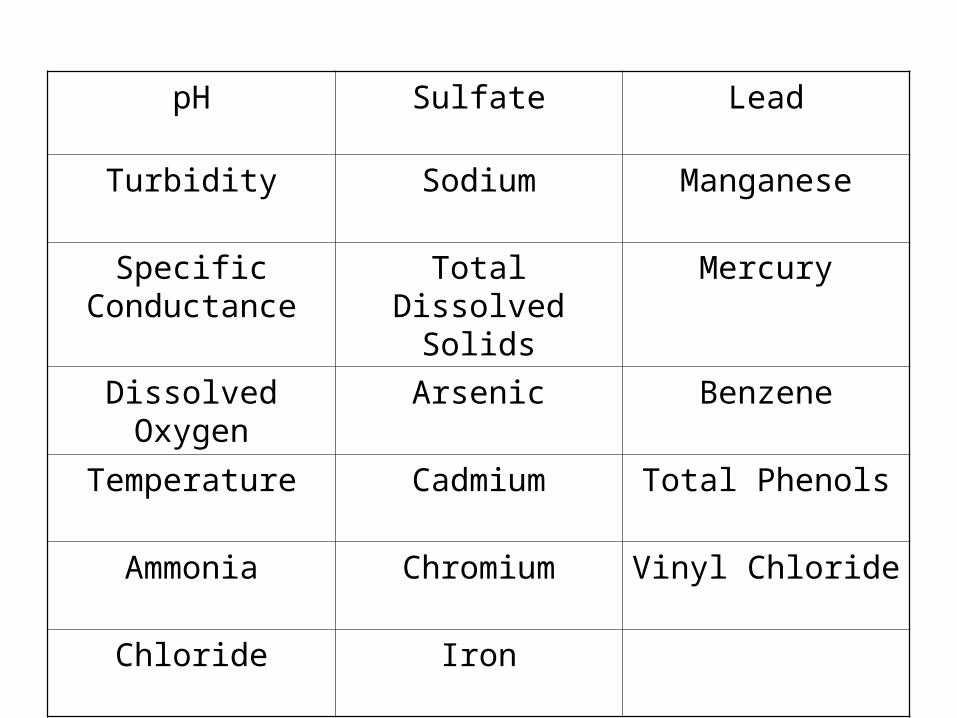
pH Sulfate Lead
Turbidity Sodium Manganese
Specific Conductance
Total Dissolved Solids
Mercury
Dissolved Oxygen Arsenic Benzene
Temperature Cadmium Total Phenols
Ammonia Chromium Vinyl Chloride
Chloride Iron

Data Evaluation Approach
• Step 2: Comparison of Upgradient and Downgradient Wells for Pooled Data Set
• If greater than 50% of the data were above detection limit– Tolerance Limit Test
• If less than 50% of the data were above detection limit– Test of Proportions
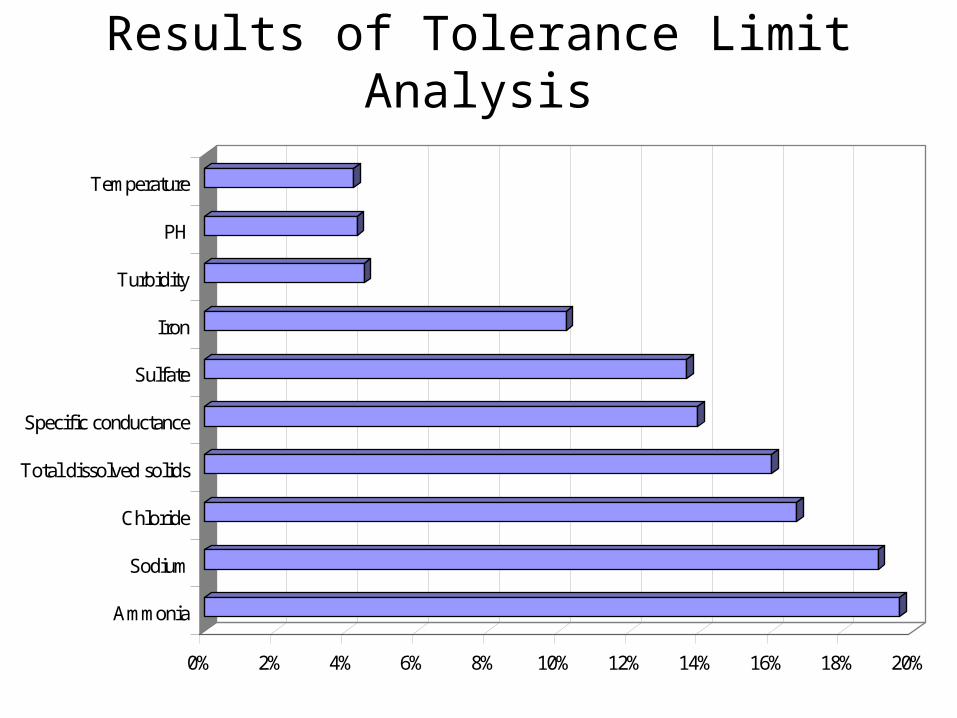
Results of Tolerance Limit Analysis
0% 2% 4% 6% 8% 10% 12% 14% 16% 18% 20%
Ammonia
Sodium
Chloride
Total dissolved solids
Specific conductance
Sulfate
Iron
Turbidity
PH
Temperature

Results of Test of Proportion
• The proportion of samples above the detection limit in the downgradient samples was higher than the proportion above the detection limit in the upgradient samples for:– Arsenic, cadmium, manganese, benzene,
total phenols, vinyl chloride

Graphical Comparison of the Data
• Box and wisker plots were compared for the upgradient and downgradient wells.
Median
25th Percentile
75th Percentile
10th Percentile
90th Percentile

pH
A B C D
pH
4
6
8
10
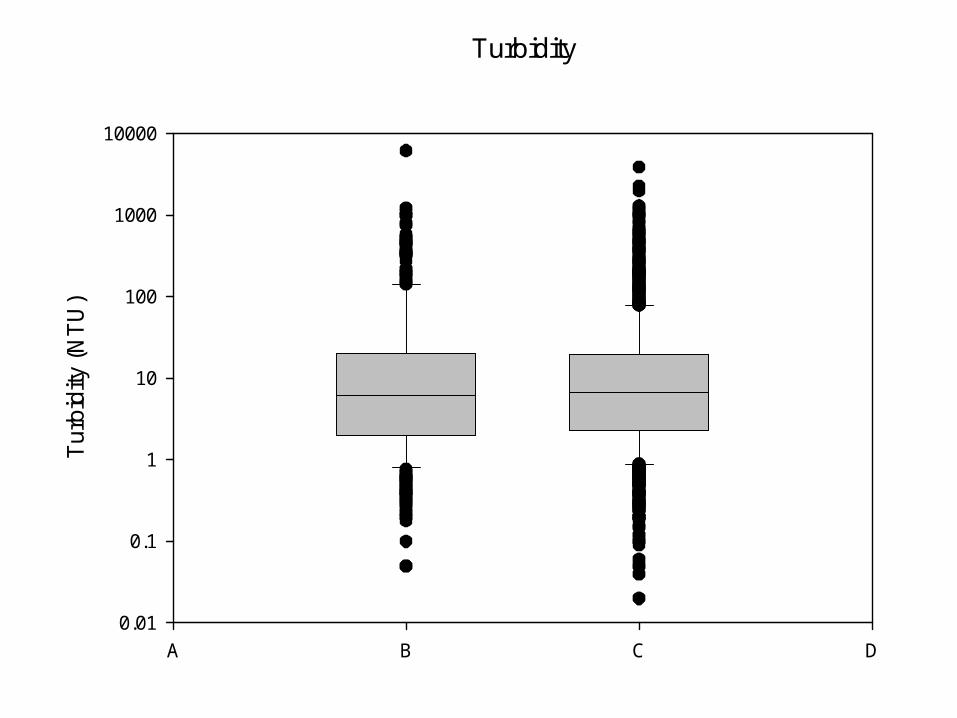
Turbidity
A B C D
Tur
bidi
ty (
NT
U)
0.01
0.1
1
10
100
1000
10000

Specific Conductance
A B C D
Spe
cific
con
duct
ance
(um
hos)
1
10
100
1000
10000
100000

Dissolved Oxygen
A B C D
Dis
solv
ed o
xyge
n (m
g/L)
0
2
4
6
8
10
12
14
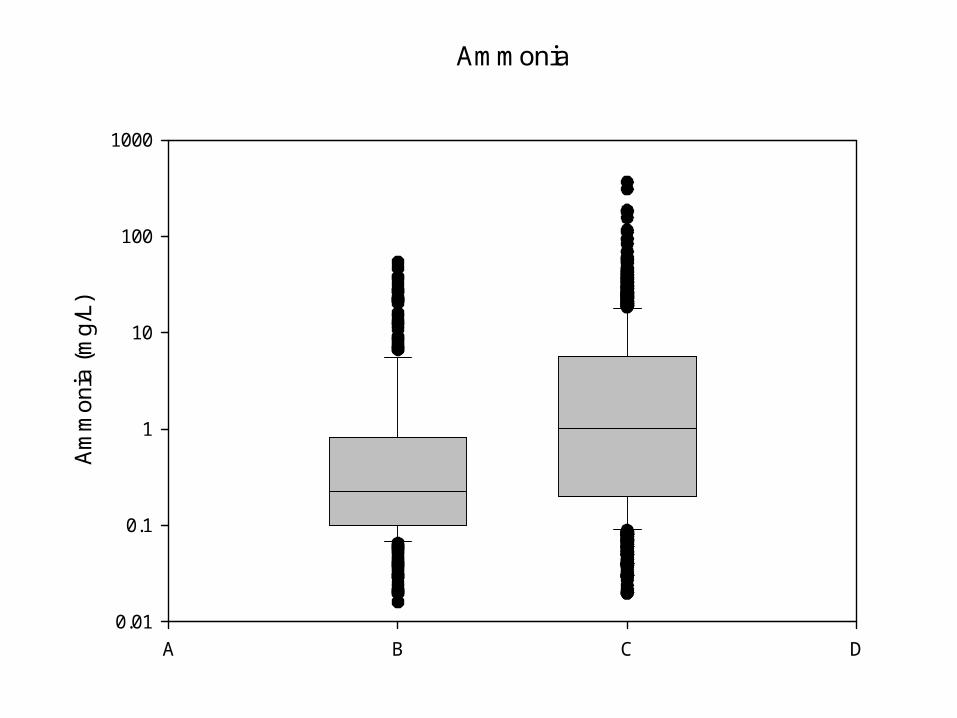
Ammonia
A B C D
Am
mon
ia (
mg/
L)
0.01
0.1
1
10
100
1000
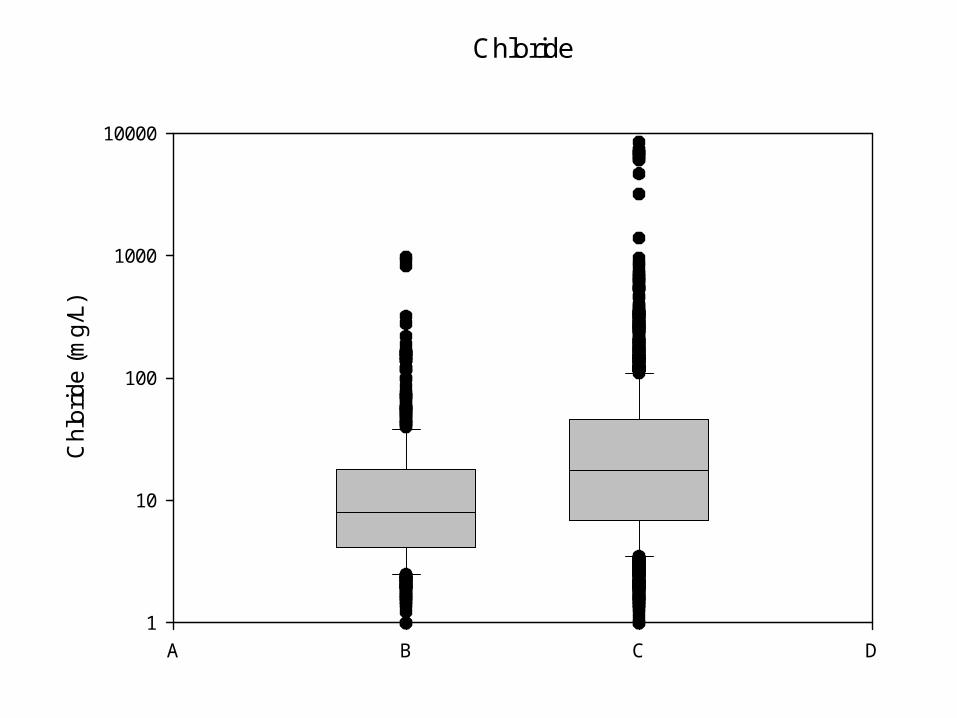
Chloride
A B C D
Chl
orid
e (m
g/L)
1
10
100
1000
10000
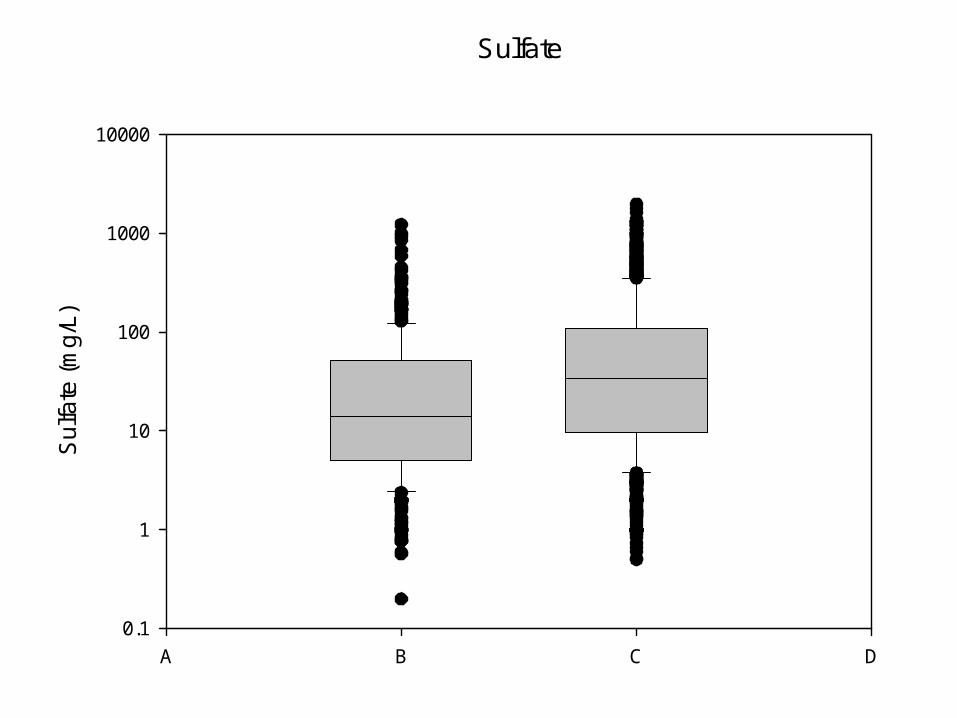
Sulfate
A B C D
Sul
fate
(m
g/L)
0.1
1
10
100
1000
10000
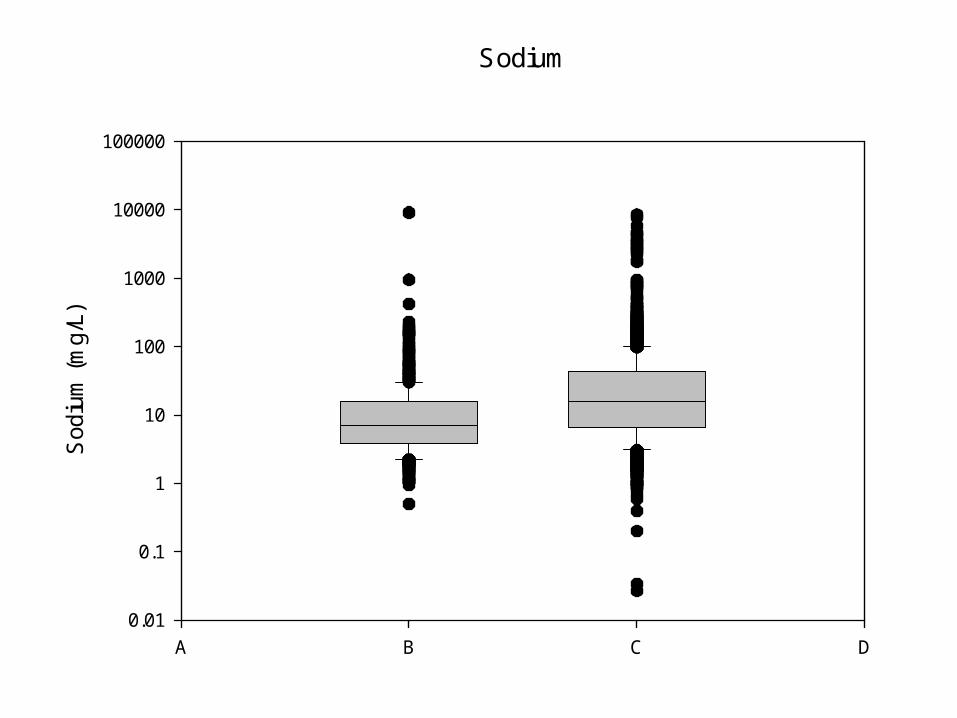
Sodium
A B C D
Sod
ium
(m
g/L)
0.01
0.1
1
10
100
1000
10000
100000

Total dissolved solids (TDS)
A B C D
TD
S (
mg/
L)
1
10
100
1000
10000
100000
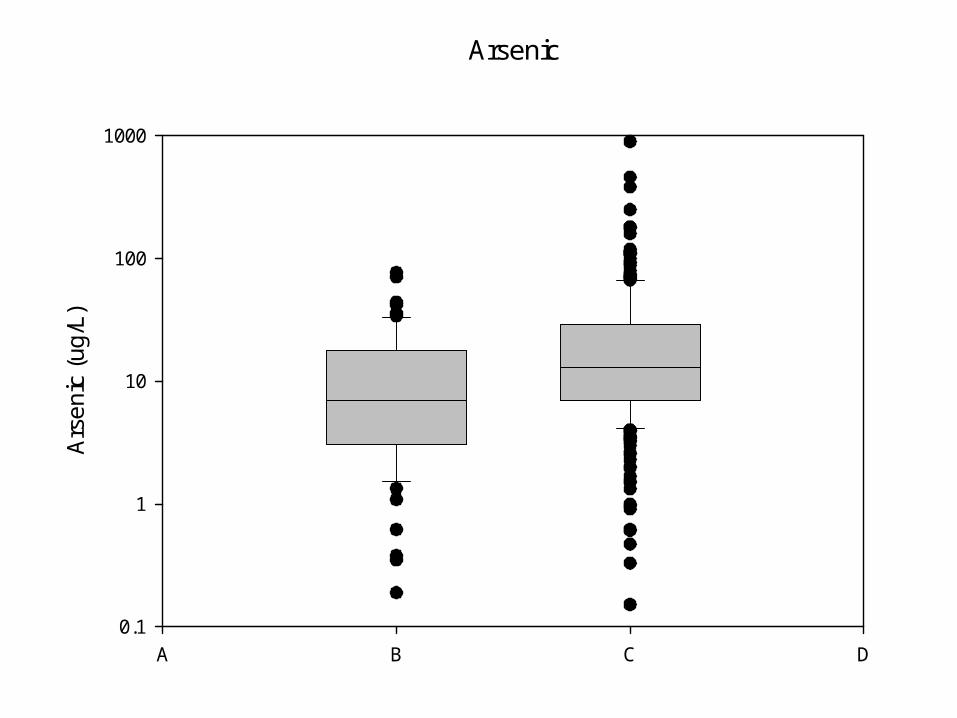
Arsenic
A B C D
Ars
enic
(ug
/L)
0.1
1
10
100
1000

Cadmium
A B C D
Cad
miu
m (
mg/
L)
0.1
1
10
100
1000
10000
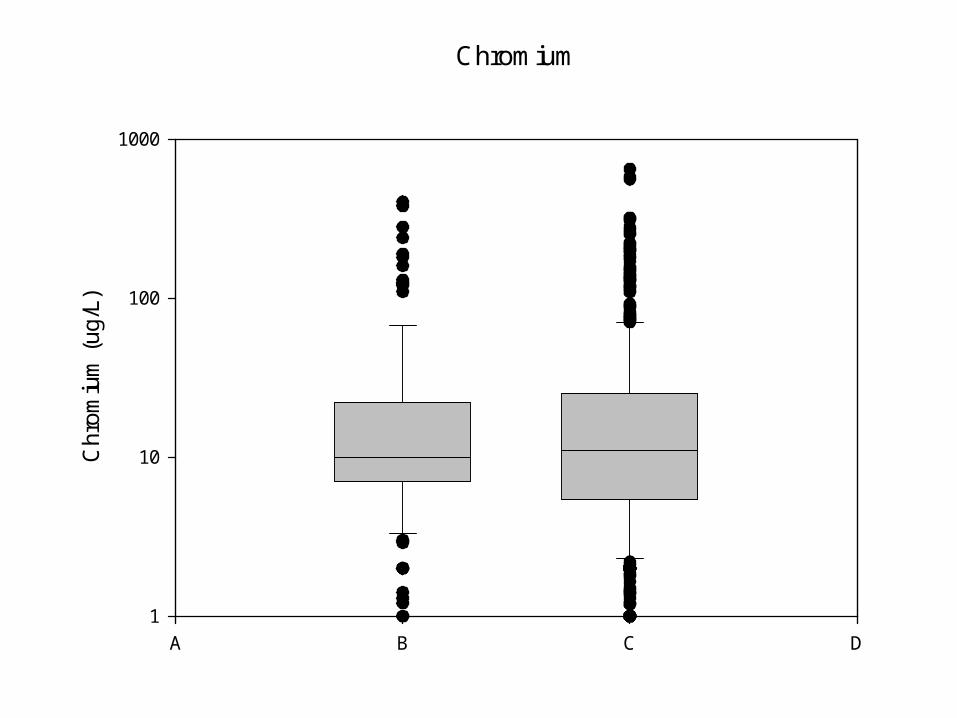
Chromium
A B C D
Ch
rom
ium
(ug
/L)
1
10
100
1000

Iron
A B C D
Iron
(m
g/L)
0.001
0.01
0.1
1
10
100
1000
10000

Lead
A B C D
Lead
(m
g/L)
0.1
1
10
100
1000
10000

Benzene
A B C D
Ben
zene
(ug
/L)
0.01
0.1
1
10
100
1000

Vinyl Chloride
A B C D
Vin
yl C
hlor
ide
(ug/
L)
0.0001
0.001
0.01
0.1
1
10
100
1000
10000

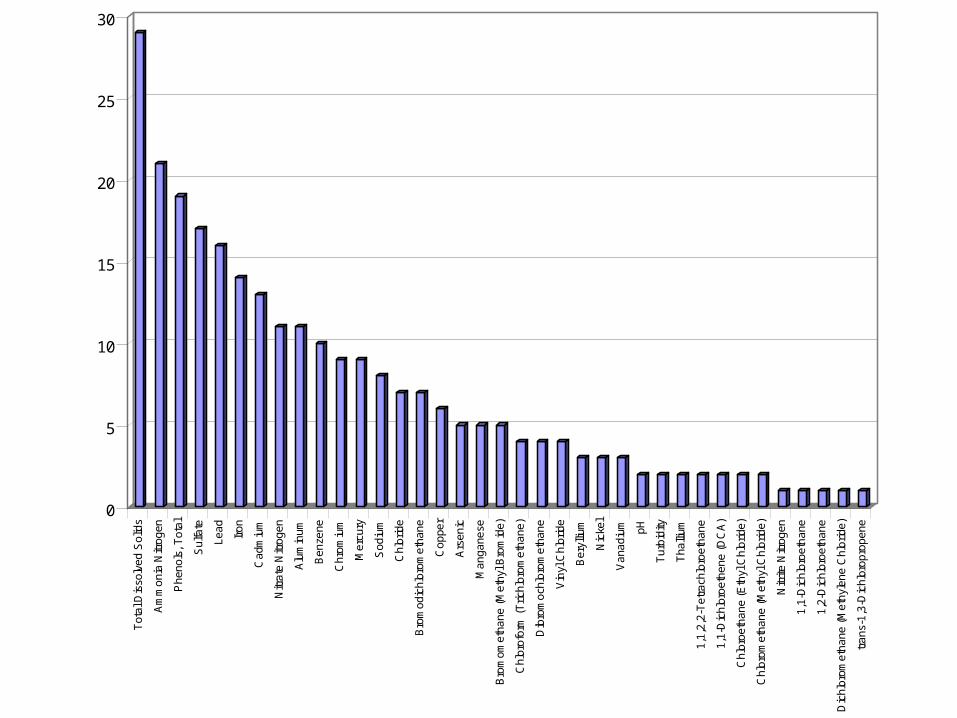
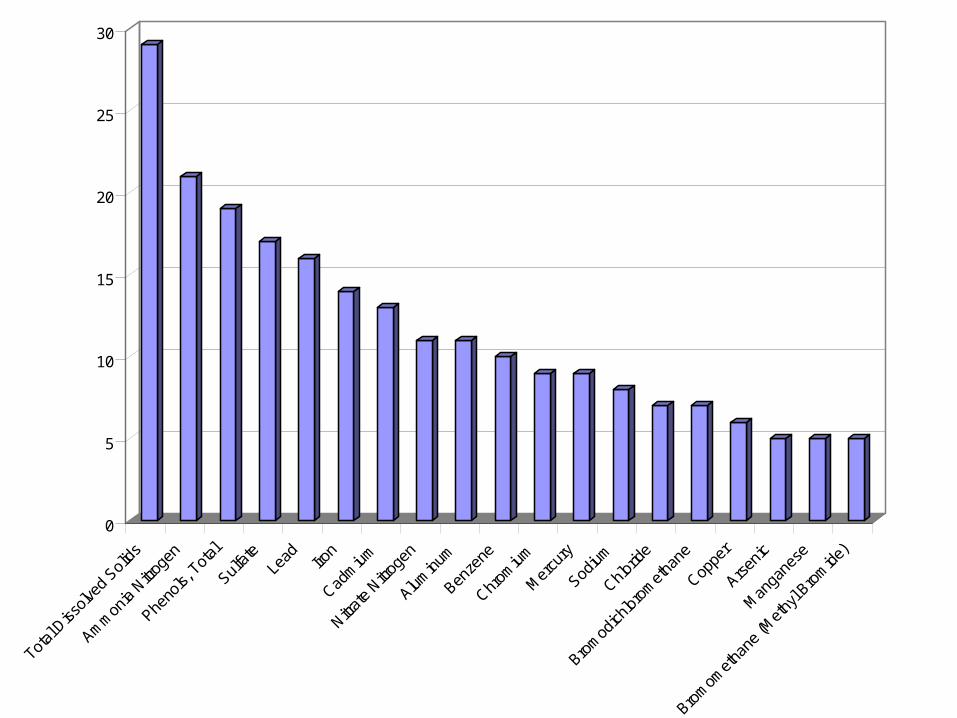
Data Evaluation Approach
• Step 3: Assess the frequency at which groundwater cleanup target levels are exceeded.
• For parameters of concern, calculate the number of sites where a parameter exceeds a target level in a downgradient well where that same parameter it is not exceeded in an upgradient well.
• Only 74 of the 81 sites could be used. Some sites did not have appropriate background wells.
0
5
10
15
20
25
30
Tot
al D
isso
lved
Sol
ids
Am
mon
ia N
itrog
en
Phe
nols
, T
otal
Sul
fate
Lead
Iron
Cad
miu
m
Nitr
ate
Nitr
ogen
Alu
min
um
Ben
zene
Chr
omiu
m
Mer
cury
Sod
ium
Chl
orid
e
Bro
mod
ichl
orom
etha
ne
Cop
per
Ars
enic
Man
gane
se
Bro
mom
etha
ne (
Met
hyl B
rom
ide)
Chl
orof
orm
(T
richl
orom
etha
ne)
Dib
rom
ochl
orom
etha
ne
Vin
yl C
hlor
ide
Ber
ylliu
m
Nic
kel
Van
adiu
m pH
Tur
bidi
ty
Tha
llium
1,1,
2,2-
Tet
rach
loro
etha
ne
1,1-
Dic
hlor
oeth
ene
(DC
A)
Chl
oroe
than
e (E
thyl
Chl
orid
e)
Chl
orom
etha
ne (
Met
hyl C
hlor
ide)
Nitr
ite N
itrog
en
1,1-
Dic
hlor
oeth
ane
1,2-
Dic
hlor
oeth
ane
Dic
hlor
omet
hane
(M
ethy
lene
Chl
orid
e)
tran
s-1,
3-D
ichl
orop
rope
ne
0
5
10
15
20
25
30
Total
Dissolv
ed S
olids
Amm
onia
Nitrog
en
Pheno
ls, T
otal
Sulfat
eLe
ad Iron
Cadm
ium
Nitrat
e Nitr
ogen
Aluminu
m
Benze
ne
Chrom
ium
Mer
cury
Sodium
Chlorid
e
Brom
odich
lorom
etha
ne
Coppe
r
Arsen
ic
Man
gane
se
Brom
omet
hane
(Met
hyl B
rom
ide)

• Of the 74 sites evaluated, 69 sites had at least one exceedance for one parameter in a downgradient well that was not also exceeded in an upgradient well.
Data Evaluation Approach
• Step 4: Look at the data for the sites to see where exceedances are consistent, and where exceedances are one-time or sporadic.
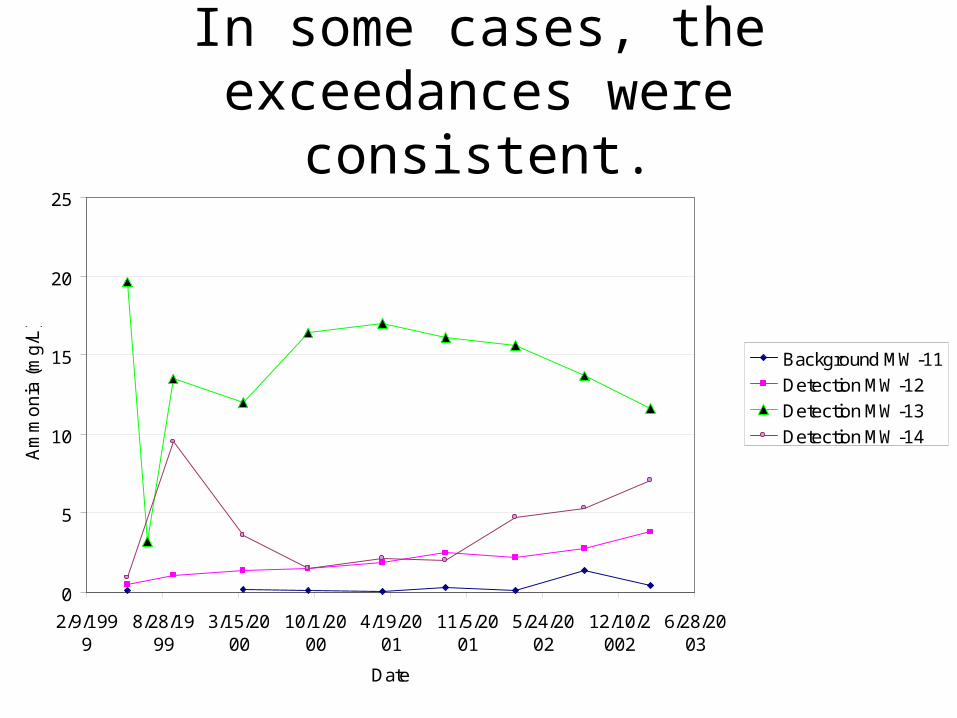
In some cases, the exceedances were consistent.
0
5
10
15
20
25
2/9/1999
8/28/1999
3/15/2000
10/1/2000
4/19/2001
11/5/2001
5/24/2002
12/10/2002
6/28/2003
Date
Am
mo
nia
(m
g/L
)
Background MW-11
Detection MW-12
Detection MW-13
Detection MW-14

0.0
0.5
1.0
1.5
2.0
2.5
3.0
12/6/1999 3/15/2000 6/23/2000 10/1/2000 1/9/2001 4/19/2001 7/28/2001 11/5/2001 2/13/2002 5/24/2002 9/1/2002
Date
Mer
cury
(ug
/L) Background MW-2A
Background MW-6
Detection MW-4
Detection MW-5
Detection MW-7
Detection MW-8
Detection MW-9
In some cases, exceedance was a one time event.

0
5
10
15
20
25
30
Num
ber
of S
ites
Visual Inspection Suggests Likely Exceedance
Visual Inspection Suggests Possible Exceedance

Next Steps
• Statistical comparison of individual site data
• Look at confounding issues such as turbidity
• Examine site histories
Modeling Exercise
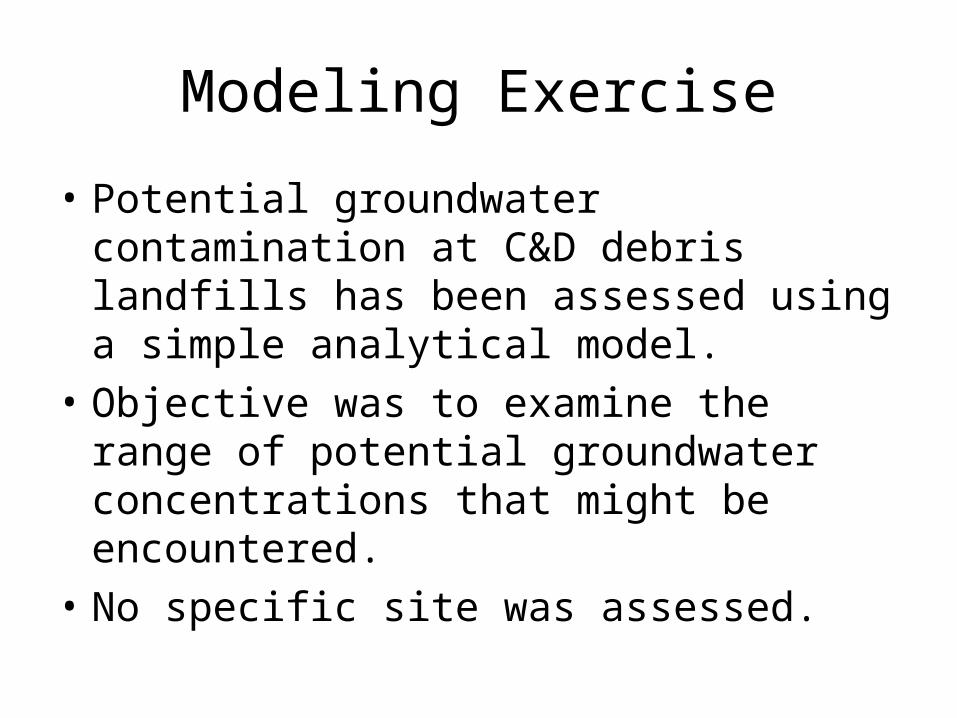
• Potential groundwater contamination at C&D debris landfills has been assessed using a simple analytical model.
• Objective was to examine the range of potential groundwater concentrations that might be encountered.
• No specific site was assessed.

MYGRT
• Sponsored by EPRI
• Developed by Tetra Tech Inc.
• Used in past by wood preservation industry
MYGRT
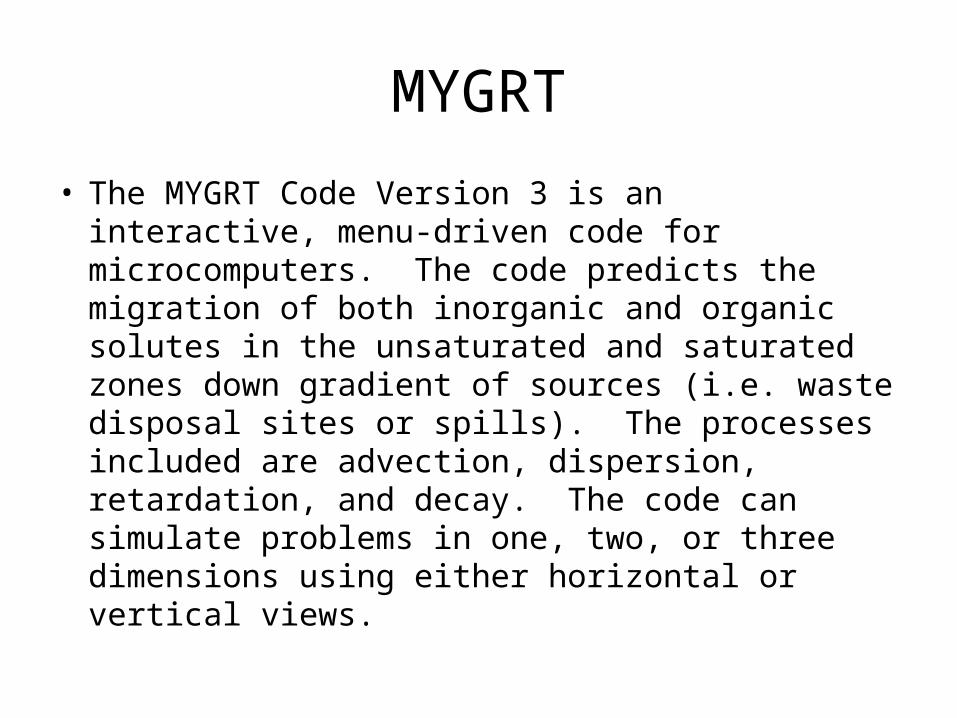
• The MYGRT Code Version 3 is an interactive, menu-driven code for microcomputers. The code predicts the migration of both inorganic and organic solutes in the unsaturated and saturated zones down gradient of sources (i.e. waste disposal sites or spills). The processes included are advection, dispersion, retardation, and decay. The code can simulate problems in one, two, or three dimensions using either horizontal or vertical views.

Definition Sketch

Key Model Assumptions
• Source concentration
• Vertical Infiltration Rate
• Retardation factor in unsaturated zone
• Aquifer characteristics– Gradient– Hydraulic conductivity– Depth
• Retardation factor in aquifer
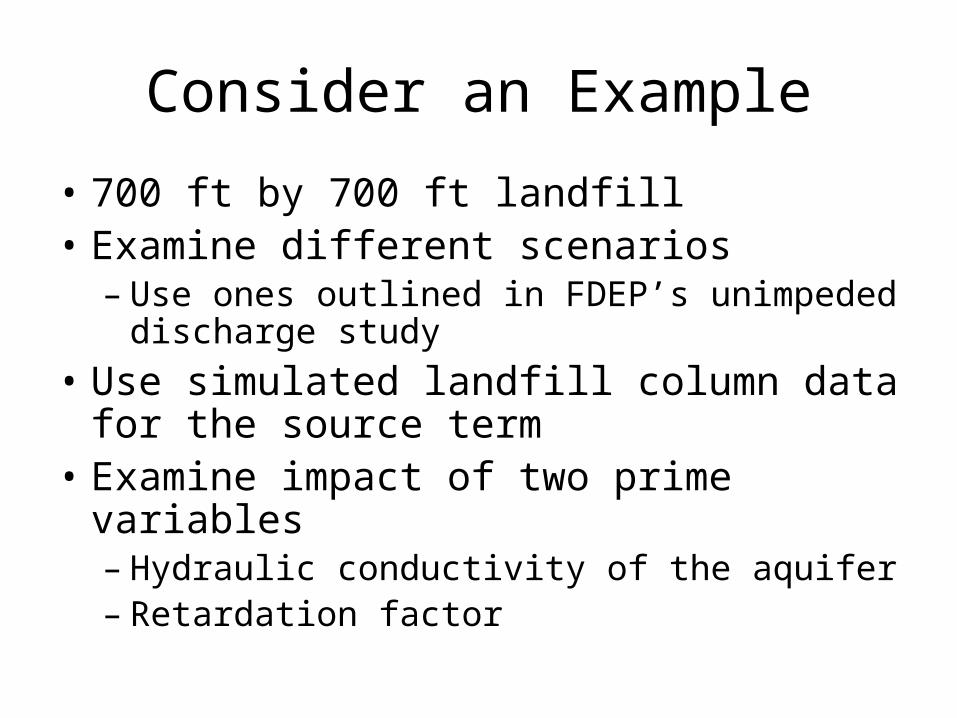
Consider an Example
• 700 ft by 700 ft landfill• Examine different scenarios
– Use ones outlined in FDEP’s unimpeded discharge study
• Use simulated landfill column data for the source term
• Examine impact of two prime variables– Hydraulic conductivity of the aquifer– Retardation factor
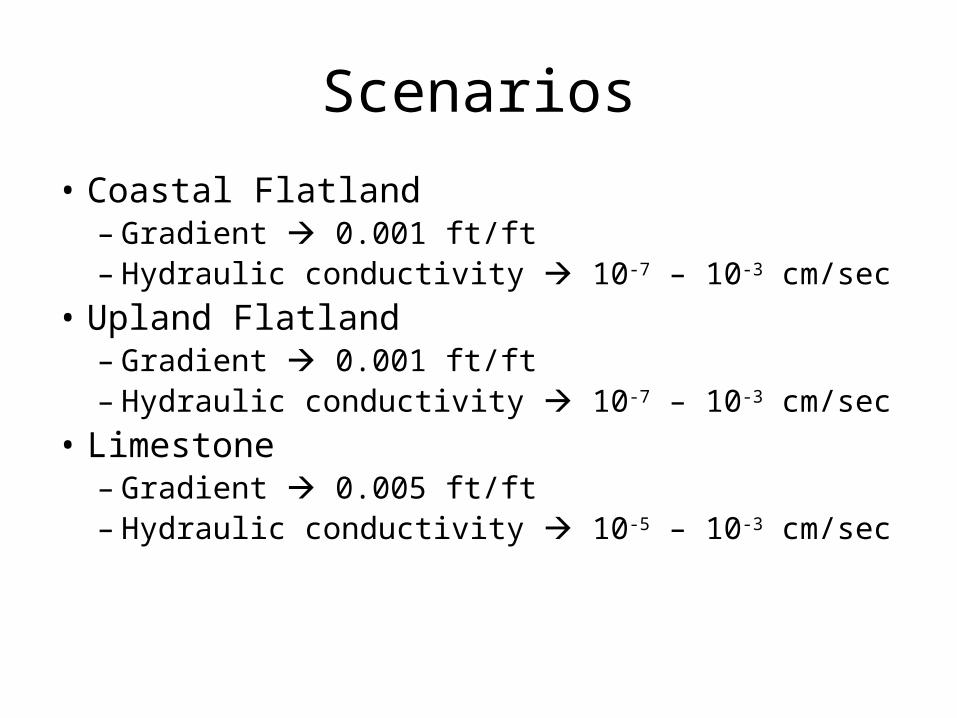
Scenarios
• Coastal Flatland– Gradient 0.001 ft/ft– Hydraulic conductivity 10-7 – 10-3 cm/sec
• Upland Flatland– Gradient 0.001 ft/ft– Hydraulic conductivity 10-7 – 10-3 cm/sec
• Limestone– Gradient 0.005 ft/ft– Hydraulic conductivity 10-5 – 10-3 cm/sec

700 ft
700 ft
Direction of Groundwater Flow
Detection Well at 50 ft from Toe
Compliance Well at 100 ft from Toe

Model Set-Up
Depth of Groundwater = 30 ft
700 ft
Depth to Groundwater Table = 2 ft (limestone) 7ft (coastal flatland) 10ft (upland flatland)
Wells screened from water table down 20 ft
50 ft 50 ft

Source Leachate Assumptions:Simulated C&D Debris LandfillsContaining CCA-Treated Wood
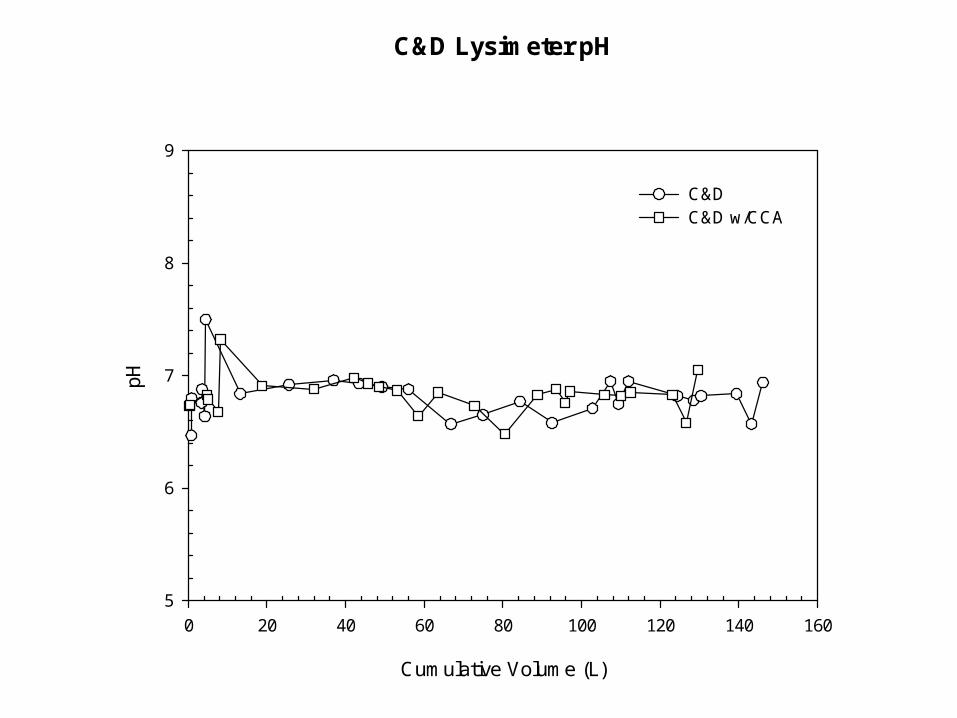
C&D Lysimeter pH
Cumulative Volume (L)
0 20 40 60 80 100 120 140 160
pH
5
6
7
8
9
C&DC&D w/CCA
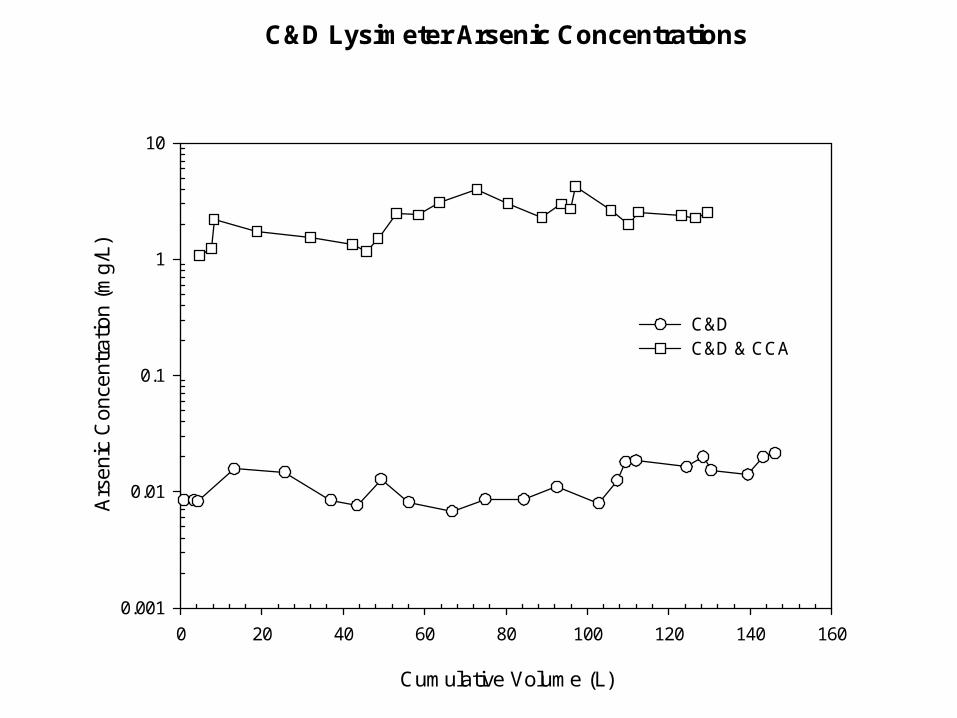
C&D Lysimeter Arsenic Concentrations
Cumulative Volume (L)
0 20 40 60 80 100 120 140 160
Ars
enic
Con
cent
ratio
n (m
g/L)
0.001
0.01
0.1
1
10
C&DC&D & CCA
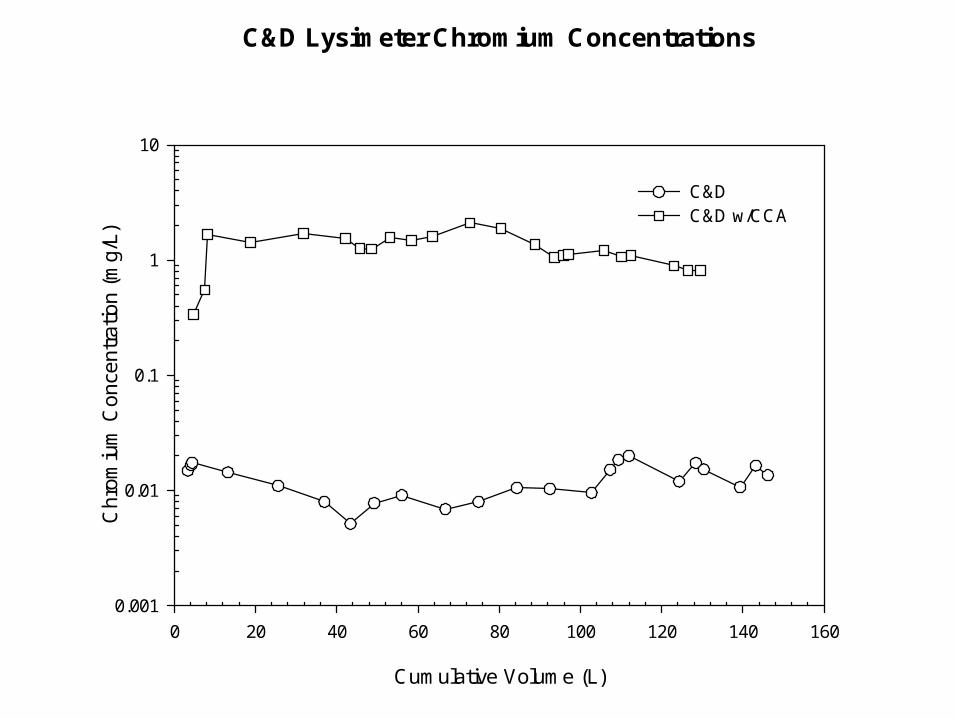
C&D Lysimeter Chromium Concentrations
Cumulative Volume (L)
0 20 40 60 80 100 120 140 160
Ch
rom
ium
Co
nce
ntr
atio
n (
mg
/L)
0.001
0.01
0.1
1
10
C&DC&D w/CCA
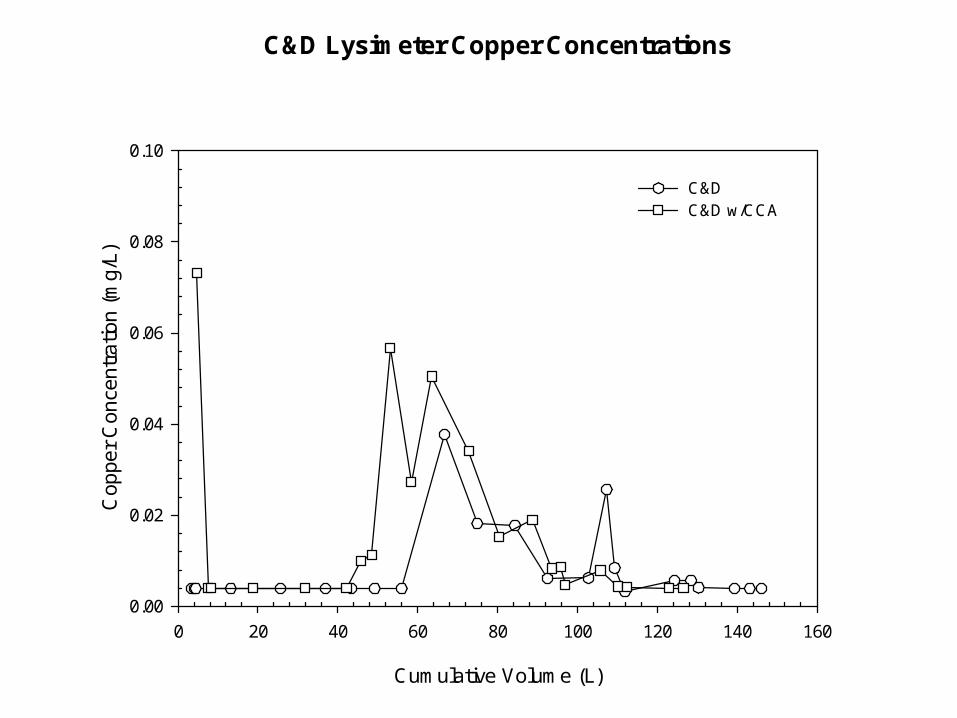
C&D Lysimeter Copper Concentrations
Cumulative Volume (L)
0 20 40 60 80 100 120 140 160
Co
ppe
r C
onc
entr
atio
n (m
g/L)
0.00
0.02
0.04
0.06
0.08
0.10
C&DC&D w/CCA
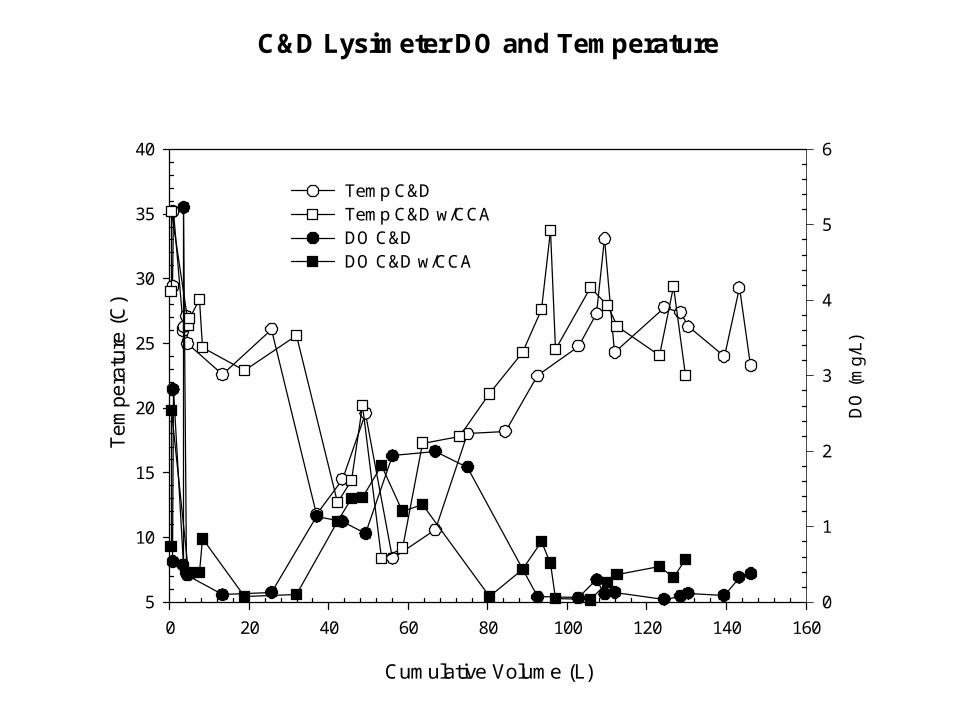
C&D Lysimeter DO and Temperature
Cumulative Volume (L)
0 20 40 60 80 100 120 140 160
Te
mp
era
ture
(C
)
5
10
15
20
25
30
35
40
DO
(m
g/L)
0
1
2
3
4
5
6
Temp C&DTemp C&D w/CCADO C&DDO C&D w/CCA

Input Arsenic Concentration
• Arsenic = 2.05 mg/L
• Contributed leachate for 20 years
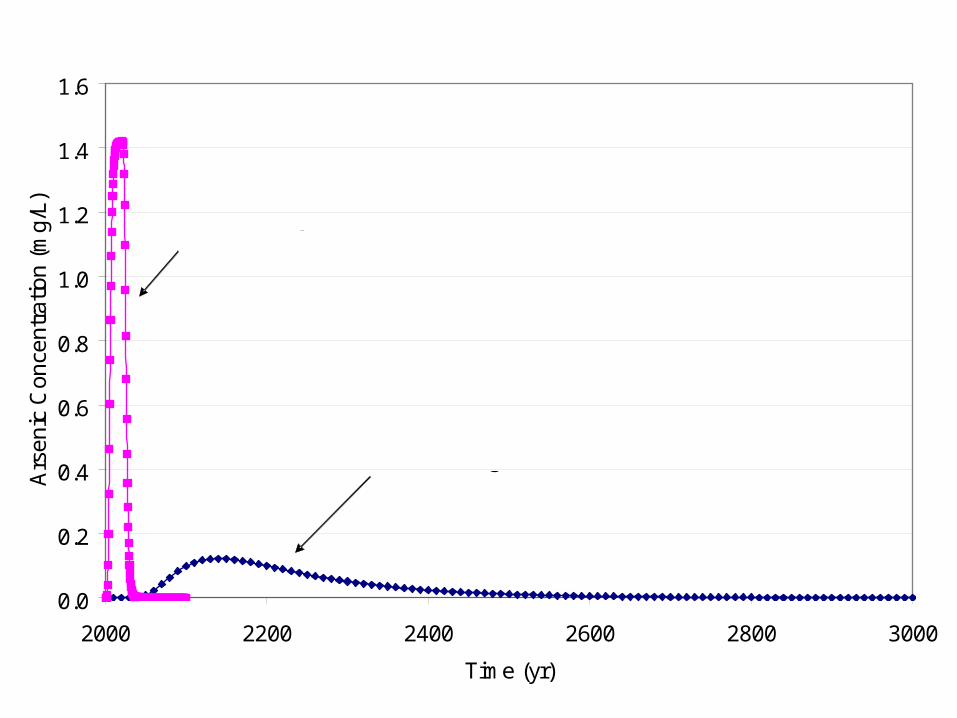
0.0
0.2
0.4
0.6
0.8
1.0
1.2
1.4
1.6
2000 2200 2400 2600 2800 3000
Time (yr)
Ars
enic
Con
cent
ratio
n (m
g/L)
K = 10-3 cm/secKd = 0 L/kg
K = 10-3 cm/secKd = 29 L/kg
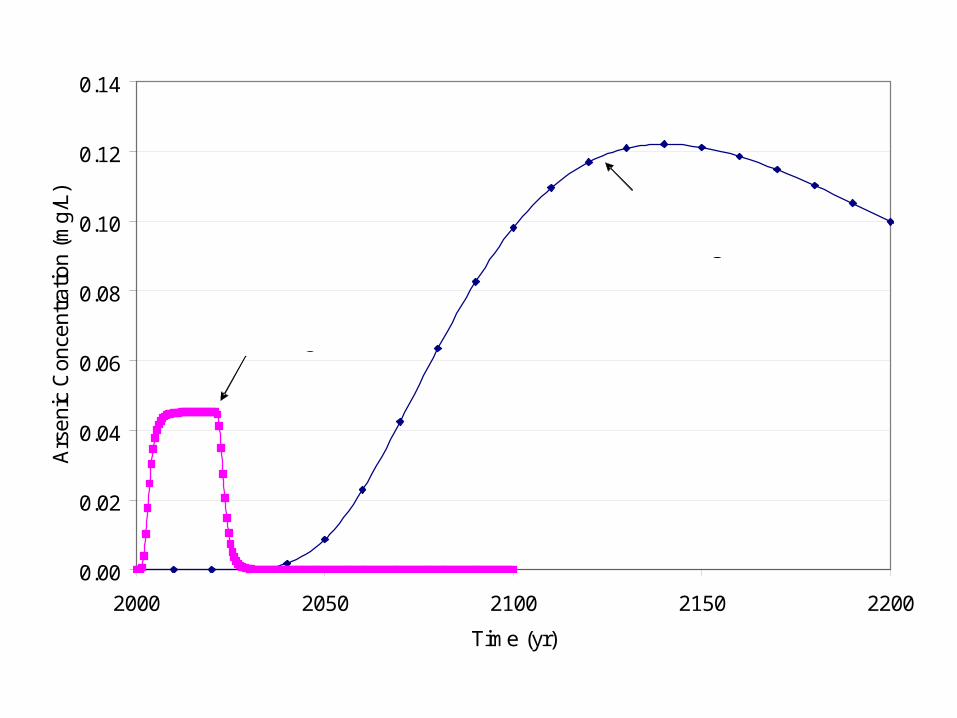
0.00
0.02
0.04
0.06
0.08
0.10
0.12
0.14
2000 2050 2100 2150 2200
Time (yr)
Ars
enic
Con
cent
ratio
n (m
g/L)
K = 10-3 cm/secKd =29 L/kg
K = 10-1 cm/secKd = 29 L/kg