evaluation of roundabouts versus signalized and ... · 7.9 changes in threshold volumes between...
TRANSCRIPT

Evaluation of Roundabouts versus Signalized
and Unsignalized Intersections in Delaware
by
Abishai Polus Evdokia Vlahos
Department of Civil and Environmental Engineering University of Delaware
September 2005
Delaware Center for Transportation University of Delaware
355 DuPont Hall Newark, Delaware 19716
(302) 831-1446
DCT 179

Evaluation of Roundabouts versus Signalized and
Unsignalized Intersections in Delaware
Project Report
Prepared for
The Delaware Department of Transportation
Prepared by
Abishai Polus Evdokia Vlahos
Delaware Center for Transportation
Department of Civil and Environmental Engineering University of Delaware
Newark, DE 19716
September, 2005

The Delaware Center for Transportation is a university-wide multi-disciplinary research unit reporting to the Chair of the Department of Civil and Environmental Engineering, and is co-sponsored by the University of Delaware and the Delaware Department of Transportation.
DCT Staff
Ardeshir Faghri Jerome Lewis Director Associate Director
Wanda L. Taylor Lawrence H. Klepner Sandi Wolfe Assistant to the Director T2 Program Coordinator Secretary
DCT Policy Council
Robert Taylor, Co-Chair Chief Engineer, Delaware Department of Transportation
Eric Kaler, Co-Chair
Dean, College of Engineering
The Honorable Tony DeLuca Chair, Delaware Senate Transportation Committee
The Honorable Richard Cathcart
Chair, Delaware House of Representatives Transportation Committee
Timothy K. Barnekov Dean, College of Human Resources, Education and Public Policy
Michael J. Chajes
Chair, Civil and Environmental Engineering
Ralph A. Reeb Director of Planning, Delaware Department of Transportation
Stephen Kingsberry
Director, Delaware Transit Corporation
Shannon Marchman Representative of the Director of the Delaware Development Office
Roger Roy
Representative, Transportation Management Association
Jim Johnson Executive Director, Delaware River & Bay Authority
Delaware Center for Transportation University of Delaware
Newark, DE 19716 (302) 831-1446

ii
ABSTRACT AND EXECUTIVE SUMMARY This study evaluates and compares a single-lane roundabout with an unsignalized (two-way stop controlled) intersection and a signalized (pre-timed) intersection and recommends conditions under which the construction of a roundabout may be more appropriate for an intersection. The measures of effectiveness used for the comparisons were effective intersection capacity, major and minor road entry lane capacity, major and minor road average delay, major and minor road queue length, and emission rates (CO, NOX, HC, and CO2). These measures are provided by the aaSIDRA software package which could then be used to establish “thresholds” in the major road one-way volume. These volumes indicate the threshold values for which the roundabout performs better than the unsignalized and signalized intersections. Two single-lane roundabouts with medium to high traffic volumes were studied in order to obtain local driver gap acceptance characteristics for use in the SIDRA analyses. The roundabouts selected for study are located in Maryland, near its border with Delaware, and so the data collected is assumed to be applicable to Delaware drivers as well. Observations of these sites found critical gaps of 3.85 and 3.91 s and follow-up times of 1.9 and 2.1 s, both lower than those values recommended by the HCM. Analyses using the SIDRA software with a critical gap of 3.9 s and a follow-up time of 2.0 s were then conducted. Figure 1 shows the approximate major road one-way volume ranges for which a single-lane roundabout is recommended over two-way stop controlled and signalized intersections for both heavy vehicle percentage scenarios assumed in the analyses. For 10% heavy vehicles on both roads, the roundabout range is between 150 and 850 vph. When heavy vehicles on the major road are increased to 20%, this range shifts slightly to between 140 and 840 vph. Figure 2 shows the findings for all measures of effectiveness for 10% heavy vehicles on both roads. This figure indicates two sets of thresholds; one based solely on the effective intersection capacity and one based on a weighted average of all measures of effectiveness considered in this study. The recommended ranges shown in Figure 1 are those based on the weighted averages of the measures of effectiveness.
150 vph 850 vph
TWSC SignalizedIntersection Intersection
140 vph 840 vph
RoundaboutRoundabout
FIGURE 1 Recommended Ranges of One-way Major Road Volumes for which the Construction of Roundabouts is Preferred to that of TWSC or Signalized Intersections. 10% Heavy Vehicles on Both Roads (top), 20% Heavy Vehicles on the Major Road and 10% Heavy Vehicles on the Minor Road (bottom)

iii
Effe
ctiv
e In
ters
ectio
n C
apac
ity (v
ph)
Ma j
or R
oad
Shar
ed L
ane
Cap
acity
(vph
)
Min
or R
oad
Shar
ed L
ane
Cap
acity
(vph
)
Maj
or R
oad
Aver
age
Del
ay (s
)
Min
or R
oad
Aver
age
Del
ay (s
)
Maj
or R
oad
95%
Que
ue L
engt
h (ft
)
Min
or R
oad
95%
Que
ue L
engt
h (ft
)
Tota
l HC
em
issi
ons
(kg/
h)
Tota
l CO
em
issi
ons
(kg/
h)
Tota
l NO
X e
mis
sion
s (k
g/h)
Tota
l CO
2 em
issi
ons
(kg/
h)
TWSC
Rou
ndab
out
Sign
al
1100
700
800
600
100
Effe
ctiv
e In
ters
ectio
n C
apac
ity T
hres
hold
Wei
ghte
d A
vera
ge T
hres
hold
500
FIG
UR
E 2
Vol
ume
Thre
shol
ds b
etw
een
Inte
rsec
tion
Type
s us
ing
Mar
ylan
d/D
elaw
are
Gap
Val
ues
900
10%
hea
vy v
ehic
les
on b
oth
road
s
1000
200
300
400
Maj
or R
oad
One
-Way
Vol
ume
(vph
)
012
00
809
150
855

iv
TABLE OF CONTENTS
List of Tables List of Figures Chapter 1 Introduction Chapter 2 Literature Review Chapter 3 Study Methodology and SIDRA Software Chapter 4 Data Collection and Reduction Chapter 5 Preliminary Analysis Using SIDRA Default Gap Acceptance Values Chapter 6 Final Analysis Using Maryland Gap Acceptance Values Chapter 7 Comparison of Roundabouts Measures of Effectiveness Using SIDRA vs.
Maryland Gaps Chapter 8 Thresholds Chapter 9 Conclusions References

v
LIST OF TABLES Table 2.1 Recommended Critical Gap and Follow-up Times 2.2 Control Delay Before and After the Installation of Roundabout 2.3 Deviation between Field and Modeled Values 2.4 Average CO and NOX Emissions and Fuel Consumption per Car and per Day at a
Signalized Intersection Rebuilt as a Roundabout 2.5 Average CO and NOX Emissions and Fuel Consumption per Car and per Day at
an Average Junction with Yield Regulation Before and After Rebuilding 2.6 Overall Emissions Results 4.1 Traffic and Geometric Data 4.2 Critical Gaps and Follow-up Times for Study Sites 5.1 Threshold Volumes using SIDRA Default Gap Acceptance Parameters for 10%
Heavy Vehicles on Both Roads 5.2 Threshold Volumes using SIDRA Default Gap Acceptance Parameters for 20%
Heavy Vehicles on the Major Road, 10% on the Minor Road 6.1 Threshold Volumes using Observed Maryland/Delaware Gap Acceptance
Parameters for 10% Heavy Vehicles on Both Roads 6.2 Threshold Volumes using Observed Maryland/Delaware Gap Acceptance
Parameters for 20% Heavy Vehicles on the Major Road, 10% on the Minor Road 7.1 Effective Intersection, Major Road, and Minor Road Capacities (10% Heavy
Vehicles on Major Road) 7.2 Major and Minor Road Delay (10% Heavy Vehicles on Major Road) 7.3 Major and Minor Road Queue Lengths (10% Heavy Vehicles on Major Road) 7.4 Roundabout Total Emissions (10% Heavy Vehicles on Major Road) 7.5 Effective Intersection, Major Road and Minor Road Capacities (20% Heavy
Vehicles on Major Road) 7.6 Major Road and Minor Road Delay (20% Heavy Vehicles on Major Road) 7.7 Major and Minor Road Queue Length (20% Heavy Vehicles on Major Road) 7.8 Roundabout Total Emissions (20% Heavy Vehicles on Major Road) 7.9 Changes in Threshold Volumes between Intersection Types for Observed
Maryland/Delaware and SIDRA Default Gap Acceptance Parameters

vi
LIST OF FIGURES Figure 2.1 Roundabout Approach Capacity 2.2 Entry Capacities for Single and Double-lane Roundabouts 2.3 Models for Entry Capacities Versus Circulating Flows for Study Sites 2.4 Critical Gap as a Function of Waiting Time 2.5 Calibration of S-curves for Critical Gaps Versus Waiting Times 2.6 Model for Entry Capacity for Various Critical Gaps 2.7 Model for Entry Capacity for Various Outside Diameters 2.8 Relationship between Critical Gap and Average Waiting Time 2.9 Entry Capacity Versus Circulating Flow for a Selected Roundabout Entry 2.10 Effect of Diameter on Critical Gap of a Dominant Lane 2.11 Estimated Entry Capacity Versus Circulating Flow at Different Total Delay
Levels 2.12 Estimated Capacity Versus Left-Turn Flow of Opposite Approach, Data Set 1 2.13 Estimated Capacity Versus Left-Turn Flow of Opposite Approach, Data Set 2 2.14 Control Delay as a Function of Capacity and Entering Flow 2.15 Proposed Model Versus Field Stopped Delay 2.16 Entry Capacity for a Two-lane Roundabout with a 60-m Inscribed Diameter and a
4-m Entry Lane Width 2.17 Entry Capacities Versus Circulating Flows for D between 30 and 60 m 2.18 Jordanian and German Capacity Values for Different Numbers of Entry Lanes
and Circulating Roadway Lanes 2.19 Performance of Australian and Siegloch Gap Theoretical Models 2.20 Predicted Capacity from Ordinary Gap Acceptance Model and Akçelik Model 2.21 Comparison of Field-measured Delay and SIDRA-predicted Delay 2.22 Model-estimated System Delay Versus Conflicting Hourly Flow 2.23 Field System Delay Versus Model-Estimated System Delay 2.24 M/M/1 Model Versus Field Stopped Delay 2.25 SIDRA versus Field Stopped Delay 4.1 Determination of Critical Gap for (a) MD 273/MD 276 (Cecil County) and (b)
MD 18/Castle Marina Road (Queen Anne’s County) 4.2 Distributions of Follow-up Times for (a) MD 273/MD 276 (Cecil County) and (b)
MD 18/Castle Marina Road (Queen Anne’s County) 5.1 Initial Effective Intersection Capacity Tests for Both Heavy Vehicle Scenarios 5.2 Intersection Capacity Threshold Volumes, Roundabout vs. TWSC Intersection 5.3 Effective Intersection Capacity, Roundabout vs. Signalized Intersection 5.4 Major Road Capacity, Roundabout vs. Signalized Intersection 5.5 Minor Road Capacity, Roundabout vs. TWSC Intersection 5.6 Minor Road Capacity, Roundabout vs. Signalized Intersection 5.7 Major Road Delay, Roundabout vs. Signalized Intersection

vii
5.8 Major Road Delay, Roundabout vs. Signalized Intersection 5.9 Minor Road Delay, Roundabout vs. TWSC Intersection 5.10 Minor Road Delay, Roundabout vs. Signalized Intersection (10% Heavy Vehicles
on Major Road) 5.11 Minor Road Delay, Roundabout vs. Signalized Intersection (20% Heavy Vehicles
on Major Road) 5.12 Major Road Queue, Roundabout vs. Signalized Intersection (10% Heavy Vehicles
on Major Road) 5.13 Major Road Queue, Roundabout vs. Signalized Intersection (20% Heavy Vehicles
on Major Road) 5.14 Minor Road Queue, Roundabout vs. TWSC Intersection 5.15 Minor Road Queue, Roundabout vs. Signalized Intersection 5.16 Total HC Emissions, Roundabout vs. TWSC Intersection (10% Heavy Vehicles
on Major Road) 5.17 Total HC Emissions, Roundabout vs. TWSC Intersection (20% Heavy Vehicles
on Major Road) 5.18 Total HC Emissions, Roundabout vs. Signalized Intersection (10% Heavy
Vehicles on Major Road) 5.19 Total HC Emissions, Roundabout vs. Signalized Intersection (20% Heavy
Vehicles on Major Road) 5.20 Total CO Emissions, Roundabout vs. TWSC Intersection (10% Heavy Vehicles
on Major Road) 5.21 Total CO Emissions, Roundabout vs. TWSC Intersection (20% Heavy Vehicles
on Major Road) 5.22 Total NOX Emissions, Roundabout vs. Signalized Intersection (10% Heavy
Vehicles on Major Road) 5.23 Total NOX Emissions, Roundabout vs. Signalized Intersection (20% Heavy
Vehicles on Major Road) 5.24 Total NOX Emissions, Roundabout vs. TWSC Intersection (10% Heavy Vehicles
on Major Road 5.25 Total NOX Emissions, Roundabout vs. TWSC Intersection (20% Heavy Vehicles
on Major Road 5.26 Total CO2 Emissions, Roundabout vs. Signalized Intersection (10% Heavy
Vehicles on Major Road 5.27 Total CO2 Emissions, Roundabout vs. Signalized Intersection (20% Heavy
Vehicles on Major Road 5.28 Total CO2 Emissions, Roundabout vs. TWSC Intersection (10% Heavy Vehicles
on Major Road 5.29 Total CO2 Emissions, Roundabout vs. TWSC Intersection (20% Heavy Vehicles
on Major Road 6.1 Effective Intersection Capacity, Roundabout vs. TWSC Intersection 6.2 Effective Intersection Capacity, Roundabout vs. Signalized Intersection 6.3 Major Road Capacity, Roundabout vs. Signalized Intersection 6.4 Minor Road Capacity, Roundabout vs. TWSC Intersection 6.5 Minor Road Capacity, Roundabout vs. Signalized Intersection

viii
6.6 Major Road Delay, Roundabout vs. Signalized Intersection 6.7 Minor Road Average Delay, Roundabout vs. TWSC Intersection 6.8 Minor Road Average Delay, Roundabout vs. Signalized Intersection 6.9 Major Road Queue, Roundabout vs. Signalized Intersection 6.10 Minor Road Queue, Roundabout vs. TWSC Intersection 6.11 Minor Road Queue, Roundabout vs. Signalized Intersection 6.12 Total CO Emissions, Roundabout vs. TWSC Intersection 6.13 Total CO Emissions, Roundabout vs. Signalized Intersection 6.14 Total CO2 Emissions, Roundabout vs. TWSC Intersection 6.15 Total CO2 Emissions, Roundabout vs. Signalized Intersection 6.16 Total NOX Emissions, Roundabout vs. TWSC Intersection 6.17 Total NOX Emissions, Roundabout vs. Signalized Intersection 6.18 Total HC Emissions, Roundabout vs. TWSC Intersection 6.19 Total HC Emissions, Roundabout vs. Signalized Intersection 7.1 Roundabout Effective Intersection Capacity (10% Heavy Vehicles on Major Rd.) 7.2 Roundabout Major Road Capacity (10% Heavy Vehicles on Major Road) 7.3 Roundabout Minor Road Capacity (10% Heavy Vehicles on Major Road) 7.4 Roundabout Major Road Average Delay (10% Heavy Vehicles on Major Road) 7.5 Roundabout Minor Road Average Delay (10% Heavy Vehicles on Major Road) 7.6 Roundabout Major Road Queue Length (10% Heavy Vehicles on Major Road) 7.7 Roundabout Minor Road Queue Length (10% Heavy Vehicles on Major Road) 7.8 Roundabout Effective Intersection Capacity (20% Heavy Vehicles on Major Rd.) 7.9 Roundabout Major Road Capacity (20% Heavy Vehicles on Major Road) 7.10 Roundabout Minor Road Capacity (20% Heavy Vehicles on Major Road) 7.11 Roundabout Total HC Emissions (20% Heavy Vehicles on Major Road) 7.12 Roundabout Total CO Emissions (20% Heavy Vehicles on Major Road) 7.13 Roundabout Total CO2 Emissions (20% Heavy Vehicles on Major Road) 7.14 Roundabout Total NOX Emissions (20% Heavy Vehicles on Major Road) 7.15 MRV Ranges for which Roundabouts are Most Appropriate Using Observed
Maryland/Delaware and SIDRA Default Gap Acceptance Parameters 8.1 Volume Thresholds between Intersection Types Using SIDRA Default Gap
Values (10% Heavy Vehicles on Both Roads) 8.2 Volume Thresholds between Intersection Types Using SIDRA Default Gap
Values (20% Heavy Vehicles on Major Road, 10% on Minor Road) 8.3 Volume Thresholds between Intersection Types Using Maryland/Delaware Gap
Values (10% Heavy Vehicles on Both Roads) 8.4 Volume Thresholds between Intersection Types Using Maryland/Delaware Gap
Values (20% Heavy Vehicles on Major Road, 10% on Minor Road) 9.1 Recommended Ranges of Major Road One-way Volumes for which the
Construction of Roundabouts is Preferred to that of TWSC or Signalized Intersections

1-1
1.0 INTRODUCTION Roundabouts are garnering a growing interest in the United States partially because of their successful implementation abroad, particularly in Europe and Australia. When constructed where geometric and traffic conditions are appropriate, they can potentially provide advantages over conventional intersections in terms of capacity, delay, queue length, emissions, safety, and aesthetics. While similar to traffic circles, roundabouts are distinguished by several key features. Two fundamental elements are the yield-at-entry rule for entering vehicles and the deflection of approaches and exits so as to induce lower vehicle speeds. Other characteristics of roundabouts are the counter-clockwise movement of circulating vehicles, no parking permitted on the circulating and entry roadways, and the restriction of pedestrian movement to behind the yield sign on the legs of the roundabout. In most typical cases, delay is generally evenly distributed among all approaches to a roundabout, in contrast to cross-intersections, where minor road vehicles experience significantly greater delay than major road vehicles. The yield control on roundabout approaches does not require that all vehicles come to a complete stop and therefore eliminates unnecessary stops made at traffic signals and stop signs when there are no conflicting vehicles. Additionally, minor road vehicles receive an “equal opportunity” to enter the intersection and so delays are typically reduced. This more efficient operation generally results in increased capacity and decreased overall delay. Studies have shown that well-designed roundabouts typically reduce the frequency and severity of crashes occurring at intersections. Because of the overall improvement in safety associated with the use of roundabouts, they are often used as a means of traffic calming. In addition to lower vehicle speeds when compared to a cross-intersection, a roundabout reduces the number of potential vehicle-vehicle conflict points from 32 in a four-leg cross-intersection to 8. Both injury rates and the severity of crashes are reduced in roundabouts as a result of lower speeds and the elimination of right angle and left-turn head-on collisions, which are common at conventional intersections and are typically the most severe accidents. It is often reported that roundabouts offer additional advantages over other intersection types. Maintenance costs for a roundabout are much less that those for traffic signals, as no major work is typically needed once a roundabout is constructed. Additionally, the center island of a roundabout provides space for landscaping and other aesthetic enhancements, which is appreciated by the local community and users of the roundabout. This study will investigate the traffic conditions that may support the construction of roundabouts and will identify conditions under which roundabouts may be more appropriate than other types of intersection control, both signalized and unsignalized. The performance of each intersection type will be evaluated as traffic volumes and heavy vehicle percentages are varied along the intersecting roadways. Performance evaluations

Chapter 1—Introduction
1-2
will be based upon several measures of effectiveness such as capacity, delay, queue length, and emission levels, which are provided by the SIDRA software package. Preliminary analyses are conducted using default parameters as determined by the SIDRA software. It is known that driver behavior at roundabouts varies from country to country. In the United States in particular, driver behavior differs from that abroad, due to unfamiliarity throughout most of the country with roundabouts. Therefore, in order to localize the analysis results to Delaware driver behavior, it was decided to observe local roundabout sites to obtain gap acceptance parameters for use with the SIDRA software. However, due to the lack of roundabout sites in Delaware with adequate traffic volumes for a gap acceptance study, two Maryland locations were chosen for the study. These roundabouts are located in eastern Maryland, and, therefore, it is acceptable to assume that drivers are these sites are similar to Delaware drivers. Based on the data collected in Maryland, an additional analysis using the SIDRA software was conducted to evaluate the measures of effectiveness for these local conditions. This analysis assumed a range of major road one-way volumes up to 1200 vehicles per hour and two heavy vehicle conditions on the major road of 10% and 20%. The details of the analyses are presented in the body of this report along with the recommendations for ranges of major road one-way volumes that are most appropriate for construction of unsignalized intersections, roundabouts, and signalized intersections.

2-1
2.0 LITERATURE REVIEW 2.1 RECENT CAPACITY AND DELAY STUDIES: METHODOLOGY AND
DATA COLLECTION a. Troutbeck and Kako (1999) Troutbeck and Kako (1999) developed a gap acceptance model for the merging process at congested unsignalized intersections. Unlike traditional gap acceptance models, which typically assume absolute priority of major stream vehicles over those of the minor stream, the proposed model assumes limited priority of major stream vehicles. Limited priority is a type of shared priority that is based on the assumption that major stream vehicles are slightly delayed in order to accommodate merging vehicles from the minor stream. Field studies were conducted at three roundabouts located in Brisbane, Australia. All three roundabouts had two circulating lanes and two entry lanes, and normally operated under fairly high traffic volumes during peak hours. One hour of traffic data were collected with a videotape recorder at one entry of each roundabout during its morning or afternoon peak period. From each set of 1-hr data, two sets of 15-min data were extracted based upon traffic conditions at the entry approach being either “high saturation” or “low saturation.” The frequency of events in which circulating vehicles were forced to slow down by entering vehicles was observed for each of these six data sets. The two-lane circulatory roadway was treated as a single lane and the times for circulating vehicles to cross two cross-sections, one upstream and one downstream of the entry, were recorded. b. Polus and Shmueli (1997) Polus and Shmueli (1997) developed an entry-capacity model for roundabouts that includes outside diameter and circulating flow as input parameters. Six small to medium-sized roundabouts in urban and suburban areas of Israel were included in this study. A separate regression model was developed for each roundabout studied because it was believed that the geometric characteristics of each site significantly affect its capacity. A general form of an exponential regression equation could then be developed. Results from the developed model were compared with those obtained from Australian and German models. Flow and geometric data were collected from the six study sites. The capacity of each entry was defined as the maximum number of vehicles that can enter the roundabout in 1 hour under continuous queue conditions. Data were collected continuously by video camera, which were later assembled in 1-min intervals so that the flow encountered by
Chapter 2—Literature Review
2-2
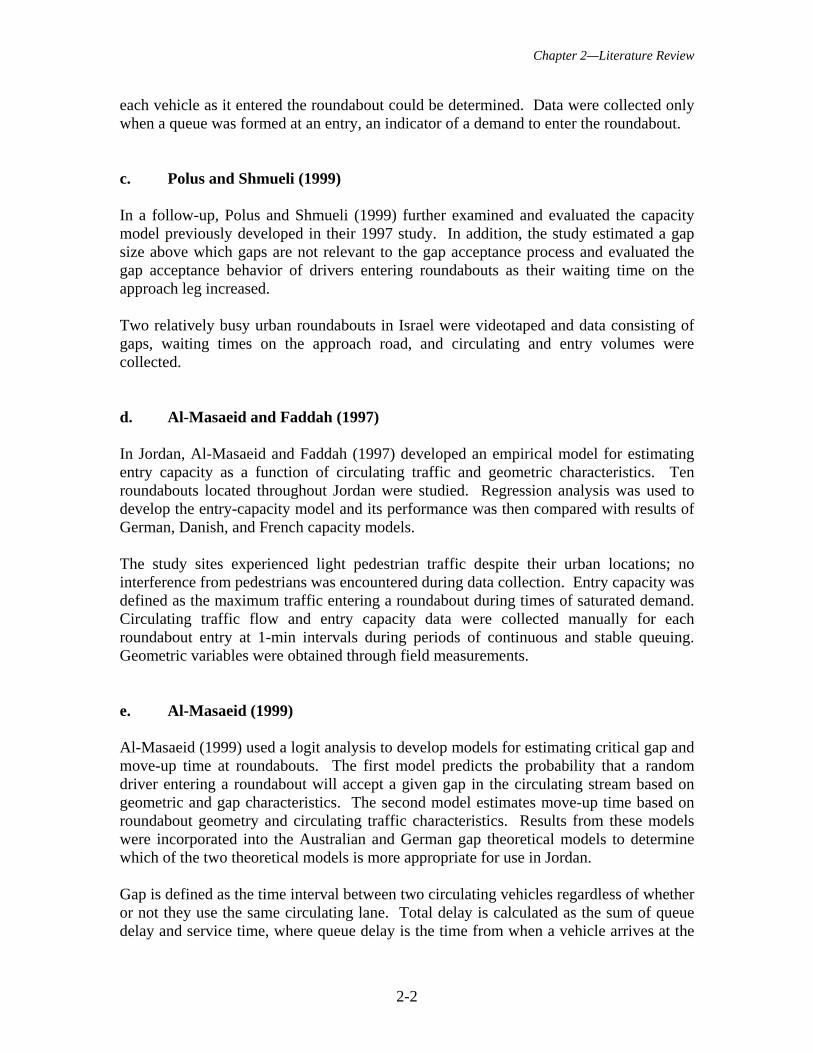
each vehicle as it entered the roundabout could be determined. Data were collected only when a queue was formed at an entry, an indicator of a demand to enter the roundabout. c. Polus and Shmueli (1999) In a follow-up, Polus and Shmueli (1999) further examined and evaluated the capacity model previously developed in their 1997 study. In addition, the study estimated a gap size above which gaps are not relevant to the gap acceptance process and evaluated the gap acceptance behavior of drivers entering roundabouts as their waiting time on the approach leg increased. Two relatively busy urban roundabouts in Israel were videotaped and data consisting of gaps, waiting times on the approach road, and circulating and entry volumes were collected. d. Al-Masaeid and Faddah (1997) In Jordan, Al-Masaeid and Faddah (1997) developed an empirical model for estimating entry capacity as a function of circulating traffic and geometric characteristics. Ten roundabouts located throughout Jordan were studied. Regression analysis was used to develop the entry-capacity model and its performance was then compared with results of German, Danish, and French capacity models. The study sites experienced light pedestrian traffic despite their urban locations; no interference from pedestrians was encountered during data collection. Entry capacity was defined as the maximum traffic entering a roundabout during times of saturated demand. Circulating traffic flow and entry capacity data were collected manually for each roundabout entry at 1-min intervals during periods of continuous and stable queuing. Geometric variables were obtained through field measurements. e. Al-Masaeid (1999) Al-Masaeid (1999) used a logit analysis to develop models for estimating critical gap and move-up time at roundabouts. The first model predicts the probability that a random driver entering a roundabout will accept a given gap in the circulating stream based on geometric and gap characteristics. The second model estimates move-up time based on roundabout geometry and circulating traffic characteristics. Results from these models were incorporated into the Australian and German gap theoretical models to determine which of the two theoretical models is more appropriate for use in Jordan. Gap is defined as the time interval between two circulating vehicles regardless of whether or not they use the same circulating lane. Total delay is calculated as the sum of queue delay and service time, where queue delay is the time from when a vehicle arrives at the

Chapter 2—Literature Review
2-3
end of the queue until it reaches the yield line. Service time is the time between a vehicle’s arrival at and departure from the yield line. Move-up time is defined as the headway between two queued vehicles using the same gap in circulating traffic, measured as they enter the circulating flow. The study sites consisted of ten roundabouts located throughout Jordan that operated at capacity and experienced considerable delay during peak periods. Data were collected for twenty selected approaches among the ten sites. Each roundabout had four or five approaches and each approach consisted of two to four entry lanes. Entry lanes were classified as dominant or subdominant based upon flow characteristics, where that with the greatest flow at each approach was classified as the dominant lane. Data were collected separately for each lane type using manual field techniques. Three data sets were collected. The first was used to establish critical gap models and consisted of geometric data, total delay times, and length of gaps rejected or accepted by entering drivers. The second was used to establish a move-up time model and consisted of traffic flow and average move-up time at 1-min intervals. The third data set was used to determine the most appropriate gap-acceptance model for Jordan roundabouts and consisted of entry capacity, circulating traffic flow, and total delay at 1-min intervals during peak and off-peak periods at one chosen roundabout. f. Hagring (2000) Hagring (2000) proposed a new capacity model for two-lane roundabouts based on previous studies (Hagring 1996, 1998) at Swedish roundabouts on the effects of origin-destination (OD) flows. The developed model was tested on two synthetic data sets and compared with another OD model proposed by Akçelik et al. (1996) and Akçelik (1997). The previous work by Hagring studied critical gap differences between the inner and outer entry lanes at two-lane roundabout approaches. A simplified model was developed relating critical gap to the length and width of the weaving section between adjacent approaches. The capacity model presented and evaluated in the current study was first developed in these older studies. g. Flannery, Elefteriadou, Koza, and McFadden (1998) Flannery et al. (1998) studied five single-lane roundabouts before and after their installations to assess any changes in safety and operational performance. These intersections were located in Florida and Maryland and were stop-controlled prior to being converted to roundabouts. Two studies of these locations were conducted to determine the performance of the new roundabouts. The first study consisted of collecting and comparing the average delay for vehicles before and after the sites were converted to roundabouts. Control delay was determined for entering vehicles by videotaping each site during its peak period. This study defined

Chapter 2—Literature Review
2-4
control delay as the time spent in queue, the move-up time in the queue, and the service time at the head of the queue. Field measurements of control delay at the sites before roundabouts were installed were not available. This delay was estimated for each approach using the procedure outlined in the 1997 update to Chapter 10 of the Highway Capacity Manual. The second study compared the field-measured delay with that predicted by the software SIDRA. h. Flannery, Kharoufeh, Gautam, and Elefteriadou (2000) Flannery et al. (2000) developed equations estimating the mean and variance of service time for a vehicle in the first position at an entry of a single-lane roundabout. With these estimates, the Pollaczek-Khintchine formula and Little’s law may then be used to estimate the average number of queued vehicles and the average total waiting time per vehicle, respectively. Service time is defined as the time spent in the first position of the queue prior to entering the circulating stream and includes the time spent waiting for an acceptable gap in the circulating stream, travel time to enter the circulating stream, and the headway for the subsequent circulating vehicle. The total waiting time consists of the service time and the random time spent in the queue prior to assuming the first position. The model was developed using queuing theory, which is applicable under steady state conditions and assumes an M/G/1 queuing regime. The M/G/1 queuing regime assumes that the arrival process is Poisson and therefore the time between successive arrivals is exponential, or Markovian; the service times have a general distribution function; and there is a single server. Driver performance and operational data were collected from six single-lane roundabouts located in Maryland and Florida. Cameras placed over the circulating roadway and each entry to the roundabout collected data for two hours during morning and evening peak periods. i. Al-Omari, Al-Masaeid, and Al-Shawabkah (2004) Al-Omari et al. (2004) developed a model for estimating roundabout delay as a function of traffic and geometric factors. A total of twenty hours of field traffic and geometric data were collected from fourteen roundabouts located throughout Jordan. Data were collected on sunny days from locations with good pavement conditions and during times when there were no policemen in the area. It was not possible to collect data during congested conditions because traffic police control roundabouts at these times. Circulating volume, entry volume, and entry delay were measured during peak and non-peak periods using video cameras. Geometric design elements such as entry width and roundabout diameter were obtained through field measurements.

Chapter 2—Literature Review
2-5
j. Várhelyi (2002) Várhelyi (2002) investigated the effects of small roundabouts on emissions and fuel consumption at twenty-one locations in Växjö, Sweden. Of these sites, one was signalized and all others were yield-regulated prior to being replaced by small roundabouts. Traffic counts were conducted before and after the installation of the roundabouts for one workday at each site, between 7:30 AM and 5:00 PM. In order to register driving patterns, a “car-following” method was used in which randomly selected cars were followed with an instrument-equipped car that attempted to imitate the followed car’s driving pattern as closely as possible. Traffic counts were used to determine if volumes changed as a result of the new roundabouts and to determine the volume of emissions and fuel consumption per day at each site. Based on emission and fuel consumption factors developed by the Swedish car-testing institute AB Svensk Bilprovning, total emissions and fuel consumption for each followed car were calculated. Emissions factors were available for two types of passenger cars: A10-cars (petrol-driven without catalytic purifier) and L1-cars (petrol-driven with catalytic purifier). These factors are valid within limited intervals of speed and acceleration. In the rare event that speed or acceleration values were outside of the interval limits, the outermost values were used. The emissions for an average passenger car were determined using weighted factors of 0.7 for A10-cars and 0.3 for L1-cars, which reflect the percentage of Swedes driving each type of car in 1991. Heavy vehicles, which comprised about 7 percent of city traffic, were not considered in this study, as the emissions factors were applicable only to petrol-driven passenger cars. k. Mandavilli, Russell, and Rys (2003) Mandavilli et al. (2003) studied the impact of modern roundabouts on reducing vehicular emissions at intersections. The study sites consisted of six sites, experiencing different traffic conditions, at which single-lane modern roundabouts replaced stop-controlled intersections. Five of the sites were located in Kansas and one was located in Nevada. Prior to installation of the roundabouts, four of these sites were under two-way stop control and two sites were under all-way stop control. Data collection consisted of two phases. The first phase consisted of videotaping intersection traffic movements for two six-hour sessions from 7:00 AM to 1:00 PM and from 1:00 PM to 7:00 PM on normal weekdays before and after the installation of the roundabouts. This study defines a normal weekday as a day having no inclement weather or other external factors, such as nearby events that would affect the traffic flow to the intersection. The second phase of data collection consisted of reviewing the videotapes to obtain AM and PM traffic counts for the before and after conditions. Data were recorded in 15-minute periods and the hourly data were then analyzed with the software aaSIDRA, version 2.0. All measures of effectiveness obtained from the SIDRA analysis were statistically compared with the software Minitab 13 using standard statistical procedures.

Chapter 2—Literature Review
2-6
l. Russell, Mandavilli, and Rys (2005) In another study of Kansas roundabouts, Russell et al. (2005) compared the operational performance of 11 intersections in 5 cites before and after their conversions to modern roundabouts. The study followed the same methodology as the earlier study by Mandavilli et al. (2004). The SIDRA software was used to provide measures of effectiveness so as to compare the intersection types. The MOEs chosen for this study are the 95th percentile queue length, degree of saturation, average intersection delay, maximum approach delay, proportion of vehicles stopped, and maximum proportion of vehicles stopped. Prior to the SIDRA analysis, statistical tests were performed to determined if the before and after traffic volumes were statistically similar.

Chapter 2—Literature Review
2-7
2.2 CAPACITY AND DELAY MODELS The following sections include capacity and delay models developed and used by government agencies as well as those developed in the studies discussed above. 2.2.1 CAPACITY MODELS a. United Kingdom Kimber (1980) conducted studies in the UK and developed an empirical linear regression based on a large number of observations at roundabouts operating at-capacity. This equation directly relates capacity to roundabout geometry.
)( cce QfFkQ −= (2.1)
Where: Qe = entry capacity, vph; Qc = circulating flow, pce/h; and k, F, fc = constants derived from the geometry of the roundabout.
b. Australia Troutbeck (1993) conducted studies for the Australian Road Research Board and developed an analytical equation based on gap acceptance characteristics observed and measured at roundabouts operating below capacity. Critical gap and follow-up times are related to roundabout geometry and capacity is then determined using the following equation.
ftc
e eeQ
Qmtct
λ
λα−−
=−−
1
)( (2.2)
Where:
Qe = entry capacity, vph; Qc = circulating flow, vph; α = proportion of non-bunched (free) vehicles in the circulating streams; λ = model parameter; tc = critical gap, s; tf = minimum headway in circulating streams, s; and tm = follow-up time, s.

Chapter 2—Literature Review
2-8
c. Germany Stuwe (1992) studied 11 German roundabouts and developed the following exponential regression equation to estimate roundabout entry capacity.
⎟⎟⎠
⎞⎜⎜⎝
⎛ −= 000,10
cBV
AeC (2.3) Where:
C = entry capacity, vph; Vc = circulating flow, vph; and A, B = parameters dependent on the number of circulating and entry lanes.
d. Switzerland Bovy (1991) developed a linear model based on studies of roundabouts in Switzerland.
gVC )9/8(1500 −= (2.4) Where:
C = entry capacity, vph; and Vg = impeding flow vph, determined with the equation below.
scg VVV αβ += (2.5) Where: Vc = circulating flow, vph; Vs = exiting flow, vph; and α, β = parameters depending on geometry and number of circulating lanes.

Chapter 2—Literature Review
2-9
e. France The French government organization Centre d’Etudes des Transports Urbains (CETUR), now known as CERTU, developed a linear model for urban roundabout capacity in 1988.
gVC )6/5(1500 −= (2.6) Where: C = entry capacity, vph; and Vg = impeding flow, vph, determined with the equation below.
scg VVV α+= (2.7) Where: Vc = circulating flow, vph; Vs = exiting flow, vph; and α = parameter dependent on splitter island width. SETRA, the French national design organization for rural highways, developed a linear equation for the capacity of rural roundabouts in 1987.
])5.3[1.01)(7.01330( −+−= eg lVC (2.8) Where: C = entry capacity, vph; Vg = impeding flow, vph, dependent on circulating and exiting flows and geometry; and le = entry width, m.

Chapter 2—Literature Review
2-10
f. United States The Highway Capacity Manual 2000 (HCM) presents methodology for estimating roundabout capacity based on gap acceptance. The capacity model presented is applicable only to single-lane roundabouts and if the circulating volume is less than 1,200 vph. Insufficient experience in the U.S. precludes the HCM from containing guidelines for multiple-lane roundabouts. The HCM assumes that the gap acceptance characteristics of drivers entering a roundabout to be similar to those of drivers making right turns at two-way stop-controlled intersections.
3600/
3600/
1 tc
cc
tv
tvc
a eev
c −
−
−= (2.9)
Where: ca = approach capacity, vph; vc = conflicting circulating traffic, vph; tc = critical gap, s; and tt = follow-up time, s. The HCM 2000 recommends ranges for critical gap and follow-up times, which are presented in Table 2.1. TABLE 2.1 HCM Critical Gap and Follow-up Times (HCM 2000, Exhibit 17-37)
Critical gap (s) Follow-up time (s) Upper bound 4.1 2.6 Lower bound 4.6 3.1
FIGURE 2.1 Roundabout Approach Capacity (HCM 2000, Exhibit 17-38)

Chapter 2—Literature Review
2-11
The U.S. Federal Highway Administration (FHWA) publication, Roundabouts: An Informational Guide (2000) presents a more comprehensive discussion of roundabout performance analysis than the HCM 2000. This document differentiates roundabouts based upon size and environment and provides capacity models for urban compact roundabouts, typical single-lane roundabouts, and typical double-lane roundabouts. Urban compact roundabouts have nearly perpendicular single-lane approach legs and inscribed circle diameters in the range of 25 to 30 m (82 to 98.5 ft). The capacity model for urban compact roundabouts is based on the capacity curves developed by Brilon, Wu, and Bondzio (1997) for German roundabouts with single-lane entries and a single-lane circulatory roadway.
ce QQ 74.01218 −= (2.10) Where: Qe = entry capacity, vph; and Qc = circulating flow, vph. The British equations developed by Kimber (1980) form the basis for the capacity models derived for typical single-lane and double-lane roundabouts. The indicated assumptions of geometric parameters were chosen so as to simplify the equations. Single-lane roundabouts:
( ) ( ){ }cce QQMinQ −−= 1800,5447.01212 (2.11)
Assuming: D = 40 m, r = 20 m, φ = 30°, v = 4 m, e = 4 m, l’ = 40 m. Double-lane roundabouts:
ce QQ 7159.02424 −= (2.12)
Assuming: D = 55 m, r = 20 m, φ = 30°, v = 8 m, e = 8 m, l’ = 40 m. Where: Qe = entry capacity, vph; Qc = circulating flow, vph;
D = inscribed circle diameter, m; r = entry radius, m; φ = entry angle, degrees;
v = approach half width, m;

Chapter 2—Literature Review
2-12
e = entry width, m; and 'l = effective flare length, m.
When capacity requirements are met at double-lane roundabouts with the gradual widening of the approaches (flaring), the capacity of each entry lane, qmax, is estimated with the equation below. Equation 2.13 is based on Wu’s (1997) studies on the effect of short lanes on entry capacity for two-lane roundabouts.
12max
1max 222
++==
nn
qx
qq (2.13)
Where:
q = flow in each lane, pce/h (assumed to be equal in both lanes); x = degree of saturation; n = length of queue space, vehicles; and qmax 2 = capacity of entry at a double-lane roundabout, pce/h.
Figure 2.2 shows a comparison of entry capacities based on the equation provided by the FHWA Roundabouts: An Informational Guide.
FIGURE 2.2 Entry Capacities for Single and Double-lane Roundabouts (FHWA, 2000)

Chapter 2—Literature Review
2-13
g. Polus and Shmueli (1997) Polus and Shmueli developed an exponential regression model based on their studies of six small to medium-sized roundabouts in Israel. The model yields an exponential decrease in entry capacity with an increase in circulating flow and a significant increase in entry capacity with an increase in outside diameter.
)00095.0(31.0394 VceDC −= (2.14) Where: C = entry capacity, vph; D = outside diameter, m; and Vc = circulating flow, vph. Figure 2.3 presents circulating flow versus entry capacity for the six study sites.
FIGURE 2.3 Models for Entry Capacities versus Circulating Flows for Study Sites (Polus and Shmueli, 1997) Shiftan, Polus, and Shmueli-Lazar (2003) used a binary logit model to estimate the effect of waiting time at a roundabout entry on the likelihood of accepting different gaps. The model, presented as Figure 2.4, shows that critical gap decreases as waiting time increases. For example, after a waiting time of 10 seconds, the critical gap was about 4 seconds whereas after a waiting time of 80 seconds, the critical gap was about 3 seconds.

Chapter 2—Literature Review
2-14
In capacity models for which the critical gap is an input, such a reduction would significantly increase entry capacity.
FIGURE 2.4 Critical Gap as a Function of Waiting Time (Shiftan et al., 2003) Polus, Shmueli-Lazar, and Livneh (2003) found that an increase in waiting time results in a decrease in critical gap. The logistic model developed for the decrease in critical gap has an s-shaped curve between the maximum and minimum critical gap values and is presented as Figure 2.5. The authors also calibrated an exponential capacity model that includes critical gap as an input.
ccrVteDC 00023.031.0394 −= (2.15) Where: C = entry capacity, vph; D = outside diameter, m; tcr = critical gap, s; and Vc = circulating volume, vph.

Chapter 2—Literature Review
2-15
FIGURE 2.5 Calibration of S-curves for Critical Gaps Versus Waiting Times (insert shows entire range of curves) (Polus et al., 2003)
FIGURE 2.6 Model for Entry Capacity for Various Critical Gaps (Polus et al., 2003)

Chapter 2—Literature Review
2-16
FIGURE 2.7 Model for Entry Capacity for Various Outside Diameters (Polus et al., 2003) h. Polus and Shmueli (1999) Polus and Shmueli (1999) found that the capacities predicted by the model were generally consistent with the observed capacities of the two roundabouts. At one site, however, it was observed that a 6.5% upgrade on the approach resulted in an increase in gap acceptance values. The following model was also developed for determining the maximum relevant gap at roundabouts.
2/1
⎟⎟⎠
⎞⎜⎜⎝
⎛+
==fe
RkSRGt
π (2.16)
Where: Gt = threshold gap, s; R = radius of the vehicle path around the central island, m; S = operating speed around the circle, m/s; e = superelevation of the vehicle path around the central island, m/m; f = side friction coefficient; and k = coefficient representing local conditions, s/m. The critical gaps were found to be 4.1 and 4.2 s. It was also found that the critical gap decreased as the average waiting time on the entry leg exceeded 9 seconds. The authors

Chapter 2—Literature Review
2-17
calibrated the following model for predicting the critical gap when considerable waiting times (longer than 9 seconds) exist on an entry leg. Figure 2.8 shows the calibrated model and it can be seen that for waiting times approaching 25 seconds, the critical gap is decreased to near or below 4 seconds.
WTCW eT 0142.0757.5 −= (2.17)
Where: TCW = critical gap at the roundabout, s; and WT = waiting time on the entry leg, s.
FIGURE 2.8 Relationship Between Critical Gap and Average Waiting Time (Polus and Shmueli, 1999) i. Al-Masaeid and Faddah (1997) The following general equation was found to best fit the capacity data after a multivariate regression analysis was conducted
000,10/602.5019.0071.0219.0312.02.168 cqRWEW eeSDqe−+= (2.18)
Where:
qe = entry capacity, vph; D = central island diameter, m;
Chapter 2—Literature Review
2-18
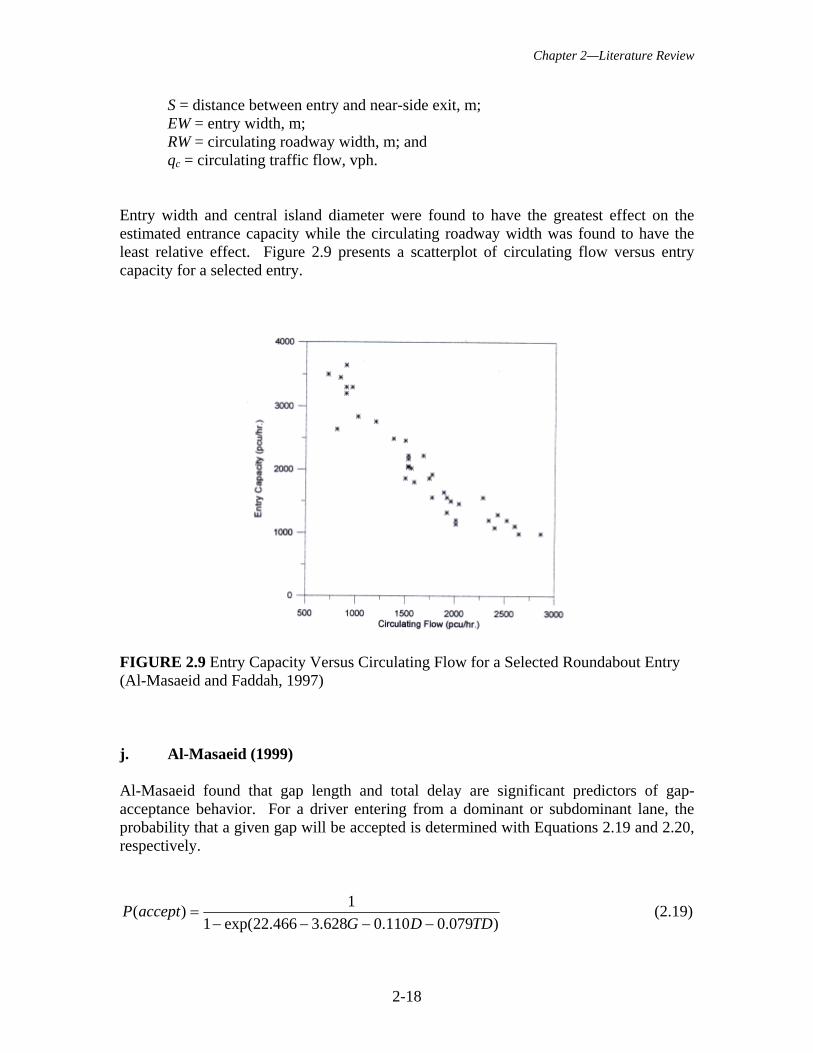
S = distance between entry and near-side exit, m; EW = entry width, m; RW = circulating roadway width, m; and qc = circulating traffic flow, vph.
Entry width and central island diameter were found to have the greatest effect on the estimated entrance capacity while the circulating roadway width was found to have the least relative effect. Figure 2.9 presents a scatterplot of circulating flow versus entry capacity for a selected entry.
FIGURE 2.9 Entry Capacity Versus Circulating Flow for a Selected Roundabout Entry (Al-Masaeid and Faddah, 1997) j. Al-Masaeid (1999) Al-Masaeid found that gap length and total delay are significant predictors of gap-acceptance behavior. For a driver entering from a dominant or subdominant lane, the probability that a given gap will be accepted is determined with Equations 2.19 and 2.20, respectively.
)079.0110.0628.3466.22exp(11)(
TDDGacceptP
−−−−= (2.19)

Chapter 2—Literature Review
2-19
)054.0096.0660.2929.19exp(11)(
TDDGacceptP
−−−−= (2.20)
Where:
G = length of gap, s; D = roundabout diameter, m; and TD = total delay, s.
Using multiple regression analysis, Equations 2.21 and 2.22 were obtained to estimate move-up time.
FSDd 36.0004.0013.031.3 −−−=β (2.21)
FSDs 38.0003.0013.086.3 −−−=β (2.22) Where:
βd = move-up time for drivers in dominant lane, s; βs = move-up time for drivers in subdominant lane, s; D = roundabout diameter, m; S = distance between roundabout entry and near side next exit, m; and F = average circulating traffic flow per lane, thousands passenger car units per hour.
Al-Masaeid found the effect of roundabout diameter on gap-acceptance behavior in the dominant and subdominant lanes to be approximately equal. However, vehicles in the dominant lane are more sensitive to gap length and total delay than are those in subdominant lanes. Figure 2.10 shows the effect of diameter on the critical gap for a dominant lane at a total delay of 10 s. For the same diameter and delay, vehicles in the dominant lane are willing to accept smaller gaps in the circulating stream and, therefore, dominant lanes have greater capacity. Al-Masaeid’s finding that entry capacity increases as diameter increases is consistent with those of previous studies, namely, Troutbeck (1993), Al-Masaeid and Faddah (1997), and Polus and Shmueli (1997).

Chapter 2—Literature Review
2-20
FIGURE 2.10 Effect of Diameter on Critical Gap of a Dominant Lane (total delay 10 s) (Al-Masaeid, 1999) Al-Masaeid identified total delay as an influencing factor in the probability that an entering driver accepts a gap. This is significant in that total delay had not been considered in modeling driver decision at roundabout entry prior to this study. Figure 2.11 shows that the entry capacity increases as delay increases. This is expected because critical gap and move-up time values decrease the longer drivers wait at the entry.
FIGURE 2.11 Estimated Entry Capacity Versus Circulating Flow at Different Total Delay Levels (Al-Masaeid, 1999)

Chapter 2—Literature Review
2-21
k. Hagring (2000) Hagring found that capacity is strongly influenced by the allocation of the circulating flow on the two circulating lanes. The maximum capacity is obtained when the circulating flow is equally distributed between the two lanes and the minimum when the flow is allocated to one lane only. This proposed model assumes an equal degree of saturation of the entering vehicles onto entrance lanes and is based on a generalized M3 distribution of headways in the circulating stream. Cowan’s (1975) M3 model is a dichotomized headway model which assumes a proportion, α, of free vehicles and a proportion, 1-α, of bunched vehicles.
)1( 0mmm
kkk
T
T
ii
ii
eeeq
C λ
λ
λα
Σ−Λ∆−
Σ−
−Λ= ∏ (2.23)
Where: C = capacity;
Λ = ∑i
iλ ;
α = 0.910-1.545q = proportion of free vehicles in lane i; q = flow in lane i; λ = (qα)/(1-q∆) = intensity for longer gaps in lane i; T = critical gap, s; ∆ = minimum headway between vehicles, s; and T0 = follow-up time, s.
Hagring suggested two algorithms for use in this capacity model allocating the circulating flow between the two circulating lanes. The difference between the two is the treatment of left-turning vehicles from the opposite approach. While the first algorithm assumes that they choose the near or far circulating lane with equal probability, the second assumes that all vehicles choose the near circulating lane Earlier studies by Hagring (1996, 1998) found that critical gap differs between the two entering lanes at a two-lane roundabout. The studies also found that right-turning vehicles in the outer entry lane had significantly smaller critical gaps than those of other turning movements at the same approach. Critical gaps were found to be very similar regardless of which of the two circulating lanes vehicles were entering and it was therefore concluded that both circulating streams impede entering vehicles. Hagring related critical gap to the size of the weaving area between two adjacent roundabout approaches with Equation 2.24.

Chapter 2—Literature Review
2-22
)1(592.0121.00278.091.3 −++−= LNwLT (2.24) Where: T = critical gap; L = length of weaving section; w = width of weaving section; and NL = lane number (outer lane = 1, inner lane = 2). Figures 2.12 and 2.13 show the estimations of capacity for one roundabout approach using two synthetic data sets.
FIGURE 2.12 Estimated Capacity Versus Left-turn Flow of Opposite Approach, Data Set 1 (Hagring, 2000)
FIGURE 2.13 Estimated Capacity Versus Left-turn Flow of Opposite Approach, Data Set 2 (Hagring, 2000)

Chapter 2—Literature Review
2-23
2.2.2 DELAY STUDIES AND MODELS a. FHWA Roundabouts: An Informational Guide The HCM 2000 does not provide guidance for estimating delay at roundabouts. The FHWA Roundabout Guide provides a modified version of the equation given by the HCM for control delay at two-way stop-controlled (TWSC) intersections as an estimate for roundabout control delay. Equation 2.23 omits the additional 5 s included in the HCM equation that accounts for deceleration to and acceleration from a complete stop at a TWSC intersection. This is because control delay at roundabouts may be less than 5 s, as vehicles are not required to come to a complete stop.
⎥⎥⎥⎥⎥⎥
⎦
⎤
⎢⎢⎢⎢⎢⎢
⎣
⎡
⎟⎟⎠
⎞⎜⎜⎝
⎛⎟⎟⎠
⎞⎜⎜⎝
⎛
+⎟⎟⎠
⎞⎜⎜⎝
⎛−+−×+=
Tcv
ccv
cv
Tc
d xm
x
xm
xm
x
xm
x
xm 450
3600
119003600 ,,2
,,,
(2.25)
Where:
d = average control delay, sec/veh; vx = flow rate for movement x, veh/h; cm,x = capacity of movement x, veh/h; and T = analysis time period, h (T=0.25 for a 15-minute period).
Figure 2.14 presents control delay as a function of varying capacity and entering flow values. Note the exponential shape of the relationships.

Chapter 2—Literature Review
2-24
FIGURE 2.14 Control Delay as a Function of Capacity and Entering Flow (FHWA, 2000)
b. Flannery, Elefteriadou, Koza, and McFadden (1998) As shown in Table 2.2, all but one site experienced a reduction in control delay after the roundabouts were installed. This is most likely due to the change in the spread of delay among the approaches; where once some approaches had delay while others had none, there is now a more uniform delay for all. TABLE 2.2 Control Delay Before and After the Installation of Roundabout (Flannery et al., 1998)
Location Estimated avg. control delay in before period (stop-controlled) (s/veh)
Measured avg. control delay in after period (roundabout) (s/veh)
Palm Beach Co., Florida 2.71 0.97 Lisbon, Maryland 10.36 1.62
Tallahassee, Florida 5.58 9.04 Ft. Walton Beach, Florida 163.52 3.36
Lothian, Maryland 9.62 4.15 c. Flannery, Kharoufeh, Gautam, and Elefteriadou (2000) In order to develop a model that is not dependent on a specific headway distribution in the circulating stream, the queuing system was modeled as an M/G/1 queuing regime.

Chapter 2—Literature Review
2-25
An M/G/1 queuing regime consists of a Poisson arrival process and hence exponential (or Markovian) time between successive arrivals (M), a general distribution of service times (G), and a single server (1). The queuing model assumes instantaneous service, i.e., zero time for vehicle passage into the circulating stream as well as infinite physical space for queue storage. Assuming the same gap acceptance criteria for all vehicles, the mean average accepted gap during each study period was used to estimate the mean and variance of service time. Denoting headway times in the circulating stream as some general distribution function )(⋅=F , the expected service time is given below.
⎪⎭
⎪⎬⎫
⎪⎩
⎪⎨⎧
⎥⎥⎦
⎤
⎢⎢⎣
⎡−−−−= ∫∫∫ −
ggg
ttdFdttFggfdtttFgTE00
1
0
2 )()())(1()(211)(
τ (2.26)
Where:
E(T) = expected service time, s; g = mean acceptable gap size for drivers arriving at the approach, s; and τ = mean time headway for circulating vehicles, s.
The variance of service time is given the following equation.
( )
[ ]2
0 00
2
0
1
00
220
3
)()()(2)())(1()(1
)()(2)(311)(
TEttdFTEtdFtgFdttFg
dttFTtEtgTEgTVAR
g gg
g
−⎟⎟⎠
⎞⎜⎜⎝
⎛+⋅⎟
⎟⎠
⎞⎜⎜⎝
⎛−−+
⎟⎟⎠
⎞⎜⎜⎝
⎛⋅+−+=
∫ ∫∫
∫
−
τ
τ (2.27)
where the last term is obtained by Equation 2.26 and ∫−−=g
ttdFgFTE0
10 )())(1()( .
The mean and variance of service time are then used with the Pollaczek-Khintchine formula to estimate the average number of queued vehicles L and Little’s law to estimate the mean waiting time W.
[ ]))(1(2
)())(()(22
TETVARTETEL
λλλ
−+
+= (2.28)
Where:
L = average number of queued vehicles; and

Chapter 2—Literature Review
2-26
λ = mean arrival rate to the queue.
λLW = (2.29)
Where:
W = mean waiting time; L = average number of queued vehicles (from Equation 2.22); and λ = mean arrival rate to t he queue.
Table 2.3 shows a comparison between results obtained from the developed models and those observed in the field. The headway distribution in the circulating stream was modeled as lognormal, as this was found to best represent the observed conditions. It is important to note that the developed model facilitates the use of any headway distribution in the circulating stream. TABLE 2.3 Deviation Between Field and Modeled Values (lognormal headway) (Flannery et al., 2000)
Statistic Mean service time (s) Std. dev. of service time (s) Mean Absolute Deviation 1.2710 1.3727 Max. Absolute Deviation 6.9500 6.0784
d. Al-Omari, Al-Masaeid, and Al-Shawabkah (2004) Using 15-minute time intervals, the empirical model shown as Equation 2.30 was developed (see Figure 2.15).
ecicss WWDVVD 3083.08048.01802.00056.00027.0 −+−+= (2.30) Where:
Ds = stopped delay; sec/veh; Vs = volume of vehicles in the subject entry, vph; Vc = volume of vehicles in the circulating roadway, vph; Di = diameter of the roundabout island, m; Wc = width of the circulating roadway, m; and We = width of the subject approach entry, m.

Chapter 2—Literature Review
2-27
FIGURE 2.15 Proposed Model versus Field Stopped Delay (Al-Omari et al., 2004) e. Russell, Mandavilli, and Rys (2005) The study concluded that for the intersections studied, modern roundabouts operate more efficiently than the before traffic control. Following the conversion to modern roundabouts, the study found a 65% decrease in the average intersection delay, a 71% decrease in the maximum approach delay, a 44% decrease in the 95% queue length, a 53% decrease in the degree of saturation, a 52% decrease in proportion of vehicles stopped, and a 42% decrease in the maximum proportion of vehicles stopped. All decreases were found to be statistically significant. Since the delay, queue, and proportion of vehicles stopped were significantly reduced, the authors conclude that the operational efficiency of these intersections should therefore improve significantly.
Chapter 2—Literature Review
2-28
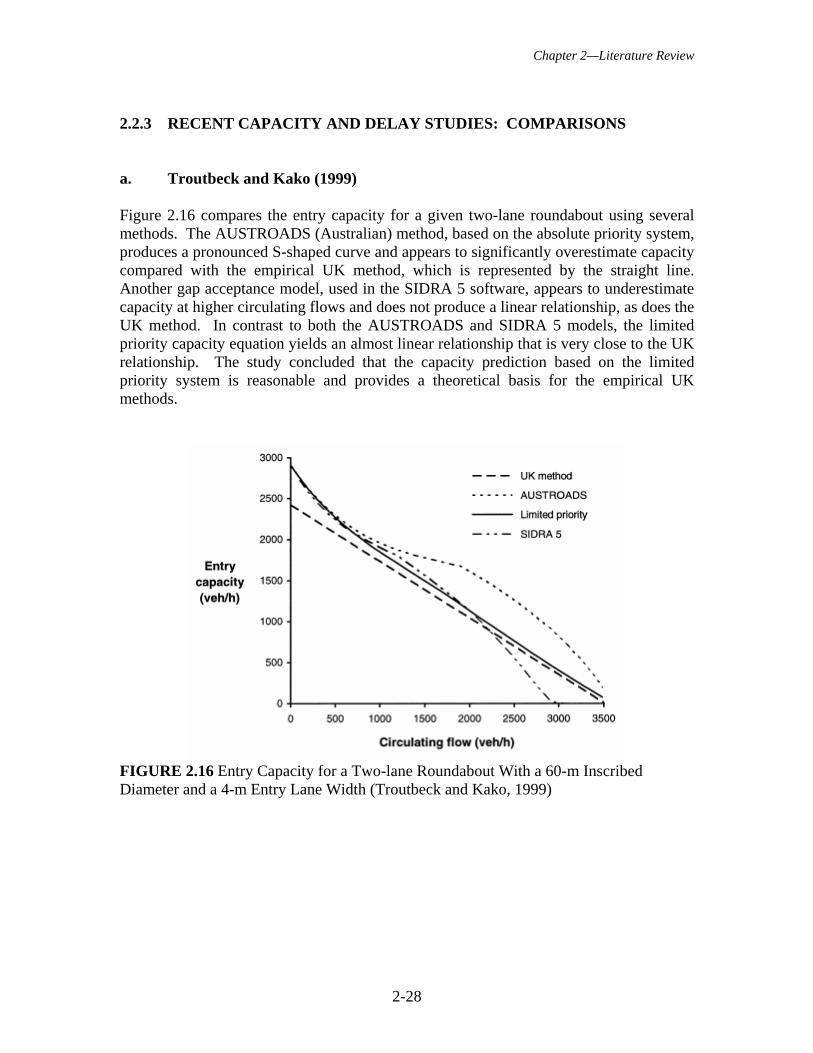
2.2.3 RECENT CAPACITY AND DELAY STUDIES: COMPARISONS a. Troutbeck and Kako (1999) Figure 2.16 compares the entry capacity for a given two-lane roundabout using several methods. The AUSTROADS (Australian) method, based on the absolute priority system, produces a pronounced S-shaped curve and appears to significantly overestimate capacity compared with the empirical UK method, which is represented by the straight line. Another gap acceptance model, used in the SIDRA 5 software, appears to underestimate capacity at higher circulating flows and does not produce a linear relationship, as does the UK method. In contrast to both the AUSTROADS and SIDRA 5 models, the limited priority capacity equation yields an almost linear relationship that is very close to the UK relationship. The study concluded that the capacity prediction based on the limited priority system is reasonable and provides a theoretical basis for the empirical UK methods.
FIGURE 2.16 Entry Capacity for a Two-lane Roundabout With a 60-m Inscribed Diameter and a 4-m Entry Lane Width (Troutbeck and Kako, 1999)

Chapter 2—Literature Review
2-29
b. Polus and Shmueli (1997) Capacity estimates were obtained with the Australian, German, English, and Swiss models to compare against those from the developed model. The results from the proposed model show a good fit to the other models, as seen in Figure 2.17. A very close fit to the German model was obtained, though it is not dependent on the diameter. The Australian model yielded slightly higher entry capacities for moderate to low circulating flows and lower entry capacities for high circulating flows.
FIGURE 2.17 Entry Capacities Versus Circulating Flows for D Between 30 and 60 m (Polus and Shmueli, 1997) c. Al-Masaeid and Faddah (1997) Figure 2.18 shows the relationships between estimated entry capacity and circulating traffic flow for Jordanian and German roundabouts with comparable geometric data. It can be seen that for low circulating flow both models yield similar capacities. However, as traffic flow increases, the Jordanian model (Equation 2.18) provides higher capacity values than does the German (Equation 2.3), with the maximum difference being 100 pcu/h. The authors attribute this to differences in driving behaviors in the two countries.

Chapter 2—Literature Review
2-30
FIGURE 2.18 Jordanian and German Capacity Values for Different Numbers of Entry Lanes (EN) and Circulating Roadway Lanes (RN) (Al-Masaeid and Faddah, 1997) d. Al-Masaeid (1999) Figure 2.19 shows the relationship between the ratio of estimated capacity to observed capacity and the circulating traffic flow for three cases. The results suggest that the Australian capacity model with a minimum headway of 0.5 s is best applicable to Jordanian conditions.
FIGURE 2.19 Performance of Australian and Siegloch Gap Theoretical Models (Al-Masaeid, 1999)

Chapter 2—Literature Review
2-31
e. Hagring (2000) Hagring studied the OD model proposed by Akçelik et al. (1996) and Akçelik (1997), which reduces the basic gap acceptance capacity by a factor that takes into account the origin-destination pattern. The model proposed by Akçelik differs from that proposed by Hagring in that it is also applicable to one-lane roundabouts and is symmetric, that is, it makes no distinction between which of the approaches is dominant. Figure 2.20 compares the capacities estimated by an ordinary gap acceptance model with those estimated by the Akçelik model. The plot, based upon Swedish roundabout measurements, indicates that the SR45/AUSTROADS method (Troutbeck 1989) overestimates capacity. The effects on capacity given by the Akçelik OD model depend not only on the OD pattern but also on the proportion of queued vehicles, and so the overestimation of capacity shown in Figure 2.20 does not depend solely on the OD flow.
FIGURE 2.20 Predicted Capacity from Ordinary Gap Acceptance Model and Akçelik Model (Hagring, 2000) f. Flannery, Elefteriadou, Koza, and McFadden (1998) To evaluate the accuracy of the SIDRA software in predicting delay for U.S. single-lane roundabouts, a comparison of the field-measured control delay with that predicted by the software is shown in Figure 2.21. SIDRA appears to accurately predict delay for sites with lower volumes, whereas for sites with higher volumes, the software tends to underestimate delay. The authors concluded that SIDRA is valid for predicting delay in U.S. roundabouts and attributed the discrepancy at higher volumes to differences between Australian and U.S driving behavior.

Chapter 2—Literature Review
2-32
FIGURE 2.21 Comparison of Field-measured Delay and SIDRA-predicted Delay (Flannery et al., 1998) g. Flannery, Kharoufeh, Gautam, and Elefteriadou (2000) The Troutbeck (1993) model estimates service time as the inverse of approach capacity and its variance is indirectly accounted for by assuming deterministically or exponentially distributed service times. Comparisons between the Troutbeck and developed models are presented in Figures 2.22 and 2.23. Figure 2.22 shows the insensitive nature of the Troutbeck model as the circulating flow increases, whereas the new model predicts an increase in delay as is expected. Figure 2.23 plots the differences between field and estimated delay and shows that both models initially under-predict delay. With increasing circulating flow, however, the new model appears to predict delay more accurately than the Troutbeck method.

Chapter 2—Literature Review
2-33
FIGURE 2.22 Model-estimated System Delay Versus Conflicting Hourly Flow (Flannery et al., 2000)
FIGURE 2.23 Field System Delay Versus Model-estimated System Delay (Flannery et al., 2000)

Chapter 2—Literature Review
2-34
h. Al-Omari, Al-Masaeid, and Al-Shawabkah (2004) The measured stopped delay was regressed against both the M/M/1 and SIDRA models. Figures 2.24 and 2.25 show plots between actual and predicted delay times using the M/M/1 and SIDRA models, respectively. Both models show high variability, particularly in the upper delay range. The follow-up headway and critical gap times are the primary parameters used by the SIDRA model to estimate delay. These parameters were calibrated and the estimated versus observed delay times were plotted as shown in Figure 2.25. The SIDRA values again show high variability, especially for greater delay. The authors conclude that the large difference between the SIDRA and observed delay values is due to the difference in driving behavior between Jordanian and Australian drivers.
FIGURE 2.24 M/M/1 Model versus Field Stopped Delay (Al-Omari et al., 2004)
FIGURE 2.25 SIDRA versus Field Stopped Delay (Al-Omari et al., 2004)

Chapter 2—Literature Review
2-35
2.3 EMISSIONS AND ENVIRONMENTAL IMPACTS OF ROUNDABOUTS a. Várhelyi (2001) The traffic counts showed no significant changes between volumes before and after the installations of small roundabouts. The influence area around each junction was divided into two areas: an approach stretch and an exit stretch. Table 2.4 shows data for the junction that was formerly a signalized intersection. The delay per car decreased an average of 11 s and the number of cars stopping at the junction decreased from 63% to 26% of the total. Both CO and NOx emissions and fuel consumption decreased on approaches and increased slightly on exits. The replacement of the signalized intersection resulted in an average decrease of 29% in CO emissions, 21% in NOx emissions, and 28% in fuel consumption per car within the influence area. TABLE 2.4 Average CO and NOx Emissions and Fuel Consumption per Car and per Day at a Signalized Intersection Rebuilt as a Roundabout (Average Traffic Volume 23,500 veh/day) (Várhelyi, 2001) Number of stretches Per car Per day Approach Exit Total 4 4 8 Number of Observations Before 102 109 211 After 164 167 331
CO Before 2817 mg 611 mg 3428 mg 80.5 kg After 1777 mg 650 mg 2427 mg 57.0 kg Change -1040 mg 39 mg -1001 mg -23.5 kg -37%* +6% -29% -29% NOx Before 273 mg 109 mg 382 mg 8.9 kg After 193 mg 107 mg 300 mg 7.0 kg Change -80 mg -2 mg -82 mg -1.9 kg -29% -2% -21% -21% Fuel Consumption Before 17236 mg 4287 mg 21523 mg 505.7 kg After 10913 mg 4455 mg 15368 mg 361.1 kg Change -6323 mg +168 mg -6155 mg -144.6 kg -37% +4% -28% -28% * Statistically significant change (P < 0.05) according to the sign test.

Chapter 2—Literature Review
2-36
Table 2.5 shows data for the junctions that were formerly yield-regulated. Time consumption increased for cars traveling on major streets and decreased for those traveling on minor streets. This translated into overall increased emissions and fuel consumption for major streets and decreased emissions and fuel consumption for minor streets. Considering average traffic volumes in an average junction, total CO emissions increased by 6%, NOx emissions increased by 4%, and fuel consumption increased by 3%. TABLE 2.5 Average CO and NOx Emissions and Fuel Consumption per Car and per Day at an Average Junction with Yield Regulation Before and After Rebuilding (Várhelyi, 2001) Number of stretches
Per car Per day
Major street Minor street Approach Exit Total Approach Exit Total 15 16 31 6 6 12 Number of observations
Before 399 406 805 82 71 153 After 548 532 1080 69 73 142 Average traffic volume (both directions)
9700 veh/day
3130 veh/day
12830 veh/day
CO Before 1483 mg 1313 mg 2796 mg 1708 mg 843 mg 2551 mg 35.1 kg After 1565 mg 1601 mg 3166 mg 1102 mg 925 mg 2027 mg 37.0 kg Change +82 mg +288 mg +370 mg -606 mg +82 mg -524 mg +1.9 kg +6% +22%* +13%* -35%* +10% -20% +6%
NOx Before 238 mg 200 mg 439 mg 162 mg 146 mg 308 mg 5.2 kg After 196 mg 278 mg 475 mg 112 mg 150 mg 262 mg 5.4 kg Change -42 mg +78 mg +36 mg -50 mg +4 mg -46 mg +0.2 kg -18%* +39%* +8% -31%* +3% -15% +4%
Fuel consumption
Before 11563 mg 9728 mg 21291 mg 9784 mg 5601 mg 15385 mg 254.6 kg After 11033 mg 11976 mg 23009 mg 6482 mg 5745 mg 12227 mg 261.4 kg Change -530 mg +2248 mg +1718 mg -3302 mg +144 mg -3158 mg +6.8 kg -5%* +23%* +8% -34%* +3% -21% +3% *Statistically significant change (P < 0.05) according to the sign test.
Comparing the relative amount of decreased and increased emissions and fuel consumption shown in Tables 2.4 and 2.5, respectively, Várhelyi concluded that, “reductions at a rebuilt signalised [sic] intersection can “compensate for” the increase of

Chapter 2—Literature Review
2-37
emissions and fuel and fuel consumption at several yield regulated intersections rebuilt as roundabouts.” b. Mandavilli, Russell, and Rys (2003) Four measures of effectiveness were obtained from the SIDRA software for use in this study: carbon monoxide, carbon dioxide, nitrogen oxides, and hydrocarbons. Statistical analysis was done separately for the AM and PM data and the results were averaged for all sites studied. Table 2.6 presents the overall results from this analysis. TABLE 2.6 Overall Emissions Results (Mandavilli et al., 2003) Measures Of Effectiveness SC* RA* % Diff. Statistically Different
AM Results Carbon Monoxide (kg/hr) 9.77 7.67 -21% Yes Carbon Dioxide (kg/hr) 138.91 117.18 -16% Yes Oxides of Nitrogen (kg/hr) 0.31 0.25 -20% Yes Hydrocarbons (kg/hr) 0.23 0.19 -18% Yes
PM Results
Carbon Monoxide (kg/hr) 11.8225 6.855 -42% Yes Carbon Dioxide (kg/hr) 335.7 138 -59% Yes Oxides of Nitrogen (kg/hr) 0.3875 0.2015 -48% Yes Hydrocarbons (kg/hr) 0.662375 0.23 -65% Yes * SC denotes AWSC or TWSC, RA denotes Roundabout Results from the SIDRA analysis also showed a statistically significant decrease in delay, queuing, and stopping after the modern roundabouts were installed. This is evident from the decreases in all measures of effectiveness. Statistical tests also showed that all of these decreases are statistically significant. Based on these results, Mandavilli et al. concluded that the installation of modern roundabouts significantly reduced vehicular emissions by making traffic flow orderly and that a modern roundabout may be the best alternative for reducing emissions at several other Kansas intersections with ranges in traffic volume similar to those at the sites used in this study.

3-1
3.0 STUDY METHODOLOGY AND SIDRA SOFTWARE This study uses simulation analysis to compare roundabouts with unsignalized and signalized intersections with regard to their operational performance. The unsignalized intersection used for this analysis is two-way stop controlled (TWSC) and the signalized intersection is a pre-timed signal. All intersections types evaluated have four legs and consist of a “major” road and a “minor” road. The major road volume is twice that of the minor road. The turning percentages used for this analysis are 10% left-turning, 80% through, and 10% right-turning vehicles on the major road and 20% left-turning, 60% through, 20% right-turning vehicles on the minor road. Two scenarios were developed for the analysis; the first scenario assumes a heavy vehicle (HV) percentage of 10% on both major and minor roads and the second assumes a HV percentage of 10% on the minor road and 20% on the major road. The roundabout assumed for the analysis is a single-lane roundabout with a central island diameter of 100 ft (30.5 m) and a circulating roadway width of 18 ft (5.5 m). The terrain is assumed to be level, where the grade on all approaches is less than 2%, as this is most common in Delaware. All approaching and departing lanes are 12 ft (3.7 m) wide. The simulation software used for this study is aaSIDRA (Signalized and unsignalized Intersection Design and Research Aid), also known as SIDRA, version 2.1. Both the U.S. Highway Capacity Manual 2000 (HCM) and the Federal Highway Administration (FHWA) Roundabout Guide recognize the SIDRA software package for the analysis of intersection capacity, level of service, and other performance characteristics. SIDRA uses an empirical gap-acceptance method to model roundabout performance that takes into account both the roundabout geometry and driver behavior and is applicable for both left-hand and right-hand driving. The software is capable of analyzing signalized intersections (actuated and fixed-time), unsignalized intersections including two-way stop-controlled, all-way stop-controlled, and yield-controlled intersections, and roundabouts. The SIDRA default roundabout critical gap and follow-up time values are not fixed and are estimated as functions of the roundabout geometry, circulating flow, and entry lane flows. The software package offers the option to use the HCM capacity model as well as default gap-acceptance values based upon HCM parameters for two-way stop sign controlled intersections and the HCM delay and queue equations for signalized and two-way stop-sign controlled intersections. Analysis based on SIDRA is therefore aptly suited to U.S. conditions. The SIDRA capacity model may also be calibrated as to better reflect road and local driver characteristics. Consequently, the roundabout analysis conducted in this study has been calibrated for local driver characteristics using critical gap and follow-up times determined from the data collection.

4-1
4.0 DATA COLLECTION AND REDUCTION Two Maryland single-lane roundabouts near the Delaware border were studied in early 2005 in order to collect data. One site is located at the intersection of MD 273 and MD 276 in Cecil County and the other at the intersection of MD 18 and Castle Marina Road in Queen Anne’s County. At each site, the approach with the highest volume entering the roundabout and the highest conflicting volume around the circle was identified and videotaped. The two locations were chosen for their similarities to each other in geometric and traffic characteristics, as well as their proximity to Delaware. Table 4.1 presents traffic and geometric information provided by the Maryland State Highway Administration (SHA) prior to data collection. TABLE 4.1 Traffic and Geometric Data
Site AADT (vpd)
Outer/Inner Diameter (ft) Date of Construction
Cecil County, MD 16,3501 140 / 86 Fall 2002 Queen Anne’s County, MD 14,0002 130 / 30 December 1999 1collected in 2000 2collected in 1999 Source: Maryland SHA The videotapes were reviewed in order to extract data consisting of rejected lags and gaps, accepted lags and gaps, and follow-up times. The lag was determined as the difference between the time at which an entering vehicle arrived at the front of the queue and the time at which the next circulating vehicle passed this location. The gap is defined as the difference in time between the passages of two consecutive circulating vehicles at a point in front of the entering queue. The follow-up time was determined as the time difference between the passage of an entering vehicle into the roundabout and the arrival of the subsequent entering vehicle to the front of the queue, recorded when a queue of at least three entering vehicles existed. The effects of circulating vehicles exiting the roundabout at the approach of interest are not within the scope of this study and so these vehicles were ignored in the data reduction. Figures 4.1 and 4.2 show the critical gap and follow-up times determined for the two study sites, respectively. The critical gaps were determined following Drew’s method for accepted and rejected gap times. The critical gaps found are slightly below the lower limit of 4.1 s recommended by the HCM 2000. Table 4.2 presents a summary of the critical gap and follow-up times found for each site. The operating speed of circulating vehicles was determined from the videotapes to be approximately 26 mph and therefore according to the model of Polus and Shmueli, the relevant gap is 8.2 s. That is, gaps larger than 8.2 s are accepted by all entering vehicles and are not relevant in determining the critical gap.

Chapter 4—Data Collection and Reduction
4-2
0.00
0.10
0.20
0.30
0.40
0.50
0.60
0.70
0.80
0.90
1.00
0.0 1.0 2.0 3.0 4.0 5.0 6.0 7.0 8.0
Gap size (s)
Rel
ativ
e Fr
eque
ncy
Accepted gaps < tRejected gaps > t
Critical gap = 3.85 s
(a)
0.00
0.10
0.20
0.30
0.40
0.50
0.60
0.70
0.80
0.90
1.00
0.0 1.0 2.0 3.0 4.0 5.0 6.0 7.0 8.0
Gap size (s)
Rel
ativ
e Fr
eque
ncy
Accepted gaps < tRejected gaps > t
Critical gap = 3.91 s
(b)
FIGURE 4.1 Determination of Critical Gap for (a) MD 273/MD 276 (Cecil County) and (b) MD 18/Castle Marina Road (Queen Anne’s County)

Chapter 4—Data Collection and Reduction
4-3
(a)
(b)
FIGURE 4.2 Distributions of Follow-up Time for (a) MD 273/MD 276 (Cecil County) and (b) MD 18/Castle Marina Road (Queen Anne’s County)
0
0.02
0.04
0.06
0.08
0.1
0.12
0.14
0.16
0.18
0 0.4 0.8 1.2 1.6 2 2.4 2.8 3.2 3.6 4 4.4 4.8 5.2 5.6
Follow-up time (s)
Rel
ativ
e fr
eque
ncy
Median = 1.9 sStandard deviation = 0.89 s
0
0.02
0.04
0.06
0.08
0.1
0.12
0.14
0.16
0 0.4 0.8 1.2 1.6 2 2.4 2.8 3.2 3.6 4 4.4 4.8 5.2 5.6
Follow-up time (s)
Rel
ativ
e fr
eque
ncy
Median = 2.1 sStandard deviation = 0.66 s

Chapter 4—Data Collection and Reduction
4-4
TABLE 4.2 Critical Gaps and Follow-up Times for Study Sites Site Critical Gap
(s) Follow-up Time
(s) MD 273/MD 276 3.85 1.9
MD 18/Castle Marina Road 3.91 2.1

5-1
5.0 PRELIMINARY ANALYSIS USING SIDRA DEFAULT GAP ACCEPTANCE VALUES
A preliminary analysis using the SIDRA software default gap acceptance parameters was conducted prior to data collection. The analysis compared the performances of a two-way stop controlled (TWSC) intersection, a roundabout, and a pre-timed un-actuated signal. Comparisons were based on the following measures of effectiveness (MOE): effective intersection capacity, major road capacity, minor road capacity, major road delay, minor road delay, major road 95% queue length, minor road 95% queue, and emissions (CO, CO2, HC, and NOX).
All intersections consist of four single-lane approaches. The analyses assume 12-ft wide lanes and no grade on all approaches. The roundabout inner diameter and circulating roadway width were assumed to be 100 ft and 18 ft, respectively.
Two roads, a “major road” and a “minor road,” were designated, where the total entering volume of the minor road was 50% of that of the major road in all cases. Assumed turning percentages were as follows: 10% right-turning, 80% through, and 10% left-turning vehicles on the major road and 20% right-turning, 60% through, and 20% left-turning vehicles on the minor road. For the TWSC, major road vehicles are given the right of way while the minor road vehicles are controlled by a stop sign. Two sets of tests were conducted. The first assumed 10% heavy vehicles (HV) on both roads. The second increased heavy vehicles on the major road to 20% while heavy vehicles on the minor road remained at 10%.
5.1 CAPACITY
The initial tests with heavy vehicle percentages of 10% on both roads studied four volume scenarios: major road one-way volumes (MRV) of 100, 500, 1000, and 1250 vph. The initial tests with heavy vehicle percentages of 20% on the major road tested MRVs of 100, 300, 500, and 700 vph. Effective intersection capacity results are shown in Figure 5.1. It can be seen that in both cases the capacity of the TWSC intersection continually decreases with increasing demand volume. Also in both cases, the roundabout initially provides greater capacity than the signal but is surpassed by the signal at greater volumes. This switch occurs between MRV 1000 and 1250 vph for 10% HV on both roads and between MRV 500 and 700 vph for 20% HV on the major road. As these MRVs were arbitrarily chosen for preliminary testing, further tests were carried out later on for many more volumes in order to obtain more accurate points of switch in advantage between intersection types.

Chapter 5—Preliminary Analysis using SIDRA Default Gap Acceptance Values
5-2
0
500
1000
1500
2000
2500
3000
3500
4000
4500
100 500 1000 1250
Major Road One-Way Volume (vph)10% heavy vehicles on both roads
Effe
ctiv
e In
ters
ectio
n Ca
paci
ty (v
ph)
RoundaboutTWSCSignal
0
500
1000
1500
2000
2500
3000
3500
4000
4500
100 300 500 700
Major Road One-Way Volume (vph)20% heavy vehicles on major road, 10% on minor road
Effe
ctiv
e In
ters
ectio
n Ca
paci
ty (v
ph)
RoundaboutTWSCSignal
FIGURE 5.1 Initial Effective Intersection Capacity Tests for Both Heavy Vehicle Scenarios
From these observations, the following may be stated: between the three intersection types, the TWSC intersection provides the best intersection capacity for lighter volumes, a signalized intersection provides the best intersection capacity for heavier volumes, and roundabouts provide the best intersection capacity for a mid-range of volumes. To further explore this, additional tests were conducted in order to obtain better estimates of these threshold volumes. The analyses were re-focused on comparing roundabouts versus TWSC intersections and roundabouts versus signalized intersections. Figure 5.2

Chapter 5—Preliminary Analysis using SIDRA Default Gap Acceptance Values
5-3
shows the crossover volume between a roundabout and a TWSC intersection for both heavy vehicle scenarios. Figure 5.3 shows the same between a roundabout and a signalized intersection.
FIGURE 5.2 Intersection Capacity Threshold Volumes, Roundabout vs. TWSC Intersection
1000
1500
2000
2500
3000
3500
4000
4500
0 100 200 300 400 500
Major Road One-Way Volume (vph)
Effe
ctiv
e In
ters
ectio
n Ca
paci
ty (v
ph)
RoundaboutTWSC
10% heavy vehicles on both roads
1000
1500
2000
2500
3000
3500
4000
4500
0 100 200 300 400 500
Major Road One-Way Volume (vph)
Effe
ctiv
e In
ters
ectio
n Ca
paci
ty (v
ph)
RoundaboutTWSC
20% heavy vehicles on major road, 10% on minor road

Chapter 5—Preliminary Analysis using SIDRA Default Gap Acceptance Values
5-4
FIGURE 5.3 Effective Intersection Capacity, Roundabout vs. Signalized Intersection
Similar comparisons were made for the major and minor approach capacities. Figure 5.4 shows that with an increase in heavy vehicles, the major road capacity threshold volume between roundabouts and signalized intersections is decreased. A similar comparison was not conducted between a roundabout and a TWSC intersection, as it is irrelevant because of the theoretical zero delay experienced by major road vehicles at a TWSC intersection.
2200
2400
2600
2800
3000
3200
3400
3600
3800
4000
100 200 300 400 500 600 700 800 900 1000
Major Road One-Way Volume (vph)
Effe
ctiv
e In
ters
ectio
n C
apac
ity (v
ph)
RoundaboutSignal
10% heavy vehicles on both roads
2000
2200
2400
2600
2800
3000
3200
3400
3600
3800
4000
0 200 400 600 800 1000 1200
Major Road One-Way Volume (vph)
Effe
ctiv
e In
ters
ectio
n Ca
paci
ty (v
ph)
RoundaboutSignal
20% heavy vehicles on major road, 10% on minor road
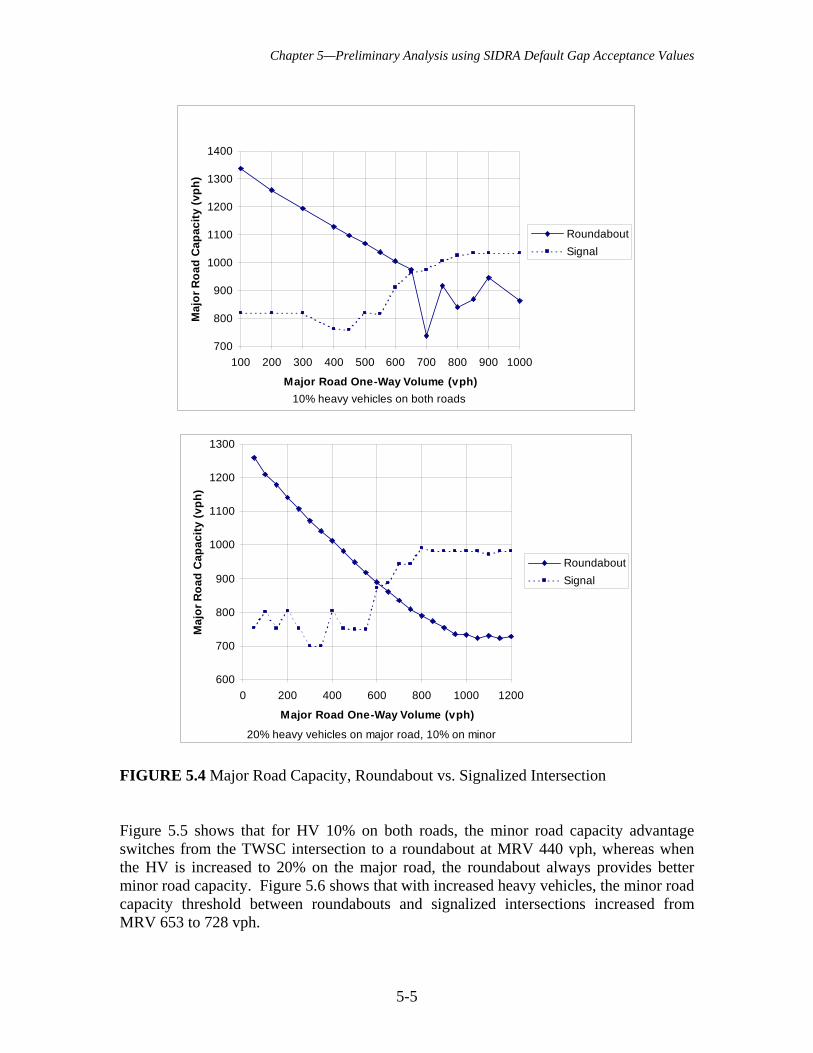
Chapter 5—Preliminary Analysis using SIDRA Default Gap Acceptance Values
5-5
FIGURE 5.4 Major Road Capacity, Roundabout vs. Signalized Intersection
Figure 5.5 shows that for HV 10% on both roads, the minor road capacity advantage switches from the TWSC intersection to a roundabout at MRV 440 vph, whereas when the HV is increased to 20% on the major road, the roundabout always provides better minor road capacity. Figure 5.6 shows that with increased heavy vehicles, the minor road capacity threshold between roundabouts and signalized intersections increased from MRV 653 to 728 vph.
700
800
900
1000
1100
1200
1300
1400
100 200 300 400 500 600 700 800 900 1000
Major Road One-Way Volume (vph)
Maj
or R
oad
Cap
acity
(vph
)
RoundaboutSignal
10% heavy vehicles on both roads
600
700
800
900
1000
1100
1200
1300
0 200 400 600 800 1000 1200
Major Road One-Way Volume (vph)
Maj
or R
oad
Cap
acity
(vph
)
RoundaboutSignal
20% heavy vehicles on major road, 10% on minor

Chapter 5—Preliminary Analysis using SIDRA Default Gap Acceptance Values
5-6
FIGURE 5.5 Minor Road Capacity, Roundabout vs. TWSC Intersection
0
200
400
600
800
1000
1200
1400
0 200 400 600 800 1000
Major Road One-Way Volume (vph)
Min
or R
oad
Cap
acity
(vph
)
RoundaboutTWSC
20% heavy vehicles on major road, 10% on minor road
0
100
200
300
400
500
600
700
800
50 100 150 200 250 300 350 400 450 500
Major Road One-Way Volume (vph)
Min
or R
oad
Cap
acity
(vph
)
RoundaboutTWSC
10% heavy vehicles on both roads

Chapter 5—Preliminary Analysis using SIDRA Default Gap Acceptance Values
5-7
FIGURE 5.6 Minor Road Capacity, Roundabout vs. Signalized Intersection
200
400
600
800
1000
1200
1400
100 200 300 400 500 600 700 800 900 1000
Major Road One-Way Volume (vph)
Min
or R
oad
Cap
acity
(vph
)RoundaboutSignal
10% heavy vehicles on both roads
400
500
600
700
800
900
1000
1100
1200
1300
0 200 400 600 800 1000 1200
Major Road One-Way Volume (vph)
Min
or R
oad
Cap
acity
(vph
)
RoundaboutSignal
20% heavy vehicles on major road, 10% on minor road

Chapter 5—Preliminary Analysis using SIDRA Default Gap Acceptance Values
5-8
5.2 DELAY The SIDRA software results provide average delay times for each intersection approach. SIDRA delay estimates include all delays experienced by vehicles arriving during the demand flow period, even if some of these vehicles depart after the analysis period. The standard SIDRA default method uses the control delay, which consists of overall and geometric delay. The control delay includes deceleration and acceleration delays for the major stop experienced by queued vehicles, as well as the geometric delays experienced by all vehicles in negotiating the intersection. The HCM Delay and Queue option offered by the software will cause delay and queue lengths to be calculated using the HCM equations where applicable. The SIDRA analyses conducted for this study utilized the HCM Delay and Queue option. Figures 5.7 and 5.8 show the points of change in advantage between roundabouts and signalized intersections for major road delay. Figure 5.7 shows both an overall and a smaller-scaled graph for conditions with 10% heavy vehicles on both roads while Figure 5.8 shows the same when heavy vehicles have been increased to 20% on the major road. It can be seen that with an increase in heavy vehicles, the major road capacity threshold is decreased from MRV 628 to 583 vph. Again, because of its irrelevance, a comparison for the major road delay between a roundabout and a TWSC intersection was not included.

Chapter 5—Preliminary Analysis using SIDRA Default Gap Acceptance Values
5-9
FIGURE 5.7 Major Road Delay, Roundabout vs. Signalized Intersection
0
50
100
150
200
250
100 200 300 400 500 600 700 800 900 1000
Major Road One-Way Volume (vph)
Maj
or R
oad
Aver
age
Dela
y (s
)
Roundabout
Signal
10% heavy vehicles on both roads
7
9
11
13
15
550 600 650 700
Major Road One-Way Volume (vph)
Maj
or R
oad
Ave
rage
Del
ay (s
)
Roundabout
Signal
10% heavy vehicles on both roads

Chapter 5—Preliminary Analysis using SIDRA Default Gap Acceptance Values
5-10
FIGURE 5.8 Major Road Delay, Roundabout vs. Signalized Intersection
Minor road delay comparisons are shown in Figures 5.9 through 5.11. As seen in Figure 5.9, in both heavy vehicle percentage cases comparing the roundabout and TWSC intersection, the roundabout experienced less delay, particularly at higher MRVs. Figure 5.10 shows the comparison between roundabout and signalized intersection for 10% heavy vehicles on both roads, and it can be seen that the threshold volume between the roundabout and signalized intersection is 830 vph. For 20% heavy vehicles on the major road and 10% on the minor road, the roundabout experiences less minor road delay for all MRVs tested.
0
25
50
75
100
0 100 200 300 400 500 600 700 800
Major Road One-Way Volume (vph)
Maj
or R
oad
Ave
rage
Del
ay (s
)
RoundaboutSignal
20% heavy vehicles on major road, 10% on minor road

Chapter 5—Preliminary Analysis using SIDRA Default Gap Acceptance Values
5-11
FIGURE 5.9 Minor Road Delay, Roundabout vs. TWSC Intersection
0
50
100
150
200
250
300
350
400
450
50 100 150 200 250 300 350 400 450 500
Major Road One-Way Volume (vph)
Min
or R
oad
Ave
rage
Del
ay (s
)
RoundaboutTWSC
10% heavy vehicles on both roads
0
100
200
300
400
500
600
700
0 100 200 300 400 500
Major Road One-Way Volume (vph)
Min
or R
oad
Ave
rage
Del
ay (s
)
RoundaboutTWSC
20% heavy vehicles on major road, 10% on minor road

Chapter 5—Preliminary Analysis using SIDRA Default Gap Acceptance Values
5-12
FIGURE 5.10 Minor Road Delay, Roundabout vs. Signalized Intersection
0
20
40
60
80
100
120
140
160
180
200
100 200 300 400 500 600 700 800 900 1000
Major Road One-Way Volume (vph)
Min
or R
oad
Ave
rage
Del
ay (s
)
RoundaboutSignal
10% heavy vehicles on both roads
0
10
20
30
40
50
60
70
80
750 775 800 825 850
Major Road One-Way Volume (vph)
Min
or R
oad
Ave
rage
Del
ay (s
)
RoundaboutSignal
10% heavy vehicles on both roads

Chapter 5—Preliminary Analysis using SIDRA Default Gap Acceptance Values
5-13
FIGURE 5.11 Minor Road Delay, Roundabout vs. Signalized Intersection
0
20
40
60
80
100
120
500 600 700 800 900
Major Road One-Way Volume (vph)
Min
or R
oad
Ave
rage
Del
ay (s
)
RoundaboutSignal
20% heavy vehicles on major road, 10% on minor road

Chapter 5—Preliminary Analysis using SIDRA Default Gap Acceptance Values
5-14
5.3 QUEUE LENGTH
The SIDRA test results provided the 95% queue lengths for each intersection approach. Figures 5.12 and 5.13 present the comparisons for major road 95% queue length for a roundabout versus a signalized intersection. For clarity, large and smaller-scaled plots are provided. It can be seen that with increased heavy vehicles, the threshold between the roundabout and signalized intersection decreases from 844 vph to 694 vph. Again, because of the irrelevance, a similar comparison for a roundabout versus a TWSC intersection was not conducted.
FIGURE 5.12 Major Road Queue, Roundabout vs. Signalized Intersection
0
500
1000
1500
2000
2500
3000
3500
4000
100 200 300 400 500 600 700 800 900 1000
Major Road One-Way Volume (vph)
Maj
or R
oad
95%
Que
ue (f
t)
RoundaboutSignal
10% heavy vehicles on both roads
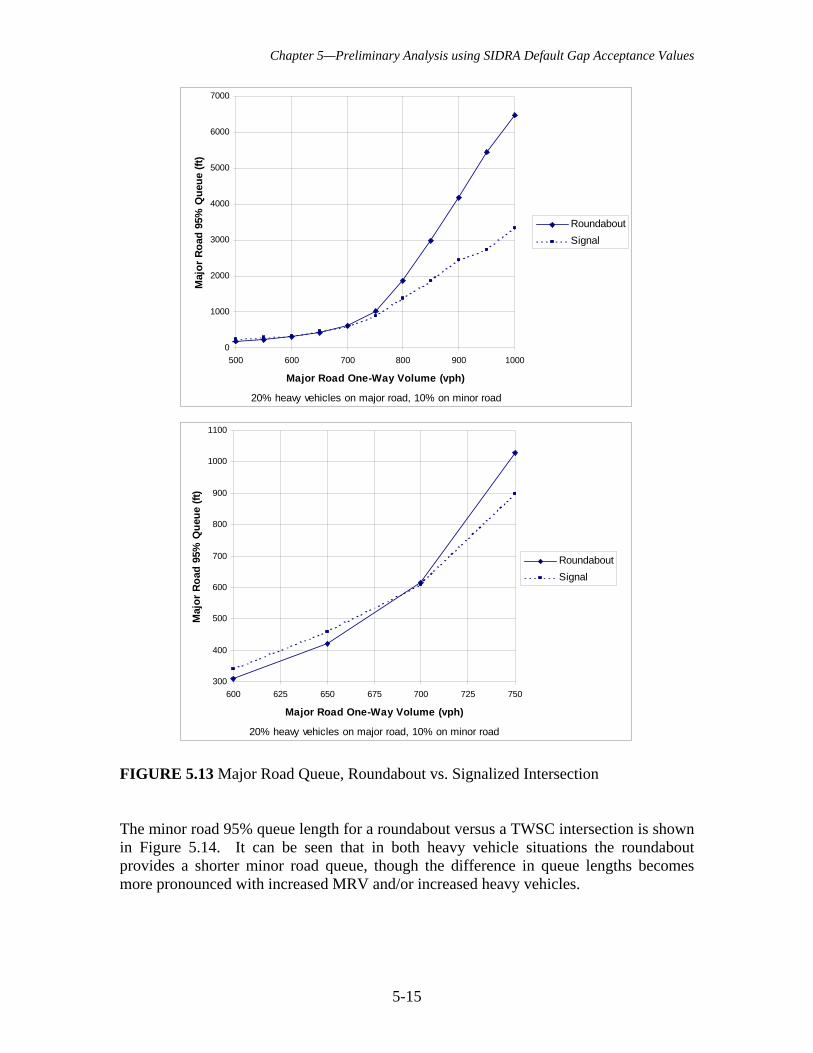
Chapter 5—Preliminary Analysis using SIDRA Default Gap Acceptance Values
5-15
FIGURE 5.13 Major Road Queue, Roundabout vs. Signalized Intersection
The minor road 95% queue length for a roundabout versus a TWSC intersection is shown in Figure 5.14. It can be seen that in both heavy vehicle situations the roundabout provides a shorter minor road queue, though the difference in queue lengths becomes more pronounced with increased MRV and/or increased heavy vehicles.
0
1000
2000
3000
4000
5000
6000
7000
500 600 700 800 900 1000
Major Road One-Way Volume (vph)
Maj
or R
oad
95%
Que
ue (f
t)
RoundaboutSignal
20% heavy vehicles on major road, 10% on minor road
300
400
500
600
700
800
900
1000
1100
600 625 650 675 700 725 750
Major Road One-Way Volume (vph)
Maj
or R
oad
95%
Que
ue (f
t)
RoundaboutSignal
20% heavy vehicles on major road, 10% on minor road

Chapter 5—Preliminary Analysis using SIDRA Default Gap Acceptance Values
5-16
FIGURE 5.14 Minor Road Queue, Roundabout vs. TWSC Intersection
Figure 5.15 shows the minor road 95% queue comparison between a roundabout and a signalized intersection. In both cases, on the average, a roundabout experiences a shorter minor road queue up until 929 vph (10% HV both roads) and 987 vph (20% HV on major road), after which its queue length appears to increase relatively rapidly.
0
150
300
450
600
750
900
1050
1200
1350
1500
50 100 150 200 250 300 350 400 450 500
Major Road One-Way Volume (vph)
Min
or R
oad
95%
Que
ue (f
t)
RoundaboutTWSC
10% heavy vehicles on both roads
0
50
100
150
200
250
300
350
0 100 200 300 400
Major Road One-Way Volume (vph)
Min
or R
oad
95%
Que
ue (f
t)
RoundaboutTWSC
20% heavy vehicles on major road, 10% on minor road

Chapter 5—Preliminary Analysis using SIDRA Default Gap Acceptance Values
5-17
FIGURE 5.15 Minor Road Queue, Roundabout vs. Signalized Intersection
0
200
400
600
800
1000
1200
1400
1600
1800
400 500 600 700 800 900 1000
Major Road One-Way Volume (vph)
Min
or R
oad
95%
Que
ue (f
t)
RoundaboutSignal
10% heavy vehicles on both roads
0
500
1000
1500
2000
2500
3000
3500
4000
0 200 400 600 800 1000 1200
Major Road One-Way Volume (vph)
Min
or R
oad
95%
Que
ue (f
t)
RoundaboutSignal
20% heavy vehicles on major road, 10% on minor road

Chapter 5—Preliminary Analysis using SIDRA Default Gap Acceptance Values
5-18
5.4 EMISSIONS Four emissions types are included in SIDRA analysis results: HC, CO, NOX, and CO2. Comparisons such as those discussed above were also made between a roundabout and a TWSC intersection and between a roundabout and a signalized intersection for these four emissions. HC Emissions Figures 5.16 and 5.17 show HC emissions levels between roundabout and TWSC. For clarity, both overall and small-scale graphs for each analysis have been included. It can be seen that as the percentage of heavy vehicles increases, the threshold for HC emissions also increases. Above MRV 250 and 270 vph, for major road heavy vehicles of 10% and 20%, respectively, the amount of HC emissions from the TWSC increases far greater than that from the roundabout.

Chapter 5—Preliminary Analysis using SIDRA Default Gap Acceptance Values
5-19
FIGURE 5.16 Total HC Emissions, Roundabout vs. TWSC Intersection
0
0.1
0.2
0.3
0.4
0.5
0.6
0.7
0.8
0.9
1
50 100 150 200 250 300 350 400 450 500
Major Road One-Way Volume (vph)
Tota
l HC
Em
issi
ons
(kg/
h)
RoundaboutTWSC
10% heavy vehicles on both roads
0.14
0.15
0.16
0.17
0.18
0.19
0.2
0.21
0.22
0.23
0.24
200 250 300
Major Road One-Way Volume (vph)
Tota
l HC
Em
issi
ons
(kg/
h)
RoundaboutTWSC
10% heavy vehicles on both roads

Chapter 5—Preliminary Analysis using SIDRA Default Gap Acceptance Values
5-20
FIGURE 5.17 Total HC Emissions, Roundabout vs. TWSC Intersection
Likewise, Figures 5.18 and 5.19 shows similar graphs for a roundabout versus a signalized intersection. Here it can be seen that as the percentage of heavy vehicles increases, the threshold between a roundabout and a signalized intersection decreases from MRV 750 to 630 vph.
0
0.05
0.1
0.15
0.2
0.25
0.3
0.35
0.4
0 100 200 300 400
Major Road One-Way Volume (vph)
Tota
l HC
Em
issi
ons
(kg/
h)
RoundaboutTWSC
20% heavy vehicles on major road, 10% on minor road
0.1
0.12
0.14
0.16
0.18
0.2
0.22
0.24
0.26
150 175 200 225 250 275 300
Major Road One-Way Volume (vph)
Tota
l HC
Em
issi
ons
(kg/
h)
RoundaboutTWSC
20% heavy vehicles on major road, 10% on minor road

Chapter 5—Preliminary Analysis using SIDRA Default Gap Acceptance Values
5-21
FIGURE 5.18 Total HC Emissions, Roundabout vs. Signalized Intersection
0
0.5
1
1.5
2
2.5
3
500 600 700 800 900 1000
Major Road One-Way Volume (vph)
Tota
l HC
Em
issi
ons
(kg/
h)
RoundaboutSignal
10% heavy vehicles on both roads
0.55
0.6
0.65
0.7
0.75
0.8
0.85
650 700 750 800
Major Road One-Way Volume (vph)
Tota
l HC
Em
issi
ons
(kg/
h)
RoundaboutSignal
10% heavy vehicles on both roads

Chapter 5—Preliminary Analysis using SIDRA Default Gap Acceptance Values
5-22
FIGURE 5.19 Total HC Emissions, Roundabout vs. Signalized Intersection
0
0.5
1
1.5
2
2.5
3
3.5
4
500 600 700 800 900 1000
Major Road One-Way Volume (vph)
Tota
l HC
Em
issi
ons
(kg/
h)
RoundaboutSignal
20% heavy vehicles on major road, 10% on minor road
0.45
0.5
0.55
0.6
0.65
0.7
0.75
550 575 600 625 650 675 700
Major Road One-Way Volume (vph)
Tota
l HC
Em
issi
ons
(kg/
h)
RoundaboutSignal
20% heavy vehicles on major road, 10% on minor road

Chapter 5—Preliminary Analysis using SIDRA Default Gap Acceptance Values
5-23
CO Emissions The CO emissions threshold MRV for a roundabout versus a TWSC intersection, as shown in Figures 5.20 and 5.21, decreases slightly, from MRV 362 to 359 vph as the heavy vehicle percentage is increased on the major road from 10% to 20%.
FIGURE 5.20 Total CO Emissions, Roundabout vs. TWSC Intersection
0.00
5.00
10.00
15.00
20.00
25.00
50 100 150 200 250 300 350 400 450 500
Major Road One-Way Volume (vph)
Tota
l CO
Em
issi
ons
(kg/
h)
RoundaboutTWSC
10% heavy vehicles on both roads
8.00
9.00
10.00
11.00
12.00
13.00
300 320 340 360 380 400
Major Road One-Way Volume (vph)
Tota
l CO
Em
issi
ons
(kg/
h)
Roundabout
TWSC
10% heavy vehicles on both roads

Chapter 5—Preliminary Analysis using SIDRA Default Gap Acceptance Values
5-24
FIGURE 5.21 Total CO Emissions, Roundabout vs. TWSC Intersection
NOX Emissions Figure 5.22 shows that for 10% heavy vehicles on both roads, the roundabout provides fewer emissions than a signalized intersection up to an MRV of 592 vph. Figure 5.23 shows that when the heavy vehicle percentage is increased to 20% on the major road, this threshold is reduced to 562 vph. Figure 5.24 presents the same comparison between a roundabout and a TWSC intersection for 10% heavy vehicles on both roads. It can be
0.00
5.00
10.00
15.00
20.00
25.00
30.00
0 100 200 300 400 500
Major Road One-Way Volume (vph)
Tota
l CO
Em
issi
ons
(kg/
h)
RoundaboutTWSC
20% heavy vehicles on major road, 10% on minor road
7.00
8.00
9.00
10.00
11.00
12.00
13.00
14.00
15.00
16.00
250 275 300 325 350 375 400
Major Road One-Way Volume (vph)
Tota
l CO
Em
issi
ons
(kg/
h)
RoundaboutTWSC
20% heavy vehicles on major road, 10% on minor road

Chapter 5—Preliminary Analysis using SIDRA Default Gap Acceptance Values
5-25
seen that the TWSC intersection provides fewer NOX emissions than the roundabout below an MRV of 360 vph; after this volume the roundabout performs better in terms of this MOE. Figure 5.25 shows the same comparison after the heavy vehicle percentage on the major road has been increased to 20%; this HV increase results in a small increase of the threshold volume to 367 vph.
FIGURE 5.22 Total NOX Emissions, Roundabout vs. Signalized Intersection
0.5
0.7
0.9
1.1
1.3
1.5
1.7
1.9
2.1
500 600 700 800 900 1000
Major Road One-Way Volume (vph)
Tota
l NO
X Em
issi
ons
(kg/
h)
RoundaboutSignal
10% heavy vehicles on both roads
0.64
0.66
0.68
0.7
0.72
0.74
0.76
0.78
0.8
550 560 570 580 590 600 610 620 630 640 650
Major Road One-Way Volume (vph)
Tota
l NO
X Em
issi
ons
(kg/
h)
RoundaboutSignal
10% heavy vehicles on both roads

Chapter 5—Preliminary Analysis using SIDRA Default Gap Acceptance Values
5-26
FIGURE 5.23 Total NOX Emissions, Roundabout vs. Signalized Intersection
0
0.5
1
1.5
2
2.5
3
3.5
400 500 600 700 800 900 1000
Major Road One-Way Volume (vph)
Tota
l NO
X Em
issi
ons
(kg/
h)
RoundaboutSignal
20% heavy vehicles on major road, 10% on minor road
0.65
0.7
0.75
0.8
0.85
0.9
0.95
500 525 550 575 600 625 650
Major Road One-Way Volume (vph)
Tota
l NO
X Em
issi
ons
(kg/
h)
RoundaboutSignal
20% heavy vehicles on major road, 10% on minor road

Chapter 5—Preliminary Analysis using SIDRA Default Gap Acceptance Values
5-27
FIGURE 5.24 Total NOX Emissions, Roundabout vs. TWSC Intersection
0
0.1
0.2
0.3
0.4
0.5
0.6
0.7
0.8
50 100 150 200 250 300 350 400 450 500
Major Road One-Way Volume (vph)
Tota
l NO
X E
mis
sion
s (k
g/h)
RoundaboutTWSC
10% heavy vehicles on both roads
0.3
0.32
0.34
0.36
0.38
0.4
0.42
0.44
0.46
0.48
300 320 340 360 380 400
Major Road One-Way Volume (vph)
Tota
l NO
X E
mis
sion
s (k
g/h)
Roundabout
TWSC
10% heavy vehicles on both roads

Chapter 5—Preliminary Analysis using SIDRA Default Gap Acceptance Values
5-28
FIGURE 5.25 Total NOX Emissions, Roundabout vs. TWSC Intersection
0
0.1
0.2
0.3
0.4
0.5
0.6
0.7
0.8
0.9
1
0 100 200 300 400 500
Major Road One-Way Volume (vph)
Tota
l NO
X Em
issi
ons
(kg/
h)
RoundaboutTWSC
20% heavy vehicles on major road, 10% on minor
0.35
0.4
0.45
0.5
0.55
0.6
0.65
0.7
300 325 350 375 400 425 450
Major Road One-Way Volume (vph)
Tota
l NO
X Em
issi
ons
(kg/
h)
RoundaboutTWSC
20% heavy vehicles on major road, 10% on minor
Chapter 5—Preliminary Analysis using SIDRA Default Gap Acceptance Values
5-29
CO2 Emissions Figure 5.26 shows the comparison between a roundabout and a signalized intersection in terms of CO2 emissions. It can be seen that for 10% heavy vehicles on both roads, the roundabout provides fewer emissions than the signal below an MRV of 724 vph. Figure 5.27 shows that this threshold volumes decreases to 597 vph with an increase in heavy vehicles on the major road to 20%. A TWSC intersection provides fewer CO2 emissions than the roundabout up to an MRV of 253 for 10% heavy vehicles on both roads, as presented in Figure 5.28. Figure 5.29 shows that this MRV decreases slightly to 250 vph when the major road heavy vehicle percentage is increased to 20%.

Chapter 5—Preliminary Analysis using SIDRA Default Gap Acceptance Values
5-30
FIGURE 5.26 Total CO2 Emissions, Roundabout vs. Signalized Intersection
200
400
600
800
1000
1200
1400
500 600 700 800 900 1000
Major Road One-Way Volume (vph)
Tota
l CO
2 Em
issi
ons
(kg/
h)
RoundaboutSignal
10% heavy vehicles on both roads
380
400
420
440
460
480
650 675 700 725 750
Major Road One-Way Volume (vph)
Tota
l CO
2 Em
issi
ons
(kg/
h)
RoundaboutSignal
10% heavy vehicles on both roads

Chapter 5—Preliminary Analysis using SIDRA Default Gap Acceptance Values
5-31
FIGURE 5.27 Total CO2 Emissions, Roundabout vs. Signalized Intersection
300
600
900
1200
1500
1800
500 600 700 800 900 1000
Major Road One-Way Volume (vph)
Tota
l CO
2 Em
issi
ons
(kg/
h)
RoundaboutSignal
20% heavy vehicles on major road, 10% on
350
370
390
410
430
450
470
490
510
530
550 575 600 625 650 675 700
Major Road One-Way Volume (vph)
Tota
l CO
2 Em
issi
ons
(kg/
h)
RoundaboutSignal
20% heavy vehicles on major road, 10% on

Chapter 5—Preliminary Analysis using SIDRA Default Gap Acceptance Values
5-32
FIGURE 5.28 Total CO2 Emissions, Roundabout vs. TWSC Intersection
0
100
200
300
400
500
600
50 100 150 200 250 300 350 400 450 500
Major Road One-Way Volume (vph)
Tota
l CO
2 Em
issi
ons
(kg/
h)
RoundaboutTWSC
10% heavy vehicles on both roads
100
110
120
130
140
150
160
170
200 220 240 260 280 300
Major Road One-Way Volume (vph)
Tota
l CO
2 Em
issi
ons
(kg/
h)
RoundaboutTWSC
10% heavy vehicles on both roads

Chapter 5—Preliminary Analysis using SIDRA Default Gap Acceptance Values
5-33
FIGURE 5.29 Total CO2 Emissions, Roundabout vs. TWSC Intersection
0
50
100
150
200
250
300
0 100 200 300 400
Major Road One-Way Volume (vph)
Tota
l CO
2 Em
issi
ons
(kg/
h)RoundaboutTWSC
20% heavy vehicles on major road, 10% on minor road
120
130
140
150
160
170
180
190
200
200 220 240 260 280 300
Major Road One-Way Volume (vph)
Tota
l CO
2 Em
issi
ons
(kg/
h)
Roundabout
TWSC
20% heavy vehicles on major road, 10% on minor

Chapter 5—Preliminary Analysis using SIDRA Default Gap Acceptance Values
5-34
The following tables summarize the major road one-way volume threshold determined for each MOE obtained from the SIDRA analyses using the software’s default gap acceptance parameters. Table 5.1 shows threshold values under heavy vehicle conditions of 10% on both roads. Table 5.2 shows threshold values when heavy vehicles have been increased to 20% on the major road while those on the minor road remain at 10%. TABLE 5.1 Threshold Volumes using SIDRA Default Gap Acceptance Parameters for 10% Heavy Vehicles on Both Roads
Measure of Effectiveness Advantage Maximum MRV (vph) Advantage Maximum MRV (vph)Intersection Capacity (vph) TWSC 115 Roundabout 680Major Road Capacity (vph) N/A N/A Roundabout 652Minor Road Capacity (vph) TWSC 440 Roundabout 653Major Road Delay (s) N/A N/A Roundabout 628Minor Road Delay (s) Roundabout ** Roundabout 830Major Road 95% Queue (ft) N/A N/A Roundabout 844Minor Road 95% Queue (ft) Roundabout ** Roundabout 929Total HC Emissions (kg/h) TWSC 250 Roundabout 750Total CO Emissions (kg/h) TWSC 362 Roundabout 613Total NOX Emissions (kg/h) TWSC 360 Roundabout 592Total CO2 Emissions (kg/h) TWSC 253 Roundabout 724
* Major One-Way Road Volume up to which the indicated intersection type shows better performance** Intersection type shows better performance throughout the entire range of volumes considered
Roundabout vs. TWSC Roundabout vs. Signal
TABLE 5.2 Threshold Volumes using SIDRA Default Gap Acceptance Parameters for 20% Heavy Vehicles on the Major Road, 10% on the Minor Road
Measure of Effectiveness Advantage Maximum MRV (vph) Advantage Maximum MRV (vph)Intersection Capacity (vph) TWSC 114 Roundabout 623Major Road Capacity (vph) N/A N/A Roundabout 618Minor Road Capacity (vph) Roundabout ** Roundabout 728Major Road Delay (s) N/A N/A Roundabout 583Minor Road Delay (s) Roundabout ** Roundabout 944Major Road 95% Queue (ft) N/A N/A Roundabout 694Minor Road 95% Queue (ft) Roundabout ** Roundabout 987Total HC Emissions (kg/h) TWSC 270 Roundabout 630Total CO Emissions (kg/h) TWSC 359 Roundabout 586Total NOX Emissions (kg/h) TWSC 367 Roundabout 562Total CO2 Emissions (kg/h) TWSC 258 Roundabout 597
* Major One-Way Road Volume up to which the indicated intersection type shows better performance** Intersection type shows better performance throughout the entire range of volumes considered
Roundabout vs. TWSC Roundabout vs. Signal

6-1
6.0 FINAL ANALYSIS USING MARYLAND GAP ACCEPTANCE VALUES
Following data reduction, a second set of analyses was conducted using the SIDRA software to compare the three intersection types. This set of analyses followed the same procedures as the first in all but the gap acceptance parameters, which were determined from the videotapes to be a critical gap of 3.9 s and a follow-up time of 2.0 s. Measures of effectiveness consists of effective intersection capacity, major road capacity, minor road capacity, major road average delay, minor road average delay, major road 95% queue length, minor road 95% queue length, and CO, CO2, NOX, and HC emission rates. As in the preliminary analysis, two heavy vehicle conditions were tested, the first with 10% heavy vehicles on both roads, and the second with 20% heavy vehicles on the main road and 10% heavy vehicles on the minor road. 6.1 CAPACITY According to earlier tests performed in the preliminary SIDRA analysis, it was clear that the relevant comparisons were roundabouts versus unsignalized intersections at lower volumes and roundabouts versus signalized intersections at higher volumes. Effective intersection capacity Figure 6.1 shows that the roundabout provides greater effective intersection capacity than the TWSC intersection throughout the range of volumes tested in both heavy vehicle situations. With increasing MRV, the roundabout capacity steadily decreased while that of the TWSC intersection decreased at a greater rate. The capacities of both intersection types decreased slightly as the heavy vehicle percentage increased. Figure 6.2 shows that prior to an MRV of 809 vph, the roundabout provides greater effective intersection capacity than the signalized intersection. This crossover point is reduced to 761 vph when the heavy vehicle percentage is increased.

Chapter 6—Final Analysis using Maryland Gap Acceptance Values
6-2
FIGURE 6.1 Effective Intersection Capacity, Roundabout vs. TWSC Intersection
550
1050
1550
2050
2550
3050
3550
4050
4550
5050
0 100 200 300 400 500 600
Major road one-way volume (vph)
10% heavy vehicles on both roads
Effe
ctiv
e in
ters
ectio
n ca
paci
ty (v
ph)
RoundaboutTWSC
600
1100
1600
2100
2600
3100
3600
4100
4600
5100
0 100 200 300 400 500 600
Major road one-way volume
20% heavy vehicles on major road, 10% on minor road
Effe
ctiv
e in
ters
ectio
n ca
paci
ty (v
ph)
RoundaboutTWSC

Chapter 6—Final Analysis using Maryland Gap Acceptance Values
6-3
FIGURE 6.2 Effective Intersection Capacity, Roundabout vs. Signalized Intersection
1500
2000
2500
3000
3500
4000
500 600 700 800 900 1000 1100 1200
Major road one-way volume (vph)
10% heavy vehicles on both roads
Effe
ctiv
e in
ters
ectio
n ca
paci
ty (v
ph)
RoundaboutSignal
1400
1700
2000
2300
2600
2900
3200
3500
500 600 700 800 900 1000 1100 1200
Major road one-way volume
20% heavy vehicles on major road, 10% on minor road
Effe
ctiv
e in
ters
ectio
n ca
paci
ty (v
ph)
RoundaboutSignal

Chapter 6—Final Analysis using Maryland Gap Acceptance Values
6-4
Major road capacity In the case of roundabout versus TWSC intersection, it was decided that comparisons based upon the major road (capacity, delay, queue) were irrelevant due to the fact that the major road in a TWSC intersection is always given priority and therefore will always provide greater capacity, less delay, and a smaller queue than the minor road. The three major road MOEs were therefore not included in the analysis of roundabout versus TWSC intersection. The major road capacity for the roundabout versus signalized intersection is shown in Figure 6.3. The roundabout provides greater major road capacity than the signalized intersection throughout the range of volumes considered except at an MRV of 850 vph, where the signalized intersection provides slightly greater capacity (1034 vph vs. 1025 vph for the roundabout).
FIGURE 6.3 Major Road Capacity, Roundabout vs. Signalized Intersection
700
800
900
1000
1100
1200
1300
1400
1500
1600
1700
500 600 700 800 900 1000 1100 1200
Major road one-way volume (vph)
10% heavy vehicles on both roads
Maj
or r
oad
capa
city
(vph
)
RoundaboutSignal
700
825
950
1075
1200
500 600 700 800 900 1000 1100 1200
Major road one-way volume
20% heavy vehicles on major road, 10% on minor road
Maj
or r
oad
capa
city
(vph
)
RoundaboutSignal

Chapter 6—Final Analysis using Maryland Gap Acceptance Values
6-5
Minor road capacity The minor road capacity is shown for roundabout versus TWSC intersection in Figure 6.4. It can be seen that for both heavy vehicle conditions the roundabout provides the greater capacity throughout the range of MRV tested. The capacity of both intersection types remained essentially the same as the heavy vehicle percentage was increased. Figure 6.5 shows the minor road capacity for roundabout versus signalized intersection. The graphs show that up until an MRV of 805 vph, the roundabout provides greater minor road capacity than the signal. After this point, however, the signal provides the greater capacity. This threshold volume decreases to 766 vph when the heavy vehicle percentage was increased.
FIGURE 6.4 Minor Road Capacity, Roundabout vs. TWSC Intersection
0
200
400
600
800
1000
1200
1400
1600
0 100 200 300 400 500 600
Major road one-way volume (vph)
10% heavy vehicles on both roads
Min
or ro
ad c
apac
ity (v
ph)
RoundaboutTWSC
0
200
400
600
800
1000
1200
1400
1600
0 100 200 300 400 500 600
Major road one-way volume
20% heavy vehicles on major road, 10% on minor road
Min
or ro
ad c
apac
ity (v
ph)
RoundaboutTWSC

Chapter 6—Final Analysis using Maryland Gap Acceptance Values
6-6
FIGURE 6.5 Minor Road Capacity, Roundabout vs. Signalized Intersection 6.2 DELAY
125
225
325
425
525
625
725
825
925
500 600 700 800 900 1000 1100 1200
Major road one-way volume
20% heavy vehicles on major road, 10% on minor road
Min
or r
oad
capa
city
(vph
)
RoundaboutSignal
200
300
400
500
600
700
800
900
1000
500 600 700 800 900 1000 1100 1200
Major road one-way volume (vph)
10% heavy vehicles on both roads
Min
or ro
ad c
apac
ity (v
ph)
RoundaboutSignal

Chapter 6—Final Analysis using Maryland Gap Acceptance Values
6-7
Major road average delay This MOE was not included for the comparison of roundabout versus TWSC intersection, as explained above. Figure 6.6 shows the comparison of roundabout versus signalized intersection. The roundabout provides less delay throughout the range of MRV considered for 10% heavy vehicles exist on both roads. When this percentage is increased along the major road, a threshold volume occurs at 1111 vph, where after this point the signal provides less delay than the roundabout.
0
50
100
150
200
250
500 600 700 800 900 1000 1100 1200
Major road one-way volume (vph)
10% heavy vehicles on both roads
Maj
or r
oad
aver
age
dela
y (s
)
RoundaboutSignal
0
100
200
300
400
800 900 1000 1100 1200
Major road one-way volume
20% heavy vehicles on major road, 10% on minor road
Maj
or ro
ad a
vera
ge d
elay
(s)
RoundaboutSignal
FIGURE 6.6 Major Road Average Delay, Roundabout vs. Signalized Intersection Minor road average delay

Chapter 6—Final Analysis using Maryland Gap Acceptance Values
6-8
Figure 6.7 shows the minor road average delay for roundabout versus TWSC intersection. Throughout the range of MRV considered and for both heavy vehicle situations, the roundabout provides less delay. Prior to an MRV of 400 vph, both intersection types provide relatively similar delay; after this point, however, the delay associated with the TWSC intersection increases exponentially, while that for the roundabout continues to gradually increase at a steady rate. Figure 6.8 presents the minor road average delay for roundabout versus signalized intersection. The roundabout provides less delay up until an MRV of 833 vph for 10% HV on both roads and up until 802 vph for 20% HV on the major road. After these threshold volumes, delay associated with the roundabout increases exponentially.
0
200
400
600
800
1000
1200
1400
0 100 200 300 400 500 600
Major road one-way volume (vph)
10% heavy vehicles on both roads
Min
or ro
ad a
vera
ge d
elay
(s)
RoundaboutTWSC
0
300
600
900
1200
1500
1800
0 100 200 300 400 500 600
Major road one-way volume
20% heavy vehicles on major road, 10% on minor road
Min
or r
oad
aver
age
dela
y (s
)
RoundaboutTWSC
FIGURE 6.7 Minor Road Average Delay, Roundabout vs. TWSC Intersection

Chapter 6—Final Analysis using Maryland Gap Acceptance Values
6-9
0
200
400
600
800
1000
1200
1400
500 600 700 800 900 1000 1100 1200
Major road one-way volume (vph)
10% heavy vehicles on both roads
Min
or ro
ad a
vera
ge d
elay
(s)
RoundaboutSignal
0
100
200
300
400
500 600 700 800 900
Major road one-way volume
20% heavy vehicles on major road, 10% on minor road
Min
or ro
ad a
vera
ge d
elay
(s)
RoundaboutSignal
FIGURE 6.8 Minor Road Average Delay, Roundabout vs. Signalized Intersection
6.3 QUEUE LENGTH

Chapter 6—Final Analysis using Maryland Gap Acceptance Values
6-10
Major road 95% queue This MOE was not included in the comparison of roundabout versus TWSC intersection, for reasons explained above. Figure 6.9 shows this MOE for the comparison of roundabout versus signalized intersection. It can be seen that the roundabout provides a shorter queue length than the signal when there is 10% HV on both roads. When the HV percentage is increased, a threshold volume occurs at an MRV of 1114 vph, where after this point, the roundabout begins to provide a greater queue length than the signal. Minor road 95% queue Figure 6.10 presents the minor road queue length for roundabout versus TWSC intersection. For both HV percentage situations, the roundabout provides a shorter queue length throughout the range of MRV tested. The TWSC intersection queue begins to rapidly increase after an MRV of 400 vph while that for the roundabout increases at a low and steady rate. Figure 6.11 shows this MOE for roundabout versus signalized intersection. This figure shows that the roundabout provides a smaller queue up to an MRV of 871 vph for 10% HV on both roads, and up to 817 vph when the heavy vehicles are increased on the major road. Prior to these threshold volumes, the queues for both intersection types are relatively similar, whereas after the thresholds, the difference between the two greatly increases.

Chapter 6—Final Analysis using Maryland Gap Acceptance Values
6-11
0
1000
2000
3000
4000
5000
500 600 700 800 900 1000 1100 1200
Major road one-way volume (vph)
10% heavy vehicles on both roads
Maj
or r
oad
95%
que
ue (f
t)
RoundaboutSignal
0
1400
2800
4200
5600
7000
500 600 700 800 900 1000 1100 1200
Major road one-way volume
20% heavy vehicles on m ajor road, 10% on m inor road
Maj
or ro
ad 9
5% q
ueue
(ft)
RoundaboutSignal
FIGURE 6.9 Major Road Queue, Roundabout vs. Signalized Intersection

Chapter 6—Final Analysis using Maryland Gap Acceptance Values
6-12
0
500
1000
1500
2000
2500
3000
3500
0 100 200 300 400 500 600
Major road one-way volume (vph)
10% heavy vehicles on both roads
Min
or r
oad
95%
que
ue (f
t)
RoundaboutTWSC
0
800
1600
2400
3200
4000
0 100 200 300 400 500 600
Major road one-way volume
20% heavy vehicles on m ajor road, 10% on m inor road
Min
or ro
ad 9
5% q
ueue
(ft)
RoundaboutTWSC
FIGURE 6.10 Minor Road Queue, Roundabout vs. TWSC Intersection

Chapter 6—Final Analysis using Maryland Gap Acceptance Values
6-13
0
1000
2000
3000
4000
5000
6000
7000
500 600 700 800 900 1000 1100 1200
Major road one-way volume (vph)
10% heavy vehicles on both roads
Min
or r
oad
95%
que
ue (f
t)
RoundaboutSignal
0
800
1600
2400
3200
4000
4800
500 600 700 800 900 1000
Major road one-way volume
20% heavy vehicles on m ajor road, 10% on m inor road
Min
or ro
ad 9
5% q
ueue
(ft)
RoundaboutSignal
FIGURE 6.11 Minor Road Queue, Roundabout vs. Signalized Intersection

Chapter 6—Final Analysis using Maryland Gap Acceptance Values
6-14
6.4 EMISSION RATES CO emissions Figure 6.12 shows CO emission rates for a roundabout versus a TWSC intersection. For 10% HV on both roads, the TWSC intersection provides less CO emissions up to an MRV of 339 vph; this threshold volume decreases to 213 vph when heavy vehicles are increased to 20% on the major road. Figure 6.13 shows CO emissions for a roundabout versus a signalized intersection. The roundabout provides less CO emissions below threshold volumes of 795 vph for 10% HV on both roads, and 725 vph for 20% HV on the major road.
0
5
10
15
20
25
0 100 200 300 400 500 600
Major road one-way volume (vph)
10% heavy vehicles on both roads
Tota
l CO
em
issi
ons
(kg/
h)
RoundaboutTWSC
0
10
20
30
40
50
0 100 200 300 400 500 600
Major road one-way volume
20% heavy vehicles on m ajor road, 10% on m inor road
Tota
l CO
em
issi
ons
(kg/
h)
RoundaboutTWSC
FIGURE 6.12 Total CO Emissions, Roundabout vs. TWSC Intersection

Chapter 6—Final Analysis using Maryland Gap Acceptance Values
6-15
0
20
40
60
80
100
500 600 700 800 900 1000 1100 1200
Major road one-way volume (vph)
10% heavy vehicles on both roads
Tota
l CO
em
issi
ons
(kg/
h)
RoundaboutSignal
0
50
100
150
200
500 600 700 800 900 1000 1100 1200
Major road one-way volume
20% heavy vehicles on m ajor road, 10% on m inor road
Tota
l CO
em
issi
ons
(kg/
h)
RoundaboutSignal
FIGURE 6.13 Total CO Emissions, Roundabout vs. Signalized Intersection

Chapter 6—Final Analysis using Maryland Gap Acceptance Values
6-16
CO2 emissions Figure 6.14 presents this MOE comparison for a roundabout versus a TWSC intersection. The TWSC intersection has lower associated CO2 emissions than the roundabout up until an MRV of 229 vph for 10% HV on both roads, and 336 vph when the HV is increased to 20% on the major road. Figure 6.15 shows the same comparison for a roundabout versus a signalized intersection. It can be seen that the roundabout provides less CO2 emissions below threshold volumes of 903 vph for 10% HV on both roads, and 835 vph for 20% HV on the major road.
0
200
400
600
800
1000
1200
0 100 200 300 400 500 600
Major road one-way volume (vph)
10% heavy vehicles on both roads
Tota
l CO
2 em
issi
ons
(kg/
h)
RoundaboutTWSC
0
500
1000
1500
0 100 200 300 400 500 600
Major road one-way volume
20% heavy vehicles on m ajor road, 10% on m inor road
Tota
l CO
2 em
issi
ons
(kg/
h)
RoundaboutTWSC
FIGURE 6.14 Total CO2 Emissions, Roundabout vs. TWSC Intersection

Chapter 6—Final Analysis using Maryland Gap Acceptance Values
6-17
200
700
1200
1700
2200
2700
500 600 700 800 900 1000 1100 1200
M ajor road one-way volume (vph)
10% heavy vehicles on both roads
Tota
l CO
2 em
issi
ons
(kg/
h)
RoundaboutSignal
300
800
1300
1800
2300
2800
3300
3800
500 600 700 800 900 1000 1100 1200
Major road one-way volume
20% heavy vehicles on m ajor road, 10% on m inor road
Tota
l CO
2 em
issi
ons
(kg/
h)
RoundaboutSignal
FIGURE 6.15 Total CO2 Emissions, Roundabout vs. Signalized Intersection

Chapter 6—Final Analysis using Maryland Gap Acceptance Values
6-18
NOX emissions The comparison of NOX emissions for a roundabout versus a TWSC intersection is presented in Figure 6.16. Up until an MRV of 334 vph, the TWSC intersection provides less emissions than the roundabout for 10% HV on both roads; this threshold volume decreases to 250 vph when the HV percentage is increased to 20% on the major road. Figure 6.17 shows this MOE for a roundabout versus a signalized intersection. The threshold volumes for this comparison are 833 vph for 10% HV on both roads, and 683 vph for 20% HV on the major road and 10% HV on the minor road.
0
0.2
0.4
0.6
0.8
1
1.2
1.4
0 100 200 300 400 500 600
Major road one-way volume (vph)
10% heavy vehicles on both roads
Tota
l NO
X e
mis
sion
s (k
g/h)
RoundaboutTWSC
0
0.25
0.5
0.75
1
1.25
1.5
0 100 200 300 400 500 600
Major road one-way volume
20% heavy vehicles on m ajor road, 10% on m inor road
Tota
l NO
X e
mis
sion
s (k
g/h)
RoundaboutTWSC
Figure 6.16 Total NOX Emissions, Roundabout vs. TWSC Intersection

Chapter 6—Final Analysis using Maryland Gap Acceptance Values
6-19
0.5
1.5
2.5
3.5
500 600 700 800 900 1000 1100 1200
Major road one-way volume (vph)
10% heavy vehicles on both roads
Tota
l NO
X e
mis
sion
s (k
g/h)
RoundaboutSignal
0
1
2
3
4
5
500 600 700 800 900 1000 1100 1200
Major road one-way volume
20% heavy vehicles on m ajor road, 10% on m inor road
Tota
l NO
X e
mis
sion
s (k
g/h)
RoundaboutSignal
FIGURE 6.17 Total NOX Emissions, Roundabout vs. Signalized Intersection

Chapter 6—Final Analysis using Maryland Gap Acceptance Values
6-20
HC emissions Figure 6.18 presents this comparison for a roundabout versus a TWSC intersection. The TWSC intersection provides fewer emissions than the roundabout below threshold volumes of 225 vph for 10% HV on both roads and 230 vph for 20% HV on the major road. Figure 6.19 presents the HC emissions comparison of a roundabout versus a signalized intersection. The roundabout provides fewer emissions than the signal in both heavy vehicle situations; the threshold volumes are 905 vph for 10% HV on both roads, and 834 vph for 20% HV on the major road.
0
0.5
1
1.5
2
2.5
0 100 200 300 400 500 600
Major road one-way volume (vph)
10% heavy vehicles on both roads
Tota
l HC
em
issi
ons
(kg/
h)
RoundaboutTWSC
0
0.5
1
1.5
2
2.5
3
0 100 200 300 400 500 600
Major road one-way volume
20% heavy vehicles on m ajor road, 10% on m inor road
Tota
l HC
em
issi
ons
(kg/
h)
RoundaboutTWSC
FIGURE 6.18 Total HC Emissions, Roundabout vs. TWSC Intersection

Chapter 6—Final Analysis using Maryland Gap Acceptance Values
6-21
0
1
2
3
4
5
6
500 600 700 800 900 1000 1100 1200
Major road one-way volume (vph)
10% heavy vehicles on both roads
Tota
l HC
em
issi
ons
(kg/
h)
RoundaboutSignal
0
2
4
6
8
500 600 700 800 900 1000 1100 1200
Major road one-way volume
20% heavy vehicles on m ajor road, 10% on m inor road
Tota
l HC
em
issi
ons
(kg/
h)
RoundaboutSignal
FIGURE 6.19 Total HC Emissions, Roundabout vs. Signalized Intersection

Chapter 6—Final Analysis using Maryland Gap Acceptance Values
6-22
The following tables summarize the major road one-way volume thresholds determined from the SIDRA analyses for all MOEs considered. Table 6.1 shows thresholds under heavy vehicle conditions of 10% on both roads. Table 6.2 shows thresholds when heavy vehicles have been increased to 20% on the major road while remaining at 10% on the minor road. TABLE 6.1 Threshold Volumes using Observed Maryland/Delaware Gap Acceptance Parameters for 10% Heavy Vehicles on Both Roads
Measure of Effectiveness Advantage Maximum MRV (vph) Advantage Maximum MRV (vph)Intersection Capacity (vph) Roundabout ** Roundabout 809Major Road Capacity (vph) N/A N/A Roundabout **Minor Road Capacity (vph) Roundabout ** Roundabout 805Major Road Delay (s) N/A N/A Roundabout **Minor Road Delay (s) Roundabout ** Roundabout 833Major Road 95% Queue (ft) N/A N/A Roundabout **Minor Road 95% Queue (ft) Roundabout ** Roundabout 871Total HC Emissions (kg/h) TWSC 225 Roundabout 905Total CO Emissions (kg/h) TWSC 339 Roundabout 795Total NOX Emissions (kg/h) TWSC 334 Roundabout 833Total CO2 Emissions (kg/h) TWSC 229 Roundabout 903
* Major One-Way Road Volume up to which the indicated intersection type shows better performance** Intersection type shows better performance throughout the entire range of volumes considered
Roundabout vs. TWSC Roundabout vs. Signal
TABLE 6.2 Threshold Volumes using Observed Maryland/Delaware Gap Acceptance Parameters for 20% Heavy Vehicles on the Major Road, 10% on the Minor Road
Measure of Effectiveness Advantage Maximum MRV (vph) Advantage Maximum MRV (vph)Intersection Capacity (vph) Roundabout ** Roundabout 761Major Road Capacity (vph) N/A N/A Roundabout 936Minor Road Capacity (vph) Roundabout ** Roundabout 766Major Road Delay (s) N/A N/A Roundabout 1111Minor Road Delay (s) Roundabout ** Roundabout 802Major Road 95% Queue (ft) N/A N/A Roundabout 1114Minor Road 95% Queue (ft) Roundabout ** Roundabout 817Total HC Emissions (kg/h) TWSC 230 Roundabout 834Total CO Emissions (kg/h) TWSC 213 Roundabout 725Total NOX Emissions (kg/h) TWSC 250 Roundabout 683Total CO2 Emissions (kg/h) TWSC 336 Roundabout 835
* Major One-Way Road Volume up to which the indicated intersection type shows better performance** Intersection type shows better performance throughout the entire range of volumes considered
Roundabout vs. TWSC Roundabout vs. Signal

7-1
7.0 COMPARISON OF ROUNDABOUT MEASURES OF EFFECTIVENESS USING SIDRA VS. MARYLAND GAPS
The critical gap and follow-up times determined from the data collection are smaller than those recommended by the HCM and presented in Section 2.2.1 of this report. The default values used in the HCM version of the SIDRA software are based upon calibrations of SIDRA model parameters using the HCM defaults. While the default gap acceptance parameters are determined as functions of roundabout geometry and flow conditions and so vary throughout the analysis, they remained greater than the observed critical gap and follow-up values of 3.9 and 2.0 s, respectively. The following sections compare the measures of effectiveness provided for the roundabouts with the observed Maryland/Delaware and the SIDRA default gap acceptance parameters for both heavy vehicle scenarios. In general, and as would be expected, the reduced critical gap and follow-up times allowed the roundabout to provide a greater capacity and reduced the delay time and queue length experienced by entering vehicles. The column heading % change in Table 7.1 denotes the increase or decrease occurring when the SIDRA defaults have been replaced by the observed gap acceptance values. 7.1 10% Heavy Vehicles on Both Roads The effective intersection capacity and capacities of both the major and minor roads are presented in Table 7.1. It can be seen that all three capacities are increased by a relatively constant amount of approximately 23% when the SIDRA default values are replaced by those obtained for Maryland/Delaware. This is true up to an MRV of approximately 800 vph, where the percent difference then begins to decrease. This can also be observed in Figures 7.1 through 7.3, though as Figure 7.2 shows, the major road capacity does not experience a crossover point as the effective intersection and minor road capacities do.

Chapter 7—Comparison of Roundabout MOEs using SIDRA vs. Maryland Gaps
7-2
TABLE 7.1 Effective Intersection, Major Road, and Minor Road Capacities
1000
1500
2000
2500
3000
3500
4000
4500
5000
5500
0 200 400 600 800 1000 1200
M ajor road one-way volume (vph)
10% heavy vehicles on both roads
Effe
ctiv
e in
ters
ectio
n ca
paci
ty (v
ph)
SIDRA defaultMaryland/Delaware
FIGURE 7.1 Roundabout Effective Intersection Capacity
MRV (vph) Md/De SIDRA % change Md/De SIDRA % change Md/De SIDRA % change
50 5023 4127 21.7 1654 1359 21.7 1566 1246 25.7100 4880 3985 22.5 1637 1337 22.4 1557 1235 26.1150 4744 3875 22.4 1578 1288 22.5 1457 1155 26.1200 4637 3777 22.8 1548 1261 22.8 1409 1119 25.9250 4517 3681 22.7 1502 1224 22.7 1320 1052 25.5300 4392 3577 22.8 1467 1195 22.8 1261 1012 24.6350 4269 3480 22.7 1423 1160 22.7 1178 952 23.7400 4155 3390 22.6 1384 1129 22.6 1112 906 22.7450 4026 3293 22.3 1341 1097 22.2 1037 854 21.4500 3907 3202 22.0 1303 1068 22.0 967 804 20.3550 3778 3106 21.6 1260 1036 21.6 892 749 19.1600 3660 3018 21.3 1220 1006 21.3 820 695 18.0650 3531 2925 20.7 1176 974 20.7 740 632 17.1700 3402 2832 20.1 1135 736 54.2 668 367 82.0750 3292 2755 19.5 1097 918 19.5 591 525 12.6800 3134 2681 16.9 1063 841 26.4 522 420 24.3850 2804 2609 7.5 1025 869 18.0 468 462 1.3900 2566 2563 0.1 1042 946 10.1 427 472 -9.5950 2328 2577 -9.7 1081 859 25.8 388 468 -17.1
1000 2109 2588 -18.5 1117 862 29.6 352 461 -23.61050 1928 2578 -25.2 1147 860 33.4 321 458 -29.91100 1733 2584 -32.9 1177 861 36.7 289 453 -36.21150 1657 2576 -35.7 1183 859 37.7 276 451 -38.81200 1600 2584 -38.1 1171 861 36.0 267 444 -39.9
Effective intersection capacity (vph) Major road capacity (vph) Minor road capacity (vph)

Chapter 7—Comparison of Roundabout MOEs using SIDRA vs. Maryland Gaps
7-3
600
800
1000
1200
1400
1600
1800
0 200 400 600 800 1000 1200
M ajor road one-way volume (vph)
10% heavy vehicles on both roads
Maj
or ro
ad c
apac
ity (v
ph)
SIDRA defaultMaryland/Delaware
FIGURE 7.2 Roundabout Major Road Capacity
200
400
600
800
1000
1200
1400
1600
0 200 400 600 800 1000 1200
M ajor road one-way volume (vph)
10% heavy vehicles on both roads
Min
or ro
ad c
apac
ity (v
ph)
SIDRA defaultMaryland/Delaware
FIGURE 7.3 Roundabout Minor Road Capacity

Chapter 7—Comparison of Roundabout MOEs using SIDRA vs. Maryland Gaps
7-4
The major and minor road average delays are presented in Table 7.2. A decrease in both delays was observed when the SIDRA default gap parameters were replaced with those observed for Maryland/Delaware. This decrease increased with increasing major road one-way volume. TABLE 7.2 Major and Minor Road Delay
MRV (vph) Md/De SIDRA % change Md/De SIDRA % change
50 6.0 6.1 -1.6 7.0 7.1 -1.4100 6.1 6.2 -1.6 7.1 7.3 -2.7150 6.2 6.4 -3.1 7.4 7.7 -3.9200 6.3 6.6 -4.5 7.6 8.0 -5.0250 6.5 6.8 -4.4 7.9 8.4 -6.0300 6.6 7.0 -5.7 8.2 8.7 -5.7350 6.8 7.2 -5.6 8.6 9.2 -6.5400 7.0 7.5 -6.7 9.0 9.6 -6.3450 7.2 7.8 -7.7 9.4 10.1 -6.9500 7.4 8.1 -8.6 10.0 10.7 -6.5550 7.7 8.7 -11.5 10.6 11.3 -6.2600 8.0 10.0 -20.0 11.3 12.6 -10.3650 8.7 11.8 -26.3 12.9 15.2 -15.1700 9.9 14.4 -31.3 15.7 18.9 -16.9750 11.7 19.4 -39.7 21.3 26.1 -18.4800 14.4 31.1 -53.7 33.6 41.1 -18.2850 20.0 69.8 -71.3 73.5 73.5 0.0900 23.1 124.7 -81.5 161.5 83.1 94.3950 24.3 171.8 -85.9 309.0 124.6 148.0
1000 26.4 222.1 -88.1 493.6 181.1 172.61050 29.7 276.1 -89.2 691.4 227.2 204.31100 35.5 330.9 -89.3 949.2 292.9 224.11150 54.8 386.9 -85.8 1114.0 345.6 222.31200 95.6 438.4 -78.2 1281.6 418.6 206.2
Major road average delay (s) Minor road average delay (s)

Chapter 7—Comparison of Roundabout MOEs using SIDRA vs. Maryland Gaps
7-5
0.0
50.0
100.0
150.0
200.0
250.0
300.0
350.0
400.0
450.0
500.0
0 200 400 600 800 1000 1200
M ajor road one-way volume (vph)
10% heavy vehicles on both roads
Maj
or ro
ad a
vera
ge d
elay
(s)
SIDRA defaultMaryland/Delaware
FIGURE 7.4 Roundabout Major Road Average Delay
0.0
200.0
400.0
600.0
800.0
1000.0
1200.0
1400.0
0 200 400 600 800 1000 1200
Major road one-way volume (vph)
10% heavy vehicles on both roads
Min
or ro
ad a
vera
ge d
elay
(s)
SIDRA defaultMaryland/Delaware
FIGURE 7.5 Roundabout Minor Road Average Delay

Chapter 7—Comparison of Roundabout MOEs using SIDRA vs. Maryland Gaps
7-6
The major and minor road queue lengths presented in Table 7.3 follow a somewhat similar pattern where the difference change increases with increasing MRV. Both the minor road delay and queue length experience a crossover point at an MRV of 850-900 where the MOE begins to decrease, as can be seen in Figures 7.5 and 7.7.
TABLE 7.3 Major and Minor Road Queue Length
MRV (vph) Md/De SIDRA % change Md/De SIDRA % change
50 5 7 -28.6 3 4 -25.0100 11 14 -21.4 6 7 -14.3150 18 24 -25.0 10 13 -23.1200 26 34 -23.5 14 18 -22.2250 35 46 -23.9 20 25 -20.0300 45 58 -22.4 25 31 -19.4350 57 74 -23.0 33 40 -17.5400 71 91 -22.0 42 50 -16.0450 87 111 -21.6 53 63 -15.9500 104 132 -21.2 66 76 -13.2550 125 162 -22.8 82 94 -12.8600 149 215 -30.7 102 123 -17.1650 186 286 -35.0 136 168 -19.0700 241 375 -35.7 183 223 -17.9750 313 522 -40.0 261 310 -15.8800 409 802 -49.0 390 453 -13.9850 584 1474 -60.4 730 736 -0.8900 698 2316 -69.9 1408 849 65.8950 776 3087 -74.9 2420 1225 97.6
1000 879 3917 -77.6 3498 1719 103.51050 1010 4784 -78.9 4444 2117 109.91100 1212 5695 -78.7 5518 2671 106.61150 1673 6597 -74.6 6181 3124 97.91200 2521 7464 -66.2 6869 3716 84.8
Major road 95% queue (ft) Minor road 95% queue (ft)

Chapter 7—Comparison of Roundabout MOEs using SIDRA vs. Maryland Gaps
7-7
0
1000
2000
3000
4000
5000
6000
7000
8000
0 200 400 600 800 1000 1200
Major road one-way volume (vph)
10% heavy vehicles on both roads
Maj
or ro
ad q
ueue
(ft)
SIDRA default Maryland/Delaware
FIGURE 7.6 Roundabout Major Road Queue Length
0
1000
2000
3000
4000
5000
6000
7000
8000
0 200 400 600 800 1000 1200
M ajor road one--way volume (vph)
10% heavy vehicles on both roads
Min
or ro
ad q
ueue
(ft)
SIDRA defaultMaryland/Delaware
Figure 7.7 Roundabout Minor Road Queue Length

Chapter 7—Comparison of Roundabout MOEs using SIDRA vs. Maryland Gaps
7-8
The results for the four emissions measures of effectiveness are presented in Table 7.4. It can be seen that in almost all cases the emissions were reduced with the smaller gap acceptance parameters. This corresponds to the reduced delay and therefore reduced idling times which would cause vehicle to emit more emissions.
TABLE 7.4 Roundabout Total Emissions
MRV (vph) Md/De SIDRA % change Md/De SIDRA % change Md/De SIDRA % change Md/De SIDRA % change
50 0.037 0.037 0.0 1.35 1.36 -0.7 27.9 28.0 -0.4 0.054 0.054 0.0100 0.071 0.072 -1.4 2.60 2.63 -1.1 53.1 53.3 -0.4 0.103 0.104 -1.0150 0.111 0.112 -0.9 4.10 4.16 -1.4 82.5 82.9 -0.5 0.161 0.162 -0.6200 0.149 0.150 -0.7 5.52 5.61 -1.6 109.8 110.4 -0.5 0.215 0.217 -0.9250 0.189 0.191 -1.0 7.06 7.18 -1.7 138.8 139.6 -0.6 0.273 0.276 -1.1300 0.226 0.228 -0.9 8.50 8.65 -1.7 165.3 166.3 -0.6 0.327 0.330 -0.9350 0.268 0.271 -1.1 10.17 10.36 -1.8 195.4 196.6 -0.6 0.388 0.392 -1.0400 0.310 0.313 -1.0 11.85 12.08 -1.9 225.1 226.6 -0.7 0.449 0.454 -1.1450 0.353 0.358 -1.4 13.61 13.89 -2.0 255.6 257.4 -0.7 0.512 0.519 -1.3500 0.394 0.400 -1.5 15.30 15.62 -2.0 283.9 286.1 -0.8 0.572 0.579 -1.2550 0.400 0.447 -10.5 17.20 17.59 -2.2 315.4 318.1 -0.8 0.638 0.647 -1.4600 0.487 0.495 -1.6 19.17 19.64 -2.4 347.1 350.5 -1.0 0.706 0.717 -1.5650 0.537 0.551 -2.5 21.28 22.00 -3.3 380.4 386.5 -1.6 0.778 0.794 -2.0700 0.588 0.617 -4.7 23.45 24.76 -5.3 413.0 425.1 -2.8 0.848 0.876 -3.2750 0.649 0.703 -7.7 25.80 27.77 -7.1 451.3 474.4 -4.9 0.925 0.966 -4.2800 0.737 0.841 -12.4 28.94 31.82 -9.1 500.3 544.8 -8.2 1.017 1.079 -5.7850 0.913 1.170 -22.0 33.73 40.20 -16.1 588.6 699.6 -15.9 1.150 1.295 -11.2900 1.188 1.547 -23.2 39.33 49.68 -20.8 719.6 873.5 -17.6 1.307 1.528 -14.5950 1.621 2.001 -19.0 46.44 60.16 -22.8 922.6 1083.1 -14.8 1.515 1.793 -15.5
1000 2.180 2.546 -14.4 54.16 71.92 -24.7 1181.4 1332.9 -11.4 1.752 2.093 -16.31050 2.799 3.106 -9.9 61.61 83.39 -26.1 1466.6 1587.8 -7.6 1.990 2.387 -16.61100 3.661 3.781 -3.2 71.17 96.59 -26.3 1862.1 1895.5 -1.8 2.302 2.730 -15.71150 4.414 4.455 -0.9 81.93 109.19 -25.0 2205.7 2202.1 0.2 2.615 3.061 -14.61200 5.403 5.208 3.7 97.87 122.61 -20.2 2653.0 2544.5 4.3 3.049 3.418 -10.8
Total CO emissions (kg/h) Total CO 2 emissions (kg/h) Total NO X emissions (kg/h)Total HC emissions (kg/h)

Chapter 7—Comparison of Roundabout MOEs using SIDRA vs. Maryland Gaps
7-9
7.2 20% Heavy Vehicles on Major Road, 10% Heavy Vehicles on Minor Road
Table 7.5 presents the change in effective intersection capacity and major and minor road capacities when the heavy vehicle percentage is increased to 20% on the major road. Similar to the values in Table 7.1, the capacities are all increased by a relatively constant 23% up to an MRV of 750 vph. After which the differences in effective intersection and minor road capacities begin to decrease. Figures 7.8 through 7.10 also show these values.
TABLE 7.5 Effective Intersection, Major Road, and Minor Road Capacities
MRV (vph) Md/De SIDRA % change Md/De SIDRA % change Md/De SIDRA % change
50 4717 3877 21.7 1533 1260 21.7 1559 1240 25.7100 4406 3610 22.0 1478 1211 22.0 1543 1224 26.1150 4350 3555 22.4 1444 1180 22.4 1438 1139 26.3200 4190 3421 22.5 1399 1142 22.5 1383 1100 25.7250 4098 3341 22.7 1359 1108 22.7 1289 1030 25.1300 3938 3209 22.7 1317 1073 22.7 1223 985 24.2350 3837 3129 22.6 1278 1042 22.6 1135 922 23.1400 3726 3044 22.4 1240 1013 22.4 1062 871 21.9450 3605 2949 22.2 1199 981 22.2 981 813 20.7500 3461 2842 21.8 1156 949 21.8 903 752 20.1550 3344 2751 21.6 1116 918 21.6 821 695 18.1600 3229 2666 21.1 1077 889 21.1 741 633 17.1650 3116 2584 20.6 1037 860 20.6 655 563 16.3700 2998 2500 19.9 1001 835 19.9 577 517 11.6750 2902 2431 19.4 967 810 19.4 502 469 7.0800 2698 2368 13.9 933 790 18.1 449 468 -4.1850 2414 2321 4.0 949 773 22.8 403 478 -15.7900 2190 2262 -3.2 980 755 29.8 364 491 -25.9950 1962 2208 -11.1 1016 736 38.0 327 488 -33.0
1000 1730 2199 -21.3 1015 732 38.7 289 474 -39.01050 1694 2171 -22.0 988 724 36.5 282 475 -40.61100 1612 2191 -26.4 977 730 33.8 269 466 -42.31150 1573 2171 -27.5 948 724 30.9 262 466 -43.81200 1485 2186 -32.1 934 728 28.3 248 456 -45.6
Effective intersection capacity (vph) Major road capacity (vph) Minor road capacity (vph)

Chapter 7—Comparison of Roundabout MOEs using SIDRA vs. Maryland Gaps
7-10
1000
1500
2000
2500
3000
3500
4000
4500
5000
0 200 400 600 800 1000 1200
M ajor road one-way volume (vph)
20% heavy vehicles on major road, 10% on minor road
Effe
ctiv
e in
ters
ectio
n ca
paci
ty (v
ph)
SIDRA defaultMaryland/Delaware
FIGURE 7.8 Roundabout Effective Intersection Capacity
600
700
800
900
1000
1100
1200
1300
1400
1500
1600
0 200 400 600 800 1000 1200
Major road one-way volume (vph)
20% heavy vehicles on major road, 10% on minor road
Maj
or ro
ad c
apac
ity (v
ph)
SIDRA defaultMaryland/Delaware
FIGURE 7.9 Roundabout Major Road Capacity

Chapter 7—Comparison of Roundabout MOEs using SIDRA vs. Maryland Gaps
7-11
0
200
400
600
800
1000
1200
1400
1600
1800
0 200 400 600 800 1000 1200
Major road one-way volume (vph)
20% heavy vehicles on major road, 10% on minor road
Min
or r
oad
capa
city
(vph
)
SIDRA defaultMaryland/Delaware
FIGURE 7.10 Roundabout Minor Road Capacity
The major and minor road average delays presented in Table 7.6 show the same pattern as in Table 7.2. The amount of decrease in delay increases with increasing MRV throughout the range of volumes analyzed, except for the minor road delay, which has a crossover point at an MRV of 800 vph.

Chapter 7—Comparison of Roundabout MOEs using SIDRA vs. Maryland Gaps
7-12
TABLE 7.6 Major and Minor Road Delay
MRV (vph) Md/De SIDRA % change Md/De SIDRA % change
50 6.2 6.2 0.0 7.0 7.1 -1.4100 6.3 6.4 -1.6 7.2 7.4 -2.7150 6.4 6.6 -3.0 7.4 7.8 -5.1200 6.6 6.8 -2.9 7.7 8.7 -11.5250 6.7 7.1 -5.6 8.0 8.5 -5.9300 6.9 7.4 -6.8 8.3 8.9 -6.7350 7.1 7.7 -7.8 8.8 9.4 -6.4400 7.4 8.0 -7.5 9.2 9.9 -7.1450 7.6 8.4 -9.5 9.8 10.5 -6.7500 8 9.1 -12.1 10.4 11.1 -6.3550 8.3 10.6 -21.7 11.2 12.0 -6.7600 9.2 12.7 -27.6 12.2 14.2 -14.1650 10.7 16.1 -33.5 15.3 18.2 -15.9700 12.9 23.0 -43.9 20.2 23.9 -15.5750 16.4 42.6 -61.5 32.8 38.8 -15.5800 24.3 95.0 -74.4 66.9 49.3 35.7850 30.9 169.6 -81.8 172.0 59.7 188.1900 35.9 253.6 -85.8 319.3 65.6 386.7950 40.2 344.3 -88.3 525.3 95.6 449.5
1000 68.1 413.4 -83.5 792.0 155.6 409.01050 130.1 491.8 -73.5 906.2 192.2 371.51100 188 547.4 -65.7 1083.9 261.5 314.51150 269.2 624.8 -56.9 1223.5 307.9 297.41200 334.3 678.7 -50.7 1443.3 385.7 274.2
Major road average delay (s) Minor road average delay (s)
The same pattern seen in Tables 7.2 and 7.6 can be observed for the major and minor road 95% queue lengths, where the decrease in queue length increases with increasing MRV. This data is presented in Table 7.7. The minor road queue length has a crossover point at the same MRV as the minor road delay (800 vph).

Chapter 7—Comparison of Roundabout MOEs using SIDRA vs. Maryland Gaps
7-13
TABLE 7.7 Major and Minor Road Queue Length
MRV (vph) Md/De SIDRA % change Md/De SIDRA % change
50 6 8 -25.0 3 4 -25.0100 13 17 -23.5 6 7 -14.3150 21 28 -25.0 10 13 -23.1200 31 40 -22.5 14 18 -22.2250 42 54 -22.2 20 25 -20.0300 55 70 -21.4 26 32 -18.8350 69 89 -22.5 35 42 -16.7400 86 110 -21.8 45 53 -15.1450 105 135 -22.2 58 67 -13.4500 129 170 -24.1 72 83 -13.3550 156 231 -32.5 92 106 -13.2600 200 310 -35.5 118 146 -19.2650 265 423 -37.4 169 206 -18.0700 351 615 -42.9 236 272 -13.2750 473 1030 -54.1 365 410 -11.0800 704 1858 -62.1 635 513 23.8850 906 2967 -69.5 1411 631 123.6900 1074 4185 -74.3 2341 710 229.7950 1234 5446 -77.3 3449 1002 244.2
1000 1822 6458 -71.8 4608 1532 200.81050 2979 7557 -60.6 5132 1868 174.71100 4079 8445 -51.7 5878 2466 138.41150 5521 9532 -42.1 6445 2880 123.81200 6681 10394 -35.7 7214 3518 105.1
Major road 95% queue (ft) Minor road 95% queue (ft)
The results for the four emissions measures of effectiveness are presented in Table 7.8. It can be seen that the total emissions are reduced with the smaller gap acceptance parameters in all but two cases (total CO emissions, MRV 1150-1200 vph). The values presented in Table 7.8 are shown plotted in Figures 7.11 through 7.14.

Chapter 7—Comparison of Roundabout MOEs using SIDRA vs. Maryland Gaps
7-14
TABLE 7.8 Roundabout Total Emissions
MRV (vph) Md/De SIDRA % change Md/De SIDRA % change Md/De SIDRA % change Md/De SIDRA % change
50 0.039 0.039 0.0 1.53 1.54 -0.6 30.90 31.00 -0.3 0.058 0.059 -1.7100 0.076 0.077 -1.3 3.05 3.09 -1.3 60.60 60.90 -0.5 0.116 0.117 -0.9150 0.118 0.120 -1.7 4.79 4.86 -1.4 93.70 94.20 -0.5 0.180 0.182 -1.1200 0.159 0.161 -1.2 6.49 6.61 -1.8 125.30 126.10 -0.6 0.242 0.245 -1.2250 0.201 0.204 -1.5 8.27 8.43 -1.9 157.70 158.70 -0.6 0.306 0.310 -1.3300 0.243 0.246 -1.2 10.07 10.27 -1.9 189.40 190.70 -0.7 0.370 0.375 -1.3350 0.288 0.292 -1.4 12.01 12.26 -2.0 223.00 224.60 -0.7 0.439 0.445 -1.3400 0.334 0.338 -1.2 14.02 14.34 -2.2 257.20 259.20 -0.8 0.509 0.517 -1.5450 0.381 0.387 -1.6 16.13 16.52 -2.4 291.90 294.40 -0.8 0.582 0.591 -1.5500 0.429 0.436 -1.6 18.30 18.77 -2.5 326.60 329.70 -0.9 0.655 0.667 -1.8550 0.479 0.488 -1.8 20.61 21.19 -2.7 362.70 366.60 -1.1 0.733 0.747 -1.9600 0.531 0.549 -3.3 23.04 24.08 -4.3 399.60 407.50 -1.9 0.814 0.838 -2.9650 0.590 0.629 -6.2 25.74 27.77 -7.3 439.30 456.50 -3.8 0.900 0.947 -5.0700 0.655 0.720 -9.0 28.59 31.13 -8.2 481.40 509.90 -5.6 0.989 1.048 -5.6750 0.757 0.900 -15.9 32.72 37.02 -11.6 539.70 603.90 -10.6 1.108 1.208 -8.3800 0.925 1.250 -26.0 37.68 47.51 -20.7 627.50 774.10 -18.9 1.248 1.479 -15.6850 1.261 1.744 -27.7 45.14 61.08 -26.1 790.10 1011.00 -21.8 1.455 1.828 -20.4900 1.696 2.300 -26.3 52.93 75.03 -29.5 995.60 1276.20 -22.0 1.679 2.191 -23.4950 2.302 2.990 -23.0 61.83 90.41 -31.6 1279.00 1602.80 -20.2 1.948 2.598 -25.0
1000 3.261 3.691 -11.6 76.74 105.24 -27.1 1720.10 1933.70 -11.0 2.380 2.994 -20.51050 4.123 4.416 -6.6 95.79 119.77 -20.0 2118.70 2276.40 -6.9 2.879 3.388 -15.01100 5.205 5.168 0.7 115.66 134.79 -14.2 2617.60 2630.60 -0.5 3.424 3.794 -9.81150 6.380 6.010 6.2 137.86 150.24 -8.2 3159.40 3027.50 4.4 4.026 4.221 -4.61200 7.745 6.851 13.0 158.70 165.51 -4.1 3786.60 3422.00 10.7 4.626 4.643 -0.4
Total CO emissions (kg/h) Total CO 2 emissions (kg/h) Total NO X emissions (kg/h)Total HC emissions (kg/h)

Chapter 7—Comparison of Roundabout MOEs using SIDRA vs. Maryland Gaps
7-15
0.000
1.000
2.000
3.000
4.000
5.000
6.000
7.000
8.000
9.000
0 200 400 600 800 1000 1200
Major road one-way volume (vph)
20% heavy vehicles on m ajor road, 10% on m inor road
Tota
l HC
em
issi
ons
(kg/
h)
SIDRA defaultMaryland/Delaware
FIGURE 7.11 Roundabout Total HC Emissions
0.00
20.00
40.00
60.00
80.00
100.00
120.00
140.00
160.00
180.00
0 200 400 600 800 1000 1200
Major road one-way volume (vph)
20% heavy vehicles on m ajor road, 10% on m inor road
Tota
l CO
em
issi
ons
(kg/
h)
SIDRA defaultMaryland/Delaware
FIGURE 7.12 Roundabout Total CO Emissions

Chapter 7—Comparison of Roundabout MOEs using SIDRA vs. Maryland Gaps
7-16
0.0
500.0
1000.0
1500.0
2000.0
2500.0
3000.0
3500.0
4000.0
0 200 400 600 800 1000 1200
Major road one-way volume (vph)
20% heavy vehicles on m ajor road, 10% on m inor road
Tota
l CO
2 em
issi
ons
(kg/
h)
SIDRA defaultMaryland/Delaware
FIGURE 7.13 Roundabout Total CO2 Emissions
0.0000.500
1.0001.5002.0002.500
3.0003.5004.000
4.5005.000
0 200 400 600 800 1000 1200
Major road one-way volume (vph)
20% heavy vehicles on m ajor road, 10% on m inor road
Tota
l NO
X e
mis
sion
s (k
g/h)
SIDRA defaultMaryland/Delaware
FIGURE 7.14 Roundabout Total NOX Emissions

Chapter 7—Comparison of Roundabout MOEs using SIDRA vs. Maryland Gaps
7-17
7.3 Changes in Threshold Volumes The decreased critical gap and follow-up times observed from data collection generally created an increase in capacity and a decrease in delay, queue length, and emissions. These smaller gap acceptance parameters also led to an increase in the range of major road one-way volumes for which a roundabout may be more appropriate than a two-way stop controlled or signalized intersection. Table 7.9 summarized the volumes determined from the analysis as the threshold volumes between intersection types for the observed Maryland/Delaware and SIDRA default gap acceptance parameters and in both heavy vehicle scenarios. It can be seen that the smaller critical gap and follow-up times decreased the TWSC-Roundabout threshold volume and increased the Roundabout-Signal threshold volume for all three cases considered. TABLE 7.9 Changes in Threshold Volumes between Intersection Types for Observed Maryland/Delaware and SIDRA Default Gap Acceptance Parameters
Threshold based uponMajor Rd. Minor Rd. MD/DE SIDRA MD/DE SIDRA
10 10 Effective Intersection Capacity 0 115 809 680Average of Emissions 282 306 859 670Weighted Average of all MOEs 150 216 855 705
20 10 Effective Intersection Capacity 0 114 761 623Average of Emissions 258 314 769 594Weighted Average of all MOEs 137 190 840 669
HV percentage TWSC-Roundabout Roundabout-Signal
The values listed in Table 7.9 indicate the lower and upper limits of ranges for which roundabouts are best suited, based upon the indicated criteria. A graphical representation of these ranges is presented in Figure 7.15, where the changes between varying criteria and heavy vehicle percentages are more readily seen. The smaller critical gap and follow-up time observed in data collection increased the MRV range for roundabouts an average of 54% over the range obtained using the SIDRA software default values. Increasing the heavy vehicle percentage on the main road from 10% to 20% decreased the MRV range for roundabouts an average of 9%.

Chapter 7—Comparison of Roundabout MOEs using SIDRA vs. Maryland Gaps
7-18
FIGURE 7.15 MRV Ranges for which Roundabouts are Most Appropriate Using Observed Maryland/Delaware and SIDRA Default Gap Acceptance Parameters
Major roadThreshold based upon HV (%) *
Effective intersection capacity 10
20
Emissions average 10
20
Weighted average 10
20
* Note: Minor road HV 10% in both cases
SIDRA defaultMaryland/Delaware
Major road one-way volume (vph)
800 900400 500 600 7000 200 300100

8-1
8.0 ROUNDABOUT VOLUME THRESHOLDS Among the highlights of this study is the development of major road one-way volume thresholds which help define volume conditions under which each of the three intersection types (two-way stop-controlled, single-lane roundabout, and pre-timed signal) are most appropriate based upon the MOEs considered in this study. Figures 8.1 through 8.4 are graphical representations of Tables 5.1, 5.2, 6.1, 6.2, and 7.9. The heavy lines represent two possible ways of determining overall threshold volumes, one based solely upon the effective intersection capacity and the other on a weighted average of all MOEs. The weighted average was determined by assigning weights as follows: effective intersection capacity (3), major road capacity (1), minor road capacity (1), major road average delay (2), minor road average delay (2), major road 95% queue (1), minor road 95% queue (1), total HC emissions (2), total CO emissions (2), total NOX emissions (2), and total CO2 emissions (2). These weights were determined while keeping in mind the focus of this study, which was the consideration of vehicular emissions. Figures 8.1 and 8.2 present the volume ranges based upon the effective intersection capacity and the weighted average using the SIDRA default gap acceptance parameters for each of the heavy vehicle scenarios. Figures 8.3 and 8.4 show thresholds based upon the same conditions using the critical gap and follow-up times determined from data collection in Maryland for each of the heavy vehicle scenarios. Figures 8.1 through 8.4 all show the same occurrence where the MRV range for roundabouts is shifted to the right when the weighted average of all MOEs is considered rather than solely the effective intersection capacity. The decreased critical gap and follow-up times obtained from data collection generally resulted in an increase in capacity and a decrease in delay, queue length, and emissions. These smaller gap acceptance parameters also led to an increase in the range of major road one-way volumes for which a roundabout may be more appropriate than a two-way stop controlled or signalized intersection. Comparing Figures 8.1 and 8.2 with Figures 8.3 and 8.4, it can be seen that the lesser critical gap and follow-up times decreased the TWSC-Roundabout threshold volume and increased the Roundabout-Signal threshold volume for effective intersection capacity and weighted average criteria. As discussed previously in Chapter 7, the smaller critical gap and follow-up time observed in data collection increased the MRV range for roundabouts an average of 54% over the range obtained using the SIDRA software default values. The increase in heavy vehicle percentage on the main road from 10% to 20% decreased the MRV range for roundabouts an average of 9%.

Chapter 8—Roundabout Volume Thresholds
8-2
Effe
ctiv
e In
ters
ectio
n C
apac
ity (v
ph)
Maj
or R
oad
Shar
ed L
ane
Cap
acity
(vph
)
Min
or R
oad
Shar
ed L
ane
Cap
acity
(vph
)
Maj
or R
oad
Aver
age
Del
ay (s
)
Min
or R
oad
Aver
age
Del
ay (s
)
Maj
or R
oad
95%
Que
ue L
engt
h (ft
)
Min
or R
oad
95%
Que
ue L
engt
h (ft
)
Tota
l HC
Em
issi
ons
(kg/
h)
Tota
l CO
Em
issi
ons
(kg/
h)
Tota
l NO
X Em
issi
ons
(kg/
h)
Tota
l CO
2 Em
issi
ons
(kg/
h)
TWSC
Rou
ndab
out
Sign
al
FIG
UR
E 8.
1 V
olum
e Th
resh
olds
bet
wee
n In
ters
ectio
n Ty
pes
usin
g SI
DR
A D
efau
lt G
ap V
alue
s
Effe
ctiv
e In
ters
ectio
n C
apac
ity T
hres
hold
Wei
ghte
d A
vera
ge T
hres
hold
700
800
500
900
100
1100
10%
hea
vy v
ehic
les
on b
oth
road
s
1000
200
300
400
Maj
or R
oad
One
-Way
Vol
ume
(vph
)
012
0060
0
115
680
216
705

Chapter 8—Roundabout Volume Thresholds
8-3
Effe
ctiv
e In
ters
ectio
n C
apac
ity (v
ph)
Maj
or R
oad
Shar
ed L
ane
Cap
acity
(vph
)
Min
or R
oad
Shar
ed L
ane
Cap
acity
(vph
)
Maj
or R
oad
Aver
age
Del
ay (s
)
Min
or R
oad
Aver
age
Del
ay (s
)
Maj
or R
oad
95%
Que
ue L
engt
h (ft
)
Min
or R
oad
95%
Que
ue L
engt
h (ft
)
Tota
l HC
Em
issi
ons
(kg/
h)
Tota
l CO
Em
issi
ons
(kg/
h)
Tota
l NO
X Em
issi
ons
(kg/
h)
Tota
l CO
2 Em
issi
ons
(kg/
h)
TWSC
Rou
ndab
out
Sign
al
Wei
ghte
d A
vera
ge
Effe
ctiv
e In
ters
ectio
n C
apac
ity
20%
hea
vy v
ehic
les
on m
ajor
road
, 10%
on
min
or ro
ad
700
800
900
1000
1100
Maj
or R
oad
One
-Way
Vol
ume
(vph
)
012
00
FIG
UR
E 8.
2 V
olum
e Th
resh
olds
bet
wee
n In
ters
ectio
n Ty
pes
usin
g S
IDR
A D
efau
lt G
ap V
alue
s
100
200
300
400
500
600
114
623
190
668

Chapter 8—Roundabout Volume Thresholds
8-4
Effe
ctiv
e In
ters
ectio
n C
apac
ity (v
ph)
Maj
or R
oad
Sha
red
Lane
Cap
acity
(vph
)
Min
or R
oad
Sha
red
Lane
Cap
acity
(vph
)
Maj
or R
oad
Ave
rage
Del
ay (s
)
Min
or R
oad
Ave
rage
Del
ay (s
)
Maj
or R
oad
95%
Que
ue L
engt
h (ft
)
Min
or R
oad
95%
Que
ue L
engt
h (ft
)
Tota
l HC
em
issi
ons
(kg/
h)
Tota
l CO
em
issi
ons
(kg/
h)
Tota
l NO
X e
mis
sion
s (k
g/h)
Tota
l CO
2 em
issi
ons
(kg/
h)
TWSC
Rou
ndab
out
Sign
al
FIG
UR
E 8.
3 V
olum
e Th
resh
olds
bet
wee
n In
ters
ectio
n Ty
pes
usin
g M
aryl
and/
Del
awar
e G
ap V
alue
s
900
10%
hea
vy v
ehic
les
on b
oth
road
s
1000
200
300
400
Maj
or R
oad
One
-Way
Vol
ume
(vph
)
012
0060
010
0
Effe
ctiv
e In
ters
ectio
n C
apac
ity T
hres
hold
Wei
ghte
d A
vera
ge T
hres
hold
500
1100
700
800
809
150
855

Chapter 8—Roundabout Volume Thresholds
8-5
Effe
ctiv
e In
ters
ectio
n C
apac
ity (v
ph)
Maj
or R
oad
Shar
ed L
ane
Cap
acity
(vph
)
Min
or R
oad
Shar
ed L
ane
Cap
acity
(vph
)
Maj
or R
oad
Aver
age
Del
ay (s
)
Min
or R
oad
Aver
age
Del
ay (s
)
Maj
or R
oad
95%
Que
ue L
engt
h (ft
)
Min
or R
oad
95%
Que
ue L
engt
h (ft
)
Tota
l HC
em
issi
ons
(kg/
h)
Tota
l CO
em
issi
ons
(kg/
h)
Tota
l NO
X em
issi
ons
(kg/
h)
Tota
l CO
2 em
issi
ons
(kg/
h)
TWSC
Rou
ndab
out
Sign
al
1100
700
800
600
100
Effe
ctiv
e In
ters
ectio
n C
apac
ity T
hres
hold
Wei
ghte
d A
vera
ge T
hres
hold
500
FIG
UR
E 8.
4 Vo
lum
e Th
resh
olds
bet
wee
n In
ters
ectio
n Ty
pes
usin
g M
aryl
and/
Del
awar
e G
ap V
alue
s
900
20%
hea
vy v
ehic
les
on m
ajor
road
, 10%
on
min
or ro
ad
1000
200
300
400
Maj
or R
oad
One
-Way
Vol
ume
(vph
)
012
00
761
137
840

9-1
9.0 CONCLUSIONS This study analyzed three intersection types: two-way stop controlled, roundabout, and pretimed signal, and compared them with one another based on several performance measures of effectiveness provided by the SIDRA simulation software. The selected MOEs were: effective intersection capacity (entire intersection), main road capacity, minor road capacity, major road average delay, minor road average delay, major road 95% queue length, minor road 95% queue length, and four vehicular emission levels (CO, CO2, HC, and NOX). Comparisons were made between the unsignalized intersection and roundabout at lower major road one-way volumes (MRV) and between the signalized intersection and roundabout at higher MRV. The analysis identified the MRV at which the advantage switched between intersection types for each MOE considered. In order to obtain general ranges for which each intersection type performs best, a set of overall volume thresholds were determined based upon the effective intersection capacity, as well a set of thresholds based upon a weighted average of the MOEs considered. This was first conducted using the SIDRA software default values and repeated a second set of analyses using critical gap and follow-up times determined from data collection at two roundabouts located in Maryland near its border with Delaware. In order to obtain gap acceptance characteristics more closely resembling those of Delaware drivers, two nearby roundabouts were observed. Due to the lack of roundabouts in Delaware experiencing volumes sufficient for obtaining critical gap and follow-up times of drivers, two locations in eastern Maryland were chosen for observation. These sites are the intersections of MD 273 and 276 in Cecil County and MD 18 and Castle Marina Road in Queen Anne’s County. The videotapes were reviewed and critical gap values of 3.85 and 3.91 s were found for the study sites, which are lower than those values of 4.1 to 4.6 s recommended by the HCM 2000. The follow-up times found for the sites are 2.1 and 2.3 s compared to 2.6 to 3.1 provided by the HCM 2000. In general, it was found that the two-way stop controlled intersection performed best for relatively low major road one-way volumes, the pretimed signal performed best for relatively high major road one-way volumes, and the roundabout performed best for a mid-range volume between the two. Preliminary analyses using the SIDRA software default gap values showed that the approximate MRV range for which a single-lane roundabout is deemed most reasonable for use at an intersection with the geometric and traffic conditions assumed in this study is between approximately 220 and 700 vph (see Figure 8.1). When heavy vehicles on the major road are increased, this range becomes approximately 190 to 670 vph (see Figure 8.2). Follow-up analyses using the SIDRA software calibrated for Maryland/Delaware drivers showed that roundabouts are best suited for an MRV range of approximately 150 to 850 vph (see Figure 8.3). When heavy vehicles along the major road are increased, the suitable range becomes approximately 140 to 840 vph (see Figure 8.4).

Chapter 9—Conclusions
9-2
Further research related to this study is suggested on several topics: (1) an analysis of the volume ranges suitable for the installation of a roundabout instead of a four-way stop-controlled conventional intersection, (2) the impact of a greater range of heavy vehicle percentages on the proposed volume thresholds, and (3) the sensitivity of the proposed thresholds to critical gap and follow-up times so that specific volume thresholds could be applied to other locations with different driver gap acceptance characteristics. In conclusion, our recommendation for the range of major road one-way volumes for which the construction of a roundabout may be preferred to that of a two-way stop-controlled intersection or a pre-timed signalized intersection is summarized below. Figure 9.1 shows volume ranges for both heavy vehicle scenarios on the major road, and is based on SIDRA analyses using the Maryland/Delaware gap acceptance parameters collected for this study.
FIGURE 9.1 Recommended Ranges of Major Road One-way Volumes for which the Construction of Roundabouts is Preferred to that of TWSC or Signalized Intersections. 10% Heavy Vehicles on the Major Road (top), 20% Heavy Vehicles on the Minor Road (bottom)
150 vph 850 vph
TWSC SignalizedIntersection Intersection
140 vph 840 vph
RoundaboutRoundabout
REFERENCES Akçelik & Associates Pty Ltd, SIDRA 2.1 User Guide, Greythorn, Victoria, Australia (July 2005). Al-Masaeid, H.R., “Capacity and Performance of Roundabouts,” Canadian Journal of Civil Engineering, Vol. 31 (1999) pp. 597-605. Al-Masaeid, H.R., and M.Z. Faddah, “Capacity of Roundabouts in Jordan,” Transportation Research Record 1572, Transportation Research Board, National Research Council, Washington, D.C. (1997) pp. 76-85. Al-Omari, B.H., H.R. Al-Masaeid, and Y.S. Al-Shawabkah, “Development of a Delay Model for Roundabouts in Jordan,” Journal of Transportation Engineering, ASCE (Jan/Feb 2004) pp. 76-82. Brilon, W., and B. Stuwe, “Capacity and Design of Traffic Circles in Germany,” Transportation Research Record 1398, Transportation Research Board, National Research Council, Washington, D.C. (1993) pp. 61-67. Drew, D.R., Traffic Flow Theory and Control, New York: McGraw-Hill Book Company, 1968. Federal Highway Administration, Roundabouts: An Informational Guide, Report RD-00-067 (June 2000). Flannery, A., and T.K. Datta, “Operational Analysis and Performance of American Roundabouts,” Institute of Transportation Engineers 66th Annual Meeting, pp. 218-222. Flannery, A., J.P. Kharoufeh, N. Gautam, and L. Elefteriadou, “Estimating Delay at Roundabouts,” Institute of Transportation Engineers Annual Meeting Compendium, Washington, D.C. (2000). Flannery, A., L. Elefteriadou, P. Koza, and J. McFadden, “Safety, Delay, and Capacity of Single-lane Roundabouts in the United States,” Transportation Research Record 1646, Transportation Research Board, National Research Council, Washington, D.C. (1998) pp. 63-70. Hagring, O., “Effects of OD flows on Roundabout Entry Capacity,” paper presented at Fourth International Symposium on Highway Capacity, Maui, HW (June 27-July1, 2000). Jacquemart, G., Modern Roundabout Practice in the United States, National Cooperative Highway Research Program Synthesis of Highway Practice No. 264, Transportation Research Board, National Research Council, Washington, D.C. (1998).

Kimber, R.M., The Traffic Capacity of Roundabouts, Laboratory Report 942, Transport and Road Research Laboratory, Crawthome, Berkshire, England (1980). Mandavilli, S., E.R. Russell, and M.J. Rys, “Impact of Modern Roundabouts on Vehicular Emissions,” Proceedings of the 2003 Mid-Continent Transportation Research Symposium, Ames, Iowa (August 2003). Polus, A., and S. Shmueli, “Analysis and Evaluation of the Capacity of Roundabouts,” Transportation Research Record 1572, Transportation Research Board, National Research Council, Washington, D.C. (1997) pp. 99-104. Polus, A., and S. Shmueli, “Entry Capacity at Roundabouts and Impact of Waiting Times,” Road and Transport Research, Vol. 8, No. 3 (September 1999) pp. 43-54. Polus, A., S. Shmueli Lazar, and M. Livneh, “Critical Gap as a Function of Waiting Time in Determining Roundabout Capacity,” Journal of Transportation Engineering, ASCE (Sept/Oct 2003) pp. 504-509. Roundabout Design Guidelines, State of Maryland Department of Transportation, State Highway Administration, Hanover (1995) 64 pp. Russell, E.R., S. Mandavilli, and M.J. Rys, Operational Performance of Kansas Roundabouts: Phase II, Report No. K-TRAN: KSU-02-4. Final Report (May 2005). Shiftan, Y., A. Polus, and S. Shmueli-Lazar, “Evaluation of the Waiting-time Effect on Critical Gaps at Roundabouts by a Logit Model,” paper presented at Transportation Research Board Annual Meeting, Washington, D.C. (January 2003). Sisiopiku, V.P., and H. Oh, “Evaluation of Roundabout Performance using SIDRA,” Journal of Transportation Engineering, (March/April 2001) pp. 143-150. Transportation Research Board, Highway Capacity Manual, National Research Council, Washington, D.C. (2000). Troutbeck, R.J., “Capacity and design of traffic circles in Australia,” Transportation Research Record 1398, Transportation Research Board, National Research Council, Washington, D.C. (1993) pp. 68-74. Troutbeck, R.J., and S. Kako, “Limited Priority Merge at Unsignalized Intersections,” Transportation Research Part A, Vol. 33 (1999) pp. 291-304. Várhelyi, A., “The Effects of Small Roundabouts on Emissions and Fuel Consumption: A Case Study,” Transportation Research Part D, Vol. 7 (2002) pp. 65-71.

Delaware Center for Transportation
University of Delaware Newark, Delaware 19716
AN EQUAL OPPORTUNITY/AFFIRMATIVE ACTION EMPLOYERThe University of Delaware is committed to assuring equal opportunity to all persons and does not discriminate on the basis of race, color, gender, religion, ancestry, national origin, sexual orientation, veteran statutes, age, or disability in its educational programs, activities, admissions, or employment practices as required by the Title IX of the Education Amendments of 1972, Title VI of the Civil Rights Act of 1964, the Rehabilitation Act of 1973, the Americans with Disabilities Act, other applicable statutes and University policy. Inquiries concerning these statutes and information regarding campus accessibility should be referred to the Affirmative Action Officer, 305 Hullihen Hall, (302) 831-2835 (voice), (302) 831-4563 (TTD)