evaluation of semiautonomous navigation assistance system
TRANSCRIPT
JRRDJRRD Volume 47, Number 9, 2010
Pages 877–890
Journal of Rehabil itation Research & Development
Evaluation of semiautonomous navigation assistance system for power wheelchairs with blindfolded nondisabled individuals
Vinod Sharma, PhD;1* Richard Simpson, PhD, ATP;1–3 Edmund LoPresti, PhD;4 Mark Schmeler, PhD, OTR/L, ATP2
Departments of 1Bioengineering and 2Rehabilitation Sciences and Technology, University of Pittsburgh, Pittsburgh, PA; 3Human Engineering Research Labs, Department of Veterans Affairs Pittsburgh Healthcare System, Pittsburgh, PA; 4AT Sciences, Pittsburgh, PA
Abstract—Some individuals with disabilities are denied pow-ered mobility because they lack the visual, motor, and/or cog-nitive skills required to safely operate a power wheelchair. The Drive-Safe System (DSS) is an add-on, distributed, shared-control navigation assistance system for power wheelchairs intended to provide safe and independent mobility to such indi-viduals. The DSS is a human-machine system in which the user is responsible for high-level control of the wheelchair, such as choosing the destination, path planning, and basic navi-gation actions, while the DSS overrides unsafe maneuvers through autonomous collision avoidance, wall following, and door crossing. In this project, the DSS was clinically evaluated in a controlled laboratory with blindfolded, nondisabled indi-viduals. Further, these individuals’ performance with the DSS was compared with standard cane use for navigation assistance by people with visual impairments. Results indicate that com-pared with a cane, the DSS significantly reduced the number of collisions. Users rated the DSS favorably even though they took longer to navigate the same obstacle course than they would have using a standard long cane. Participants experi-enced less physical demand, effort, and frustration when using the DSS as compared with a cane. These findings suggest that the DSS can be a viable powered mobility solution for wheel-chair users with visual impairments.
Key words: artificial intelligence, distributed systems, embed-ded systems, human-robot interaction, intelligent mobility aids, power wheelchairs, robotics, sensors, shared control, smart wheelchair.
INTRODUCTION
Problem StatementIndependent mobility is a key component in maintain-
ing the physical and psychosocial health of an individual [1–3]. Further, for people with disabilities, independent mobility increases vocational and educational opportuni-ties, reduces dependence on caregivers and family mem-bers, and promotes feelings of self-reliance [2]. Psychologically, a decrease in mobility can lead to feel-ings of emotional loss, anxiety, depression, reduced self-esteem, social isolation, stress, and fear of abandonment.
Abbreviations: ADL = activities of daily living, DSS = Drive-Safe System, IR = infrared range finder, NASA-TLX = National Aeronautics and Space Administration-Task Load Index, SD = standard deviation, TCT = task completion time, TLX-E = NASA-TLX Effort, TLX-F = NASA-TLX Frustra-tion, TLX-MD = NASA-TLX Mental Demand, TLX-P = NASA-TLX Performance, TLX-PD = NASA-TLX Physical Demand, TLX-TD = NASA-TLX Temporal Demand, TLX-TWL = NASA-TLX total work load, TNC = total number of collisions, TNC-I = total number of Type I collisions, TNC-II = total number of Type II collisions, TNC-III = total number of Type III collisions, UR = ultrasonic range finder.*Address all correspondence to Vinod Sharma, PhD; Uni-versity of Pittsburgh–Rehabilitation Sciences and Technology,Bakery Square, 6465 Penn Avenue, Suite 401, Pittsburgh, PA 15206; 412-953-2157; fax: 412-624-6501. Email: [email protected]:10.1682/JRRD.2010.02.0012
877

878
JRRD, Volume 47, Number 9, 2010
Reduced functional mobility is linked with reduced par-ticipation and loss of social connections [1]. Power wheel-chairs offer the benefits of independent mobility while allowing individuals to devote their energy to activities of daily living (ADL) [4–5].
Even though the benefits of powered mobility are well documented, the safety issues associated with opera-tion of powered wheelchairs often prevent clinicians and rehabilitation practitioners from prescribing powered mobility [6–8]. One obstacle to safely operating a pow-ered wheelchair is impaired vision. The American Feder-ation for the Blind has estimated that 9.61 percent of all individuals who are legally blind also use a wheelchair or scooter, in addition to another 5.25 percent of individuals who have serious difficulties seeing but are not legally blind [9]. Further, 5.3 percent of all wheeled mobility equipment users are either legally blind or have serious difficulty in seeing [10].
Visual and physical impairments often accompany the natural aging process. Macular degeneration, cata-racts, glaucoma, and diabetic retinopathy are the leading causes of visual impairments among older adults. According to the 2007 Disability Status Report [11],40.3 percent of noninstitutionalized individuals aged 75 and older in the United States have conditions that sub-stantially limit one or more basic physical activities, such as walking, climbing stairs, reaching, lifting, or carrying. Further, 23.6 percent of individuals in this population have sensory disabilities, which include blindness or severe visual impairment. The percentage of wheelchair users who are age 65 or older steadily increased from2.7 percent in 1990 to 5.2 percent in 2005. Among the non-institutionalized population aged 85 and older, 12.28 per-cent use wheelchairs [10], most of which are manual wheelchairs pushed by a caregiver or a family member.
Limited literature addresses the use of power wheel-chairs by individuals with combined visual and mobility impairments. A case study of a visually impaired power wheelchair user who uses a white cane for navigation assistance was presented in Ganoza [12]. Another case study of a visually impaired person’s use of a guide dog with a power wheelchair is presented in Greenbaum et al. [13]. Other authors have evaluated the merits and limita-tions of using a white cane with a manual and power wheelchair [14–15]. Some researchers also advocate the use of power-assisted manual wheelchairs for this popu-lation [9,16].
The process of training an individual with visual and mobility impairments to operate a wheelchair while using a cane or guide dog is very time, labor, and resource intensive. It requires the active involvement and partici-pation of family members, caregivers, orientation and mobility experts, occupational therapists, rehabilitation engineers, and primary care providers [12–13]. Com-bined visual and mobility impairments will be encoun-tered with increasing frequency because of the growing elderly population; therefore, having alternative assistive technology that offers independent mobility for such individuals is important.
The use of smart wheelchairs has been researched since the early 1980s as a form of assistance for people who lack the visual, motor, or cognitive skills required to drive a power wheelchair [17]. A detailed discussion of the population of users who could benefit from smart wheelchairs is provided in Simpson et al. [18]. Despite a long history of research on smart wheelchairs, very few smart wheelchairs are available commercially [17,19]. The Wheelchair Pathfinder was a commercial product sold by Nurion Industries in early 2000 and later discon-tinued [19]. The Pathfinder was an electronic mobility aid that detected and alerted the user to the presence of potential obstacles to assist users who are blind or have low vision or who have limited arm or head control. The CALL Center smart power wheelchair is sold in Europe by Smile Rehab, Ltd (Berkshire, UK) and includes bump sensors, sonar sensors, and the ability to follow tape tracks on the floor [20].
Drive-Safe SystemWe believe that a combination of robotics and wheel-
chair technology can address the issues related to the safety and training of powered mobility for individuals who are unable to use a power wheelchair because of impaired visual, cognitive, and/or motor skills. The Drive-Safe System (DSS) is a human-machine system in which the user and machine share control of a power wheelchair. The user decides the speed and direction of travel with a joystick. If obstacles are present in the direction of travel, the DSS’s collision avoidance routines override these commands, if necessary, slowing the chair or stopping it completely.
The DSS has a modular architecture, with a central control and interface node (the joystick translator) com-municating with one or more sensor nodes. The sensor nodes monitor the environment for potential obstacles and
879
SHARMA et al. Navigation assistance system for power wheelchairs
deliver auditory and visual alerts to the user. Each sensor node consists of five ultrasonic range finders (URs), five infrared range finders (IRs), two bumper inputs, one speaker, and three status light-emitting diodes.
The translator node plays the central role in imple-menting collision avoidance. The joystick translator com-municates with the wheelchair to determine the desired direction of travel. The translator node also maintains the current state of each sensor node element (e.g., UR range information, IR range information, bumper state) on the basis of data from the sensor nodes. Sensor data are used to check for the presence of obstacles in the direction the user is pointing the joystick. Typically, the translator node provides a signal to the wheelchair motor controller that is identical to the original joystick signal, preserving the user’s control. However, if the system detects a colli-sion risk, the translator node will scale the signal (slow-ing the wheelchair) or send a neutral signal to the motor controller (stopping the wheelchair). The translator node does not vary the direction of travel from the user’s origi-nal intent.
The DSS is designed to act as a specialty user interface, allowing it to connect with the control electronics of various wheelchairs. The current DSS prototype has been tested on wheelchairs from Pride Mobility (www.pridemobility.com) and Sunrise Medical (www.sunrisemedical.com), and past prototypes were tested on wheelchairs by Invacare (www.invacare.com), Permobil (www.permobil.com), and Everest and Jennings (www.grahamfield.com). The wheel-chair joystick (or other control device) plugs into the joy-stick translator, and the joystick translator plugs into the wheelchair’s motor controller. The joystick translator also obtains power from the wheelchair batteries and provides power to the sensor nodes.
The DSS can be used in areas that have been modi-fied to (1) reduce the likelihood of sensor failure and (2) limit the consequences of sensor failure. We believe that an individual who is motivated to use the DSS will be willing to make simple modifications to the environ-ment(s) in which the DSS will be used. These modifica-tions include (1) eliminating or obstructing glass walls and doors; (2) moving valuable, breakable objects to places where the wheelchair cannot break them; (3) using baby gates or doors to block stairwells; and (4) widening doorways to at least 32 in. The DSS can be used as a regu-lar wheelchair in unmodified environments but cannot be relied on as a smart wheelchair.
A detailed description of the DSS hardware and soft-ware will be published elsewhere.*
METHODS
SubjectsThis study employed nondisabled individuals wearing
blindfolds to simulate complete blindness. Using nondis-abled subjects enabled recruitment of a large number of homogeneous participants, which facilitated group statis-tical analyses. However, the nondisabled participants were not experienced wheelchair users and did not have the ori-entation and mobility skills of people with visual impair-ments. Nineteen participants (13 males, 6 females) were recruited for this study. The mean age of participants was 28.4 years (standard deviation [SD] 3.9 years). Three par-ticipants had prior experience with power wheelchair driving but none was a regular wheelchair user.
InstrumentationA Quantum-600 midwheel drive power wheelchair
(Pride Mobility Products; Exeter, Pennsylvania) was equipped with the DSS (Figure 1) for this study. The wheelchair was without tilt, recline, and seat-elevation functions and its seat width was 18 in (45.72 cm). The wheelchair was controlled by a proportional joystick. The maximum forward speed of the wheelchair was set to1.7 mi/h and the maximum reverse speed was set to 1.3 mi/hto closely match the average driving speed for wheelchair users [21]. An area of 3.30 × 7.50 m2 was used for the user trial. Safety glasses covered with paper tape on the front and sides were used as a blindfold. Cylindrical cardboard tubes 8 in. (20 cm) in diameter and 60 in. (152.4 cm) in height were used as obstacles, and wooden benches 36 in. (91.44 cm) in height were used to mark the boundary of the area.
PretrainingBefore participating in the study, each participant
read the informed consent form. Once participants indi-cated that they had read and understood the form and agreed to participate, they signed the informed consent
*LoPresti EF, Sharma V, Simpson R, Mostowy C. Performance testing of a collision-avoidance system for power wheelchairs. In submis-sion; 2010.

880
JRRD, Volume 47, Number 9, 2010
form. A copy of the informed consent form was given to each participant upon completion of the experiment.
The investigator adjusted the seating and positioning of the wheelchair according to each participant’s require-ments. For example, the wheelchair joystick was mounted on the left or the right side of the wheelchair, depending on whether the participant was left- or right-handed. Backrest and footrests were adjusted to allow participants to sit comfortably in the wheelchair. Once participants were comfortable with their seating and the positioning of the joystick, they were introduced to the wheelchair controller and the joystick interface. The experimenter explained the functioning of the wheel-chair; the maneuvering of the wheelchair with a propor-
tional joystick; and the controller parameters, such as maximum forward speed, maximum reverse speed, acceleration, and deceleration.
TrainingParticipants were required to demonstrate verbal
understanding of the system before they were given train-ing on how to maneuver the wheelchair using the joy-stick. Participants’ wheelchair driving skills were tested on two courses designed to enhance participants’ famili-arity with the wheelchair’s dynamics and ability to maneuver in tight spaces without a blindfold. Each par-ticipant traversed these courses while driving forward and then backward until he or she was able to traverse the courses without hitting any obstacles. While driving on the test course, participants did not have support from the DSS UR and IR sensors, but the touch sensitive bumpers were active; if a participant hit an obstacle, the bumpers would stop the wheelchair.
Next, participants learned to drive the wheelchair with a cane while blindfolded. Participants used a 48 in. (121.92 cm) white cane to scan for obstacles in the envi-ronment. Participants were given instructions on how to use the cane to scan the environment and detect obstacles while moving forward and while moving backward. Par-ticipants used their dominant hand to operate the joystick and their nondominant hand to scan the environment with the cane. Participants were asked to complete two obsta-cle courses to practice navigation while blindfolded and using a cane.
Once participants felt comfortable and confident with using the cane, they received training on operating the wheelchair with the DSS. Participants received an expla-nation about the DSS architecture, its various behaviors, and the logic the DSS uses to avoid collisions. Partici-pants received an explanation about the auditory feed-back patterns the DSS generates when there is an obstacle in the direction of travel. As part of the training, participants were blindfolded and asked to localize the position of the obstacles on the basis of auditory feed-back from the DSS. When participants stated that they understood the DSS and its operation, they were asked to approach obstacles placed in front of the wheelchair to observe the wheelchair’s response to obstacles. Partici-pants were then asked to approach obstacles placed to the side and rear of the wheelchair to observe the DSS’s response in these situations. Participants were then blind-folded and asked to complete two obstacle courses using
Figure 1.Blindfolded, nondisabled individual driving power wheelchair while using cane and Drive-Safe System.

881
SHARMA et al. Navigation assistance system for power wheelchairs
assistance from the DSS. Investigators observed the performance of the participants and instructed them on various navigation skills for effectively using DSS assis-tance. These training courses gave participants an under-standing of the obstacle distance thresholds of the DSS in various directions around the wheelchair.
The last set of training activities involved the use of the cane and the DSS together. Participants were instructed to use the cane to determine the location of obstacles when the DSS stopped the wheelchair. When the cane was not being used, participants were instructed to hold it on their lap or in a position where it did not interfere with the UR and IR sensors. Participants were asked to complete two training obstacle courses in this condition to familiarize themselves with use of the cane with the DSS.
Experimental DesignParticipants completed three trials under each of
three experimental conditions: • Cane: Participants used a 48 in. (121.92 cm) white
cane for navigation assistance while driving the power wheelchair.
• DSS: Participants used the DSS for navigation assistance. • Cane&DSS: Participants used both the cane and the
DSS for navigation assistance. Participants were instructed to use the DSS when the wheelchair was moving and to use the cane to find the position of obsta-cles when the wheelchair was stopped by the DSS.In each trial, participants were blindfolded and asked
to reach a goal indicated by a sound source (portable radio or laptop computer providing continuous music). The order of experimental conditions (Cane, DSS, and Cane&DSS) and obstacle courses (Figure 2) was ran-domized. Participants were given 4 minutes to complete each trial. One investigator carried a data collection sheet and filled in the sheet with observations about time and collisions during each trial. The other investigator walked behind the wheelchair and could bring the wheelchair to an immediate halt if a risk of danger to the participant was perceived. If participants displaced an obstacle from its location, the obstacle remained in its displaced loca-tion until the end of the trial. If a participant knocked over an obstacle, investigators removed the obstacle from the wheelchair’s immediate path of travel. Once both footrests of the wheelchair crossed the finish line, partici-pants were told to bring the wheelchair to a stop. The par-ticipant remained blindfolded while being moved back to
the starting position for the next trial, and the obstacle course was changed. After finishing the three trials in each condition, participants completed the National Aeronautics and Space Administration-Task Load Index (NASA-TLX) [22–23].
Dependent and Independent Variables
Task Completion TimeTask completion time (TCT) was the time a partici-
pant took to navigate the obstacle course from the start-ing position to the finish line, measured in seconds.
Total Number of CollisionsA collision was defined as contact between the
wheelchair and a cardboard tube or boundary wall. Total number of collisions (TNC) shows the total number of collisions across all three trials in each experimental con-dition (Cane, DSS, and Cane&DSS). The intensity and severity of a collision was determined based on the dis-placement of an obstacle from its initial position:
• Type I collision: Collision in which a cardboard tube was displaced by less than 2 in. or the wheelchair touched the surrounding wall without displacing the wall and without activating the bumpers. These colli-sions are unlikely to harm the user or environment because the wheelchair’s speed is low and the user retains control of the wheelchair.
• Type II collision: Collision in which a cardboard tube was displaced by 2 to 14 in. These collisions may harm the environment but are unlikely to harm the user or the wheelchair.
• Type III collision: Collision in which a cardboard tube was displaced by more than 14 in. or fell over. These collisions may harm the user, the wheelchair, or the environment in real-world situations because the wheelchair’s speed is high and the user does not have complete control of the wheelchair.
NASA-TLXThe NASA-TLX is a self-reported, survey-based,
validated, multidimensional rating procedure [22,24–25]. The NASA-TLX produces a total workload (TLX-TWL) score based on a weighted average of ratings on six sub-scales: Effort (TLX-E), Frustration (TLX-F), Performance(TLX-P), Mental Demand (TLX-MD), Physical Demand (TLX-PD), and Temporal Demand (TLX-TD). Each item

882
JRRD, Volume 47, Number 9, 2010
is measured on a scale from 0 to 7, where 0 is the lowest possible score.
Specific Aims and HypothesesThe purpose of this study was to determine whether
the DSS provides effective independent mobility to non-disabled individuals simulating the condition of people with visual and mobility impairments.
Specific Aim 1Specific Aim 1 was to evaluate the effectiveness of
the DSS versus a cane on navigation tasks on the basis of quantitative measures. The following hypotheses were associated with Specific Aim 1: • Hypothesis Q1: Participants will have fewer collisions
when using the DSS alone or the DSS along with a cane than when using a cane alone.
• Hypothesis Q2: The average completion time for a task will be greater when participants are using the
DSS alone or the DSS along with a cane than when using a cane alone.
Specific Aim 2Specific Aim 2 was to evaluate the subjective work-
load associated with the use of the DSS alone and the DSS along with a cane on navigation tasks and compare it with the subjective workload associated with the use of a cane alone on similar navigation tasks. The following hypotheses were associated with Specific Aim 2:
• Hypothesis S1: Perceived physical demand in a given navigation task will be lower when participants are using the DSS alone or the DSS along with a cane than when using a cane alone.
• Hypothesis S2: Perceived mental demand will be lower when participants are using the DSS alone or the DSS along with a cane than when using a cane alone.
Figure 2.Obstacle courses used in study.
883
SHARMA et al. Navigation assistance system for power wheelchairs
• Hypothesis S3: Frustration when participants are using the DSS alone or the DSS along with a cane will be lower than when using a cane alone.
• Hypothesis S4: Perceived effort when participants are using the DSS alone or the DSS along with a cane will be lower than when using a cane alone.
• Hypothesis S5: Work load when participants are using the DSS alone or the DSS along with a cane will be lower than when using a cane alone.
Data AnalysisAll analyses were performed with SPSS version 14.0
(SPSS Inc; Chicago, Illinois). The Shapiro-Wilk test was used to check the normality of each dependent variable. If the Shapiro-Wilk statistic was greater than 0.01, data were considered normally distributed. A general linear model repeated-measures analysis of variance was used for analy-ses of normally distributed dependent variables, with the significance level set at p < 0.05. Pairwise comparisons were performed with a standard t-test with a Bonferroni adjustment for multiple comparisons. Data that were not normally distributed were analyzed with use of nonpara-metric tests for related samples. Friedman’s test was used to compare the underlying distributions across all three experimental conditions, with the significance level set at p < 0.05. Pairwise comparisons between conditions were performed with use of the Wilcoxon Signed Ranks test with a significance level set at p < 0.05.
RESULTS
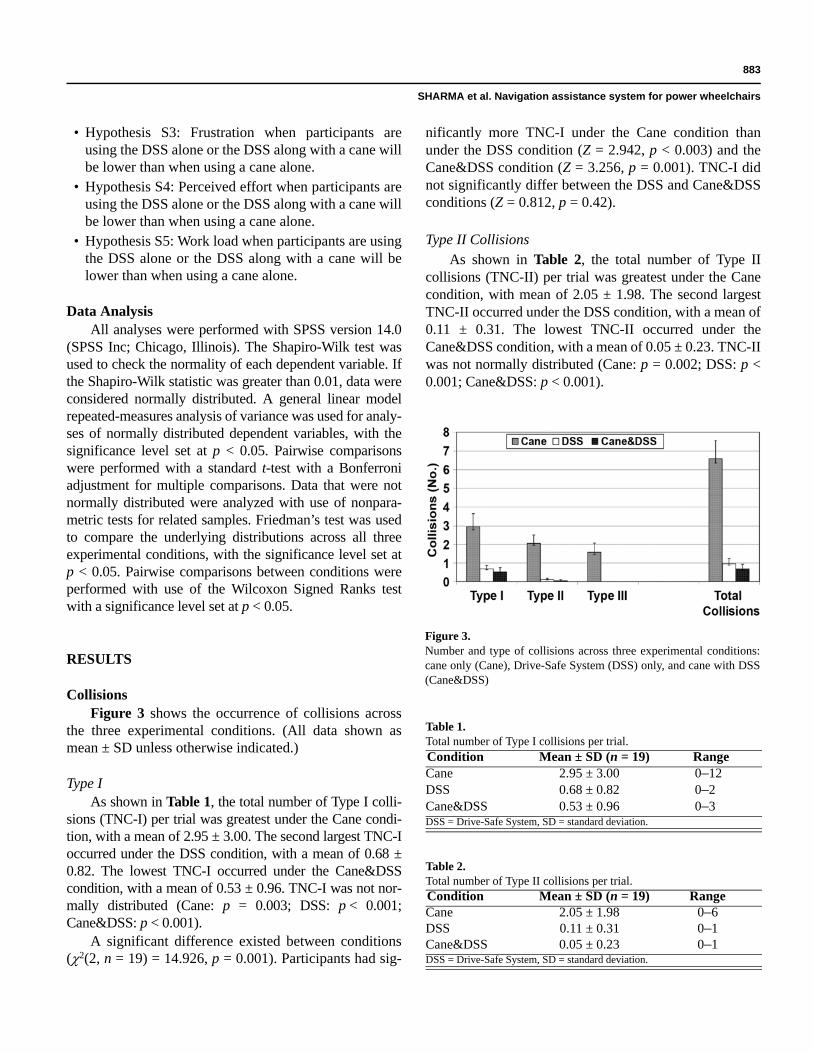
CollisionsFigure 3 shows the occurrence of collisions across
the three experimental conditions. (All data shown as mean ± SD unless otherwise indicated.)
Type IAs shown in Table 1, the total number of Type I colli-
sions (TNC-I) per trial was greatest under the Cane condi-tion, with a mean of 2.95 ± 3.00. The second largest TNC-I occurred under the DSS condition, with a mean of 0.68 ± 0.82. The lowest TNC-I occurred under the Cane&DSS condition, with a mean of 0.53 ± 0.96. TNC-I was not nor-mally distributed (Cane: p = 0.003; DSS: p < 0.001; Cane&DSS: p < 0.001).
A significant difference existed between conditions (2(2, n = 19) = 14.926, p = 0.001). Participants had sig-
nificantly more TNC-I under the Cane condition than under the DSS condition (Z = 2.942, p < 0.003) and the Cane&DSS condition (Z = 3.256, p = 0.001). TNC-I did not significantly differ between the DSS and Cane&DSS conditions (Z = 0.812, p = 0.42).
Type II CollisionsAs shown in Table 2, the total number of Type II
collisions (TNC-II) per trial was greatest under the Cane condition, with mean of 2.05 ± 1.98. The second largest TNC-II occurred under the DSS condition, with a mean of 0.11 ± 0.31. The lowest TNC-II occurred under the Cane&DSS condition, with a mean of 0.05 ± 0.23. TNC-II was not normally distributed (Cane: p = 0.002; DSS: p < 0.001; Cane&DSS: p < 0.001).
Table 1.Total number of Type I collisions per trial.Condition Mean ± SD (n = 19) RangeCane 2.95 ± 3.00 0–12DSS 0.68 ± 0.82 0–2Cane&DSS 0.53 ± 0.96 0–3DSS = Drive-Safe System, SD = standard deviation.
Table 2.Total number of Type II collisions per trial.Condition Mean ± SD (n = 19) RangeCane 2.05 ± 1.98 0–6DSS 0.11 ± 0.31 0–1Cane&DSS 0.05 ± 0.23 0–1DSS = Drive-Safe System, SD = standard deviation.
Figure 3.Number and type of collisions across three experimental conditions: cane only (Cane), Drive-Safe System (DSS) only, and cane with DSS (Cane&DSS)

884
JRRD, Volume 47, Number 9, 2010
A significant difference existed between conditions (2 (2, n = 19) = 28.167, p < 0.001). Participants had sig-nificantly more TNC-II under the Cane condition than under the DSS condition (Z = 3.455, p = 0.001) and the Cane&DSS condition (Z = 3.458, p = 0.001). TNC-II did not significantly differ between the DSS and Cane&DSS conditions (Z = –0.577, p = 0.56).
Type IIIAs shown in Table 3, the total number of Type III
collisions (TNC-III) per trial was a mean 1.56 ± 2.12 under the Cane condition, but there were no Type III col-lisions under either the DSS or Cane&DSS conditions. TNC-III was not normally distributed (Cane: p < 0.001; DSS: p < 0.001; Cane&DSS: p < 0.001).
A significant difference existed between conditions (2 (2, n = 19) = 22.00, p < 0.001). Participants had sig-nificantly more TNC-III under the Cane condition than under the Cane&DSS condition (Z = 2.965, p = 0.003) and the DSS condition (Z = 2.965, p = 0.003).
TotalAs shown in Table 4, the Cane condition had the
greatest TNC, with a mean of 6.58 ± 4.07. The DSS con-dition had the second greatest TNC, with a mean of 0.79 ± 0.85. The Cane&DSS had the lowest TNC, with a mean of 0.57 ± 0.96. TNC was normally distributed (p < 0.23) under the Cane condition but was not normally distributed under the DSS and Cane&DSS conditions (DSS: p < 0.001; Cane&DSS: p < 0.001).
A significant difference existed between conditions (2(2, n = 19) = 31.303, p < 0.001). Participants had sig-nificantly more TNC under the Cane condition than under the DSS condition (Z = –3.731, p < 0.001) and the Cane&DSS condition (Z = –3.827, p < 0.001). TNC did not significantly differ between the DSS and Cane&DSS conditions (Z = –1.221, p = 0.22).
Task Completion TimeAs shown in Table 5, mean TCT was lowest under
the Cane condition at 82.67 ± 20.91 seconds. Mean TCT was 91.53 ± 18.85 seconds under the DSS condition and was 107.24 ± 18.29 seconds under the Cane&DSS condi-tion. Mean TCT was normally distributed under all three conditions (Cane: p = 0.91; DSS: p = 0.72; Cane&DSS: p = 0.57).
A statistically significant difference in TCT existed between conditions (F[2, 36] = 9.398, p < 0.001). No dif-ference in TCT existed under the Cane condition and the
DSS condition (p = 0.46). TCT was lower under the Cane condition than under the Cane&DSS condition (p = 0.002). TCT was lower under DSS than under the Cane&DSS condition, and this difference was also statis-tically significant (p = 0.02).
NASA-TLXFigure 4 shows the subjective workload ratings
across experimental conditions.
Mental DemandAs shown in Table 6, TLX-MD was a mean of 1.89 ±
1.45 under the Cane&DSS condition, a mean of 2.22 ± 1.40 under the DSS condition, and a mean of 2.24 ± 1.90 under the Cane condition. TLX-MD was normally dis-tributed under all three conditions (Cane: p = 0.10; DSS: p = 0.02, and Cane&DSS: p = 0.02). No significant difference in TLX-MD existed between conditions (F[1.499, 26.983] = 0.415; p = 0.61).
Physical DemandAs shown in Table 7, TLX-PD was a mean of 0.22 ±
0.39 under the DSS condition, a mean of 0.53 ± 0.67 under the Cane&DSS condition, and a mean of 2.84 ±
Table 3.Number of Type III collisions per trial.Condition Mean ± SD (n = 19) RangeCane 1.56 ± 2.12 0–7DSS 0 0Cane&DSS 0 0DSS = Drive-Safe System, SD = standard deviation.
Table 4.Total number of collisions per trial.Condition Mean ± SD (n = 19) RangeCane 6.58 ± 4.07 1–16DSS 0.79 ± 0.85 0–5Cane&DSS 0.57 ± 0.96 0–3DSS = Drive-Safe System, SD = standard deviation.
Table 5.Task completion time, in seconds.Condition Mean ± SD (n = 19) RangeCane 82.67 ± 20.91 48.67–123.00DSS 91.53 ± 18.85 60.33–125.00Cane&DSS 107.24 ± 18.29 73.00–136.33DSS = Drive-Safe System, SD = standard deviation.

885
SHARMA et al. Navigation assistance system for power wheelchairs
1.85 under the Cane condition. TLX-PD was not nor-mally distributed under the Cane condition (p > 0.01) but was normally distributed under the DSS and Cane&DSS conditions (DSS: p < 0.001; Cane&DSS: p < 0.001).
A significant difference existed between conditions (2 (2, n = 19) = 32.21, p < 0.001). TLX-PD was signifi-cantly greater under the Cane condition than under the DSS condition (Z = 3.823, p < 0.001) and the Cane&DSS condition (Z = 3.825, p < 0.001). TLX-PD was signifi-cantly greater under the Cane&DSS condition than under the DSS condition (Z = 2.137, p = 0.03).
Temporal DemandAs shown in Table 8, TLX-TD was a mean of 1.26 ±
1.58 under the Cane condition, a mean of 1.37 ± 0.85 under the Cane&DSS condition, and a mean of 1.80 ±
Table 6.NASA-TLX Mental Demand subscale score.Condition Mean ± SD (n = 19) RangeCane 2.24 ± 1.90 0–5.67DSS 2.22 ± 1.40 0–5.00Cane&DSS 1.89 ± 1.45 0–5.33DSS = Drive-Safe System, NASA-TLX = National Aeronautics and Space Administration-Task Load Index, SD = standard deviation.
Table 7.NASA-TLX Physical Demand subscale score.Condition Mean ± SD (n = 19) RangeCane 2.84 ± 1.85 0.40–6.67DSS 0.22 ± 0.39 0–1.20Cane&DSS 0.53 ± 0.67 0–2.40DSS = Drive-Safe System, NASA-TLX = National Aeronautics and Space Administration-Task Load Index, SD = standard deviation. Table 8.
NASA-TLX Temporal Demand subscale score.Condition Mean ± SD (n = 19) RangeCane 1.26 ± 1.58 0–5.07DSS 1.80 ± 1.22 0.27–5.00Cane&DSS 1.37 ± 0.85 0.13–2.60DSS = Drive-Safe System, NASA-TLX = National Aeronautics and Space Administration–Task Load Index, SD = standard deviation.
Figure 4.National Aeronautics and Space Administration-Task Load Index subtest scores across three experimental conditions: cane only (Cane), Drive-Safe System (DSS) only, and cane with DSS (Cane&DSS).

886
JRRD, Volume 47, Number 9, 2010
1.22 under the DSS condition. TLX-TD was not nor-mally distributed under the Cane condition (p = 0.001) but was normally distributed under the DSS and Cane&DSS conditions (DSS: p = 0.04; Cane&DSS: p = 0.10). A significant difference did not exist between con-ditions (2 (2, n = 19) = 1.38, p = 0.50).
PerformanceAs shown in Table 9, TLX-P was a mean of 1.38 ±
1.05 under the DSS condition, a mean of 1.60 ± 1.72 under the Cane&DSS condition, and a mean of 1.69 ± 1.66 under the Cane condition. TLX-P was normally dis-tributed under the Cane&DSS condition (p = 0.06) but was not normally distributed under the Cane or DSS con-ditions (Cane: p = 0.02; DSS: p < 0.001). A significant difference did not exist between conditions (2 (2, n = 19) =1.562, p = 0.46).
Perceived EffortAs shown in Table 10, TLX-E was a mean of 1.04 ±
0.88 under the DSS condition, a mean of 1.60 ± 1.12 under the Cane&DSS condition, and a mean of 3.62 ± 1.60 under the Cane condition. TLX-E was normally dis-tributed under the Cane condition (p = 0.54) but was not normally distributed under DSS or Cane&DSS (DSS: p = 0.001, Cane&DSS: p = 0.007). A significant difference existed between conditions (2(2, n = 19) = 26.493, p < 0.001). TLX-E was significantly greater under the Cane condition than under the DSS condition (Z = 3.784, p < 0.001) and the Cane&DSS condition (Z = 3.583, p < 0.001). TLX-E under the Cane&DSS condition was sig-nificantly greater than under the DSS condition (Z = 2.096, p = 0.04).
FrustrationAs shown in Table 11, TLX-F was a mean of 0.45 ±
0.64 under the DSS condition, a mean of 0.53 ± 1.04 under the Cane&DSS condition, and a mean of 1.53 ± 1.60 under the Cane condition. TLX-F was normally dis-tributed under the Cane condition (p = 0.11) but was not normally distributed under DSS or Cane&DSS (DSS: p < 0.001; Cane&DSS: p < 0.001). A significant difference existed between conditions (2 (2, n = 19) = 10.226, p = 0.006). TLX-F was significantly higher under the Cane condition than under the DSS condition (Z = 2.536, p = 0.01) and the Cane&DSS condition (Z = 2.446, p = 0.01). TLX-F under the Cane&DSS and DSS conditions was not significantly different (Z = 2.051, p = 0.96).
Total WorkloadAs shown in Table 12, TLX-TWL was a mean of
7.12 ± 2.84 under the Cane&DSS condition, a mean of 7.52 ± 3.82 under the DSS condition, and a mean of 13.17 ± 3.88 under the Cane condition. The maximum possible value of the TLX-TWL was 21. TLX-TWL was normally distributed under all three experimental condi-tions (Cane: p = 0.21; DSS: p = 0.12; Cane&DSS: p = 0.03).
A significant difference existed between conditions (F[1.453, 25.157] = 28.242, p < 0.001). TLX-TWL was significantly higher under the Cane condition than the DSS condition (p < 0.001) and the Cane&DSS condition
Table 9.NASA-TLX Performance subscale score.Condition Mean ± SD (n = 19) RangeCane 1.69 ± 1.66 0–5.33DSS 1.38 ± 1.05 0–3.47Cane&DSS 1.60 ± 1.72 0.13–6.67DSS = Drive-Safe System, NASA-TLX = National Aeronautics and Space Administration–Task Load Index, SD = standard deviation.
Table 10.NASA-TLX Effort subscale score.Condition Mean ± SD (n = 19) RangeCane 3.62 ± 1.60 1.33–7.00DSS 1.04 ± 0.88 0.27–3.47Cane&DSS 1.60 ± 1.12 0.27–4.66DSS = Drive-Safe System, NASA-TLX = National Aeronautics and Space Administration–Task Load Index, SD = standard deviation.
Table 11.NASA-TLX Frustration subscale score.Condition Mean ± SD (n = 19) RangeCane 1.53 ± 1.60 0–5.33DSS 0.45 ± 0.64 0–2.20Cane&DSS 0.53 ± 1.04 0–3.80DSS = Drive-Safe System, NASA-TLX = National Aeronautics and Space Administration–Task Load Index, SD = standard deviation.
Table 12.NASA-TLX total workload score.Condition Mean ± SD (n = 19) RangeCane 13.17 ± 3.88 7.47–19.60DSS 7.52 ± 3.82 3.20–16.47Cane&DSS 7.12 ± 2.84 3.33–12.20DSS = Drive-Safe System, NASA-TLX = National Aeronautics and Space Administration–Task Load Index, SD = standard deviation.

887
SHARMA et al. Navigation assistance system for power wheelchairs
(p < 0.001). TLX-TWL was higher under the DSS condi-tion than under the Cane&DSS condition but this differ-ence was not statistically significant (p = 0.95).
DISCUSSION
CollisionsIn keeping with Hypothesis Q1, participants had sig-
nificantly more collisions when using just the cane than when using the DSS alone or the DSS along with the cane. The DSS reduced the number and severity of colli-sions; nearly all collisions that occurred when the DSS was active were of the lowest severity (Type I collision). The more severe collisions (most Type II and all Type III collisions) occurred when participants were using the cane alone. Type III collisions were prevented when par-ticipants used DSS because the sensors were able to slow or stop the chair before a collision occurred.
Most of the collisions when participants were using the cane alone occurred primarily because participants could not maintain coordination between the wheelchair speed and the rate of obstacle scanning with the cane; even after detecting the obstacles, participants had diffi-culty bringing the wheelchair to a stop or changing direc-tion in time to avoid a collision. Second, participants did not have an adequate understanding of the wheelchair’s size and dynamics. Third, participants’ scanning cover-age was not wide enough to detect the obstacles in the corners of the wheelchair.
When participants were using DSS alone or in com-bination with the cane, collisions occurred primarily because the sensor stop threshold was not appropriate in some sectors around the wheelchair. In addition, the DSS was unable to detect the obstacles in a “blind spot” behind the wheelchair.
Task Completion TimeAs hypothesized (Hypothesis Q2), TCT was lowest
when participants were using the cane alone. However, this performance was achieved at the expense of hitting significantly more obstacles (Figure 5). TCT was increased when participants were using the DSS because the speed of the wheelchair was reduced in the presence of obstacles around the wheelchair to avoid collisions, so participants took more time to complete the trial. The DSS architecture has 25 commercially available, low-price MaxSonar EZ series UR sensors operating at a 42 KHz
ping frequency. A given UR sensor is unable to differenti-ate between incoming ultrasound waves from itself and from other UR sensors because all of them operate on the same ping frequency. This phenomenon of an emitted ultrasound wave from one UR sensor being picked up by another UR sensor is called “UR crosstalk.” In the DSS architecture, the UR sensors’ ranging pattern is designed to minimize the crosstalk but occasionally the DSS expe-rienced crosstalk because of ultrasound reflections from certain obstacle geometries. UR crosstalk sometimes resulted in the reporting of false-positive obstacles and caused the wheelchair to stop unnecessarily, which added more time. TCT was greater when participants were using the cane and DSS together than when using DSS alone because of the additional time added by retrieving the cane, scanning the environment, and stowing the cane, even though this allowed participants to navigate around obstacles with fewer joystick maneuvers.
In a survey of wheelchair users and healthcare pro-fessionals [26], the 30 power wheelchair users rated colli-sion avoidance as the most important factor in wheelchair maneuverability, while time to complete a task was ranked fourth. Thus, even though TCT was faster when participants were using the cane alone, using DSS for navigation will likely provide a more satisfying user experience because of the decrease in collisions.
Physical DemandAs hypothesized (Hypothesis S1), physical demand
was significantly higher when participants were using the cane alone. Participants felt additional physical demand when using the cane because they had to continuously scan the environment to detect obstacles and, upon detec-tion, change the direction of the wheelchair to avoid a
Figure 5.Collisions versus task completion time.

888
JRRD, Volume 47, Number 9, 2010
collision. Physical demand was reduced when partici-pants were using the cane in combination with DSS because participants relied on the DSS for collision avoidance so they did not use the cane as much in this condition as in the cane-alone condition. Lowest physical demand was felt when participants were using the DSS alone; this demand was associated with the maneuvering of the joystick.
Muscular weakness and/or neurological dysfunction are often accompanied by fatigue [27–28]. Using a cane with a wheelchair may increase the severity of the fatigue, which could interfere with ADL. The reduced physical demand associated with use of the DSS can allow users to conserve their energy for performing ADL or social and occupational responsibilities.
Mental DemandThe hypothesis that mental demand would be greater
when participants were using the cane alone (Hypothesis S2) was not supported. No significant difference existed between conditions. In addition, mental demand was not particularly high under any condition. Nondisabled par-ticipants had never used the cane or the DSS before so they had to learn to use both these devices for navigation assistance, and that may be the reason they did not expe-rience any difference in mental demand.
FrustrationAs hypothesized (Hypothesis S3), frustration was
significantly higher when participants were using the cane alone. Note, however, that frustration was still low (1.53 on a scale of 0 to 7) under the cane condition, so whether frustration was actually problematic is unclear.
Perceived EffortAs hypothesized (Hypothesis S4), effort when partic-
ipants were using the cane alone was significantly higher because participants had to exert additional physical effort while scanning the environment with the cane. Fur-ther, mental effort was involved in learning to coordinate both hands while navigating toward the target sound. Mental effort when a person is using a cane is likely to decline as he or she learns to coordinate both hands (scanning and maneuvering). Further, the physical effort component could be reduced if users were taught effi-cient environment-scanning strategies.
Total WorkloadAs hypothesized (Hypothesis S5), TLX-TWL was
significantly higher when participants were using the cane alone. In this condition, physical demand and effort were responsible for 49 percent of TLX-TWL. Further, mental demand accounted for 17 percent of TLX-TWL and frustration was responsible for 12 percent.
CONCLUSIONS
The results indicate that the DSS provided reliable sensor coverage around the wheelchair and avoided any catastrophic collisions that otherwise would have resulted in injury to the user or property damage. Nearly all the hypotheses were supported by the data. The DSS reduced the number of collisions and the severity of colli-sions but did not increase the time required to complete navigation tasks. Participants reported experiencing less physical demand and had to exert less effort in order to achieve better performance when using the DSS alone or along with a cane, compared with using a cane alone. The fact that all participants were young and nondisabled may have contributed to the relatively low workload reported for all three conditions.
Many researchers have reported on wheelchair-related incidents and injuries in institutional and noninsti-tutional wheelchair users [7–8,29]. A survey of 109 wheelchair users reported 253 incidents occurring within a 5-year period, 27 percent of which required medical visits and 19 percent of which required hospitalizations [7]. The majority of these incidents and injuries occurred with power wheelchairs but use of the DSS would reduce the number of such incidents.
Another potential use of the DSS technology is train-ing wheelchair navigation skills to the new or early-stage wheelchair user. The DSS could also be useful for teach-ing powered mobility and joystick manipulation skills to children with disabilities.
This research was conducted in a controlled labora-tory environment, which does not represent the real-world scenarios that people with disabilities encounter in their day-to-day lives. Five-foot high cylindrical tubes were used in this research as obstacles. The height and shape of these obstacles made them easily detectable by the proximity sensors, and this is likely to have enhanced the obstacle-detection performance of the DSS. The next phase of trials should involve obstacles of varying height,

889
SHARMA et al. Navigation assistance system for power wheelchairs
shapes, colors, and surface textures, which will present varying levels of detection difficulty for the proximity sensors.
Ultimately, the value of the DSS should be deter-mined by its performance with the target population in the real world. Therefore, for higher ecological validity, the evaluation process should include “field trials” in which the DSS is used by target users for extended peri-ods of time outside the laboratory. An evaluation of the DSS in real-world settings should also evaluate the users’ ability to function when using the navigation assistance from the DSS with instruments such as Functioning Everyday With a Wheelchair [30–31] or Power-Mobility Indoor Driving Assessment [32]. Further, anecdotal data obtained during the interviews will provide investigators with additional insight into specific situations that lead to system failures (collisions or software crashes), difficul-ties encountered when transporting the system, and prob-lems positioning users within the chair.
Results from this study cannot be generalized for other intended populations of the DSS because the partic-ipants recruited for this study were not disabled. Future evaluation of the DSS should be with participants from a more diverse population, e.g., aging, traumatic brain injury, spastic cerebral palsy. Potential candidates for the DSS also include those who were denied power wheel-chairs or have a history of unsafe driving and accidents.
ACKNOWLEDGMENTS
Author Contributions:Design and development of DSS: V. Sharma, E. LoPresti.
Study concept and design: V. Sharma, R. Simpson.
Acquisition of data: V. Sharma, M. Schmeler.
Statistical analysis and interpretation of data: V. Sharma.
Drafting of manuscript: V. Sharma, R. Simpson.
Revision of manuscript: V. Sharma.
Obtained funding: R. Simpson, E. LoPresti.
Technical and material support: E. LoPresti.
Study supervision: R. Simpson, E. LoPresti, M. Schmeler.
Financial Disclosures: The authors have filed a provisional patent application for the DSS technology. Dr. LoPresti is president of AT Sciences, LLC, which is involved in commercialization of the DSS.
Funding/Support: This material was based on work supported by the National Institutes of Health (grant 5R44HD040023-03) and the National Science Foundation (grant 0540865).
Additional Contributions: Tara Minkus assisted Dr. Sharma with data collection.
Institutional Review: The study protocol was approved by the insti-tutional review board of the University of Pittsburgh, and all partici-pant signed informed consent forms.
Participant Follow-Up: The authors do not plan to inform partici-pants of the publication of this study.
REFERENCES
1. Rosenbloom L. Consequences of impaired movement: A hypothesis and review. In: Holt KS, editor. Movement and child development. London (England): Heinemann Medi-cal; 1975.
2. Wright BA. Physical disability: A psychosocial approach. New York (NY): Harper & Row; 1983. DOI:10.1037/10589-000
3. Butler C. Effects of powered mobility on self-initiated behav-iors of very young children with locomotor disability. Dev Med Child Neurol. 1986;28(3):325–32. [PMID: 2941328]DOI:10.1111/j.1469-8749.1986.tb03881.x
4. Trefler E, Fitzgerald SG , Hobson DA, Bursick T, Joseph R. Outcomes of wheelchair systems intervention with residents of long-term care facilities. Assist Technol. 2004;16(1):18–27.[PMID: 15377146]
5. Brandt A, Iwarsson S, Ståhle A. Older people's use of pow-ered wheelchairs for activity and participation. J Rehabil Med. 2004;36(2):70–77. [PMID: 15180221]DOI:10.1080/16501970310017432
6. Fehr L, Langbein WE, Skaar SB. Adequacy of power wheelchair control interfaces for persons with severe dis-abilities: A clinical survey. J Rehabil Res Dev. 2000;37(3): 353–60. [PMID: 10917267]
7. Gaal RP, Rebholtz N, Hotchkiss RD, Pfaelzer PF. Wheel-chair rider injuries: Causes and consequences for wheel-chair design and selection. J Rehabil Res Dev. 1997;34(1): 58–71. [PMID: 9021626]
8. Gavin-Dreschnack D, Nelson A, Fitzgerald S, Harrow J, Sanchez-Anguiano A, Ahmed S, Powell-Cope G. Wheel-chair-related falls. J Nurs Care Qual. 2005;20(2):119–27.[PMID: 15839290]
9. Simpson R, LoPresti E, Hayashi S, Guo S, Ding D, Ammer W, Sharma V, Cooper R. A prototype power assist wheel-chair that provides for obstacle detection and avoidance for those with visual impairments. J Neuroeng Rehabil. 2005; 2:30. [PMID: 16202136]DOI:10.1186/1743-0003-2-30
10. LaPlante MP, Kaye S. Demographics and trends in wheeled mobility equipment use and accessibility in the community. Assist Technol. 2010;22(1):3–17. [PMID: 20402043]DOI:10.1080/10400430903501413
11. Erickson W, Lee C. 2007 Disability Status Report: United States. Ithaca (NY): Cornell University Rehabilitation

890
JRRD, Volume 47, Number 9, 2010
Research and Training Center on Disability Demographics and Statistics; 2008.
12. Ganoza D. Case study of a blind electric wheelchair driver. International Seating Symposium; 2009 Mar 11–15; Orlando,FL. Pittsburgh (PA): University of Pittsburgh; 2009. p. 192–93.
13. Greenbaum MG , Fernandes S, Wainapel SF. Use of a motorized wheelchair in conjunction with a guide dog for the legally blind and physically disabled. Arch Phys Med Rehabil. 1998;79(2):216–17. [PMID: 9474006]DOI:10.1016/S0003-9993(98)90302-1
14. Guiding blind people who are wheelchair users. London (England): Royal National Institute for the Blind; 2002.
15. Pranghofer M. Wheels and white canes: Tips for helping blind wheelchair users. Braille Monitor. 1996.
16. Simpson R, LoPresti E, Hayashi S, Guo S, Frisch R, Martin A, Ammer W, Ding D, Cooper R. Smart power assistance module for manual wheelchairs. Cambridge Workshop on Universal Access and Assistive Technology; 2004 Mar 22–24; Cambridge, UK. Cambridge (UK): Cambridge Univer-sity Press; 2004.
17. Simpson RC. Smart wheelchairs: A literature review.J Rehabil Res Dev. 2005;42(4):423–36. [PMID: 16320139]DOI:10.1682/JRRD.2004.08.0101
18. Simpson RC, LoPresti EF, Cooper RA. How many people would benefit from a smart wheelchair? J Rehabil Res Dev. 2008;45(1):53–71. [PMID: 18566926]DOI:10.1682/JRRD.2007.01.0015
19. Kelly D. The enhancement of mobility for individuals who are both physically and visually disabled. Proceedings of the RESNA'99 Annual Conference; 1999; Long Beach, CA. Arlington (VA): RESNA Press; 1999. p. 227–29.
20. Nisbet PD, Craig J, Odor JP, Aitken S. ‘Smart’ wheelchairs for mobility training. Technol Disabil. 1996;5:49–62.DOI:10.1016/1055-4181(96)00147-1
21. Cooper RA, Thorman T, Cooper R, Dvorznak MJ, Fitzger-ald SG , Ammer W, Song-Feng G , Boninger ML. Driving characteristics of electric powered wheelchair users: How far, fast, and often do people drive? Arch Phys Med Reha-bil. 2002;83(2):250–55. [PMID: 11833031]DOI:10.1053/apmr.2002.28020
22. Hart SG . NASA-Task Load Index (NASA-TLX); 20 years later. Proceedings of the Human Factors and Ergonomics Society Annual Meeting; Santa Monica (CA): HFES; 2006. p. 904–8.
23. Hart SG , Staveland LE. Development of NASA-TLX (Task Load Index): Results of empirical and theoretical research. In Hancock PA, Meshkati N, editors. Human mental workload. Amsterdam (the Netherlands): North Holland Press; 1988. p. 239–50.
24. Noyes JM, Bruneau DP. A self-analysis of the NASA-TLX workload measure. Ergonomics. 2007;50(4):514–19.
[PMID: 17575712]DOI:10.1080/00140130701235232
25. Xiao YM, Wang ZM, Wang MZ, Lan YJ. [The appraisal of reliability and validity of subjective workload assessment technique and NASA-Task Load Index]. Zhonghua Lao Dong Wei Sheng Zhi Ye Bing Za Zhi. 2005;23(3):178–81. Chinese. [PMID: 16124892]
26. Holliday PJ, Mihailidis A, Rolfson R, Fernie G. Under-standing and measuring powered wheelchair mobility and maneuverability. Part I. Reach in confined spaces. Disabil Rehabil. 2005;27(16):939–49. [PMID: 16096247]DOI:10.1080/09638280500052799
27. Krupp L. Fatigue is intrinsic to multiple sclerosis (MS) and is the most commonly reported symptom of the disease. Mult Scler. 2006;12(4):367–68. [PMID: 16900749]DOI:10.1191/135248506ms1373ed
28. Krupp LB, Alvarez LA, LaRocca NG, Scheinberg LC. Fatigue in multiple sclerosis. Arch Neurol. 1988;45(4):435–37.
29. Corfman TA, Cooper RA, Fitzgerald SG, Cooper R. Tips and falls during electric-powered wheelchair driving: Effects of seatbelt use, legrests, and driving speed. Arch Phys Med Rehabil. 2003;84(12):1797–1802. [PMID: 14669186]DOI:10.1016/S0003-9993(03)00467-2
30. Mills T, Holm MB, Trefler E, Schmeler M, Fitzgerald S, Boninger M. Development and consumer validation of the Functional Evaluation in a Wheelchair (FEW) instrument. Disabil Rehabil. 2002;24(1–3):38–46. [PMID: 11827153]DOI:10.1080/09638280110066334
31. Mills TL, Holm MB, Schmeler M. Test-retest reliability and cross validation of the Functioning Everyday with a Wheelchair instrument. Assist Technol. 2007;19(2):61–77.[PMID: 17727074]
32. Dawson DR, Kaiserman-Goldenstein E, Chan R, Gleason J. Power-Mobility Indoor Driving Assessment Manual (PIDA). Toronto (Canada): Department of Occupational Therapy, Sunnybrook and Women’s College Health Sci-ences Centre. 2006.
Submitted for publication February 3, 2010. Accepted in revised form June 29, 2010.
This article and any supplementary material should be cited as follows:Sharma V, Simpson R, LoPresti E, Schmeler M. Evalu-ation of semiautonomous navigation assistance system for power wheelchairs with blindfolded nondisabled indi-viduals. J Rehabil Res Dev. 2010;47(9):877–90.DOI:10.1682/JRRD.2010.02.0012