evaluation of some quality parameter of cheese produced
TRANSCRIPT

GSJ: Volume 9, Issue 10, October 2021, Online: ISSN 2320-9186
www.globalscientificjournal.com
Evaluation of Some Quality Parameter of Cheese Produced from Nigeria Dwarf Goat Milk, Cow Milk and Their Combination using Brevibacterium linens as Coagulant. * Lawal, R. Ajoke., 1 Musa, Hamisu.1, ²Adebusoye, M. Sunday and 1Haruna, U. Said
¹Department of Food Science and Technology, Federal polytechnic, Bauchi, Nigeria.
² Department of Nutrition and Dietetics, Federal Polytechnic, Bauchi, Nigeria.
*Corresponding author: [email protected]
Abstract: Brevibacterium linens come from the milk or from ripening cultures that are widely
used in the cheese industry. This study investigated the evaluation of some quality parameter of
cheese produced from Nigeria dwarf goat milk, cow milk and their combination using B.linens as
coagulant. Brevibacterium linens was isolated from samples of milk. Milks were filtered and
pasteurized at 90 ± 1 ºC for 10 min followed by direct acidification with Brevibacterium linens .
The vats were incubated at 36 oC and gel was pressed, drained, cut, salted and package. The
samples were analyzed for proximate, physicochemical properties and microbial assessment,
using standard laboratory procedures. All the cheeses produced from B. linens as coagulant was
significantly (P > 0.05) different when compared with control. The mean value for moisture
content, fat, protein, ash and energy, pH, titratable acidity, total soluble solid and percentage
yield were ranged: 43.22-52.01%, 12.33-14.01%, 17.84-19.04%, 1.18-2.35%, 56.04-
62.01%,6.25-6.85%, 0.68-0.74%, 1.14-1.18% and 24.35-28.20% respectively. There was
increase mineral content of all the cheese samples and decline in magnesium content
(4.02mg/100g) for control sample. Similarly, the average total bacteria count, fungal and fecal
coliform counts were ranged: 1.72 -2.24 104 cfu/ml, < 1.0 x10⁴ cfu/ml -0.01x10² cfu/ml and
fungal coliform were not detected in cheese produced from Nigeria dwarf goat milk. The
organoleptic property (appearance, aroma, taste, texture and overall acceptably) of cheese
produced from Brevibacterium linens as coagulant was adjudged acceptable compared with that
of control sample. Brevibacterium linens can be used the production cheese and other dairy
product.
Key words: Cheese, Coagulant, Nigeria dwarf goat milk, . Brevibacterium linens, cow milk.
GSJ: Volume 9, Issue 10, October 2021 ISSN 2320-9186 724
GSJ© 2021 www.globalscientificjournal.com

1.0 Introduction
Milk is regarded as an important food for infant and adolescent. This is due to the fact that milk
serves as a good source of nutrients. It is equally an excellent medium for microbial growth
(Akinyele, Fawole, & Akinyosoye, 1999). Milk intended for use in cheese production must be
stored at 40oC and transported to factory where it is stored in insulated silos until it is used
(FAO, 2008).
Cheese is a dairy product produced by coagulation of milk using acid or rennet, stirring and
heating the curd, draining off whey, pressing the curd. It is further ripened or cured to obtain the
final product. The essential ingredients in cheese making are milk and coagulants. Ripening or
curing of the curd is one of steps in the development of texture and flavour of cheese (Ozcan &
Kurdal, 2012). Cheese can also be made by coagulation of whole milk, skimmed milk, or full
cream milk (Bodyfelt, Tobias, & Trout, 1998). The type of coagulant used depends on type of
cheese so desired. Cheese is made most commonly from pasteurized cow milk, but the milk of
other mammals may be used, such as;goat, cow, sheep, buffalos, camels, yaks etc. In Nigeria,
milk production is mainly practiced by the Fulani nomadic people who are pastoralists involved
in the rearing of cattle and moving from one location to another in search of green pasture.
Due to lack of refrigeration facilities, the Fulani women process the surplus fresh milk into a
soft, un-ripened Cheese called “Warankasi” or “Wara” (Adetunji and Babalobi, 2011).
The shelf life of cheese varies from 4-7 days depends largely on variety. Therefore, cheese is a
form of milk that is solidified to preserve its valuable nutrients (O’ Connor, 1993). The principle
of cheese processing is based on the coagulation of the protein in milk; during which about 90%
of the milk fat is entrapped (Ogunlade et al., 2019).The coagulated mass is the curd; while the
remaining liquid is called whey (Ogunlade et al., 2019). Curd (cheese) consists mainly of milk
proteins (casein) and milk fat; while whey mainly contains water, milk sugar (lactose), protein
(serum proteins) and B vitamins (O’Connor, 1993).
One of the key ingredients in cheese making is coagulant and rennin which serves as
coagulants from animal origin is the commonest coagulant used (Roseiro et al., 2003). To large
extent, the yield and quality of cheese is determined by the quality of milk and the type of
coagulants used, and several plant coagulant such as Cynara cardunculus, sun flower, Moringa
extract, pineapple,papaya, Calotropis procera (Sodom apple) and so on, have been used to clot
milk (Aworth and Muller,1987). In recent development, it has been observed that milk
coagulants of plant origin have over-ridden the use animal rennin. The reason being that animal
rennin may be limited for diet (vegetarianism), religious reasons (Judaism),or being genetically
GSJ: Volume 9, Issue 10, October 2021 ISSN 2320-9186 725
GSJ© 2021 www.globalscientificjournal.com

engineer food, of which the Germans and Dutch for example, forbid the use of recombinant calf
rennin (Roseiro et al., 2003).
Brevibacterium linens has long been recognized as an important dairy microorganism because of
its ubiquitous presence on the surface of a variety of smear surface-ripened cheese such as
Limburger, Munster, Brick, Tilsiter and Appenzeller (Motta and Brandelli, 2008). The growth of
B.linens on the surface is thought to be an essential prerequisite for the development of the
characteristic colour, flavor and aroma of smear surface-ripened cheeses (Ades and Cone, 2009).
Brevibacterium are of interest to the food industry because they produce amino acids such as
glutamic acid which is of use in the production of flavour enhancer such as monosodium
glutamate. They also produce important enzymes used in cheese ripening. Brevibacterium linens
is the type strain and has a growth temperature range of 8–37 °C and an optimum of 21–23 °C
(Motta and Brandelli, 2008). Brevibacterium have also been isolated from wheat samples
(Rattray and Fox 1999).B.linens produces red or orange or purple-coloured pigment of aromatic
carotenoide type which are not common in other bacteria. This alcalophilic bacterium is able to
produce methanethiol fromL-methionine and tolerate a high NaCl concentration up to 15%,
B.linens produces antimicrobial substances which inhibits the growth many gram positive food
poisoning bacteria as well as several yeasts and moulds. B.linens synthesizes highly active and
multiple proteolytic enzymes during its growth. In acceleration of cheese ripening process, it is
possible to improve flavor and eliminate bitterness with the use of enzymes (peptide) from
B.linens alone or in combination with commercially available enzymes (Motta and Brandelli,
2008). The contribution of Brevibacterium towards cheese production has been under
investigation for some time, showing that it can break down lipids and proteins (i.e. casein) with
the use of extracellular proteases and lipases, ( Rattray and Fox, (1999), Ozturkoglu-Budak et al.,
2016) . Many Brevibacterium isolates also have the ability to modify sulfur-containing amino
acids to produce volatile sulfur compounds which are important for flavor development,
(Amarita et al., 2004, Yvon et al., 2000, Bonnarme, Psoni and Spinnler, (2000)). Brevibacterium
strains are thus often used as surface-ripening cultures in many different cheese types,
(Bockelmann et al., 2005). Understanding the functional potential of cheese bacteria is essential
in the combined effort with cheese producers to shorten ripening times, reduce spoilage, better
control cheese aroma, and increase food safety. Therefore, this study aimed to investigate the
evaluation of some quality parameter of cheese produced from Nigeria dwarf goat, cow milk and
their combination using B.linens as coagulant.
GSJ: Volume 9, Issue 10, October 2021 ISSN 2320-9186 726
GSJ© 2021 www.globalscientificjournal.com
2.0 Materials and Methods
2.1 Source of Milk
Fresh Nigeria dwarf goat milk and cow milk were purchased from National Veterinary Research
Institute (Vom) in division of Animal Health and Production Technology, (AHPT), Jos Plateau
State, Nigeria. Milk samples were then kept in an ice box immediately after collection. The
sample of cheese used as control was purchased from food chemical shop in Jos metropolis.
2.2Isolation of Brevibacterium linens from milk sample
Brevibactrium linens were isolated and characterized from milk samples. Prior to isolation of
Brevibacterium linens, 5ml of each milk samples (goat and cow milks) were weighed and
thawed in the dark at 4oC. The smear were collected from milk samples, by scraping the surface
of the milk and weighed. The culture was grown in 250ml Erlenmeyer flask containing 50ml of a
medium composed of 20g/L D-glucose (Carloerba, London), 5g/L casamino acids (Difco), 1g/L
yeast extracts (Biokar), 5g/L NaCl and 1g/L KH2PO4. The pH was adjusted to 6.9 and the
medium was sterilized at 121oC for 15minutes and incubated at 25oC for 48hours with stirring
(150rpm) to oxygenate the medium (Galaup et al., 2005).
2.3Sample preparation
2.3.1Production of cheese
Three different cheese types were made from two samples of fresh milk: CCM (cheese made
from cow’s milk), CGM (cheese made from goat’s milk) and CCGM (cheese made from cow’s
milk and goat’s milk, 1:1 ratio, L:L). The cheeses were produced using the method described by
Adetunji and Babatobi, (2011). 500ml of each sample of milks were filtered and pasteurized at
90 ± 1 ºC for 10 min followed by direct acidifying/inoculating with 10ml/l Brevibacterium
linens .The vats were incubated at 36 oC until a firm curd was formed (approximately 40 min).
The obtained gel was allowed to drain, press, gently cut into cubes, salted in brine (12 g/L NaCl),
placed in perforated rectangular containers (approximate capacity of 250 g) and maintained at 10 oC under pressure for 4 h and vacuum packaged. The cheese obtained after storage at 10 oC for
24h was regarded as the final product.
GSJ: Volume 9, Issue 10, October 2021 ISSN 2320-9186 727
GSJ© 2021 www.globalscientificjournal.com

Goat milk Cow milk Mixture (Goat milk and Cow milk 1:1)
Filtration
Pasteurization (90 ± 1 ºC for 10 min)
Acidification (10ml/l) with Brevibacterium linens
Incubation (36oC for 40min)
Removal of whey (muslin cloth)
Pressing and Cutting (cube)
Salting in Brine (NaCL)
Package in Vacuum (10 oC)
GSJ: Volume 9, Issue 10, October 2021 ISSN 2320-9186 728
GSJ© 2021 www.globalscientificjournal.com

Figure 1: flowchart for the production of goat milk, cow milk and their mixture cheese.
2.4 Determination of proximate composition of milk and cheese samples
The moisture, crude protein, crude fat and total ash contents of the milk and cheese samples were
determined according to the standard methods of AOAC (2012). The carbohydrate content was
determined as shown below:
% Carbohydrate = 100% ̶ (% moisture + %protein + % fat + % ash), (Akume et al., 2019).
2.5 Determination of Physicochemical properties of cheese
2.51Total Titratable Acidity (TTA)
Total titratable acidity was determined using the AOAC (2005) method. About 10 g of the
sample was dissolved in 30 ml of distilled water in a beaker and stirred. The mixture was filtered
into 100 ml standard volumetric flask. The filtrate was made up to 100 ml. A 10 ml sample of the
filtrate was pipetted into a beaker and 1 drop of phenolphthalein was added. The mixture was
titrated against standard 0.01 N Sodium Hydroxide solutions until light pink color was attained.
The reading of the burette was recorded.
TTA = N( NaOH) x titre value x lactic acid value x dilution factor x 100
10
Where N = Normality of NaOH (0.01)
Lactic acid value = 0.09
Dilution factor = 10
2.5.2 pH Determination
pH was determined using pH meter (Unicam 9450, Cambridge, UK). About 1.0g of the cheese
was dissolved in beaker containing 10 ml of distilled water and stirred. The electrode of the pH
meter was dipped into the beaker and readings were obtained from the photo-detector on the pH
metre.
2.5.3 Total Soluble Solids
This was determined using the AOAC (2005) method. A clean glass dish was dried in an oven
(103-105 oC) until constant weight was achieved, cooled in a desiccators and weighed. About 2.0
g was dissolved in 50 ml distilled water. About 20 ml of filtered water sample was evaporated on
a water bath at temperature 90 oC followed by oven drying at temperature 103 oC- 105 oC for
about an hour. The glass was cooled in desiccators, reweighed and the increased weigh recorded.
GSJ: Volume 9, Issue 10, October 2021 ISSN 2320-9186 729
GSJ© 2021 www.globalscientificjournal.com
2.54 Determination of Percentage Yield
Percentage yield of cheese was determined by method described by Igyor, Igbian, and Iorbo
(2006). The yield of cheese from Nigeria dwarf goat milk; cow milk and goat milk and cow
milk blends was determined by the calculation as follows:
Yield of Cheese (%) = W2 x 100%
W1
W1 = Weight (g), goat milk, cow milk and cow-goat milk blend.
W2 = Weight (g), cheese produced.
2.5.5 Mineral Determination
The analysis of minerals was done according to the AOAC (2005) procedures. The quantitative
determinations of minerals (P, K, Na, Mg and Ca) were done using beam atomic absorption
spectrometer (Model S-929, Systonic, India). Working standards was used to establish
calibration curve for each of the element to be determined. About 2.0 g of the sample was
accurately weighed in a clean dry crucible. This was then transferred to hot plate in a fume
cupboard and charred to burn off all the organic material until no more smoke was given off. It
was then transferred using a pair of tongs into the muffle furnace at a temperature of 500 oC until
it was fully ashed for 8 h. The sample (ash) was leached with 5 ml of 6 M HCI into a 100 ml
volumetric flask and the volume was made up to 20 cm3 with distilled water. Also, the blank
determination was carried out in a similar procedures described above, except for the omission of
sample. The solution was then filtered through a What man No.1 filter paper and transferred into
the AAS auto sampler vial for analysis of Calcium (Ca) Magnesium (Mg), Phosphorus (P),
Sodium (Na) and Potassium (K).
2.6 Microbiological analysis of goat milk, cow milk and goat-cow milk mixture and control
sample.
Method of Harrigan and McCane (1976) was employed. Exactly 1.0 g of the cheese was
aseptically weighed and carefully introduced into 9 .0 ml of sterile distilled water. This was
shaken manually in order to have a homogenous suspension. 1.0 ml of this was taken and
introduced into the second tube followed with series of dilutions up to10-2 dilutions. 1ml was
taken from 10-2 dilution and pour plated on: (a) Nutrient Agar and incubated at temperature 37 oC for 48 hours; (b) MacConkey Agar was used for the enumeration of total coliform organisms
in the sample, the plates were incubated at temperature 35 oC for 48 hours; while (c) Sabouraud
GSJ: Volume 9, Issue 10, October 2021 ISSN 2320-9186 730
GSJ© 2021 www.globalscientificjournal.com
Dextrose Agar was used for the enumeration of mould and yeast in the samples. The plates were
incubated at temperature 30 oC for 24 hours for yeasts and 3 days for mould.
Microbial counts were calculated as follows. DF x N
W
Where DF = dilution factor.
N = number of colonies.
W = weight of sample used.
2.7 Sensory evaluation
Sensory evaluation was conducted using a trained panel consisting of twenty members who
are familiar with cheese. The Panelists were instructed to evaluate the coded samples for
appearance, aroma, taste, texture, and overall acceptability. Each sensory attribute was rated
on a 9- point hedonic scale (9 = like extremely and 1 = dislike extremely) (Ekanem and
Ojimehkwe, 2017).Cheese samples were served in 3-digit coded white plastics. The order of
presentation of samples to the panelists was randomized. Sensory evaluation was carried out
under controlled conditions of lighting and ventilation.
2.8 Statistical analyses
The data obtained were subjected to Analysis of Variance (ANOVA), while Duncan Multiple
range test was used to separate means where significant differences existed, data analyses was
achieved using the Statistical Package for Social Statistics (SPSS) software version 20.0. All
analyses were performed in triplicate determination.
3.0 RESULTS AND DISCUSSION
3.1Proximate composition of goat, cow and mixture of goat-cow milk samples
Table 1: Proximate composition of fresh milk samples from Goat, Cow and mixture of
Goat- cow milks
Sample % Moisture %Fat (%)Protein % Ash Energy
GTM 87.11± 0.02 4.45± 0.03 3.84 ±0.01 0.84 ± 0.01 65.45 ±0.02
CWM 87.09± 0.01 4.2 0 ±0.02 3.35 ± 0.04 0.72 ± 0.04 63.80 ± 0.01
MGC 88.71 ±0.02 3.91 ±0.02 3.62 ± 0.02 0.64 ± 0.02 68.52 ± 0.02
GTM: Nigeria dwarf Goat milk, CW: Cow milk, MGC: mixture of goat and cow milk. Values
are means ± SD of triplicate determination
Table1, show the result of the proximate composition of the milk samples from Nigeria dwarf
goat milk, cow milk and its mixture. The quality of the raw milk is the single most important
GSJ: Volume 9, Issue 10, October 2021 ISSN 2320-9186 731
GSJ© 2021 www.globalscientificjournal.com
criterion that determines the quality of the end product. The quality of the raw fresh milk in turn
is dependent on the sanitary procedures followed during the milk production and handling
(Igwegbe et al., 2015) The moisture content of the milk samples ranged from 88.7% - 86.1%,
with goat milk having the highest value. There was no significant (P < 0.05) variation between
the moisture content of milk from goat milk and cow milk samples. The moisture content for all
milk samples were within the range (87.09% - 88.71%) which correlates with results reported by
(Ladokun and Oni, 2014). High moisture content indicates high water activity which supports
microbial growth and subsequent reduction the shelf life of the milk (Ajai et al., 2012). Low
moisture content on the other hand, implies low water activity which results in reduction of
microbial growth and increased shelf life of milk (Ajai et al., 2012). The percentage of protein in
goat milk was highest followed by mixture of goat-cow milk and cow milk respectively.
Research finding of (Raynal-Ljutovac et al., 2007). Showed that goat milk contains a relatively
large amount of free amino acids particularly of non -protein amino acid taurine (obtained
biosynthetically from cysteine) at 9mg/100g. This is 20-fold more than in cow milk and this
similar to the level in human milk. The goat milk had the highest fat content followed by mixture
cow milk sample. However, goat milk is rich in short and medium- chain fat 6-10 carbon atoms,
containing up to twice as much as cow milk (Sanz Sampelayo et al., 2007). These fats have a
different metabolism to that of long- chain fat and a source of rapidly available energy,
particularly relevant for people suffering from malnutrition or fat absorption syndrome and in the
diets of pre-term babies (feeding formulas for premature infants often contain medium-chain
triacylglycerol) and elderly people (Raynal-Ljutovac et al., 2008). High fat content in food is an
indication of more total energies available (Udeozor, 2012). The ash content of the milk samples
showed significant (P>0.05) difference with goat and cow milk showing highest and lowest
values mixture of goat-cow milk respectively. Ash content in food is an indication of its total
mineral element content (Akume et al., 2019). There was significant difference (P>0.01) in the
carbohydrate content of the goat milk samples compare with cow milk, goat-cow (mixture) milk
having the highest value. Aside lactose which occurs as a major carbohydrate in cow milk, there
is also small amounts of glucose, gelatos and others. Carbohydrate contributes to the bulk of
energy found in be the milk. The calories are provided by the protein, fat and carbohydrate which
can help to meet the energy requirement. However, goat milk exhibits beneficial virtues for
individuals with certain dietetic problems, thus it is recommended traditional by physicians for
infant and others allergic to other milks. Similarly it has been used in treatment of ulcers (Kumar
et al., 2012).
GSJ: Volume 9, Issue 10, October 2021 ISSN 2320-9186 732
GSJ© 2021 www.globalscientificjournal.com
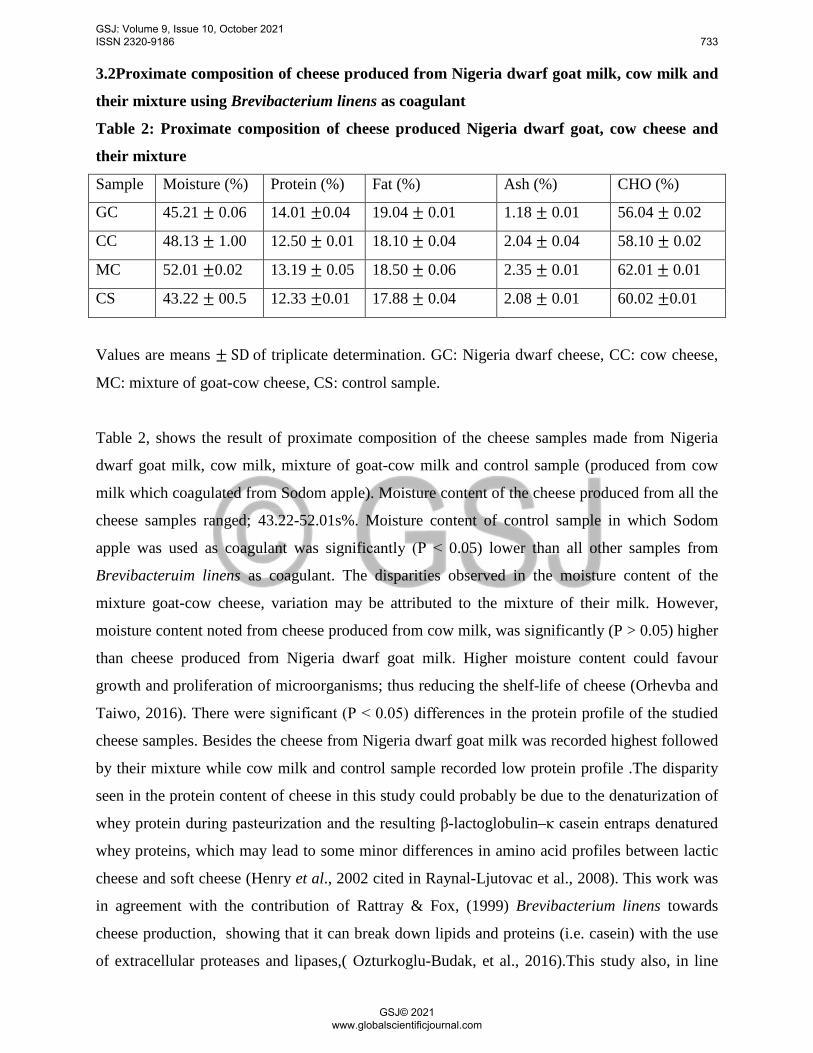
3.2Proximate composition of cheese produced from Nigeria dwarf goat milk, cow milk and
their mixture using Brevibacterium linens as coagulant
Table 2: Proximate composition of cheese produced Nigeria dwarf goat, cow cheese and
their mixture
Sample Moisture (%) Protein (%) Fat (%) Ash (%) CHO (%)
GC 45.21 ± 0.06 14.01 ±0.04 19.04 ± 0.01 1.18 ± 0.01 56.04 ± 0.02
CC 48.13 ± 1.00 12.50 ± 0.01 18.10 ± 0.04 2.04 ± 0.04 58.10 ± 0.02
MC 52.01 ±0.02 13.19 ± 0.05 18.50 ± 0.06 2.35 ± 0.01 62.01 ± 0.01
CS 43.22 ± 00.5 12.33 ±0.01 17.88 ± 0.04 2.08 ± 0.01 60.02 ±0.01
Values are means ± SD of triplicate determination. GC: Nigeria dwarf cheese, CC: cow cheese,
MC: mixture of goat-cow cheese, CS: control sample.
Table 2, shows the result of proximate composition of the cheese samples made from Nigeria
dwarf goat milk, cow milk, mixture of goat-cow milk and control sample (produced from cow
milk which coagulated from Sodom apple). Moisture content of the cheese produced from all the
cheese samples ranged; 43.22-52.01s%. Moisture content of control sample in which Sodom
apple was used as coagulant was significantly (P ˂ 0.05) lower than all other samples from
Brevibacteruim linens as coagulant. The disparities observed in the moisture content of the
mixture goat-cow cheese, variation may be attributed to the mixture of their milk. However,
moisture content noted from cheese produced from cow milk, was significantly (P > 0.05) higher
than cheese produced from Nigeria dwarf goat milk. Higher moisture content could favour
growth and proliferation of microorganisms; thus reducing the shelf-life of cheese (Orhevba and
Taiwo, 2016). There were significant (P ˂ 0.05) differences in the protein profile of the studied
cheese samples. Besides the cheese from Nigeria dwarf goat milk was recorded highest followed
by their mixture while cow milk and control sample recorded low protein profile .The disparity
seen in the protein content of cheese in this study could probably be due to the denaturization of
whey protein during pasteurization and the resulting β-lactoglobulin–κ casein entraps denatured
whey proteins, which may lead to some minor differences in amino acid profiles between lactic
cheese and soft cheese (Henry et al., 2002 cited in Raynal-Ljutovac et al., 2008). This work was
in agreement with the contribution of Rattray & Fox, (1999) Brevibacterium linens towards
cheese production, showing that it can break down lipids and proteins (i.e. casein) with the use
of extracellular proteases and lipases,( Ozturkoglu-Budak, et al., 2016).This study also, in line
GSJ: Volume 9, Issue 10, October 2021 ISSN 2320-9186 733
GSJ© 2021 www.globalscientificjournal.com

with report of Henning et al., (2006) casein remains in the curd, but caseins are low in sulphur-
containing amino acids and the nutritional value of cheese protein is slightly lower than that of
total milk protein. Also, progressive breakdown of casein during ripening is reported to increase
its digestibility (Henning et al., 2006). Moreover, proteolysis induced by fermentation and
ripening increases amounts of bioactive peptides and free amino acids present in the cheese .Fat
content of Nigeria dwarf goat cheese was significantly (P > 0.05) than all other sample cheeses.
The curd contains almost 95 percent of the fat, and during cheese-making the fat is concentrated
between 6- and 12-fold, depending on cheese variety (Fox and McSweeney, 2004). Although the
content of nutritionally interesting FAs such as CLA can be increased by lipid supplementation
of the goat diet, this may be accompanied by a change in cheese flavour (Chilliard and Ferlay,
2004, Chilliard et al., 2005 and Chilliard et al., 2006a, cited in Raynal-Ljutovac et al., 2008)..
The ash content in foodstuff is a measure of mineral elements in food (Balogun et al 2016).
Cheese samples made from Nigeriadwarf goat milk was significantly (P ˂ 0.05) different in ash
content than those produced from other milk samples and the control. Carbohydrate value ranged
from 56.04 % to 62.01% among the samples, with the highest content recorded for cheese made
from mixture of goat- cow milk followed by that from control sample. Decrease in carbohydrate
content in cheese produced from Nigeria dwarf goat milk due to the lost lactose in cheese
production. Whey contains up to 94 percent of the lactose, much of which is lost in cheese
making.The remaining lactose is partially transformed into L-lactate or D-lactate (Trujilllo et al.,
1999, cited in Raynal-Ljutovac et al., 2008),or into glucose and galactose on cheese-making.
These residual carbohydrates found in fresh cheeses disappear with increasing ripening time
(Raynal-Ljutovac et al., 2008).
3.3 physicochemical properties of cheese samples
Table 3: Physicochemical properties of cheese samples
Sample pH (%) TTA (%) TSS (%) Yield (%)
GC 6.82 ± 0.06 0.68 ± 0.01 1.18 ± 0.04 24.35 ± 0.02
CC 6.85 ± 0.02 0.70 ± 0.01 1.14 ± 0.02 26.15 ± 0.02
MC 6.50 ± 0.02 0.74 ± 0.02 1.16 ±0.02 28.20 ± 0.06
CS 6.25 ±0.01 0.72 ± 0.04 1.17 ±0.04 26.02 ± 0.04
Values are means ± SD of triplicate determination. GC: Nigeria dwarf goat cheese, CC: cow
cheese, MC: mixture of goat-cow cheese, CS: control sample. TTA: Titratable acidity, TSS:
Total soluble solid.
GSJ: Volume 9, Issue 10, October 2021 ISSN 2320-9186 734
GSJ© 2021 www.globalscientificjournal.com
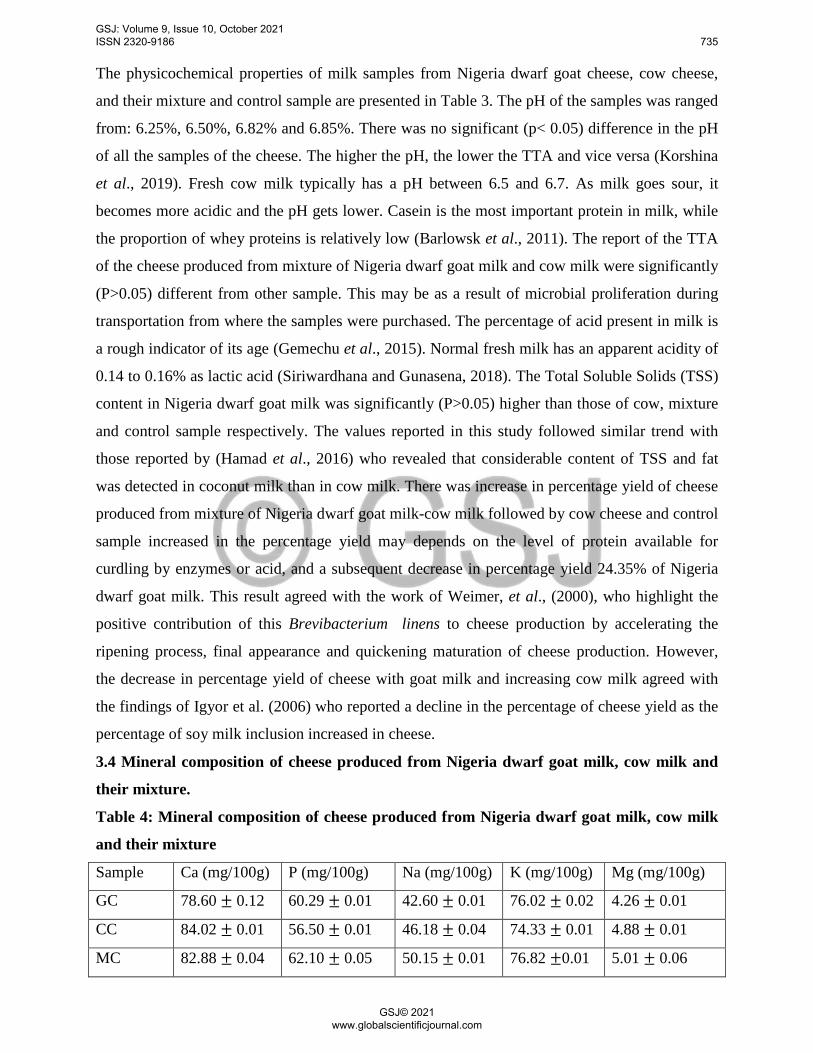
The physicochemical properties of milk samples from Nigeria dwarf goat cheese, cow cheese,
and their mixture and control sample are presented in Table 3. The pH of the samples was ranged
from: 6.25%, 6.50%, 6.82% and 6.85%. There was no significant (p< 0.05) difference in the pH
of all the samples of the cheese. The higher the pH, the lower the TTA and vice versa (Korshina
et al., 2019). Fresh cow milk typically has a pH between 6.5 and 6.7. As milk goes sour, it
becomes more acidic and the pH gets lower. Casein is the most important protein in milk, while
the proportion of whey proteins is relatively low (Barlowsk et al., 2011). The report of the TTA
of the cheese produced from mixture of Nigeria dwarf goat milk and cow milk were significantly
(P>0.05) different from other sample. This may be as a result of microbial proliferation during
transportation from where the samples were purchased. The percentage of acid present in milk is
a rough indicator of its age (Gemechu et al., 2015). Normal fresh milk has an apparent acidity of
0.14 to 0.16% as lactic acid (Siriwardhana and Gunasena, 2018). The Total Soluble Solids (TSS)
content in Nigeria dwarf goat milk was significantly (P>0.05) higher than those of cow, mixture
and control sample respectively. The values reported in this study followed similar trend with
those reported by (Hamad et al., 2016) who revealed that considerable content of TSS and fat
was detected in coconut milk than in cow milk. There was increase in percentage yield of cheese
produced from mixture of Nigeria dwarf goat milk-cow milk followed by cow cheese and control
sample increased in the percentage yield may depends on the level of protein available for
curdling by enzymes or acid, and a subsequent decrease in percentage yield 24.35% of Nigeria
dwarf goat milk. This result agreed with the work of Weimer, et al., (2000), who highlight the
positive contribution of this Brevibacterium linens to cheese production by accelerating the
ripening process, final appearance and quickening maturation of cheese production. However,
the decrease in percentage yield of cheese with goat milk and increasing cow milk agreed with
the findings of Igyor et al. (2006) who reported a decline in the percentage of cheese yield as the
percentage of soy milk inclusion increased in cheese.
3.4 Mineral composition of cheese produced from Nigeria dwarf goat milk, cow milk and
their mixture.
Table 4: Mineral composition of cheese produced from Nigeria dwarf goat milk, cow milk
and their mixture
Sample Ca (mg/100g) P (mg/100g) Na (mg/100g) K (mg/100g) Mg (mg/100g)
GC 78.60 ± 0.12 60.29 ± 0.01 42.60 ± 0.01 76.02 ± 0.02 4.26 ± 0.01
CC 84.02 ± 0.01 56.50 ± 0.01 46.18 ± 0.04 74.33 ± 0.01 4.88 ± 0.01
MC 82.88 ± 0.04 62.10 ± 0.05 50.15 ± 0.01 76.82 ±0.01 5.01 ± 0.06
GSJ: Volume 9, Issue 10, October 2021 ISSN 2320-9186 735
GSJ© 2021 www.globalscientificjournal.com

CS 80.04 ±0.04 58.01 ± 0.02 44.11 ± 0.04 72.45 ± 0.02 4.02 ± 0.01
Values are means ± SD of triplicate determination. GC: Nigeria dwarf goat cheese, CC: cow
cheese, MC: mixture of goat-cow cheese, CS: control sample. Calcium (Ca), Potassium (K),
Phosphorus (p), Sodium (Na), Magnesium (Mg).
The results of the mineral compositions of cheese produced from Nigeria dwarf goat milk, cow
milk, mixture of Nigeria dwarf goat - cow milk and control sample are presented in Table 4. The
result showed that there was significant difference (p<0.05) in mineral elements evaluated.
Mineral contents vary with cheese type. The strong decrease in pH occurring early in the
production process of some types of cheeses (during coagulation) make calcium, phosphorus and
zinc (mainly bound to caseins) soluble and these are therefore lost with the whey during draining
(Raynal-Ljutovac et al., 2008). The highest calcium value was recorded in cheese produced from
cow milk followed mixture of Nigeria dwarf goat-cow milk and control sample. Potassium and
magnesium, which are essentially soluble, also decreased as dry matter increased through
pressing or aging (Raynal-Ljutovac et al., 2008). An acid-coagulated fresh cheese like cottage
cheese contains 83 mg of calcium/100 g, compared with 720 mg/100 g in a hard cheese like
cheddar (USDA, 2009). The calcium in cottage cheese is mainly from the whey that remains
with the curd after processing. All lactic goat cheeses were found to have similar calcium
contents, showing an overall similar demineralization (Raynal-Ljutovac et al., 2008).
Magnesium concentrations in fresh lactic goat cheeses were reported to be similar to that in goat
milk, while Camembert-type cheeses were reported to contain higher quantities of magnesium
(Raynal-Ljutovac et al., 2008). However, studies on the bioavailability of minerals from cheese
have reported few differences between milk and cheese. Furthermore, few differences in the
absorption coefficient of calcium (in humans) between milk and other dairy products such as
hard cheese (Cheddar) or fresh cheeses have been reported (Gueguen and Pointillart, 2000, cited
in Raynal-Ljutovac et al., 2008).
3.5 Microbial properties of cheese produced from Nigeria dwarf goat milk, cow milk, their
mixture and control sample
Table 5: Microbial properties of cheese produced from Nigeria dwarf goat milk, cow milk,
and their mixture and control sample
Parameters TBC (cfu/ml) FCC (cfu/ml) TFC (cfu/ml)
GC 1.41 x 10⁶ NIL NIL
CC 1.82 x 10⁴ <1.0 x 10⁴ < 0.01x10²
MC 1.17 x10⁴ NIL NIL
GSJ: Volume 9, Issue 10, October 2021 ISSN 2320-9186 736
GSJ© 2021 www.globalscientificjournal.com
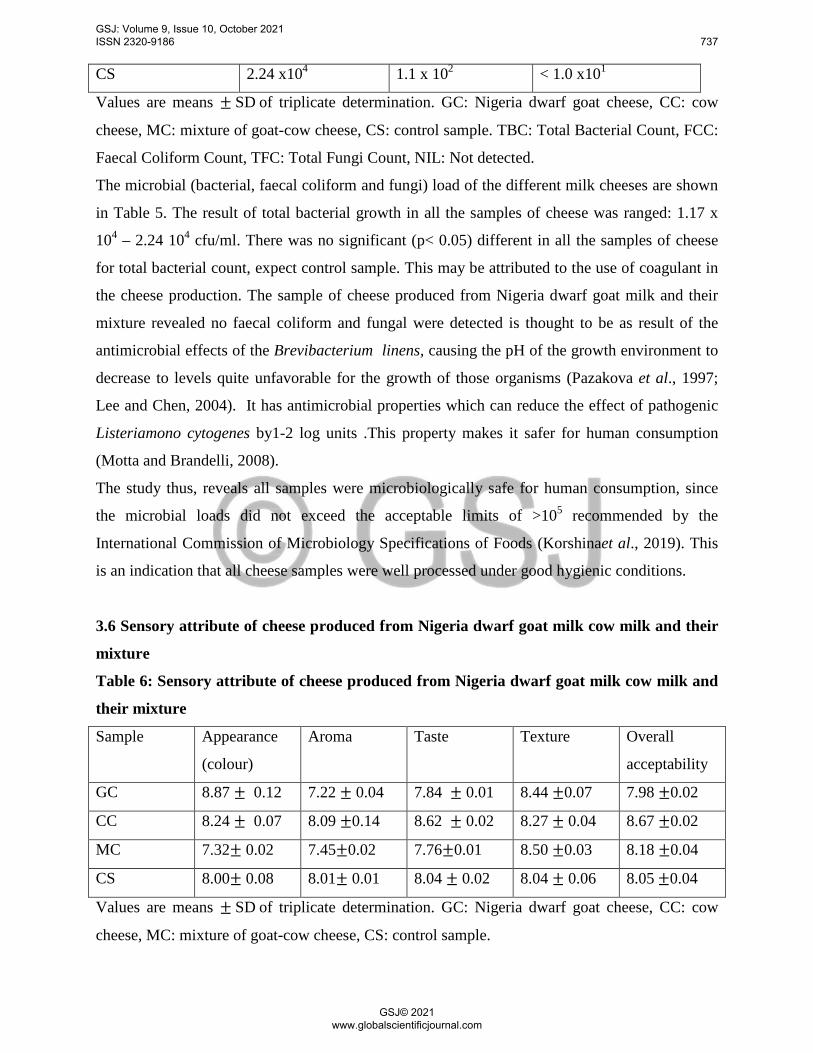
CS 2.24 x10⁴ 1.1 x 10² < 1.0 x101
Values are means ± SD of triplicate determination. GC: Nigeria dwarf goat cheese, CC: cow
cheese, MC: mixture of goat-cow cheese, CS: control sample. TBC: Total Bacterial Count, FCC:
Faecal Coliform Count, TFC: Total Fungi Count, NIL: Not detected.
The microbial (bacterial, faecal coliform and fungi) load of the different milk cheeses are shown
in Table 5. The result of total bacterial growth in all the samples of cheese was ranged: 1.17 x
104 – 2.24 104 cfu/ml. There was no significant (p< 0.05) different in all the samples of cheese
for total bacterial count, expect control sample. This may be attributed to the use of coagulant in
the cheese production. The sample of cheese produced from Nigeria dwarf goat milk and their
mixture revealed no faecal coliform and fungal were detected is thought to be as result of the
antimicrobial effects of the Brevibacterium linens, causing the pH of the growth environment to
decrease to levels quite unfavorable for the growth of those organisms (Pazakova et al., 1997;
Lee and Chen, 2004). It has antimicrobial properties which can reduce the effect of pathogenic
Listeriamono cytogenes by1-2 log units .This property makes it safer for human consumption
(Motta and Brandelli, 2008).
The study thus, reveals all samples were microbiologically safe for human consumption, since
the microbial loads did not exceed the acceptable limits of >105 recommended by the
International Commission of Microbiology Specifications of Foods (Korshinaet al., 2019). This
is an indication that all cheese samples were well processed under good hygienic conditions.
3.6 Sensory attribute of cheese produced from Nigeria dwarf goat milk cow milk and their
mixture
Table 6: Sensory attribute of cheese produced from Nigeria dwarf goat milk cow milk and
their mixture
Sample Appearance
(colour)
Aroma Taste Texture Overall
acceptability
GC 8.87 ± 0.12 7.22 ± 0.04 7.84 ± 0.01 8.44 ±0.07 7.98 ±0.02
CC 8.24 ± 0.07 8.09 ±0.14 8.62 ± 0.02 8.27 ± 0.04 8.67 ±0.02
MC 7.32± 0.02 7.45±0.02 7.76±0.01 8.50 ±0.03 8.18 ±0.04
CS 8.00± 0.08 8.01± 0.01 8.04 ± 0.02 8.04 ± 0.06 8.05 ±0.04
Values are means ± SD of triplicate determination. GC: Nigeria dwarf goat cheese, CC: cow
cheese, MC: mixture of goat-cow cheese, CS: control sample.
GSJ: Volume 9, Issue 10, October 2021 ISSN 2320-9186 737
GSJ© 2021 www.globalscientificjournal.com
Sensory assessment as judged by 20 taste panelists is presented in Table 3 as means of the
scores. The sensory attribute of cheese is a combination of the flavour, colour (appearance), taste
and texture (the mouth feel). The cheese made from Nigeria dwarf goat milk was found to be
significantly different (P > 0.05) in colour (appearance) but lower in aroma, taste and overall
acceptability (P < 0.05) to those made from cow milk, mixture of goat-cow milk and control
sample (Table 6), with average scores of 8.87 ± 0.12 – 7.42 ± 0.02 for colour; 8.09 ± 0.14 -
7.22 ± 0.04 for aroma; .8.62 ± 0.02 – 7.76 ± 0.01 for taste, 8.50 ± 0.03-8.04 ± 0.06 for texture
and 8.67±0.02- 7.98 ± 0.02 for overall acceptability respectively. The disparity seen in the result
of aroma, taste and overall acceptability in cheese produced from Nigeria dwarf goat milk, may
be attributed its’’ goaty flavor”.
4.0 Conclusion
This study has proven the potential of Brevibacterium linens, as a coagulant, which contributes
to the final appearance, flavour, colour and aroma of cheese. Many recent studies have purified
and identified Brevibacterium linens, for application in food technology, which aims to extend
food preservation time, treat pathogen disease and cancer therapy, and maintain human health.
Therefore, B linens may become a potential drug candidate for replacing antibiotics in order to
treat multiple drugs resistance pathogens in the future. Microbial communities from rinds of
surface-ripened cheeses are composed of various bacteria, yeasts and molds, which contribute to
the flavor, texture and appearance of the final products.
However, fresh Nigeria dwarf goat milk and cow milk produced under good hygienic condition
in the manufacture of acceptable cheese of excellent nutritional, microbial and sensory qualities.
Goat milk and cow milk are some of the healthiest beverages that are available today, but goat
milk is easy to digest than cow milk because of small fat globules and is naturally homogenized.
Goat milk is non allergic as compared to cow milk and it can be used in the treatment of certain
diseases. Efforts should therefore be intensified toward commercial production of cheese and
other dairy products using Brevibacterium linens, as a coagulant.
Funding: This study received no specific financial support.
Competing Interests: The authors declare that they have no
competing interests.
Acknowledgement: All authors contributed equally to the conception
and design of the study.
GSJ: Volume 9, Issue 10, October 2021 ISSN 2320-9186 738
GSJ© 2021 www.globalscientificjournal.com
Reference
Ade, G,L. Szumski, S.A. and Cone, J. F (2009). Proteolytic Activity of Brevibacterium linens
During Ripening of Trappist-Type Cheese. 52(7): 957-961.
Adetunji, V.O. and Babalobi, O.O (2011). A comparative Assessment of the Nutritional contents
of ‘Wara’ A West African soft cheese using calotropis procera and Cymbopogon citrate as
coagulants. African Journal of Food Agriculture, Nutrition and Development.
Ajai A, Ochigbo S, Ndamitso M,Olaoluwajuwon J. Proximate and mineral compositions of
different raw cow’s milks in Minna. European Journal of Applied Engineering and Scientific
Research. 2012;1:23-9.
Akinyele, B., Fawole, M., & Akinyosoye, F. (1999). Microorganisms associated with fresh cow
milk, wara, and nono; two local milk products hawked by fulani women in Ilorin, Kwara state,
Nigeria. Nigerian Food Journal, 17, 11-17.
Akume JN, Ariahu CC, Acham IO. Quality evaluation of Ready-To-Eat Garri made from
cassava mash and mango fruit mesocarp blends. Asian Food Science Journal. 2019;8:1-9.
Amarita, F. et al. (2004). Identification and functional analysis of the gene encoding methionine-
gamma-lyase in Brevibacterium linens. Appl Environ Microbiology70, 7348–7354.
AOAC. (2005). Official methods of analysis (18th ed.). Gaithersburg MD: Association of official
Analytical Chemists
AOAC. (2012). Official methods of analysis. 19th edition. Association of Official Analytical
Chemists. Washington D.C., USA.18-62.
Aworth, O.C and Muller,H.C (1987). “Cheese making properties of vegetable rennet from
Sodom apple (Calotropis procera)”, Food Chemistry Journal. 26, 71-79.
Balogun MA, Kolawole FL, Joseph J,Adebisi TT, Ogunleye OT. Effect of fortification of fresh
cow milk with coconut milk on the proximate composition and yield of warankashi, a traditional
cheese. Croatian Journal of Food Science and Technology. 2016;8:10-4.
Barłowska J, Szwajkowska M, LitwińczukZ, Król J. Nutritional value and technological
suitability of milk from various animal species used for dairy production. Comprehensive
Reviews in Food Science and Food Safety. 2011;10:291-302.
GSJ: Volume 9, Issue 10, October 2021 ISSN 2320-9186 739
GSJ© 2021 www.globalscientificjournal.com

Bockelmann, W., Willems, K. P., Neve, H. & Heller, K. H. (2005). Cultures for the ripening of
smear cheeses. Int Dairy J 15, 719–732.
Bodyfelt, F. W., Tobias, J., & Trout, G. M. (1998). The sensory evaluation of dairy products (pp.
5-8). New York: Churchill Livingston.
Bonnarme, P., Psoni, L. & Spinnler, H. E. (2000). Diversity of L-methionine catabolism
pathways in cheese-ripening bacteria. Appl Environ Microbiology 66, 5514–5517.
Chilliard, Y., Rouel, J., & Leroux, C. (2006). Goat’s a-s1 casein genotype influences its milk fatty acid
composition and D-9 desaturation ratios. Animal Feed Science and Technology, 131, 474-487.
Ekanem, G.O., Ojimelukwe, P.C (2017). Potentials of coconut milk as a substitute for cow milk in
Cheese making. Journal of Advances in Microbiology. ;4:1-9.
FAO. (2012). World Agriculture towards 2030/50. The 2012 revision by Alexandratos, N. and
Bruinsma, J. ESA 3-12.
Fox, P.F. & McSweeney, P.L.H. 2004. Cheese: an overview. In P.F. Fox, P.L.H.McSweeney, T.M.
Cogan & T.P. Guinee, eds. Cheese: chemistry, physics and microbiology, volume 1, pp. 1–18. London,
Academic Press.
Gemechu T, Beyene F, Eshetu M.Physical and chemical quality of raw cow’s milk produced and
marketedinShashemene Town, Southern Ethiopia.ISABB-Journal of Food and Agricultural Science.
2015;5:713.
Hamad MN, Ismail MM, El-Kadi SM, Shalaby ME. Chemical Composition,Sensory Evaluation, Starter
Activity and Rheological Properties of Cow and Coconut Milk. Journal of Food and Dairy Sciences.
2016;7:295-8.
Henning, D.R., Baer, R.J., Hassan, A.N. & Dave, R. 2006. Major advances in concentrated and dry milk
products, cheese, and milk fat-based spreads. J. Sci., 89(4): 1179–1188.
Igwegbe A.O,, Florence J. M, Afodia L. K , Gervase I. A ,Elizabeth C. C. and Mamudu H. B (2015).
Evaluation and acceptability of yoghurt drink processed from goat milk and a combination of goat and
cow milks. International Journal of Biotechnology and Food Science. 3(4). 41-48.
GSJ: Volume 9, Issue 10, October 2021 ISSN 2320-9186 740
GSJ© 2021 www.globalscientificjournal.com

Korshima ME, Sengev AI, Acham IO,Ahemen SA. Quality characteristics of Soymilk-fluted pumpkin
leaf based product. Asian Food Science Journal. 2019;12:1-7.
Kumar, M., Sharma, V.I., Lal, D., Kumar, A. & Seth, R. 2010. A comparison of the physico-chemical
properties of low-cholesterol ghee with standard ghee from cow and buffalo creams. Int. J. Dairy
Technol., 63(2): 252–25
Lee SM, Chen J (2004). Survival of Escherichia coli O157:H7 in set yoghurt as influenced by the
production of an exopolysaccharide, colanic acid. J. Food Prot. 67(2):252-255.
Motta.A.S and Brandelli.A (2008) Properties and antimicrobial activity of the smear surface cheese
coryneform bacterium Bervibateriumlineus. Eur. Food Res Technol 227:1299-1306
O’Connor,C.B. 1993. Traditional cheese making manual. ILCA (International Livestock Centre for
Africa ) Addis Ababa, Ethiopia.
Ogunlade AO, Oyetayo VO, Ojokoh AO.Effect of different biocoagulants on themicrobial quality and
mineral compositionof West African cheese produced from sheep milk Food Research. 2019;3:272 -9.
Orhevba BA, Taiwo AD. Comparative assessment of Wara (local Cheese) produced using three natural
additives as coagulants. Research & Reviews: Journal of Food and Dairy Technology. 2016; 4:1-7.
Ozcan, T., & Kurdal, E. (2012). The effects of using a starter culture, lipase, and protease enzymes on
ripening of mihalic cheese. International Journal of Dairy Technology, 65(4), 585-593.Available at:
https://doi.org/10.1111/j.1471-0307.2012.00868.x.
Ozturkoglu-Budak, S., Wiebenga, A., Bron, P. A. & de Vries, R. P.(2016). Protease and lipase activities
of fungal and bacterial strains derived from an artisanal raw ewe’s milk cheese. Int J Food
Microbiology 237, 17–27.
Pazakova J, Turek P, Laciakova A (1997). The survival of Staphylococcus aureus during the
fermentation and storage of yoghurt. J. Appl. Microbiol. 82(5):659-962.
Rattray, F.P. Bockelmann, W. and Fox, P.F (1999). Aspects of Enzymology and Biochemical Properties
of Brevibacterium linens Relevant to Cheese Ripening. J. Dairy Sci.82(5): 891-909.
GSJ: Volume 9, Issue 10, October 2021 ISSN 2320-9186 741
GSJ© 2021 www.globalscientificjournal.com

Raynal-Ljutovac, K., Gaborit, P., & Lauret, A. (2006). The relationship between quality criteria of goat
milk, its technological properties and the quality of the final products. Small Ruminant Research, 60,
167e177.
Raynal-Ljutovac, K., Lagriffoul, G., Paccard, P., Guillet, I., & Chilliard, Y. (2008). Composition of goat
and sheep milk products: an update. Small Ruminant Research, 79, 57e72.
Roseiro, L.B., Barbosa, M., Ames, J.M., & Wilbey, A (2003). Cheese making with vegetable
coagulants- The use of Cynara L.for the production of ovine milk cheese. International Journal of Dairy
Technology, 56,76-85.
Sanz Sampelayo, M.R., Chilliard, Y., Schmidely, P. & Boza, J. 2007. Influence of type of diet on the fat
constituents of goat and sheep milk. Small Ruminant Res., 68(1–2):42–63.
Siriwardhana B, Gunasena G.Microbiological quality of cow’s milk produced by small-scale farmers in
Lankapura, Polonnaruwa district, 2018. 19th Conference on Postgraduate Research, International
Postgraduate Research Conference Faculty of Graduate Studies, University of Kelaniya, Sri Lanka;
2018.
Udeozor LO. Tigernut-soy milk drink:preparation, proximate composition and sensory qualities.
International Journal of Food and Nutrition Science. 2012;1:18-26.
USDA. 2009. USDA national nutrient database for standard reference. Washington,DC, Agricultural
Research Service, United States Department of Agriculture. Available at: http://ndb.nal.usda.gov/.
Accessed 21 September 2012.
Weimer, B., Dias, B., Ummadi, M., Broadbent, J., Brennan, C., Jaegi, J., Johnson, M., Milani, F., Steele,
J. and Sisson, D.V. (2000). Influence of Nacl and pH on intracellular enzymes that influence
cheddar cheese ripening. Lait 77: 383-393.
GSJ: Volume 9, Issue 10, October 2021 ISSN 2320-9186 742
GSJ© 2021 www.globalscientificjournal.com