evaluation of the psychological effects of administrative...
TRANSCRIPT

i
i
One Year Longitudinal Study of the Psychological Effects of Administrative Segregation By: Maureen L. O’Keefe, M.A. Colorado Department of Corrections 2862 South Circle Drive Colorado Springs, CO 80906 (719) 226‐4364 Kelli J. Klebe, Ph.D. Alysha Stucker, B.A. Kristin Sturm, B.A. William Leggett, B.A. University of Colorado – Colorado Springs Department of Psychology 1420 Austin Bluffs Parkway Colorado Springs, CO 80918 (719) 255‐4175
Submission Date to NIJ: October 31, 2010
This project was supported by Grant No. 2006‐IJ‐CS‐0015 awarded by the Na‐tional Institute of Justice, Office of Justice Programs, U.S. Department of Justice. Points of view in this document are those of the author and do not necessarily represent the official position or policies of the US Department of Justice.
2010
Aristedes W. Zavaras Executive Director
Department of Corrections
Pamela Shockley‐Zalabak Chancellor
University of Colorado Colorado Springs

i
ACKNOWLEDGEMENTS
The research team would like to gratefully acknowledge the following individuals who served on the project’s advisory board for their significant time commitment and invaluable insights into this project:
Jamie Fellner, Esq. Human Rights Watch
Jeffrey Metzner, M.D.
University of Colorado – Denver
Joel Dvoskin, Ph.D. University of Arizona
Larry Reid, M.A.
Susan Jones, M.C.J. Joanie Shoemaker, M.B.A.
Jim Michaud, Ph.D. Elizabeth Hogan, M.D.
Colorado Department of Corrections
John Stoner, Ph.D. Colorado Department of Corrections, Retired
The researchers would also like to acknowledge the support of Mr. Aristedes Zavaras and the staff at the Department of Corrections. This project would never have been possible without the commitment and con‐tributions of management, mental health, case management, offender services, and security staff.

ii
ABSTRACT
One of the most widely debated topics in the field of corrections – the use of long‐term administrative se‐gregation (AS) – has suffered from a lack of empirical research. Critics have argued that the conditions of AS confinement exacerbate symptoms of mental illness and create mental illness where none previously ex‐isted. Empirical research has had little to offer this debate; the scant empirical research conducted to date suffers from research bias and serious methodological flaws. This study seeks to advance the literature in this regard.
This study tested three hypotheses: (1) offenders in AS would develop an array of psychological symptoms consistent with the security housing unit (SHU) syndrome, (2) offenders with and without mental illness would deteriorate over time in AS, but at a rate more rapid and extreme for the mentally ill, and (3) inmates in AS would experience greater psychological deterioration over time than the comparison groups.
Study participants included male inmates who were placed in AS and comparison inmates in the general population (GP). Placement into AS or GP conditions occurred as a function of routine prison operations. GP comparison participants included those at risk of AS placement due to their institutional behavior. Inmates in both of these study conditions (AS, GP) were divided into two groups – inmates with mental illness (MI) and with no mental illness (NMI). A third comparison group of inmates with severe mental health problems placed in San Carlos Correctional Facility, a psychiatric care prison facility, was also included. A total of 302 inmates were approached to participate in the study, and 55 refused to participate or later withdrew their consent. Participants were tested at 3‐month intervals over a yearlong period.
Standardized test data were collected through self‐report, correctional staff and clinical staff measures. Tests with demonstrated reliability and validity were selected to assess the eight primary constructs of interest: (1) anxiety, (2) cognitive impairment, (3) depression‐hopelessness, (4) hostility‐anger control, (5) hypersensitivity, (6) psychosis, (7) somatization, and (8) withdrawal‐alienation. Extensive analyses of psychometric properties revealed that inmates self‐reported psychological and cognitive symptoms in remarkably reliable and valid ways.
The results of this study were largely inconsistent with our hypotheses and the bulk of literature that indi‐cates AS is extremely detrimental to inmates with and without mental illness. Similar to other research, our study found that segregated offenders were elevated on multiple psychological and cognitive measures when compared to normative adult samples. However, elevations were present among the comparison groups too, suggesting that high degrees of psychological disturbances are not unique to the AS environ‐ment. In examining change over time patterns, there was initial improvement in psychological well‐being across all study groups, with the bulk of the improvements occurring between the first and second testing periods, followed by relative stability for the remainder of the study. Patterns indicated that the MI groups tended to be similar to one another but were significantly elevated compared to the NMI groups, regardless of their setting. Contrary to our hypothesis, offenders with mental illness did not deteriorate over time in AS at a rate more rapid and more extreme than for those without mental illness. Finally, although AS inmates in this study were found to possess traits believed to be associated with long‐term segregation, these features cannot be attributed to AS confinement because they were present at the time of placement and also oc‐curred in the comparison study groups. Implications for policy and future research are discussed.

iii
CONTENTS
Executive Summary ................................................. iv
Introduction ........................................................ iv
Purpose of Present Study .................................... iv
Method ................................................................ v
Findings ............................................................. viii
Policy Implications .............................................. ix
Introduction ............................................................. 1
Characteristics of Long‐Term Segregation ........... 1
Criticisms of the AS Model ................................... 2
Case Law Review .................................................. 3
Research Review .................................................. 5
The Colorado System ........................................... 7
Purpose of Present Study ...................................15
Method ..................................................................17
Group Assignment .............................................17
Participants ........................................................19
Materials ............................................................19
Procedures .........................................................28
Results ....................................................................31
Data Analysis Plan ..............................................31
Sampling .............................................................32
Validity of Responses .........................................36
Official Record Data .......................................... 40
Group Comparisons .......................................... 45
Normative Comparisons ................................... 46
Change over Time ............................................. 52
Predictor Analyses............................................. 75
Discussion .............................................................. 78
Limitations ......................................................... 79
Future Research ................................................ 80
Policy Implications ............................................ 81
References ............................................................ 84
Appendix A ............................................................ 91
Appendix B ............................................................ 95
Summary of Study Measures ............................ 95
Description of Individual Measures .................. 96
Normative Comparisons ................................. 125
Composite Scores ............................................ 126
Summary ......................................................... 138
Appendix B References ................................... 139
Appendix C .......................................................... 145
Prison Symptom Inventory Analyses .............. 145
Summary ......................................................... 150

iv
EXECUTIVE SUMMARY INTRODUCTION
One of the most widely debated topics in the field of corrections – the use of long‐term administrative se‐gregation (AS) – has suffered from a lack of empirical research. The placement of offenders in AS environ‐ments, particularly those with serious mental illness, has been a point of contention. Critics have argued that the conditions of AS confinement exacerbate symptoms of mental illness and create mental illness where none previously existed. The use of AS across the country has persisted as a corrections management tool despite litigation, although in many states, the placement of mentally ill into AS is no longer permitted. Empirical research has had little to offer this debate; the scant empirical research conducted to date suffers from research bias and serious methodological flaws.
Now decades after the deinstitutionalization of states’ mental health hospitals, corrections agencies have seen a surge of offenders with serious mental illness in their prisons. The rate of serious mental illness in the community is 6% (National Institute of Mental Health, 2010). Among the incarcerated, the rate of serious mental illness is tripled at about 18% (Ditton, 1999; O’Keefe & Schnell, 2008). A similar phenomenon is oc‐curring within prisons, whereby a disproportionate rate of mentally ill are found within AS, estimated to be 50% higher than the rate within the general prison population (O’Keefe, 2008a). It is not known the extent to which this difference is caused by the AS environment. Researchers have been unable to settle the ques‐tion of whether these high rates of mental illness are caused by AS relative to the general prison population or whether there is a selection bias such that offenders with mental illness, unable to adapt to general pris‐on settings, are placed in AS at higher rates. This study seeks to advance the literature in this regard.
PURPOSE OF PRESENT STUDY
The broad purpose of the project was to evaluate the psychological effects of long‐term segregation on of‐fenders, particularly those with mental illness. This study examined conditions as they existed in the Colora‐do prison system with respect to AS, using the Colorado State Penitentiary (CSP) as the AS study facility. On‐ly males were included because females represent 2% of Colorado’s AS population. We did not assign in‐mates to segregation, but studied those conditions as they naturally occurred. The following are the primary goals and hypotheses.
Goal 1: To determine which, if any, psychological domains are affected, and in which direction, by the differ‐ent prison environments. A multitude of psychological dimensions were examined, drawing from those most often cited in the literature. The broad constructs of interest were depression/hopelessness, anxiety, psy‐chosis, withdrawal and alienation, hostility and anger control, somatization, hypersensitivity, and cognitive impairment. We hypothesized that offenders in segregation would develop an array of psychological symp‐toms consistent with the security housing unit (SHU) syndrome, with elevations across the eight constructs.
Goal 2: To assess whether offenders with mental illness decompensate differentially from those without mental illness. We were particularly interested in whether long‐term segregation had a differential impact based on the presence of mental illness in offenders. We sought answers to the following questions: Does AS exacerbate symptoms in offenders with mental illness? Does AS create symptoms of mental illness in those who did not exhibit any at placement? It was hypothesized that offenders with and without mental illness would deteriorate over time, but the rate at which it occurred would be more rapid and more ex‐treme for the mentally ill.
v
Goal 3: To compare the impact of long‐term segregation against the general prison setting and a psychiatric care prison. In this study, the psychological and behavioral symptoms of offenders in AS were compared to similar offenders who were sent to San Carlos Correctional Facility (SCCF) or returned to the general prison population pursuant an AS hearing. This study used a repeated measures design over the course of a year to explore whether psychological distress was attributable to the various prison environments. It was hypothe‐sized that inmates in segregation would experience greater psychological deterioration over time than the comparison groups.
This study also included an examination of individual characteristics such as mental health status, personali‐ty, and trauma history to determine if certain factors could predict patterns of change. Prediction analyses were exploratory in nature and we did not formulate a hypothesis about the variables that might predict differential rates of psychological decompensation.
METHOD
Group Assignment
Study participants included male inmates who were placed in AS and comparison inmates in the general population (GP). Placement into AS or GP conditions occurred as a function of routine prison operations, pending the outcome of their AS hearing, without involvement of the researchers. All study participants classified to AS were waitlisted for and placed in CSP. Inmates who returned to GP following an AS hearing were assumed to be as similar as possible to AS inmates and, therefore, comprised the comparison groups. Comparison participants also included inmates targeted for a diversionary program that identified inmates at high risk of AS placement due to their disruptive behavior. This program discontinued shortly after the study commenced, hence few participants were identified through this method. Inmates in both of these study conditions (AS, GP) were divided into two groups – inmates with mental illness (MI) and with no men‐tal illness (NMI). There are fewer inmates with mental illness than without, but because both subgroups were of equal interest to this study, separate groups enabled over‐selection of inmates with mental illness.
A third comparison group was included. This group included inmates with severe mental health problems placed in SCCF. Of the inmates placed in SCCF, only those with patterns of prison misbehavior, as measured by disciplinary violations, were included in the study. The purpose of the SCCF comparison group was to study inmates with serious mental illness and behavioral problems who were managed in a psychiatric pris‐on setting.
Participants
A total of 302 male inmates were approached to participate in the study. Thirty refused to participate. Two more offenders were considered a passive refusal and were removed for inappropriate sexual behavior to‐wards the researcher during the first testing session. An additional 23 offenders later withdrew their con‐sent, although the data collected to the point of their withdrawal was used. In addition to refusals and with‐drawals, 10 inmates released prior to the end of the study due to discretionary releases by the Parole Board and one participant death.
Five testing sessions were initially established at 3‐month intervals, beginning with the date of consent and initial administration. Therefore, tests were scheduled at 3 months, 6 months, 9 months and 12 months af‐ter the baseline assessment. However, this schedule was problematic for the AS groups. When the study

vi
began, there was a 3‐month average wait for inmates to be transferred to CSP due to a shortage of AS beds. While on the waitlist, AS inmates were held in a punitive segregation bed at their originating facility. It was determined that the primary goal was to study inmates in a single long‐term segregation facility (CSP) to lim‐it confounding variables and that therefore the baseline measure should be collected upon placement into CSP. However, it was also recognized that significant changes could occur while inmates were held in segre‐gation at their originating facility. Therefore, a “pre‐baseline” measure was collected as close to the AS hear‐ing as possible, which meant that the CSP groups completed six test intervals rather than five. The time be‐tween the pre‐baseline and baseline measure varied according to how long the inmate was on the waitlist. The median time between pre and baseline tests was 99 days, although eight offenders were moved into CSP so quickly that they did not have a pre‐baseline measure. In the analyses, tests were aligned across groups according to the test number, such that the CSP groups had an additional test at the end rather than at the beginning.
Participants’ ages ranged from 17 to 59 at the time of consent, with a mean age of 31.8 (SD = 9.1). The ra‐cial/ethnic breakdown of participants was 40% white, 36% Hispanic, 19% African American, 4% Native Amer‐ican, and 1% Asian. Of the inmates with mental illness who were included in this study, 56% were identified with a serious and pervasive disorder.
Materials
Assessment tools were selected to comprehensively cover the variety of psychological constructs associated with AS (e.g., Arrigo & Bullock, 2008; Grassian, 1983; Haney, 2003). The primary constructs assessed in this study were as follows: (1) anxiety, (2) cognitive impairment, (3) depression/hopelessness, (4) hostility/anger control, (5) hypersensitivity, (6) psychosis, (7) somatization, and (8) withdrawal/alienation. Additionally, malin‐gering, self‐harm, trauma, and personality disorders were assessed.
Research materials were selected to meet the following criteria: (1) use of assessments with demonstrated reliability and validity, (2) use of multiple sources for providing information (e.g., self‐report, clinician rat‐ings, files), (3) use of multiple assessments of each construct of interest, (4) ability to use within the prison setting, and (5) ease of administration, including no specialized equipment, no physical contact, length of time, and appropriate reading level.
The 12 self‐report instruments used in this study were: (1) Beck Hopelessness Scale, (2) Brief Symptom In‐ventory, (3) Coolidge Correctional Inventory, (4) Deliberate Self‐Harm Inventory, (5) Personality Assessment Screener, (6) Prison Symptom Inventory, (7) Profile of Mood States, (8) Saint Louis University Mental Status, (9) State‐Trait Anxiety Inventory, (10) Structured Inventory of Malingered Symptomatology, (11) Trail Mak‐ing Test, and (12) Trauma Symptom Inventory.
In addition to self‐report assessments, ratings of psychological functioning were obtained from clinical staff and ratings of behavior in the housing unit were obtained from correctional staff. The Brief Psychiatric Rat‐ing Scale (BPRS) was completed by clinical staff and the Prison Behavior Rating Scale (PBRS) was completed by correctional staff.
Most assessments were collected at each testing period, although personality disorders, self‐harm, and trauma history were not. It was determined that personality and trauma history were relatively stable con‐structs that needed to be assessed only once to limit the testing burden on study participants. Also, due to

vii
the burden on already limited mental health resources, the BPRS was only administered at the first, third, and fifth testing intervals.
Data from official records were collected primarily from the Department of Corrections Information System, which is an administrative database of offender data. Offender characteristics to include demographic histo‐ry, criminal history and offense data, institutional behavior, and needs levels were electronically down‐loaded.
Certain data elements were collected only for study participants during the course of their participation in the study. The following were collected and coded for the period of time between each testing interval for each participant: the amount of time spent in various settings (e.g., segregation, GP, hospital), phone records, and mental health crisis data. Additionally, activity logs from paper files for the CSP participants were collected and coded.
Procedure
Study enrollment began July 2007 and ended March 2009, with final testing of all participants completed in March 2010. The project operated under the approval of the institutional review board at the University of Colorado at Colorado Springs.
The research team was notified of AS hearings by the case management supervisor at each facility and of SCCF placements by the clinician who scheduled the facility transfers. Notification typically occurred before the hearings or SCCF placement to give the field researcher maximal lead time. Researchers reviewed elec‐tronic records to screen inmates for study eligibility.
The field researcher was a female university employee who completed the full training academy and had a badge that permitted her unescorted access to the facilities. In advance of each visit, the researcher con‐tacted prison security to arrange visits with specific inmates. All inmates were escorted by security staff to the visiting room, which contained a noncontact booth for inmates in AS or punitive segregation conditions. The researcher met individually with each inmate to review the consent form, which included the general purpose of the study, voluntary nature of participation, risks and benefits, and remuneration. Inmates were advised that the purpose of the study was to learn about adjustment to prison and offenders in prisons across the state were participating in this study.
At the time of consent, the initial test battery was administered. The field researcher instructed participants to read the directions for each test. Instructions were highlighted by researchers when there was an indica‐tion on the test to respond with respect to a certain timeframe (e.g., in the past week). The researcher ad‐ministered the timed tests, and she assisted if they had questions, most frequently with the definition of a word. The researcher collected the test packet immediately following its completion, so it was not ever han‐dled by security staff.
The field researcher distributed the PBRS to housing staff at each testing interval and collected the com‐pleted forms upon return visits to the facility. Mental health clinicians were generally notified that a BPRS was needed a couple weeks prior to the researcher testing to give them time to complete the assessment.
Participants’ data were kept in two separate databases. The eligibility database tracked the eligible pool of offenders, such as identifying information, current location, date of AS hearing or SCCF placement, expected

viii
release date, mental health status and clinician approval, selection into study or reason for exclusion, and date of consent or refusal. A testing schedule for study participants was incorporated into the database, which also had reporting capabilities in order to manage the project. A separate database tracked partici‐pants’ responses to the standardized tests; no identifying information was included in this database other than a secure researcher‐assigned identification number. Both databases were stored on a secured server with access restricted to project researchers.
FINDINGS
The results of this study were largely inconsistent with our hypotheses and the bulk of literature that indi‐cates AS is extremely detrimental to inmates with and without mental illness. We hypothesized that inmates in segregation would experience greater psychological deterioration over time than comparison inmates, who were comprised of similar offenders confined in non‐segregation prisons. Consistent with other re‐search, our study found that segregated offenders were elevated on multiple psychological and cognitive measures when compared to normative adult samples (Haney, 2003; Suedfeld, Ramirez, Deaton, & Baker‐Brown, 1982). However, there were elevations among the comparison groups too, suggesting that high de‐grees of psychological disturbances are not unique to the AS environment. The GP NMI group was the only one that was similar to the normative group on a number of scales.
In examining change over time patterns, there was initial improvement in psychological well‐being across all study groups, with the bulk of the improvements occurring between the first and second testing periods, followed by relative stability for the remainder of the study. On only one measure – withdrawal – did of‐fenders worsen over time, but this finding was only true for the two NMI groups, so it is not attributable to AS. Even given the improvements that occurred within the study timeframe, the elevations in psychological and cognitive functioning that were evident at the start of the study remained present at the end of the study.
Another hypothesis was that offenders with mental illness would deteriorate over time in AS at a rate more rapid and more extreme than for those without mental illness. Patterns indicated that the MI groups (CSP MI, GP MI, SCCF) tended to look similar to one another but were significantly elevated compared to the NMI groups (CSP NMI, GP NMI), regardless of their setting. For the AS offenders, the MI group scored worse than the NMI group on all self‐report measures except the Trails test and all staff measures except the PBRS Anti‐Authority scale. In addition to the changes over time described above, PBRS scores decreased significantly for segregated inmates regardless of their mental health status, which would be an indicator that staff may be perceiving improvements, but the significant differences were from the first to the second assessment periods when the majority of participants changed facilities, which suggests this is perhaps a measurement error rather than a true improvement. As hypothesized there was a differential time effect for the MI and NMI groups on several composite measures (i.e., anxiety, hostility‐anger control, hypersensitivity, somatiza‐tion), but the interactions were in the opposite direction of our hypothesis; on average, the CSP NMI group did not change while the CSP MI group improved.
We stated that offenders in segregation would develop an array of psychological symptoms consistent with the SHU syndrome. As already discussed, all of the study groups, with the exception of the GP NMI group, showed symptoms that were associated with the SHU syndrome. These elevations were present from the start and were more serious for the mentally ill than non‐mentally ill. In classifying people as improving, de‐

ix
clining, or staying the same over time, the majority remained the same. There was a small percentage (7%) who worsened and a larger proportion (20%) who improved. Therefore, this study cannot attribute the presence of SHU symptoms to confinement in AS. The features of the SHU syndrome appear to describe the most disturbed offenders in prison, regardless of where they are housed. In fact, the group of offenders who were placed in a psychiatric care facility (SCCF) had the greatest degree of psychological disturbances and the greatest amount of negative change.
Finally, in this study, we conducted some exploratory predictive analyses to determine if there were individ‐ual characteristics that could identify who may be at greater risk of psychological harm from segregation. There were no individual predictors that showed strong effects for predicting change. This could indicate that we did not have the correct predictors or that patterns of decompensation are individualized (i.e., not predictable), but it is more likely that the relative stability over time makes it difficult to predict change.
A review of the findings warrants a discussion of plausible alternative explanations that might account for our results. The use of a repeated measures design enabled us to determine that change was occurring and in which direction. Even given the debate about whether or not harmful effects resulted from AS, it was never suggested that inmates might improve as this study found. The presence of comparison groups avoids an attribution error; the changes, improvements in this case (i.e., 20%), are not due to segregation. These conclusions replicate those drawn by Zinger and colleagues (2001) where there was a similar lack of evi‐dence of harm. These studies suffered criticism for high refusal rates, high attrition rates, small sample sizes, and short durations – limitations that were corrected in the present study (note, however, that no generali‐zations should be made beyond the 1 year follow‐up period in this study). Furthermore, the use of reliable and valid standardized measures enabled the present research study to assess psychological functioning in an objective manner. Although the majority of these tests were not normed for prisoner populations, the current reliability and validity findings increased our confidence in these measures.
POLICY IMPLICATIONS
Does this study legitimize the use of segregation with offenders, including those with serious and persistent mental illness? Because this study may not generalize to other prison systems, especially those that have conditions of confinement dissimilar to CSP, it is not possible to conclude that AS is not detrimental for all offenders. Systems that are more restrictive and have fewer treatment and programming resources should not generalize these findings to their prisons. Replication is needed to understand how increased services, privileges, and out of cell time ameliorate the unintended consequences of AS, and research needs to inform prison systems about the standards and practices necessary to protect inmates in segregation from harmful psychological effects.
It is also important to note that there may be other negative consequences of AS that we did not study. For example, Lovell, Johnson, and Cain (2007) found that inmates released directly from segregation to the streets had dramatically higher rates and severity of detected recidivism than AS inmates who first released to GP (but see Mears & Bales, 2009). We also did not study the degree to which AS met its purported goal of changing inmate behavior for the better over time. The only questions addressed by this study were related to psychological changes over time in segregation. Thus, we make no empirical or value judgments about whether and to what degree the use of AS balances the benefits (e.g., a safer prison system) with costs (e.g., significant reductions in freedom).

x
It is impossible to ignore the extremely disproportionate rate at which inmates with serious mental illness are assigned to AS (Lovell, 2008; Metzner & Fellner, 2010; O’Keefe, 2008a), which has to some degree “shocked the conscience” of the courts (see Jones ‘El v. Berge, 2001; Madrid v. Gomez, 1995; Ruiz v. John‐son, 1999). In an era when prisons are expected to implement evidence‐based practices and to rehabilitate offenders who will be releasing back to the community, is it enough to avoid harm? Must we ask ourselves another question: what are the conditions required to improve inmates’ mental well‐being while in segrega‐tion? Prison systems are held to a standard of treatment that is at least equivalent to community standards. It is likely that this most difficult segment of society has failed at all levels of community treatment and ear‐lier criminal justice interventions, but the quest to treat and improve services for the most needy is an im‐portant reality facing corrections agencies.
Regarding their psychological functioning and levels of distress, these data suggest, although the differences were small, that inmates with serious mental illness are less likely to improve in segregation and are less likely to get worse compared to mentally ill inmates in GP. We do not assume that the reasons for these ap‐parently contradictory findings are the same. For example, it is possible that fewer inmates with mental ill‐ness get worse because segregation is a safer and more structured environment. On the other hand, hypo‐theses regarding their unlikeliness to improve include the significant limitations that segregation places on various types of therapeutic activities and services such as group therapy. Further, the data do not tell us which aspects of AS prevent psychological improvement and deterioration, respectively, among inmates with mental illness. However, since prisons have a constitutional duty to respond to serious medical (includ‐ing psychiatric) needs, the possibility that segregation may prevent improvement is cause for concern and further study.
There remain significant implications for mental health staff who work in prison systems that permit the placement of mentally ill in long‐term segregation. It is critical for mental health staff to screen and assess offenders prior to AS placement to determine their vulnerability to harm that might occur as a result of their segregation. While in segregation, it is important that the mental status of all offenders be assessed on a frequent, regular basis through rounds and individual sessions. Prison systems need to have a range of con‐finement options, such that offenders who are at risk of or are showing signs of decompensation can be re‐moved from segregation and placed in an alternative high security environment that permits greater out of cell time and interaction with others.
Other systems have rejected confinement models that isolated offenders and held them in extremely re‐strictive spaces. Even if the segregation models of the early 1900’s and the state psychiatric hospitals of the mid‐19th century are viewed as “primitive” compared to modern‐day AS facilities, it is important to examine and understand why these models failed and were ultimately dismantled. Although there are a number of researchers who predict that there is no end in sight to the supermax model (King, 1999; Mears, 2008; Pizar‐ro & Narag, 2008; Pizarro & Stenius, 2004), they have also raised empirical questions regarding their effica‐cy. Questions about the efficacy of AS will be asked until more is known about whether the use of AS in pris‐on systems improves conditions for the rest of the system, whether and how they improve inmate behavior within and beyond the prison walls, whether they are cost‐effective, whether they increase risks to public safety, and whether there are settings or individuals that are prone to psychological deterioration.

INTRODUCTION 1
INTRODUCTION
One of the most widely debated topics in the field of corrections – the use of long‐term administrative se‐gregation (AS) – has suffered from a lack of empirical research. The placement of offenders in AS environ‐ments, particularly those with serious mental illness, has been a point of contention. Critics have argued that the conditions of AS confinement exacerbate symptoms of mental illness and create mental illness where none previously existed. The use of AS across the country has persisted as a corrections management tool despite litigation, although in many states, the placement of mentally ill into AS is no longer permitted. Empirical research has had little to offer this debate; the scant empirical research conducted to date suffers from research bias and serious methodological flaws.
Now decades after the deinstitutionalization of states’ mental health hospitals, corrections agencies have seen a surge of offenders with serious mental illness in their prisons. The rate of serious mental illness in the community is 6% (National Institute of Mental Health, 2010). Among the incarcerated, the rate of serious mental illness is tripled at about 18% (Ditton, 1999; O’Keefe & Schnell, 2008). A similar phenomenon is oc‐curring within prisons, whereby a disproportionate rate of mentally ill are found within AS, estimated to be 50% higher than the rate within the general prison population (O’Keefe, 2008a). It is not known the extent to which this difference is caused by the AS environment. Researchers have been unable to settle the ques‐tion of whether these high rates of mental illness are caused by AS relative to the general prison population or whether there is a selection bias such that offenders with mental illness, unable to adapt to general pris‐on settings, are placed in AS at higher rates. This study seeks to advance the literature in this regard.
CHARACTERISTICS OF LONG‐TERM SEGREGATION
“Supermax” is the popular term used to describe the technologically advanced, supermaximum security prisons designed for single‐cell occupancy that were rapidly being constructed across the nation during the 1990’s. Even when new construction was not possible, existing prisons were retrofitted to conform to this new model. Therefore, a supermax facility may refer to an entire facility or a distinct unit within a facility (National Institute of Corrections, 1997). Although there was a virtual explosion of supermax facilities over the past two decades, similar units have operated on a smaller scale for decades (Zinger, Wichman, & An‐drews, 2001).
The modern‐day supermax model is traced back to the U.S. Penitentiary in Marion, Illinois, that went into permanent lockdown status in 1983. Prior to Marion, the Federal Bureau of Prisons operated solitary con‐finement at the Alcatraz Island Prison until it closed in 1963. History points to even earlier uses of solitary confinement including Pennsylvania’s Eastern State Penitentiary, which opened in 1829 and was later mod‐eled in European prisons (Smith, 2008). However, these early models featured such extreme social isolation and sensory deprivation (Cohen, 2008) and were so primitive that there is little comparison between them and today’s modern supermaxes (National Institute of Corrections, 1999).
Across prison systems, different terms are used to describe the same concept: administrative segregation or AS, control units, security housing units or SHUs, and security controls unit (Haney, 2003; NIC, 1999). In Col‐orado, it is known as AS. Just as the names vary, so do the conditions. However, the defining feature that is frequently associated with this model is single‐cell confinement for 23 hr per day, with 1 hr allowed out of cell for showers and exercise. AS is differentiated from punitive or disciplinary segregation, which is a time‐

INTRODUCTION 2
limited punishment enforced for a prison violation pursuant a full due process hearing; placement in AS is an administrative decision that often extends for an indefinite time period.
AS prisons are costly to build and operate due to costs associated with high security that include single‐occupancy cells, high staff to inmate ratios, and technology (Mears & Bales, 2009). Because inmate move‐ment requires multiple restraints and staff, many services are provided at the cell door, including meals, li‐brary, mental health services, and programs. Newer AS facilities are equipped with advanced technological equipment, which enables delivery of even more services to inmates in their cells (e.g., visitation through videoconferencing) or within the facility (e.g., medical and dental procedures). Although technological equipment is designed and used to reduce security breaches, it also increases the degree of isolation expe‐rienced by inmates.
It is difficult to establish the number of inmates held in AS nationally. In 1999, King estimated that 1.8% of all state prisoners were housed in AS. Although prevalence estimates are higher now than in 1999, prison sys‐tems under‐report the actual use of AS, likely due to the negative connotation associated with the supermax label used in national reporting (Naday, Freilich, & Mellow, 2008). For example, the Federal Bureau of Pris‐ons reported no inmates in AS, protective custody, or supermax beds in 2008 (American Correctional Asso‐ciation, 2009), which is inaccurate. Additionally, states reported drastically different numbers of offenders in AS from year to year (see Naday et al., 2008). Given these limitations, it is estimated that at least 3.2% of all state prisoners in 2008 were housed in AS or protective custody (American Correctional Association, 2009), although this appears to be an under‐estimation of the true prevalence rates.
CRITICISMS OF THE AS MODEL
The use of AS has sparked a controversy resulting in considerable criticism of the prison system and its ad‐ministrators. The limited number of research studies and the inadequacies of existing research on AS have only fueled the controversy. Numerous researchers and forensic professionals have called for more research to examine whether evidence based practices are in place and to examine whether harm is being done by confining inmates to segregation (Kurki & Morris, 2001; Lovell et al., 2007; Mears, 2008; Metzner & Dvoskin, 2006; Pizarro & Narag, 2008), but the topics and setting are difficult ones in which to conduct research (Mears & Watson, 2006; Naday et al., 2008).
One criticism has been the lack of evidence that segregation has achieved its intended goal of reducing vi‐olence in the prison system (Kurki & Morris, 2001; Mears, 2008). There is some literature to suggest that wardens and prison systems find this model to be effective in reducing violence and increasing order within the larger prison system (Atherton, 2001; Mears & Watson, 2006; Ward & Werlich, 2003). However, these studies lack the appropriate statistical controls to assert that the improvements are measurable and attri‐butable to AS rather than merely perceptions of wardens or the result of other management controls also put into place at the same time. In an empirical study of institutional violence in three states, Briggs, Sundt, and Castellano (2003) did not find that AS reduced inmate‐on‐inmate violence. However, in a follow‐up study, Sundt, Castellano and Briggs (2008) found that permanent reductions in inmate‐on‐staff violence were attributable to the opening of an AS prison in Illinois.
Corrections departments have been moving towards evidence‐based models and practices to improve the rehabilitation opportunities for offenders. These practices include standardized assessments, matching of‐fender needs to services, cognitive‐behavioral programs, re‐entry services, structured decision making

INTRODUCTION 3
guidelines, and intensive treatment programs such as therapeutic communities. By endorsing an administra‐tive action to determine placement of inmates into AS, corrections agencies have moved away from the evi‐dence‐based risk and classification instruments in favor of more subjective decisions. This criticism applies to both the decision to place inmates in AS and their continuation in AS (Human Rights Watch, 2000; O’Keefe, 2008b; Pizarro & Narag, 2008).
An emerging concern is the return of offenders from AS to society, which may occur with little or no step‐down process such that offenders are released directly to the streets from 23/7 confinement. Although the adjustment required for offenders to adapt to rapid and extreme socialization changes is of concern, the issue of public safety is perhaps of even greater concern. Research has indicated that AS inmates have high‐er recidivism rates than non‐AS offenders (Mears & Bales, 2009; Motiuk & Blanchette, 2001; O’Keefe, 2005), but this is likely due to the selection effects of who is confined to AS. When matching procedures were en‐gaged, no differences in overall recidivism rates were found between AS and matched non‐AS inmates (Lo‐vell et al., 2007; Mears & Bales, 2009). Mears and Bales (2009) found a small, but significant difference when violent recidivism was the outcome measure rather than general recidivism; 24.2% of AS inmates had a vio‐lent re‐offense compared to 20.5% of matched non‐AS inmates. Lovell et al. (2007) found that inmates who released directly from AS had a higher recidivism rate than matched offenders who transitioned from AS to a lower security facility prior to release. In contrast, Mears and Bales (2009) found neither a recency effect (i.e., amount of time that elapsed between AS confinement and release) nor an exposure effect (i.e., total amount of time spent in AS confinement) on recidivism rates.
Human rights concerns are tantamount to a discussion of the criticisms of the AS model. The use of AS has been called a human rights violation, and some have even labeled it torture (Gawande, 2009; Metzner & Fellner, 2010). Many find the conditions of solitary confinement to be excessively harsh and inhumane (Co‐hen, 2008; Haney, 2003, 2008; Human Rights Watch, 1997, 1999, 2000; King, 1999; Kupers, 2008; Kurki & Morris, 2001; Toch, 2001). Specifically, the lack of treatment, programs, and activities to engage the mind; the restricted personal contact; lack of control over light and sound; lack of windows; and little or no access to the outdoors are considered to be more extreme than is required for the safe operation of prisons. Addi‐tionally, when people are held in highly restrictive environments where they have little control over their life, there is a greater opportunity for staff to inflict abuses upon those confined within (Haney, 2008; Hu‐man Rights Watch, 2000; Kurki & Morris, 2001).
The most significant issue is the question of whether prisoners are able to psychologically adapt to the con‐ditions of AS. There is concern that mentally healthy individuals will decompensate in segregation, but re‐cent discussions have centered on the placement of offenders with mental illness in such environments. Be‐cause the harmful effects of AS is the central focus of this study, we will examine the evidence as it is availa‐ble both in case law and in the research literature.
CASE LAW REVIEW
As is the case with many important issues that affect the correctional system, conditions of AS confinement have been challenged in U.S. courts. In a pivotal First Amendment case heard in the Supreme Court, Turner v. Safley (1987) set a standard for lower courts to evaluate the claims of prisoners such that deference is given to prison administrators to set policies to ensure the safe operation of their prisons. Although the Court’s decision does not prevent inmates from making claims against AS confinement, it limits the scope of claims that they might successfully litigate to conditions that are needlessly harsh or unreasonable (Pizarro

INTRODUCTION 4
& Narag, 2008). Additionally, the Prison Reform Litigation Act of 1996 was enacted to restrict the filing of prisoners’ cases in federal court. Consequently, most of the case law surrounding AS has been on the grounds of a Fourteenth or Eighth Amendment violation (Collins, 2004).
Fourteenth Amendment
Under the Fourteenth Amendment of the U.S. Constitution, the state must adhere to certain procedures in deciding to deprive inmates of their liberty interest (Collins, 2004). In Sandin v. Conner (1995), it was deter‐mined that a liberty interest is created only when there is an “atypical and significant deprivation in relation to the normal incidents of prison life.” In such cases, certain due process procedures are required.
Segregation that does not pose an atypical and significant hardship is not subject to due process, including such confinement that may occur during a period of investigation into inmates’ misconduct (Jones v. Baker, 1998). However, in Wilkinson v. Austin (2005), it was decided that the plaintiffs’ due process and liberty in‐terest had been violated because the combination of conditions were significantly more restrictive than other Ohio state correctional facilities (e.g., isolation, lack of control over heating and lighting, no outside recreation) and because of the length of confinement. The court upheld the Hewitt v. Helms (1983) decision that these inmates were entitled to minimal procedural requirements, specifically timely notice of an AS evidentiary hearing, reason for confinement, and sufficient opportunity for response.
Extended confinement in segregation without a review hearing was also determined to be a violation of the Fourteenth Amendment. A New York court found that periodic review of inmates’ continued need for such confinement is required (McClary v. Kelly, 1998).
Eighth Amendment
The Eighth Amendment ensures prisoners protection from cruel and unusual punishment. Because this con‐cept is subjective, the Supreme Court has established the following standards:
(a) shocks the conscience of the Court, (b) violates the evolving standards of decency of a ci‐vilized society, (c) punishment that is disproportionate to the offense, and (d) involves the wanton and unnecessary infliction of pain (Collins, 2004, p. 106).
In examining the conditions of confinement, the totality of circumstances must be weighed; although each individual condition might not be a violation, the combination of conditions might constitute one. Further‐more, prison officials must demonstrate “deliberate indifference” to a prisoner’s basic human need in order for there to be an Eighth Amendment violation.
The use of prolonged segregation was tested in three significant cases in California (Madrid v. Gomez, 1995), Texas (Ruiz v. Johnson, 1999), and Wisconsin (Jones ‘El v. Berge, 2001). Long‐term segregation was not deemed a violation, except in the case of inmates with serious mental illness where extended stays were ruled unconstitutional. In Madrid v. Gomez (1995), not only was it ruled cruel and unusual punishment to place mentally ill inmates in the SHU, those at reasonably high risk of suffering mental illness as a result of SHU conditions were also restricted. Explicit in these cases is the requirement of correctional mental health staff to screen, assess, and monitor offenders for mental illness or emerging symptoms resulting from their placement in segregation.
It is also significant to note that in a number of states, settlement cases have also prevented or mitigated the placement of inmates with serious mental illness into long‐term segregation. These states include Ohio,

INTRODUCTION 5
Connecticut, Indiana, New Mexico, New York, and Mississippi. Other cases, in states such as New Jersey and Florida, have led to agreements to modify the terms under which prisoners with mental illness can be put or kept in segregation (Jamie Fellner, personal communication, June 10, 2010).
RESEARCH REVIEW
There exists a large body of peer‐reviewed literature surrounding long‐term segregation and solitary con‐finement. Many of these publications are literature reviews, theoretical articles, and case studies; few meet the American Psychological Association (2009) standard of empirical study article defined as reporting on original research or presenting new data analyses not addressed in previous reports, whether qualitative or quantitative. For example, in the 2008 special edition of The Disturbed Offender in Confinement published by Criminal Justice and Behavior, many of the nine articles focused on AS or other types of high security set‐tings but only one (Lovell, 2008) presented an empirical study. Also in 2008, The Prison Journal released a special issue entitled Supermax Prisons. Only two of the eight articles (Sundt et al., 2008; O’Keefe, 2008b) meet the American Psychological Association standard for empirical research (2009). The large number of articles and corresponding lack of empirical research reinforce this as an important area of forensic psychia‐try in which it is very difficult to conduct viable research.
The entire body of literature has been critical to advancing our understanding of AS confinement and its re‐lated issues. We relied on this literature to shape our hypotheses and research design in the present study. The case study research in particular has been useful to illustrate problems that might be attributed to AS (i.e., serious psychological harm) and highlight the need for research (see Benjamin & Lux, 1975; Human Rights Watch, 1997, 1999; King, 1999; Kurki & Morris, 2001; Rhodes, 2004). However, there are serious limi‐tations with case studies. Small sample sizes, as are the norm in case studies, mean findings may not gene‐ralize to all, or even most, segregated offenders. Particularly concerning is that sampling procedures are of‐ten not discussed, suggesting that special care was not taken to select a representative sample. Additionally, these approaches do not provide a relative comparison of the participants’ behavior in other settings; in‐mates who report serious psychological difficulties in segregation may experience those same problems in other prison settings or in society. Because we are interested in conducting an empirical study, our review of the research focuses on other empirical studies of the psychological effects of AS along with several key ar‐ticles that informed our selection of psychological measures.
The SHU Syndrome
In 1983, Dr. Grassian described the psychopathological features resulting from AS that he believed to form a clinical syndrome, which later became known as the SHU syndrome in the wake of Madrid v. Gomez (1995) case. He interviewed 14 plaintiffs in a conditions‐of‐confinement lawsuit and described his clinical observa‐tions resulting from those interviews. Grassian noted perceptual changes, affective disturbances, cognitive difficulties, disturbing thought content, and impulse control problems that immediately subsided following release from such confinement. In more recent research, Haney (2003) found elevated symptoms of psycho‐logical trauma (e.g., anxiety, headaches, impending nervous breakdown, lethargy) and psychopathological features (e.g., ruminations, social withdrawal, irrational anger) among 100 SHU prisoners as compared to national probability samples. This constellation of symptoms composes the primary features of what has been coined the SHU syndrome.

INTRODUCTION 6
Quantitative Research
Well‐designed quantitative studies, although often not as rich in detail as case studies or qualitative re‐search, can provide information about the impact of segregation on psychological well‐being through the use of randomly sampled participants, representative samples, comparison groups, objective data collection strategies, standardized procedures, and analytical strategies that account for random error. Research on the effects of AS have been criticized for lacking these quality components that allow one to rule out plausi‐ble alternative explanations (Arrigo & Bullock, 2008; Metzner & Dvoskin, 2006; Pizarro & Narag, 2008; Zinger et al., 2001).
A key component that distinguishes research from demonstrations is the use of control or comparison groups. Because of the lack of a comparison group, some frequently cited studies are actually demonstra‐tions of the potential impacts of AS (e.g., Brodsky & Scogin, 1988; Haney, 1993; Grassian, 1983). In the sim‐plest research design, a study will compare a “treated” group to a control or comparison group to determine if the groups are different on the variable of interest. In a pure experimental design where participants are randomly assigned to conditions (e.g., segregation, general prison population), differences between groups would indicate the impact of segregation on the outcome variable; however in applied studies where ran‐dom assignment to conditions is not feasible, the differences between the segregation group and a compari‐son group may be due to segregation or to other uncontrolled factors. The quality of the comparison de‐pends on the similarity between the control/comparison group and the experimental/treated group.
Several quantitative studies have used comparison groups to explore the impact of segregation on psycho‐logical outcomes. Several of these studies have been experimental in nature in that inmates who volunteer to be randomly assigned to either segregation or comparison conditions for a short period of time (e.g., Ec‐clestone, Gendreau, & Knox, 1974; Gendreau & Bonta, 1984; Gendreau, Freedman, Wilde, & Scott, 1968, 1972; Gendreau, McLean, Parsons, Drake, & Ecclestone, 1970). These studies tend to show little impact of segregation on mental well‐being but can be criticized for lacking ecological validity by using participants who volunteered to be placed in segregation, using small samples sizes, and for being short‐term, all of which do not match the current reality of how AS exists in U.S. prisons today. To demonstrate ecological va‐lidity, conditions under investigation should reflect real life conditions. Similarly, comparisons to prisoners of war or use of college students and inmate volunteers, lacks the ecological validity necessary to generalize the findings to inmates in segregation.
Cross‐Sectional Designs
Non‐experimental research, which may demonstrate more ecological validity, have used a variety of com‐parison groups including general, non‐inmate populations and norms (e.g., Haney, 2003; Hodgins & Côté, 1991; Suedfeld et al., 1982), general population prisoners (e.g., Hodgins & Côté, 1991), and inmates in dif‐ferent security levels who report being in segregation or not ever experiencing segregation (Suedfeld et al., 1982). Most, although not all, of these studies concluded that inmates in AS demonstrate higher levels of psychological distress. Because the quality of the conclusions depends on the similarity between the com‐parison group and the AS group, these cross‐sectional studies lack the ability to attribute these differences to the conditions of confinement. In these studies, it is not possible to rule out alternative explanations due to selection bias and potential pre‐existing differences, including psychological differences that may have existed prior to entering AS (i.e., there has been an inability to establish the time precedence between AS

INTRODUCTION 7
and psychological well‐being). An improved design strategy is to select a comparison group that has been matched to the segregation group on important variables (e.g., Lovell et al., 2007; Mears & Bales, 2009).
Longitudinal Designs
In order to truly understand how AS impacts the well‐being of inmates, an improvement over cross‐sectional design strategies with a comparison group is to study how inmates change over time using a longitudinal (or repeated measures) design. Studying intra‐individual change allows for better understanding on whether change occurs as well as explication of how change occurs. In longitudinal designs, individuals serve as their own control group, and comparisons from baseline allow one to see how change is occurring. Adding a comparison group in a longitudinal design will allow one to rule out additional alternative explanations when change is (or is not) occurring.
There have been few longitudinal studies about the effects of segregation. Early studies by Gendreau and colleagues (Ecclestone et al., 1974; Gendreau & Bonta, 1984; Gendreau et al., 1968, 1970, 1972) used re‐peated measures experimental designs over periods of up to 10 days to explore the effects of segregation on psychological and physiological measures. Few negative impacts of segregation were found over these brief time periods. Although use of a repeated measures experimental paradigm improves over cross‐sectional studies which may have selection bias issues, the short confinement periods are unrealistic for providing information on the effects of segregation as it is currently being used in U.S. prisons.
Only two recent studies were found that followed inmates for longer time periods after placement in segre‐gation (Andersen et al., 2000; Andersen, Sestoft, Lillebaek, Gabrielsen, & Hemmingsen, 2003; Zinger et al., 2001). Andersen et al. (2000) studied participants over a 4 month period, but the majority of participants had data for less than a month. Zinger et al. (2001) followed inmates over a 60 day period. Both of these studies had high attrition rates (usually due to release from segregation), leading to a small percentage of participants who had complete data. Attrition is a major problem in longitudinal designs both for generali‐zability issues (i.e., are the participants who remain different from those who drop out) as well as analysis problems for those methodologies which require complete data from all participants (e.g., analysis of va‐riance techniques). Newer methodologies developed for studying intra‐individual change are less impacted by attrition rates. Although conclusions from these studies are limited by methodological weaknesses, both Andersen et al. (2000) and Zinger et al. (2001) demonstrated that segregated populations have more psy‐chological disorders at the start than comparison subjects. However, these two studies provide conflicting evidence on whether conditions get worse over time. Thus, further longitudinal studies are needed to sort out these discrepancies and understand the long‐term impacts of segregation.
THE COLORADO SYSTEM
In Colorado at the time of this study, there were four designated AS facilities. Colorado State Penitentiary (CSP) opened in 1993 as a 756‐bed male AS facility in its entirety. At the Sterling Correctional Facility, 192 of its 2,545 beds were constructed to house male AS inmates in three units that are separate from the rest of the facility. The San Carlos Correctional Facility (SCCF) is a male acute care psychiatric prison, with nine units of varying security levels. One 26‐bed unit at SCCF is designated for AS classified inmates. Generally, AS at SCCF is reserved for inmates already housed at SCCF needing high security or for inmates in AS at CSP or Sterling Correctional Facility whose psychiatric needs exceed those available at their current facility. The fourth AS facility is a 24‐bed unit located at the multi‐custody Denver Women’s Correctional Facility. Be‐

INTRODUCTION 8
cause it houses the largest number of AS inmates and no other custody levels, CSP was the only AS site in‐cluded in this study.
The Colorado Department of Corrections (CDOC) had 25 state and 7 private prisons that managed 19,279 inmates as of June 30, 2007, which marked the start of data collection. There are five security levels – mini‐mum, minimum‐restrictive, medium, close, and AS – to which offenders are assigned. CDOC uses a standar‐dized, objective classification instrument that was developed specifically for the management of Colorado’s inmate population (Austin, Alexander, Anuskiewicz, & Chin, 1995). The classification instrument is used to assign inmates to minimum through close security levels. However, AS is a long‐term segregation placement for inmates who display violent, dangerous, and disruptive behaviors and placement is determined through an administrative action that is separate and distinct from both the usual classification system and the dis‐ciplinary system. Although disciplinary infractions may affect classification at all levels, the disciplinary process is a punitive response to a finding of guilt for an institutional rule violation and may result in punitive segregation, which can extend up to 60 days. Therefore, punitive segregation is of short duration used for punishment and AS is of long duration used for management purposes.
The administrative action to classify an offender to AS begins with a hearing, frequently following either a se‐rious violation or a series of less serious infractions. Colorado does not house protective custody inmates; therefore, no AS placements occur at the request of inmates. Also, during the study, newly arrived inmates were not placed directly into AS upon intake into DOC except in rare cases for violent behavior in county jail or for an interstate compact case transferred from AS in another prison system. Although the disciplinary system only allows for punitive segregation following a finding of guilt, pre‐hearing segregation (removal from popula‐tion) may occur immediately following a serious incident for the safety and security of the facility. Therefore, in the time leading up to and during their AS hearing, inmates have typically been in segregation.
AS Offenders in Punitive Segregation
All facilities across the state of Colorado have punitive segregation beds with the exception of CSP and min‐imum security facilities. Minimum custody offenders are transported to a higher security facility to complete their punitive segregation time. When offenders are placed in punitive segregation, they are removed from the general population (GP) and taken to an isolated part of the facility to be placed in a single cell. Punitive segregation offenders remain in their cell for 23 to 24 hours a day, only coming out for recreation and showers, both of which are located within the living unit. Therefore, most do not leave the unit during their segregation time. Services including meals, library, laundry, and even medical and mental health appoint‐ments occur at the cell door. If a situation warrants an offender to be out of cell, the offender is placed in full‐restraints and escorted to a room within the unit where he or she can meet with staff privately. Many offenders do not like being taken out of their cell unless absolutely necessary because of the use of full re‐straints. Additionally, they may not like leaving their cell because officers may take the opportunity to search the cell for contraband.
Due to the disciplinary nature of punitive segregation, offenders are stripped of most privileges during their stay. Punitive segregation inmates are neither allowed to work nor are they permitted to participate in pro‐grams or education. Furthermore, their televisions are removed, and they cannot order canteen beyond es‐sential hygiene items.

INTRODUCTION 9
Punitive segregation is a highly restrictive environment, only intended to be used for a short period of time. Once reclassified to AS, offenders may remain in a punitive segregation bed while waiting for an AS bed to become available. This can be problematic as GP facilities are not designed to house offenders in long‐term segregation and the small number of punitive segregation beds at each GP facility can fill up quickly. Fur‐thermore, while punitive segregation offenders are not afforded privileges, AS offenders are granted limited privileges such as visiting, which happens outside of the unit. Visitation is labor intensive because it requires escort by two correctional staff. In addition, while being held at an AS facility, offenders who behave well and complete their required programming and education are able to progress through a step program whe‐reby they earn more phone sessions, visiting time, and privileges (e.g., TV, canteen). Only two punitive se‐gregation facilities offer a step program for privileges, and there are none that provide the opportunity for programming or education. This means that while AS offenders are held in a punitive segregation bed, they are unable to begin working their way toward leaving segregation.
CSP Conditions of Confinement
Once an AS offender is moved from a GP facility and assigned to CSP, he is transported to CSP where he completes his AS time. Offenders are taken into CSP through intake, which is located on the lowest level of the facility. While in intake, offenders are placed in a holding cell that is similar to their permanent cell. Dur‐ing this time, the offender watches an orientation video that outlines what he can expect and what is ex‐pected of him during his time at CSP. He also has a brief visit from mental health, conducted at the cell door. While the offender is going through orientation, property staff assesses his belongings to ensure that no un‐allowable items enter with the offender, as they are permitted fewer property items than in GP facilities. This also prevents dangerous contraband such as drugs or weapons from entering the facility. Once the of‐fender has completed orientation, usually within the first few hours, he is escorted to his permanent cell in a different area of the facility.
Physical Environment. CSP has six identical pods, or living units. When the offender enters the pod, he is es‐corted down a long hallway that opens into a circular area. In the center of the area is a tower with an office for housing unit staff on the lower level and the pod’s control center on the upper level. Officers manning the control center operate all doors or sliders into the pod, including those to offenders’ cells. Correctional staff standing in either the lower or upper levels of the tower can see into all eight of the day halls. Each day hall contains 15 to 16 offender cells separated onto two tiers with each tier having 7 or 8 cells, a shower, and a recreation room.
The cells in CSP are 80 square feet with 35 square feet of unencumbered floor space and contain a bunk, toilet, sink, desk, and stool. Each of these items is made of metal and is mounted to the wall or floor for se‐curity. Every cell has a 5” x 45” window on the exterior wall above the offender’s bunk through which the offender can see outside. There is also a window on the cell door that faces the day hall. Depending on the pod, the window is either 3.5” x 20.5” or 5” x 15”. Neither of these windows opens, which precludes the of‐fender from receiving outside air while in his cell.
Per CSP policy, offenders wanting to participate in recreation are generally permitted at least one hour five times per week (as well as to shower for 15 minutes three times per week which generally coincides with an offer to exercise), assuming that there are no facility occurrences disrupting this schedule. When an offend‐er is offered recreation and chooses to participate, he is placed in full‐restraints and escorted from his cell to the recreation room at the end of the tier. The recreation room is a 90‐square foot cell that contains a pull‐

INTRODUCTION 10
up bar mounted to the wall. No other exercise equipment is allowed. The only opportunity offenders have to receive fresh outside air is through two 5” x 60” grated windows on the exterior wall of the recreation room. On the interior, a glass wall faces the V‐shaped day hall, so the offender in recreation is fully visible. Though prohibited by the facility, an offender in the recreation room may call out exercises to other offend‐ers who in turn workout in their cells.
There are light and sound standards for CSP. Standards for CSP require that ambient sound does not exceed 70dBA during the day or 45dBA at night. A sound measurement of offender housing units at CSP, on a single day, returned an average of 55dBA at 7:50 AM and 42dBA at 10:40 PM. Although staff attempt to regulate the ambient sound of the facility, it can be difficult to regulate the noise level of 756 offenders; these mea‐surements do not reflect periods of sound elevations produced by inmates’ yelling and banging. Additional‐ly, each offender is entitled to at least 20 foot‐candles of light in the desk area of his cell. A light measure‐ment of offender cells returned an average of 55 foot‐candles of light in offenders’ cells. Offenders have two 32‐watt lights over the desk in each cell that they are able to control. In addition, each cell contains a 7‐watt security light underneath the desk that stays on 24 hours per day.
Interpersonal Communication. Each cell has an intercom system through which correctional officers can con‐tact each offender from the unit’s control center. Officers use the intercom system to ask prisoners ques‐tions such as whether or not they want to attend recreation or take a shower. They also use the intercom to inform inmates when they will be leaving their cell for such things as a mental health visit, a family or friend visit, or if the offender will be escorted to another part of the facility or off grounds. Conversely, inmates can use the intercom system by pushing a button in their cell to contact staff, which they may do to request items (e.g., razor, toilet paper) or simply to chat. Staff also has the ability to monitor conversations using the intercom system.
While the intercom system provides a means for correctional staff and offenders to communicate with each other relatively easily, it does not afford offenders the opportunity to communicate with one another. Many offenders at CSP have become skilled in sign language. Since each day hall is V‐shaped and cell doors have windows, offenders are able to communicate with each other using sign language. This aids in keeping the noise level down in the day hall and gives inmates the opportunity to speak to each other without the risk of staff overhearing. At times, however, many inmates simply yell through their cell door so that other offend‐ers can hear. When this happens, the day hall can become very noisy.
Due to the safety concerns of the facility and the fact that moving an AS offender from his cell is staff inten‐sive, offenders in AS receive many services at their cell door. At CSP, officers make rounds every 30 minutes to do a visual check into the cell of every offender. Mental health clinicians are required to do monthly rounds as well. During these rounds, clinicians go to the cell door of every offender in their assigned pod and check in with the inmate to see how he is doing. If the offender is well, the clinician moves on; however, if the clinician feels the offender needs follow‐up, he or she will schedule an appointment with the offender for a later time. This appointment will be conducted in the visiting room, not cell side. In addition to rounds, offenders receive their library service and educational services at their cell door. Once a week, a librarian picks up library kites, or requests, and distributes books and magazines to offenders who put in a kite the previous week. When an offender is participating in programming or education, the teacher or counselor distributes homework to each inmate through the cell door and also collects completed assignments in the same manner.

INTRODUCTION 11
Mental Health Services. In addition to mental health services received cell‐side, offenders who are diag‐nosed with a mental illness receive more in‐depth mental health services. Offenders with mental illness who are stable are offered a one‐on‐one session at least once every 90 days. Those with acute mental health needs are required to be seen at least once every 30 days. Although there are requirements on mental health staff to schedule appointments, offenders may refuse these appointments. Conversely, if an offender feels his mental health status has changed since his last monthly round, he may put in a request to see a cli‐nician sooner than scheduled. If necessary, clinicians will schedule an offender for a mental health session for 1 to 2 hours per week as they are available; this is infrequent but most likely to occur following a crisis event. Additionally, if a mental health clinician feels a prisoner requires psychotropic medication, an ap‐pointment is made for him to meet with a psychiatrist. This visit may happen in a noncontact visiting booth or via teleconference.
Mental health appointments occur in a noncontact booth in the visiting room, unless the offender has de‐clared a mental health emergency. If an offender has threatened self‐harm, he is often taken to intake and placed in a special observation cell where he is stripped of his belongings and can easily be observed by staff for his safety and the safety of staff. An offender is kept in the observation cell until the clinician can make a reasonable assumption that the offender no longer plans to self‐harm or for 72 hours, whichever comes first. If the clinician determines the offender needs to be observed beyond 72 hours, approval is needed from administrators and a mental health supervisor outside of the facility. Offenders who remain in a men‐tal health crisis situation beyond the three to five day window are then sent to the infirmary at a different facility. There are generally four to six mental health clinicians who are responsible for managing the mental health needs of offenders at CSP. When the facility is fully staffed with six clinicians, each is assigned to a pod of 126 offenders, but when there are vacant positions, clinicians are required to cover their pod’s men‐tal health needs and split an additional pod with another clinician.
Quality of Life Program. When an offender arrives at CSP, his length of stay is indeterminate because it is based upon his behavior and ability to comply with programming requirements. The average length of stay at CSP is two years (O’Keefe, 2005). CSP provides incentive‐based behavior modification and cognitive pro‐grams. Every offender must successfully complete three cognitive classes with each lasting three months. Successful completion of the required programming along with modeling appropriate behavior is the prima‐ry way for an offender to work his way out of CSP. The goal of these programs is to provide offenders with tools so they may be successfully reintegrated into lower security prisons.
CSP’s incentive‐based programming consists of three quality of life (QOL) levels. Each level brings with it more privileges; however, these privileges must be earned by the offender through appropriate behavior and compliance with CSP rules. Each level has a prescribed minimum number of days: 7 for level one, 90 for level two, and 90 for level three. Because offenders are required to complete three 90‐day cognitive courses and there are often program waitlists that may result in an offender staying on levels two or three for longer than 90 days, the total program length is expected to last a minimum of one year. Additionally, offenders who misbehave may be regressed through the levels, extending their time in the program.
QOL level one is much like punitive segregation in that offenders are not permitted to have a television or to participate in programs or work. Furthermore, offenders at this level are only allowed one 20‐minute phone session and one 2‐hour noncontact visit per month, should they remain at level one for that length of time. They are able to order items from the canteen at a maximum of $10 per week. Though limited in compari‐

INTRODUCTION 12
son to what GP offenders are able to buy, offenders at CSP have a variety of food, hygiene, faith, and per‐sonal items available for purchase. Additionally, AS inmates are permitted three library books at any given time. All other property must fit inside a 2 cubic feet duffle bag; however, as long as the property can fit in the bag, they are allowed two personal books, two magazines, and one newspaper. Other items that of‐fenders at this level may have are photographs and an address book.
Level one offenders are automatically reviewed on their seventh day by the unit sergeant. Unless they re‐ceived a negative write‐up or report, offenders automatically progress to level two after seven days. Those who do not progress are extended another seven days until their next review.
Inmates become eligible for cognitive classes when they have been elevated to QOL level two. Offenders at this level are allowed a television, and if they are indigent and unable to afford one, the facility will loan one to them. This is beneficial as CSP provides some of their programs and recreational activities through the television. Offenders also receive 20 television channels that they are able to control from their cell and view at their leisure 24 hours per day. Also available through the television is a music channel that plays at designated times and rotates through music genres. Additionally, offenders have the opportunity to play bingo on a monthly basis. The bingo numbers are selected and aired over closed circuit TV at the facility. Offenders who wish to participate in Bingo receive six board games and are awarded a candy bar for each verified bingo.
In addition to programming received through their television, offenders at this level are permitted art sup‐plies (colored pencils, art paper, drawing patterns, and coloring pictures), games (solitaire and kings table), puzzles (crossword, word fill‐ins, word search, and Sudoku), and pamphlets for in‐cell exercises offenders (push‐ups, stretching, and isometrics). Offenders may request a new supply of colored pencils every six months and are able to receive four new sheets of art paper and new puzzles on a weekly basis.
At level two, offenders are permitted to increase their weekly canteen order to $20 and have an increase in both their phone privileges, to two 20‐minute phone sessions per month, and their visiting privileges, to two 2‐hour noncontact visits per month. However, offenders at this level remain unable to work. Once an of‐fender has completed a minimum of 90 days on level two, has been compliant with programming, has not had any negative write‐ups for at least 90 days, has had appropriate interaction with staff, and has sustained suitable cell conditions, he may be progressed to QOL level three. Offenders’ case manager initiates the pa‐perwork for a level progression, which requires approval by the housing captain.
Arguably one of the most important benefits of QOL level three is an offender’s ability to have more contact with friends and family. While offenders’ visits remain noncontact, they are increased to four 3‐hour visits per month and four 20‐minute phone sessions. Offenders are also permitted to order as much as $25 worth of canteen per week. One additional benefit is that offenders may now be eligible to work as a porter or barber. There are 54 positions available to offenders at CSP. Benefits to being offered a job position include the ability to earn money, increased time out of their cell, and two additional phone sessions per month. However, simply being at QOL level three does not automatically qualify an offender for a job. If intelligence officers feel the offender is a threat to the facility, he will not be permitted to work as a porter or barber. A QOL level three inmate may be deemed a continued threat due to an institutional history of assaultive be‐havior or from intelligence that suggests he may use the opportunity to intimidate or pass gang information or contraband to other offenders. There are no time limits restricting how long an offender can be in a job position and there is a waitlist of offenders who have put in a request to work; however, because of the

INTRODUCTION 13
progression of offenders out of CSP and offenders who their work privilege, the same 54 offenders are not usually working for more than a couple of months.
The restrictions inherent in AS diminish staff’s ability to impose traditional sanctions for institutional rule violations. Offenders in GP who are found guilty of a rule violation can receive a maximum of 60 days in pu‐nitive segregation or up to 180 days in loss of privileges (e.g., TV, canteen, visiting). Offenders in AS are re‐quired to follow the same institutional rules as GP offenders; however, because AS offenders are already in segregation for an indeterminate amount of time, they cannot receive additional segregation time as pu‐nishment. They can still lose privileges and be regressed through the QOL system. Sanctions are tailored to the seriousness of the infraction.
Offenders who engage in minor rule violations may initially receive a warning that is documented in a chro‐nological record report. If the behavior continues, the offender may lose a privilege for a short amount of time (e.g., three days) without losing a QOL level. For example, this may happen if an offender covers the security light in his cell to make it darker for sleeping. This may also happen if an offender is caught “rat lin‐ing” or “fishing,” which are forms of communication or exchange of items between offenders locked in their cells.
When an offender in AS violates a serious institutional rule, the officer initiates documentation on which he may recommend that the offender be regressed to a lower QOL level. This recommendation is approved or denied by a housing lieutenant. In general, if the lieutenant approves the offender’s level regression, he is dropped one level. This process is kept separate from the disciplinary process, which may or may not result in a guilty finding, in order to have an immediate response to an offender’s negative behavior. The discipli‐nary process can be lengthy because of due process requirements, but he may also receive a loss of privileg‐es sanction through the disciplinary process.
Regardless of the offender’s level, if he engages in behavior that dangerously disrupts the operation of the facility, he will be placed on special controls in the intake unit where he can be carefully monitored. This of‐ten happens during what is referred to as a use of force incident, which is any time an officer uses any level of force against an offender. A use of force incident generally occurs when an offender assaults a staff member or refuses to comply with a lawful order (e.g., refuses to be restrained for escort). An officer’s re‐sponse can include the use of simple pressure point tactics, the use of agents such as oleoresin capsicum (OC), or a forced cell extraction of the offender. During both fiscal years 2008 and 2009, CSP had an average of seven use of force incidents per month. Upon an offender’s return to his cell, he will automatically begin at QOL level one again. Though the offender will not be required to retake any of the cognitive classes that he has already completed, he will be terminated from any classes in which he is currently enrolled and will be required to begin his process through the QOL levels again. Additional sanctions may be imposed through the disciplinary process.
Offenders who have difficulty progressing through the QOL level system may require special consideration. Offenders in segregation can accumulate a high number of sanctions through behaviors such as breaking the sprinkler head in their cells or overflowing the toilet in their cells, causing flooding on the tier. It is difficult to manage and change the behavior of offenders who have so many sanctions that there is no tangible incen‐tive to improve their behavior. When this is the case, case managers and housing staff enact a behavior management plan. In a behavior management plan, case managers and correctional staff will use one privi‐

INTRODUCTION 14
lege (e.g., TV) that is highly valuable to the offender as an incentive. If the offender can behave well for a short period of time (generally 7 to 10 days), he may receive a television despite his loss of privilege status.
When an offender has been at level three for at least 90 days with good behavior and has successfully com‐pleted the requirements of the program, he is interviewed for progression out of CSP. A classification com‐mittee must approve the decision to reclassify him to close custody, and then he is moved to the Centennial Correctional Facility when a bed becomes available, where he continues to work toward completing his rein‐tegration programming. It is less common that an offender transitions out of CSP any other way; however, offenders do sometimes parole from CSP or release when they reach the end of their sentence while in AS. Additionally, an offender may be released from AS based on a warden’s review. An offender may receive a warden’s review if he has been in CSP for more than two years but has been unable to progress out of CSP. If it is felt that the offender no longer needs to be in CSP, he may be released back to GP without transition‐ing through Centennial Correctional Facility.
Progressive Reintegration Opportunity (PRO) Unit. At the Centennial Correctional Facility, there is a contin‐ued focus on behavior modification and cognitive programs to transition disruptive offenders to less secure environments. Most offenders complete QOL levels four through six in the PRO unit. Upon transfer from CSP, offenders are reclassified from AS to close custody, the next highest custody level. Upon arrival, little is different for the newly classified close custody offenders; however, as offenders work their way through the PRO unit levels, they work toward contact visits with friends and family and are eventually allowed recreation time in the gym with other inmates. Ultimately, offenders who are successful in completing all six QOL levels are released back to GP.
Offenders with Mental Illness (OMI) Management Program. During the course of the research project, the OMI management program was opened at Centennial Correctional Facility. In addition to the PRO unit, the OMI program was designed to be a transitional program from CSP specifically for prisoners with a mental illness. Offenders are selected for the OMI program by a multi‐disciplinary committee and must be approved for reclassification as a close custody inmate. In order to be considered for transfer to the program, offend‐ers must have been in AS for a minimum of six months, enrolled in a cognitive program, have a mental health disorder, and be actively working with a mental health clinician.
Upon transfer to the OMI program, inmates are automatically placed in the intermediate program level. The OMI program has three levels: high, intermediate, and low. High is the most restrictive level with low the least. Depending on the individual’s behavior, he can be moved to high or low levels. The program focuses on treatment and socialization. Offenders in this program work their way toward earning more privileges than are available in AS, contact visits with friends and family, and recreation in the gym with other inmates, much like PRO unit offenders do; however, the OMI program has the added benefit of group therapy. Initial‐ly, offenders are afforded the opportunity to participate in group therapy by being tethered to a special ta‐ble. As offenders progress through the program, they are eventually allowed in groups of eight untethered inmates. The goal is to transition offenders to GP or the community although placements in the program may be long term.
San Carlos Correctional Facility (SCCF)
SCCF is a 255‐bed special needs prison designed to stabilize and treat offenders with the most acute psy‐chiatric symptoms or with developmental disabilities who are at risk for self injury as a result of their illness

INTRODUCTION 15
and who have shown a substantial impairment in their ability to function at another correctional facility. SCCF houses inmates at all five custody levels. SCCF is unique in that offenders of all custody levels live and interact with one another on their living unit, with the exception of AS offenders who are housed in a sepa‐rate unit.
All offenders who arrive at SCCF are processed through the intake/assessment unit. New arrivals are inter‐viewed by both the mental health clinician assigned to the unit and a psychiatrist. New offenders are not permitted interaction with other inmates for the first 72 hours. If after 72 hours, clinicians and correctional staff feel the offender can reasonably interact with other offenders, he will be allowed in the day hall with as many as five other inmates. Offenders on the intake unit are permitted out of their cell in the day hall for at least one hour a day, five days per week. During this time, they have open access to the phones and show‐ers.
Offenders typically progress through the programming levels as their mental health status improves. Of‐fenders are continually monitored by a psychiatrist with an appointment every 30 days for the most severe offenders or every 60 days for those who are progressing well. One‐on‐one sessions occur with a mental health clinician as needed and are not scheduled on a regular basis; however, there is a clinician assigned to each unit, with each unit housing fewer than 30 inmates.
As an offender continues to progress through the facility, he will work his way towards open access to the day hall, phones, and shower. As he progresses through the facility he will then be allowed out with seven inmates and then fifteen, eventually earning all day open access. Those who have progressed to the lowest levels are also permitted one hour of recreation five days per week in the yard or gym plus three hours per week at the library. Additionally, they are able to participate in group therapy sessions, which happen once or twice a week depending on the topic. Group therapy subjects include anger management, understanding one’s mental illness, and other related topics. Once mental health, psychiatric, and correctional staff deter‐mine that the offender has improved enough to function in GP, he is then transferred to a facility at his cus‐tody level.
PURPOSE OF PRESENT STUDY
The broad purpose of the project was to evaluate the psychological effects of long‐term segregation on of‐fenders, particularly those with mental illness. This study examined conditions as they existed in the Colora‐do prison system with respect to AS, using CSP as the AS study facility. Only males were included because females represent 2% of Colorado’s AS population. We did not assign inmates to segregation, but studied those conditions as they naturally occurred. The following were the primary goals and hypotheses of the grant.
Goal 1: To determine which, if any, psychological domains are affected, and in which direction, by the differ‐ent prison environments. A multitude of psychological dimensions were examined, drawing from those most often cited in the literature. The broad constructs of interest were depression/hopelessness, anxiety, psy‐chosis, withdrawal and alienation, hostility and anger control, somatization, hypersensitivity, and cognitive impairment. We hypothesized that offenders in segregation would develop an array of psychological symp‐toms consistent with the SHU syndrome, with elevations across the eight constructs.

INTRODUCTION 16
Goal 2: To assess whether offenders with mental illness decompensate differentially from those without mental illness. We were particularly interested in whether long‐term segregation had a differential impact based on the presence of mental illness in offenders. We sought answers to the following questions: Does AS exacerbate symptoms in offenders with mental illness? Does AS create symptoms of mental illness in those who did not exhibit any at placement? It was hypothesized that offenders with and without mental illness would deteriorate over time, but the rate at which it occurred would be more rapid and more ex‐treme for the mentally ill.
Goal 3: To compare the impact of long‐term segregation against the general prison setting and a psychiatric care prison. In this study, the psychological and behavioral symptoms of offenders in AS were compared to similar offenders who were sent to SCCF or returned to the general prison population pursuant an AS hear‐ing. This study used a repeated measures design over the course of a year to explore whether psychological distress was attributable to the various prison environments. It was hypothesized that inmates in segrega‐tion would experience greater psychological deterioration over time than the comparison groups.
This study also included an examination of individual characteristics such as mental health status, personali‐ty, and trauma history to determine if certain factors could predict patterns of change. The prediction ana‐lyses were exploratory in nature and we did not formulate a hypothesis about the variables that might pre‐dict differential rates of psychological decompensation.
METHOD 17
METHOD GROUP ASSIGNMENT
Study participants included male inmates placed in AS and comparison inmates in the GP. Placement into AS or GP conditions occurred as a function of routine CDOC operations, pending the outcome of their AS hearing, with‐out involvement of the researchers. Inmates were identified as study candidates at the point the offenders were notified that they would have an AS hearing. Oftentimes, it was unknown whether a particular inmate would be placed in AS or returned to GP at the time of his study consent; approximately 10% of hearings do not result in AS placement. For the purposes of this study, all study participants classified to AS were waitlisted for and placed in CSP (as opposed to Sterling Correctional Facility). Inmates who returned to GP following an AS hearing were as‐sumed to be as similar as possible to AS inmates and, therefore, comprised the comparison groups. Comparison participants also included inmates targeted for a diversionary program that identified inmates at high risk of AS placement due to their disruptive behavior. This program discontinued shortly after the study commenced, hence few participants were identified through this method.
Inmates in both of these settings (CSP, GP) were divided into two groups – offenders with mental illness (MI) and with no mental illness (NMI). There are fewer inmates with mental illness than without, but because both sub‐groups were of equal interest to this study, separate groups enabled over‐selection of inmates with mental ill‐ness. All offenders are rated on a psychological needs level by trained clinicians upon intake into CDOC and pe‐riodically during their incarceration as warranted. The psychological needs level has a 5‐point rating, where high‐er values indicate the need for more intensive services, and a qualifier code that indicates whether the offender has a serious and persistent mental disorder. Most inmates rated 3 through 5 have an Axis I diagnosis, although certain Axis II diagnoses may infrequently warrant this rating (e.g., borderline, schizotypal). Disorders that typical‐ly qualify as serious and pervasive are mood disorders including major depression, other depressive disorders, dysthymic, and bipolar disorders; psychotic disorders including schizophrenic, paranoid, delusional, and schizoph‐reniform disorders; dissociative identity disorder; and posttraumatic stress disorder. In this study, inmates as‐sessed with a psychological needs level of 3 through 5 were defined as MI and levels 1 or 2 were defined as NMI.
A third comparison group was included. This group included inmates with severe mental health problems placed in SCCF. Of the inmates placed in SCCF, only those with patterns of prison misbehavior, as measured by discipli‐nary violations, were included in the study. However, inmates placed into AS at SCCF were excluded because of the small number and because many had transferred from AS at CSP or Sterling Correctional Facility, where the effects of the earlier placement would be unknown. The purpose of the SCCF comparison group was to study in‐mates with serious mental illness and behavioral problems who were managed in a psychiatric prison setting.
Figure 1 illustrates the number of offenders who were eligible for the study and details the selection of offenders within each of the five study groups. Given that the purpose of this project was to study long‐term segregation, inmates projected to release from prison before administration of the final testing session were excluded. In‐mates were also excluded if they could not read English or if their reading level was not high enough (roughly eighth grade) to complete the battery of tests. SCCF inmates were excluded if they did not have significant discip‐linary violations in their history. Infrequently, offenders were excluded for other reasons such as being an inter‐state compact offender, being the suspect in a high‐profile murder investigation (as reason for AS placement), or a visual impairment prohibiting them from reading. Finally, inmates were sampled as a matter of convenience. Because this project funded only one field researcher, participants were selected based on their proximity by ei‐ther timing or location to others who could be included in this study.

METHOD 18
METHOD 19
PARTICIPANTS
Figure 2 details the flow of participants through the study, including an account of how many offenders completed the testing at each interval. A total of 302 male inmates were approached to participate in the study. Thirty refused to participate. Two more offenders were considered a passive refusal and were re‐moved for inappropriate sexual behavior towards the researcher during the first testing session. An addi‐tional 23 offenders later withdrew their consent, although the data collected to the point of their withdraw‐al was used. In addition to refusals and withdrawals, 10 inmates released prior to the end of the study due to discretionary releases by the Parole Board and one GP participant died of a drug overdose.
Five testing sessions were initially established at 3‐month intervals, beginning with the date of consent and initial administration. Therefore, tests were scheduled at 3 months, 6 months, 9 months and 12 months af‐ter the baseline assessment. However, this schedule was problematic for the CSP groups. When the study began, there was a 3‐month average wait for inmates to be transferred to CSP due to a shortage of AS beds. While on the waitlist, AS inmates were held in a punitive segregation bed at their originating facility. It was determined that the primary goal was to study inmates in a single long‐term segregation facility (CSP) to lim‐it confounding variables and that therefore the baseline measure should be collected upon placement into CSP. However, it was also recognized that significant changes could occur while inmates were held in segre‐gation at their originating facility. Therefore, a “pre‐baseline” measure was collected as close to the AS hear‐ing as possible, which meant that the CSP groups completed six test intervals rather than five. The time be‐tween the pre‐baseline and baseline measure varied according to how long the inmate was on the waitlist. The median time between pre and baseline tests was 99 days, although eight offenders were moved into CSP so quickly that they did not have a pre‐baseline measure. In the analyses, tests were aligned across groups according to the test number, such that the CSP groups had an additional test at the end rather than at the beginning.
Participants’ ages ranged from 17 to 59 at the time of consent, with a mean age of 31.8 (SD = 9.1). The ra‐cial/ethnic breakdown of participants was 40% white, 36% Hispanic, 19% African American, 4% Native Amer‐ican, and 1% Asian. Of the inmates with mental illness who were included in this study, 56% were identified with a serious and pervasive disorder. Other participant characteristics are described in greater detail in the results section, including comparisons of study samples to eligible pools and comparisons of refusers to partici‐pants.
MATERIALS
Assessment tools were selected to comprehensively cover the variety of psychological constructs associated with AS (e.g., Arrigo & Bullock, 2008; Grassian, 1983; Haney, 2003). The primary constructs assessed in this study were as follows: (1) anxiety, (2) cognitive impairment, (3) depression/hopelessness, (4) hostility/anger control, (5) hypersensitivity, (6) psychosis, (7) somatization, and (8) withdrawal/alienation. Additionally, ma‐lingering, self‐harm, trauma, and personality disorders were assessed.
Research materials were selected to meet the following criteria: (1) use of assessments with demonstrated reliability and validity, (2) use of multiple sources for providing information (e.g., self‐report, clinician rat‐ings, files), (3) use of multiple assessments of each construct of interest, (4) ability to use within the prison setting, and (5) ease of administration, including no specialized equipment, no physical contact, short length of time, and appropriate reading level.

METHOD 20

METHOD 21
After selection of the self‐report assessments was complete, there remained several areas of interest (e.g., panic disorder, hypersensitivity to external stimuli, physical hygiene) for which there was no established measure that met our criteria. In conjunction with the study advisory board, the research team developed a 39‐item instrument to assess these areas. This instrument, called the Prison Symptom Inventory (PSI), is shown in Appendix A.
In addition to self‐report assessments, ratings of psychological functioning were obtained from clinical staff and ratings of behavior in the housing unit were obtained from correctional staff. Official record data were also gathered from electronic and paper files. This section summarizes information for self‐report assess‐ments, staff ratings, and behavioral data. Complete descriptions of the individual measures and their known psychometric properties from past research and for the current study are provided in Appendix B. Additional analyses of the psychometric properties of the PSI are presented in Appendix C.
Data were collected directly from participants on 12 self‐report assessments (ten paper‐and‐pencil tests, two administered by the researcher) to assess 12 different constructs. Table 1 provides a list of the assess‐ment tools for each construct. Most assessments were collected at each testing period, although personality disorders, self‐harm, and trauma history were not collected at all time periods. It was determined that per‐sonality and trauma history were relatively stable constructs that needed to be assessed only once to limit the testing burden on study participants. Also, due to the burden on already limited mental health re‐sources, the BPRS was only administered at the first, third, and fifth testing intervals.
Table 1. Assessments and Constructs
Anxiety
Cognitive
Impa
irmen
t Dep
ression –
Hop
elessness
Hostility – Anger
Control
Hypersensitivity
Psycho
sis
Somatization
Withd
rawal –
Aliena
tion
Malingering
Person
ality
Disorde
r
Self‐Harm
Trau
ma
Beck Hopelessness Scale (BHS) I Brief Psychiatric Rating Scale (BPRS) Activity Anxious‐Depressed C C Hostility/Suspiciousness C Thought Disorder C Withdrawal C
Brief Symptom Inventory (BSI) Anxiety I Depression I Hostility I Interpersonal Sensitivity I Obsessive‐Compulsive I Paranoid Ideation I Phobic Anxiety I Psychoticism I Somatization I
Coolidge Correctional Inventory (CCI) IDeliberate Self‐Harm Inventory (DSHI) IPersonality Assessment Screener (PAS) Acting Out I Alienation I

METHOD 22
Anxiety
Cognitive
Impa
irmen
t Dep
ression –
Hop
elessness
Hostility – Anger
Control
Hypersensitivity
Psycho
sis
Somatization
Withd
rawal –
Aliena
tion
Malingering
Person
ality
Disorde
r
Self‐Harm
Trau
ma
Anger Control I Health Problems I Hostile Control I Negative Affect I I Psychotic Features I Social Withdrawal I Suicidal Thinking I
Prison Behavior Rating Scale (PBRS) Anti‐Authority O Anxious‐Depressed O O Dull‐Confused O
Prison Symptom Inventory (PSI) Panic Disorder I Hypersensitivity/External Stimuli I Physical Symptoms I
Profile of Mood States (POMS) Anger‐Hostility I Depression‐Dejection I Fatigue‐Inertia I Tension‐Anxiety I
St Louis Univ Memory Scale (SLUMS) R State‐Trait Anxiety Inventory (STAI) State Anxiety I Trait Anxiety I
Structured Inventory of Malingered Symptomatology (SIMS)
I
Trail Making Test (TMT) R Trauma Symptom Inventory (TSI) I
Note. C = Clinician rating; I = Inmate self‐report; O = Officer rating; R = Researcher administered. Shaded tests not administered at every testing interval. Self‐Report Assessments
A composite score was developed for seven of the eight primary constructs by standardizing scores from the scales on the self‐report assessments. Standardized scores were used so that comparisons between con‐structs could be made more easily and to create a single measure for constructs assessed by multiple self‐report assessments. Scores were standardized by centering on the mean of the entire sample at the first assessment and dividing by the standard deviation. A composite score was computed by standardizing each assessment and averaging the standardized scores across the individual assessments as the composite score. Reliabilities for these composites are presented in the discussion of each construct.
Anxiety Construct. Anxiety was measured by eight self‐report variables assessed at each time period. The self‐report measures used to create the anxiety composite score were the State and Trait subscales from the State‐Trait Anxiety Inventory (STAI; Spielberger, Gorsuch, & Lushene, 1970); the Obsessive‐Compulsive, An‐xiety, and Phobic Anxiety subscales from the Brief Symptom Inventory (BSI; Derogatis, 1993); the Negative

METHOD 23
Affect subscale from the Personality Assessment Screener (PAS; Morey, 1997); the Tension‐Anxiety subscale from the Profile of Mood States (POMS; McNair, Lorr, & Droppleman, 1992); and the Panic Disorder subscale from the PSI. The following PSI items were included on the Panic Disorder subscale: 2, 6, 10, 13, 16, 17, 20, 25, and 30.
Internal consistency reliabilities were computed for each assessment period for the entire sample. The mean Cronbach’s alpha across individual anxiety measures and time periods was .87 (range = .60 to .95). The Cronbach’s alphas for the composite ranged between .89 and .91 for the six time periods. Reliabilities were similar across testing intervals, and they were similar to internal consistency estimates from normative sam‐ples. Test‐retest correlations between sequential time periods ranged between .49 and .86 (M = .76) indicat‐ing reasonable stability over 3 month assessment periods. The validity coefficients between self‐assessments of the anxiety construct indicated evidence for convergent validity, with correlations between measures ranging from .36 to .85 (M = .65) across all time periods.
Cognitive Impairment Construct. Cognitive impairment was assessed by two individually administered tests. The Saint Louis University Memory Scale (SLUMS; Tariq, Tumosa, Chibnall, Perry, & Morely, 2006) was used to assess orientation, memory, attention, and executive function. The SLUMS is an 11‐item scale and yields a single total score ranging from 0 to 30, where higher scores indicate stronger cognitive abilities. The Trail Making Test (TMT; Reitan, 1958) was used to assess attention. The time required to complete the A (con‐nect sequential numbers) and B (connect alternating numbers and letters) tasks were collected, and the ra‐tio of times (B/A) was used as the attention measure in subsequent analyses.
The SLUMS demonstrated low internal consistency with a mean Cronbach’s alpha of .52 across groups and time periods (range = .48 to .60). We could not find comparative information on this newly developed measure. Because this is a multidimensional measure of cognitive function, internal consistency may not be the correct assessment of quality. The correlations between sequential time periods ranged from .38 to .84 (M = .67), indicating good test‐retest reliability. The Trails B/A ratio and SLUMS total score were negatively correlated (range = ‐.17 to ‐.31), as would be expected because the tests are scaled in opposite directions; however, these correlations are fairly small, indicating that these two measures are assessing different cog‐nitive functions. Because of the weak correlations between the SLUMS and TMT, each of these assessments was used individually to assess cognitive impairment rather than combining them to yield a composite score.
Depression‐Hopelessness Construct. The depression‐hopelessness construct was assessed using five self‐report measures. The scales used to create this construct were the Beck Hopelessness Scale (BHS; Beck & Steer, 1993), the BSI Depression subscale (Derogatis, 1993), the PAS Negative Affect and Suicidal Thinking subscales (Morey, 1997), and the POMS Depression‐Dejection subscale (McNair et al., 1992).
Internal consistency reliabilities were computed for each assessment period for the entire sample. The mean Cronbach’s alpha across depression measures and time periods was .87 (range = .60 to .96). The Cronbach’s alpha for the composite ranged between .71 and .77 (M = .75) for the six time periods. Internal consistency estimates for the subscales were similar to reliabilities from normative data. The test‐retest correlations for the depression‐hopelessness composite were strong (M = .76, range = .57 to .90) indicating good stability over time. The validity coefficients between self‐assessments of the depression‐hopelessness construct indi‐cated good convergent validity with estimates ranging from .35 to .89 (M = .60) across all measures and time periods.

METHOD 24
Hostility‐Anger Control Construct. The hostility‐anger control composite was assessed using five self‐report measures: the BSI Hostility subscale (Derogatis, 1993); the Anger Control, Hostile Control, and Acting Out subscales on the PAS (Morey, 1997); and the POMS Anger‐Hostility subscale (McNair et al., 1992).
Internal consistency reliabilities were computed for each scale at each assessment period for the entire sample and a mean Cronbach’s alpha of .62 (range = .27 to .94) was obtained. The Cronbach’s alphas for the composite ranged between .54 and .61 (M = .57) for the six time periods. Although these reliabilities were lower than expected, the smaller internal consistency estimates were for the scales with a small number of items (i.e., PAS subscales with two items) and these reliability estimates are similar to other literature. The correlations between sequential time periods ranged between .56 and .84 (M = .75) and suggest that the hostility composite is stable over 3 month periods. The validity coefficients between self‐assessments of the hostility‐anger control construct were quite variable with validity coefficients ranging between .11 and .84 (M =.42) across all measures and time periods; it was the PAS Acting Out and Hostile Control subscales that tended to have lower correlations for this composite. These lower correlations along with the lower compo‐site internal consistency estimates suggest a potential multidimensional construct. Because the composite was stable and the different aspects of hostility‐anger control were relevant to this study, all subscales were kept together for the composite measure. Analyses were conducted without the PAS subscales and the overall study results did not change substantially (results available from the authors upon request), thus all measures were included as part of the composite.
Hypersensitivity Construct. The hypersensitivity construct was measured by two self‐report measures—the Hypersensitivity to External Stimulus subscale of the PSI and the Interpersonal Sensitivity subscale of the BSI (Derogatis, 1993). Items 1, 7, 31, 34, and 37 were included on the PSI Hypersensitivity to External Stimulus subscale. This composite is assessing two different aspects of hypersensitivity—environmental and interper‐sonal.
Internal consistency reliabilities computed for each scale at each assessment period for the entire sample indicated highly variable internal consistency estimates (.22 to .86) with a mean estimate of .56. However, examination of each scale showed that the BSI had strong internal consistency estimates (.71 to .86) whereas the PSI has low estimates (.22 to .39). The PSI was created by the researchers and its purpose was to capture variables not measured by existing measures, thus it may not be a homogeneous construct. Although inter‐nal consistency estimates of the composite were low (.47 to .61 with M = .53), the composite showed good test‐retest reliability (.21 to .80 with a mean of .63) and the correlations between these two subscales pro‐vided evidence of convergent validity (range = .31 to .44); thus these scales were analyzed in the rest of the study as a composite variable. Analyses using each measure separately are available from the researchers upon request.
Psychosis Construct. The psychosis construct was assessed by three self‐report measures. These included the Paranoid Ideation and Psychoticism subscales of the BSI (Derogatis, 1993) and the Psychotic Features subs‐cale of the PAS (Morey, 1997).
Internal consistency estimates for the subscales ranged between .62 and .83 (M = .77) and estimates for the composite ranged between .73 and .80 (M = .78) indicating adequate internal consistency estimates for this composite and its components. Internal consistency estimates for the subscales were similar to those found with normative samples. Test‐retest correlations between sequential time periods indicated strong stability over time (range .52 to .87 with a mean correlation of .71). The validity coefficients between self‐

METHOD 25
assessments of the psychosis construct provided evidence of convergent validity, ranging between .35 and .79 (M = .63) across all measures and time periods.
Somatization Construct. The somatization construct was measured by four self‐report assessments, includ‐ing the Somatization subscale of the BSI (Derogatis, 1993), the Health Problems subscale of the PAS (Morey, 1997), the POMS Fatigue‐Inertia subscale (McNair et al., 1992), and the Physical Symptoms subscale of the PSI. Items 5, 8, 11, 15, 19, 24, 27, and 28 were included on the PSI Physical Symptoms subscale.
The mean Cronbach’s alpha across somatization measures and time periods was .79 (range = .56 to .94) and for the composite the mean alpha was .77 (range = .73 to .79). Test‐retest reliability estimates were strong with correlations ranging between .58 and .86 (M = .76). The correlations between the self‐assessments of the somatization construct indicated good convergent validity with coefficients ranging between .38 and .67 (M = .54) across all measures and time periods.
Withdrawal‐Alienation Construct. The withdrawal‐alienation construct was assessed using two PAS subs‐cales—Alienation and Social Withdrawal. Internal consistency reliabilities were computed for each assess‐ment period for the entire sample and the median Cronbach’s alpha across withdrawal‐alienation measures and time periods was .75 (range = .69 to .83). The Cronbach’s alphas for the composite ranged between .62 and .71 (M = .67) for the six time periods. Correlations between sequential time periods (range = .49 to .87; M = .68) indicated stability. Reliabilities were similar across testing intervals and were similar to reliabilities found in the normative samples. The correlations between the subscales used in the withdrawal‐alienation construct indicated good convergent validity with coefficients ranging between .45 and .55 (M = .51) across time periods.
Malingering. The Structured Inventory of Malingered Symptomatology (SIMS; Widows & Smith, 2005) was used to assess malingering on mental health disorders. Scores on five subscales (Psychosis, Neurologic Im‐pairment, Amnestic Disorders, Low Intelligence, and Affective Disorders) were obtained at each testing pe‐riod. The SIMS was used in this study as one of the tools to determine if a participant’s responses may be truthful.
The subscales of the SIMS tended to be positively correlated (range = .19 to .63; M = .51) with each other. The median Cronbach’s alpha across malingering subscales and time periods was .76 (range = .50 to .93). Lower correlations and reliability estimates tended to be with the Affective Disorder and Low Intelligence subscales.
The SIMS manual provides cut‐off scores to suggest malingering on each of the subscales as well as a total score. The cut‐offs were scores greater than 1 for the Psychosis subscale and scores greater than 2 for the Neurological Impairments, Amnestic Disorders, Low Intelligence, and Affective Disorders subscales. The total SIMS scale cut‐off included scores greater than 14.
Personality Disorders. The Coolidge Correctional Inventory (CCI; Coolidge, 2004) was utilized to identify per‐sonality disorders among individuals. For this study, the CCI was used to assess 14 personality disorders identified in the current and past American Psychiatric Association’s (1980, 2000) Diagnostic and Statistical Manuals (DSM): Antisocial, Avoidant, Borderline, Dependent, Depressive, Histrionic, Narcissistic, Obsessive‐Compulsive, Paranoid, Passive‐Aggressive, Sadistic, Schizoid, and Schizotypal. The CCI also has other subs‐cales to assess, among others, DSM Axis I variables, neuropsychological functioning, and response validity.

METHOD 26
For this study we also used the CCI measures of Axis I and personality disorders (Axis II). These variables have been hypothesized as potential predictors of the impact of segregation on psychological distress. Be‐cause personality disorders are considered relatively stable constructs, this measure was given only at the baseline assessment period. Therefore, they were not included in the change over time measures. The me‐dian Cronbach’s alpha across CCI subscales was. 75. The Cronbach’s alphas ranged between .46 and .88 for different subscales.
Self‐Harm Construct. The Deliberate Self‐Harm Inventory (DSHI; Gratz, 2001) was used to assess the delibe‐rate self‐harm history at the initial assessment. The data obtained from the DSHI was coded to provide a quantitative severity rating based on the frequency of the self harming behavior and whether or not the be‐havior resulted in hospitalization. This variable was considered to be a potential predictor of outcomes. The baseline assessment was used to assess lifetime history of self‐harm and each harming behavior was coded as having occurred in lifetime or not occurring. Scores were summed across the 17 items for a total score. This measure is meant to be given as an interview rather than a paper‐and‐pencil test; we modified to fit the testing situation. We had hoped to use this assessment as a repeated measure; however, misunderstanding of instructions did not allow for integrity of the data and only the lifetime assessment of self‐harm was used as a potential predictor of outcomes. The internal consistency estimate for the total score was .84 indicating that it is reasonable to sum the 17 indicators into a total score.
Trauma. The Trauma Symptom Inventory (TSI; Briere, 1995) was used to assess the ongoing impact of trau‐matic history. This measure was selected as a potential predictor of outcomes. This was administered once at the second assessment period. Participants use a 4‐point rating scale for frequency of occurrence (0 – never to 3 – often) of 100 events (e.g., flashbacks, wanting to cry, feeling jumpy) experienced within the last 6 months. Scores are obtained on 3 validity scales and 10 clinical subscales. For this study, the total score was used. The Cronbach’s alpha for the total score was .97.
Staff Ratings
Two measures were completed by prison staff to assess the constructs of interest. The Brief Psychiatric Rat‐ing Scale (BPRS; Ventura, Lukoff, Nuechterlein, Liberman, Green, & Shaner, 1993) was completed by clinical staff and the Prison Behavior Rating Scale (PBRS; Cooke, 1998) was completed by correctional officers and case managers.
Clinician Ratings. The BPRS (Overall & Gorman, 1962) is a 24‐item scale most commonly used to assess pa‐tients with psychiatric disorders. It is designed to assess rapidly changing symptoms (Lukoff, Nuechterlein, & Ventura, 1986; Ventura et al., 1993). It measures positive symptoms, general psychopathology, and affective symptoms. Some items can be rated after observation of the patient; others require clinical interview to ob‐tain the patient’s self report information. Each of the 24 symptom constructs are rated on a 7‐point scale of severity ranging from 1 (not present) to 7 (extremely severe).
Research has indicated that there are five factors: Thought Disorder, Withdrawal, Anxious‐Depressed, Hostil‐ity‐Suspiciousness, and Activity (Burger, Calsyn, Morse, Klinkenberg, & Trusty, 1997; Hedlund & Vieweg, 1980). The BPRS subscales and total scores demonstrated low internal consistency with alpha estimates ranging between .40 and .66 (M = .55); these estimates are lower than those found with normative samples. The correlations between sequential time periods ranged from .23 to .58 (M = .40), indicating moderate sta‐bility over a 6 month period. The BPRS subscales had low correlations with self‐report measures of the same
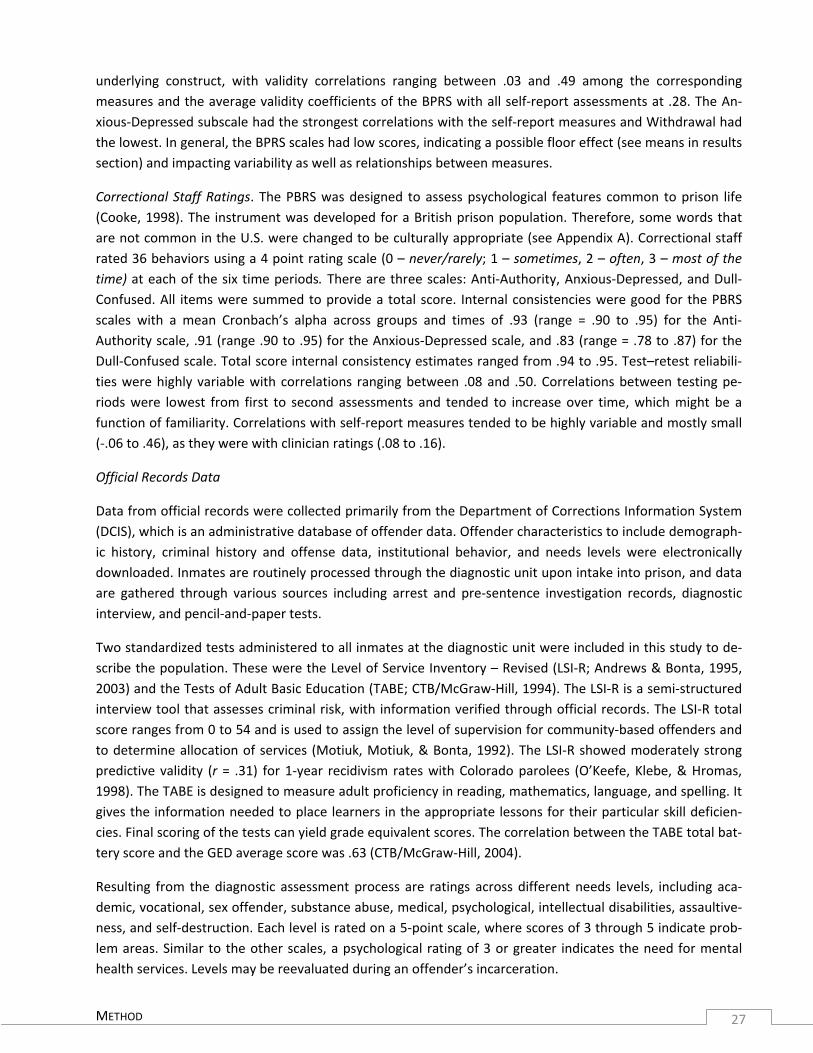
METHOD 27
underlying construct, with validity correlations ranging between .03 and .49 among the corresponding measures and the average validity coefficients of the BPRS with all self‐report assessments at .28. The An‐xious‐Depressed subscale had the strongest correlations with the self‐report measures and Withdrawal had the lowest. In general, the BPRS scales had low scores, indicating a possible floor effect (see means in results section) and impacting variability as well as relationships between measures.
Correctional Staff Ratings. The PBRS was designed to assess psychological features common to prison life (Cooke, 1998). The instrument was developed for a British prison population. Therefore, some words that are not common in the U.S. were changed to be culturally appropriate (see Appendix A). Correctional staff rated 36 behaviors using a 4 point rating scale (0 – never/rarely; 1 – sometimes, 2 – often, 3 – most of the time) at each of the six time periods. There are three scales: Anti‐Authority, Anxious‐Depressed, and Dull‐Confused. All items were summed to provide a total score. Internal consistencies were good for the PBRS scales with a mean Cronbach’s alpha across groups and times of .93 (range = .90 to .95) for the Anti‐Authority scale, .91 (range .90 to .95) for the Anxious‐Depressed scale, and .83 (range = .78 to .87) for the Dull‐Confused scale. Total score internal consistency estimates ranged from .94 to .95. Test–retest reliabili‐ties were highly variable with correlations ranging between .08 and .50. Correlations between testing pe‐riods were lowest from first to second assessments and tended to increase over time, which might be a function of familiarity. Correlations with self‐report measures tended to be highly variable and mostly small (‐.06 to .46), as they were with clinician ratings (.08 to .16).
Official Records Data
Data from official records were collected primarily from the Department of Corrections Information System (DCIS), which is an administrative database of offender data. Offender characteristics to include demograph‐ic history, criminal history and offense data, institutional behavior, and needs levels were electronically downloaded. Inmates are routinely processed through the diagnostic unit upon intake into prison, and data are gathered through various sources including arrest and pre‐sentence investigation records, diagnostic interview, and pencil‐and‐paper tests.
Two standardized tests administered to all inmates at the diagnostic unit were included in this study to de‐scribe the population. These were the Level of Service Inventory – Revised (LSI‐R; Andrews & Bonta, 1995, 2003) and the Tests of Adult Basic Education (TABE; CTB/McGraw‐Hill, 1994). The LSI‐R is a semi‐structured interview tool that assesses criminal risk, with information verified through official records. The LSI‐R total score ranges from 0 to 54 and is used to assign the level of supervision for community‐based offenders and to determine allocation of services (Motiuk, Motiuk, & Bonta, 1992). The LSI‐R showed moderately strong predictive validity (r = .31) for 1‐year recidivism rates with Colorado parolees (O’Keefe, Klebe, & Hromas, 1998). The TABE is designed to measure adult proficiency in reading, mathematics, language, and spelling. It gives the information needed to place learners in the appropriate lessons for their particular skill deficien‐cies. Final scoring of the tests can yield grade equivalent scores. The correlation between the TABE total bat‐tery score and the GED average score was .63 (CTB/McGraw‐Hill, 2004).
Resulting from the diagnostic assessment process are ratings across different needs levels, including aca‐demic, vocational, sex offender, substance abuse, medical, psychological, intellectual disabilities, assaultive‐ness, and self‐destruction. Each level is rated on a 5‐point scale, where scores of 3 through 5 indicate prob‐lem areas. Similar to the other scales, a psychological rating of 3 or greater indicates the need for mental health services. Levels may be reevaluated during an offender’s incarceration.

METHOD 28
Institutional behavior, such as disciplinary violations and involvement in gangs, are recorded electronically over the course of an offender’s incarceration. Disciplinary violations are grouped into three categories ac‐cording to their seriousness. Because patterns were similar when analyzing either violation type or total vi‐olations, only totals are reported. There are three levels of gang involvement: member, associate, and sus‐pect. Levels are ascertained by field intelligence officers who rate offenders’ involvement across 11 items (e.g., self admission, moniker, gang tattoos, identification by law enforcement). Each item carries a weight ranging from 5 to 20 points, and summative scores determine the degree of gang membership or involve‐ment. To clearly delineate offenders actively involved in gangs, only those scored as gang member were considered to have gang involvement in the following analyses.
Certain data elements were collected only for study participants during the course of their participation in the study. The following were collected and coded for the period of time between each testing interval for each participant: the amount of time spent in various settings (e.g., segregation, GP, hospital), phone records, and mental health crisis data. Additionally, activity logs from paper files for the CSP participants were collected and coded.
Phone records were received electronically from the Colorado Inmate Phone System (CIPS). From these records, researchers coded the number of phone calls attempted, the number of calls completed, and the time spent on the phone across all calls.
Mental health staff is required to make a written report in DCIS following any unscheduled mental health visit or crisis. All reports completed for participants during their participation in the study were reviewed and coded by researchers on a 3‐point self‐harm scale (1 – ideation, 2 – self‐harm behavior, 3 – attempted suicide) and whether or not there was a report of a psychotic symptom during the crisis.
Pod activity records are kept by CSP correctional staff and are updated on a daily basis to provide informa‐tion on an offender’s time outside of his cell for shower, exercise, and porter duties. These forms also track the number of times each offender refused or was not offered these activities. Data were coded to reflect a refusal or an activity not offered on a specific day as well as the actual amount of time the offender spent participating in the activity. When the records were unclear or no information was recorded on a specific day, it was coded as unknown. Researchers coded the pod activity sheets for each offender between each testing interval and summed for the number of refusals, days an activity was not offered, unknowns, and average time spent for shower and exercise activities.
PROCEDURES
Study enrollment began July 2007 and ended March 2009, with final testing of all participants completed in March 2010. The project operated under the approval of the institutional review board at the University of Colorado at Colorado Springs (UCCS).
The research team was notified of AS hearings by the case management supervisor at each facility and of SCCF placements by the clinician who scheduled the facility transfers. Notification typically occurred before the hearings or SCCF placement to give the field researcher maximal lead time. Researchers reviewed elec‐tronic records to screen inmates for study eligibility.
Per the UCCS institutional review board, a stipulation was added to provide greater protection to inmates with mental illness. Before consenting them, researchers were required to contact mental health staff, who

METHOD 29
in turn were asked to assess whether the offender would be able to understand the consent form and to weigh the study risks against the benefits. Other than the SCCF group, there were rarely issues. However, it was not uncommon for the SCCF clinician to wait several days or even occasionally weeks for a new arrival to stabilize prior to giving researchers approval to consent participants; these inmates were then included in the study. Two inmates were excluded from the study because clinicians did not believe they had the capaci‐ty to fully understand the consent process; both were SCCF inmates.
The field researcher was a female university employee who completed the full CDOC training academy and had a CDOC badge that permitted her unescorted access to the facilities. In advance of each visit, the field researcher contacted prison security to arrange visits with specific inmates. All inmates were escorted by security staff to the visiting room, which contained a noncontact booth for inmates in AS or punitive segre‐gation conditions. The field researcher met individually with each inmate to review the consent form, which included the general purpose of the study, voluntary nature of participation, risks and benefits, and remune‐ration. Inmates were advised that the purpose of the study was to learn about their adjustment to prison and offenders in prisons across the state were being included in this study. Inmates who agreed to partici‐pate were given $10 for each testing interval. Although this amount may at first seem high for AS inmates who do not have an opportunity to earn income, it was important that AS inmates were compensated at the same rate as GP inmates since the activities were exactly the same. Additionally, all deposits into inmate bank accounts were subject to a 30% restitution recovery fee and deposits to inmates with negative bal‐ances (common among AS inmates) were subject to a 50% reduction of the deposited amount. Therefore, actual payments ranged from $2 to $7.
Inmates were screened for their native language and reading abilities. Although this was done when deter‐mining study eligibility, the field researcher further assessed them at the time of consent. The testing bat‐tery was not available in alternative languages and it was determined that using interpreters could negative‐ly impact the validity of the tests. However, the field researcher attempted to include inmates with border‐line English or reading skills by helping them to understand difficult words. Eighteen inmates across the five study groups were specifically excluded from the study for lacking adequate language or reading abilities.
At the time of consent, the initial test battery was administered. The field researcher instructed participants to read the directions for each test. Instructions were highlighted by researchers when there was an indica‐tion on the test to respond with respect to a certain timeframe (e.g., in the past week). The field researcher administered the timed TMT and the SLUMS tests, and she assisted if they had questions, most frequently with the definition of a word. The researcher collected the test packet immediately following its completion, so it was not ever handled by security staff. At the same time, she visually scanned the packet before the inmate was returned to his cell to ensure that he had not inadvertently skipped a test or section of items.
Prior to leaving the facility, the researcher conducted a further review of inmates’ responses for indications of intent to harm self or others. There were no items that assessed intent to harm others, but numerous items were identified as potential indicators of suicide ideation. Participants were notified at the time of consent that confidentiality would be broken if they responded affirmatively to any of these items. When participants endorsed a suicidal item, the field researcher notified mental health staff and the principal in‐vestigator immediately. Mental health staff then followed up with each case following notification to assess the seriousness or intent to self‐harm. There were no participant suicides during the course of the study.

METHOD 30
The field researcher distributed the PBRS to housing staff at each testing interval and collected the com‐pleted forms upon return visits to the facility. Mental health clinicians were generally notified that a BPRS was needed a couple weeks prior to the researcher testing to give them time to complete the assessment.
In the CSP groups, 18 out of 127 participants were consented and tested prior to their AS hearing. On aver‐age, CSP participants completed their initial test 7 days (SD = 7.3) after their AS hearing. Thirteen partici‐pants in the GP groups were selected from the diversion program (for being at risk of AS placement) and seven were tested prior to an AS hearing. On average, however, GP participants were tested 16 days (SD = 18.9) after their hearing or placement into the diversion program. At the time of consent and the initial test‐ing, 43% of inmates had been confined in segregation (40% in AS groups and 3% in GP groups) for an aver‐age of 18.2 days (SD = 18.1). SCCF participants were tested within 13 days of placement on average (SD = 8.9).
Participants’ data were kept in two separate databases. The eligibility database tracked the eligible pool of offenders, such as identifying information, current location, date of AS hearing or SCCF placement, expected release date, psychiatric status and clinician approval, selection into study or reason for exclusion, and date of consent or refusal. A testing schedule for study participants was incorporated into the database, which also had reporting capabilities in order to manage the project. A separate database tracked participants’ responses to the standardized tests; no identifying information was included in this database other than a secure researcher‐assigned identification number. Both databases were stored on a secured server with access restricted to the project researchers.

RESULTS 31
RESULTS DATA ANALYSIS PLAN
We first present results that speak to the quality of the research design, addressing issues concerning sam‐pling and group representativeness; comparing those who participated fully, partially, or refused to partici‐pate; evaluating the fidelity to confinement conditions; and examining the validity of self‐report responses. Following these analyses, we present results addressing the hypotheses of interest. This study had three goals and related hypotheses:
• To determine which, if any, psychological domains are affected, and in which direction, by the different prison environments; it was hypothesized that offenders in segregation would develop an array of psy‐chological symptoms consistent with the SHU syndrome, characterized by elevations across the eight constructs.
• To assess whether offenders with mental illness decompensate differentially from those without mental illness in AS by testing the hypothesis that both groups will get worse over time but that the rate of de‐terioration would be greater for the mentally ill.
• To compare the impact of AS against other prison conditions by testing the hypothesis that inmates in segregation experience greater psychological deterioration over time compared to inmates in other con‐finement conditions.
To test the first hypothesis, one sample t‐tests are completed to see if study groups are significantly differ‐ent from normative data on the study measures at each time period.
To test the second hypothesis, analysis of variance statistical techniques are used to assess if the AS groups have differential change over time. Comparisons are made on mean change over time for each construct for the mentally ill and non‐mentally ill groups in AS confinement conditions.
To test the third hypothesis, analysis of variance statistical methods are used to assess mean change over time and groups for each construct of interest. In particular, it is of interest to determine whether there is a significant interaction between time and group to indicate that there is differential change over time de‐pending on condition of confinement. An analysis is completed for those with different mental illness status. That is, the mentally ill group in AS is compared to the mentally ill groups in the general prison and in the psychiatric prison, whereas the non‐mentally ill in AS are compared to the non‐mentally ill in the general prison population.
Mean difference statistical results for all three analyses are supplemented with effect size measures assess‐ing proportion of variance accounted for by the time and group variables. Significant main effects will be further investigated using pairwise comparisons to explore group differences and comparisons between means at consecutive time periods to explore time effects. If there is a statistically significant interaction, simple main effects exploring change over time for each group will be completed. All statistical tests are completed at the .05 significance level.
In addition to the analysis of variance methods to explore mean change over time, regression analysis is used to predict change over time using individual variables as potential predictors. Change over time is as‐sessed by computing an individual slope estimate for each person on each construct of interest. Predictors

RESULTS 32
include demographic variables, criminal history variables, personality variables, and confinement conditions. Within each section we describe the data analytical tools used to complete the analyses.
SAMPLING
Group Representativeness
Because random assignment procedures were not engaged, comparisons of offender characteristics across variables routinely collected in DCIS were conducted between eligible inmates and study participants to de‐termine the study sample’s representativeness (see Table 2). Some data are dynamic and, therefore, these data represent those that were current for each offender at the point of his eligibility for the study. The in‐stitutional behavior measures of disciplinary violations and prior AS placement were collected over their en‐tire incarceration up to study eligibility.
Table 2. Representativeness of CSP Study Groups to Eligible Pool
CSP MI CSP NMI
Sample Eligible Pool p Sample Eligible Pool pDemographics (n = 64) (n = 232) (n = 63) (n = 432) Mean age (SD) 31.2 (9.7) 32.1 (9.2) n.s. 30.0 (9.9) 30.4 (8.5) n.s.Ethnicity/Race n.s. n.s.White 41% 45% 19% 27% Hispanic 33% 32% 54% 55% African American 19% 17% 22% 16% Other 8% 6% 5% 2%
High school achievement n.s. n.s.HS diploma 12% 12% 10% 13% HS equivalency 51% 45% 54% 58% Neither 37% 43% 36% 30%
Test of Adult Basic Education Mean reading score (SD) 8.7 (3.6) 8.0 (3.6) n.s. 7.8 (3.3) 8.6 (3.6) n.s.Mean math score (SD) 6.7 (2.5) 6.3 (2.8) n.s. 6.7 (2.5) 7.2 (3.0) n.s.Mean language score (SD) 7.7 (4.0) 7.1 (4.1) n.s. 7.2 (3.8) 7.6 (3.9) n.s.Mean total score (SD) 7.7 (3.5) 7.1 (3.5) n.s. 7.4 (3.4) 7.8 (3.5) n.s.
Sentence and Criminal History Mean prior incarcerations (SD) .5 (0.9) .5 (0.9) n.s. .4 (0.8) .4 (0.7) n.s.Mean felony class 1 – 6 (SD) 3.4 (1.1) 3.7 (1.1) .02 3.2 (1.1) 3.5 (1.1) n.s.Mean LSI‐R (SD) 35.3 (7.4) 34.8 (6.9) n.s. 33.1 (5.8) 33.0 (6.6) n.s.% Sentenced for violent crime 67% 54% .03 70% 59% n.s.Institutional Behavior Mean # disc. violations (SD) 22.0 (27.5) 20.7 (20.1) n.s. 13.2(10.8) 13.9 (14.1) n.s.% Prior AS placement 38% 38% n.s. 32% 29% n.s.% Gang member 30% 33% n.s. 43% 45% n.s.Need Levels (% scored 3‐5) % Academic 42% 45% n.s. 41% 37% n.s.% Vocational 83% 82% n.s. 87% 83% n.s.% Medical 23% 17% n.s. 10% 9% n.s.% Substance abuse 83% 80% n.s. 71% 81% n.s.% Sex offender 44% 33% n.s. 30% 22% n.s.% Intellectual disability 11% 10% n.s. 3% 3% n.s.% Anger 69% 61% n.s. 70% 64% n.s.% Self‐destruction 34% 25% n.s. 10% 9% n.s.

RESULTS 33
Nonparametric chi‐square and t test analyses were conducted for both sets of group comparisons. There were no differences between the CSP NMI study sample and eligible pool. The only difference for the CSP MI group was that study participants had a more serious felony offense, as measured by felony class (class 1 is most se‐rious and class 6 is least) and percent with a violent crime, than individuals in the eligible pool.
Refusals
The field researcher asked inmates who refused to participate or who withdrew their consent for their reasons. Half of them gave no reason for doing so. Of those who listed their reasons, 10 inmates stated general disinter‐est, 6 were skeptical of the research, 4 feared retaliation from their gang or other inmates for participating, 3 listed monetary reasons, and 3 expected imminent release due to an appeal. Chi‐square analyses and t‐tests were conducted between study participants and inmates who refused to participate in the study or withdrew their consent to determine if significant differences existed (see Table 3). The only measured difference between the two groups was that participants had higher LSI‐R scores, which indicates higher recidivism risk.
Table 3. Comparison of Refusals to Study Participants Refusals Participants pDemographics (n = 55) (n = 247)Mean age (SD) 33.2 (10.5) 31.7 (8.9) n.s.Ethnicity/Race n.s.White 44% 40%Hispanic 33% 37%African American 20% 18%Other 4% 5%
High school achievement n.s.HS diploma 23% 13%HS equivalency 42% 56%Neither 36% 32%
Test of Adult Basic Education Mean reading score (SD) 8.2 (3.6) 8.5 (3.5) n.s.Mean math score (SD) 7.1 (3.1) 6.6 (2.8) n.s.Mean language score (SD) 7.9 (4.0) 7.3 (3.9) n.s.Mean total score (SD) 7.8 (3.4) 7.5 (3.5) n.s.
Sentence and Criminal History Mean prior incarcerations (SD) .3 (0.6) .5 (0.8) n.s.Mean felony class 1 – 6 (SD) 3.2 (1.1) 3.4 (1.1) n.s.Mean LSI‐R (SD) 31.4 (7.4) 34.3 (7.3) .02% Sentenced for violent crime 70% 60% n.s.Institutional Behavior # Disciplinary violations 16.9 (24.0) 15.8 (16.8) n.s.% Prior AS placement 26% 23% n.s.% Gang member 22% 28% n.s.Need Levels (% scored 3‐5) % Academic 42% 39% n.s.% Vocational 87% 83% n.s.% Medical 13% 19% n.s.% Substance abuse 70% 79% n.s.% Sex offender 35% 31% n.s.% Intellectual disability 15% 9% n.s.% Anger 72% 60% n.s.% Self‐destruction 24% 23% n.s.

RESULTS 34
Complete and Incomplete Testers
There were 222 participants who completed all testing sessions of the study; thus only 18% of participants did not have all self‐report assessments for every time period. There were a number of reasons why participants did not complete all testing periods: some withdrew their consent, others were paroled before the end of the study, and some were not available for a specific testing interval (e.g., out to court for extended trial). There was not a significant differential incompletion rate across the five study groups, χ2(4, N = 270) = 3.71, p = .45, with incompletion rates of 25% for CSP MI, 16% for CSP NMI, 18% for GP NMI, 15% for GP MI, and 18% for SCCF. Comparisons were made between those who did and did not complete all assessments on demographic, back‐ground variables, and the dependent variables. To compute a score on the dependent variables, the mean across scores for available time periods was computed for the self‐report composites and cognitive variables. Table 4 provides information on these comparisons. Participants who did not complete the entire study had significantly higher self‐destruction needs, higher mean hostility composite scores, and lower cognitive function as demonstrated by significantly lower scores on both measures of cognitive performance (SLUMS, Trails B/A).
Table 4. Comparison of Incomplete to Complete Testers Incomplete Complete pDemographics (n =48) (n =222)Mean age (SD) 31.4 (8.7) 34.1 (10.6) n.s.Ethnicity/Race n.s.White 49% 39%Hispanic 34% 36%African American 13% 20%Other 4% 5%
High school achievement n.s.HS diploma 12% 19%HS equivalency 57% 44%Neither 31% 37%
Test of Adult Basic Education Mean reading score (SD) 8.6 (3.5) 7.7 (3.7) n.s.Mean math score (SD) 6.6 (2.8) 7.1 (3.3) n.s.Mean language score (SD) 7.4 (3.9) 7.5 (4.1) n.s.Mean total score (SD) 7.6 (3.5) 7.4 (3.6) n.s.
Sentence and Criminal History Mean prior incarcerations (SD) 0.5 (0.8) 0.4 (0.8) n.s.Mean felony class 1 – 6 (SD) 3.5 (1.1) 3.2 (1.2) n.s.Mean LSI‐R (SD) 34.0 (7.5) 33.3 (7.5) n.s.% Sentenced for violent crime 65% 61% n.s.Institutional Behavior # Disciplinary violations 15.1 (15.4) 22.5 (28.8) n.s.% Prior AS placement 22% 27% n.s.% Gang member 27% 29% n.s.Need Levels (% scored 3‐5) % Academic 37% 43% n.s.% Vocational 84% 85% n.s.% Medical 18% 15% n.s.% Substance abuse 78% 72% n.s.% Sex offender 32% 30% n.s.% Intellectual disability 9% 13% n.s.% Anger 60% 64% n.s.% Self‐destruction 21% 36% .04

RESULTS 35
Incomplete Complete pComposites and Cognitive Measures Mean Anxiety (SD) ‐.18 (.72) ‐.08 (.80) n.s.Mean Depression‐Hopelessness (SD) ‐.16 (.73) ‐.01 (.76) n.s.Mean Hostility‐Anger Control (SD) ‐.16 (.57) .02 (.65) .05Mean Hypersensitivity (SD) ‐.13 (.68) ‐.12 (.77) n.s.Mean Psychosis (SD) ‐.18 (.75) ‐.06 (.73) n.s.Mean Somatization (SD) ‐.15 (.69) .06 (.82) n.s.Mean Withdrawal‐Alienation (SD) ‐.22 (.63) ‐.03 (.70) n.s.Mean SLUMS (SD) 23.18 (3.36) 22.02 (3.76) .03Mean Trails (SD) 2.82 (0.75) 3.18 (1.12) .01
The amount of complete data was higher on self‐report assessments (85%) than clinician ratings (76%) and correctional staff ratings (57%). There were significant differences in groups’ completion rates for clinician ratings with the MI groups having more complete data (CSP MI 70%, GP MI 76%, SCCF 75%) than the NMI groups (CSP NMI 56%, GP NMI 58%). There were also significant differences between completion rates for the correctional staff ratings with the GP groups having less complete data (GP NMI 47%, GP MI 49%) than the other three groups (CSP MI 64%, CSP NMI 75%, SCCF 61%).
Group Fidelity to Conditions of Confinement
Participants remained in their assigned group regardless of later placements throughout the prison system. Table 5 summarizes the locations of study participants by group and by testing interval (each interval is the period of time between two assessment periods).
One of the challenges of applied research is the researchers’ lack of control over the independent variable, which in this case is the condition of confinement. Therefore, all offenders in AS were not confined in segre‐gation for their entire period of participation in the study. Over the course of the study, 15 offenders in the CSP MI group were placed in the specialized OMI program; most completed at least three tests prior to the transfer. Some of the inmates placed in CSP were taken to county jail for a court appearance. Conversely, inmates in the GP groups may have at some time during their study participation been placed in punitive segregation or even AS. There were five GP MI and four GP NMI participants who were placed in AS during the course of their segregation; the remainder of GP inmates who had time in segregation were in punitive segregation. Seven of the nine GP inmates were reclassified to AS primarily between the third and fourth assessment periods, one was reclassified after only two tests, and one was reclassified two days prior to his final test.
Due to the contamination across groups, a separate set of analyses were conducted using only the “pure” cases, which included those who only experienced a single condition of confinement during their entire study participation. There were 26 pure cases in the CSP MI group, 39 in the CSP NMI group, 13 in the GP MI, and 11 in the GP NMI. The p values and partial eta‐squares for the self‐report composites were com‐pared for these pure cases and the original study groups. The SCCF group was not included because those participants were expected to transfer from SCCF once stabilization occurred. A result would be considered different if both the p value changed significance and the effect size was not of the same magnitude. Be‐cause of the smaller sample size in the pure group analysis, it might be possible for an effect of the same magnitude to no longer be statistically significant, thus we did not count this as a different result. The same pattern of results was found for both samples (total vs. pure) except on the hypersensitivity composite. For

RESULTS 36
this variable, there was a significant time effect for the entire sample (p = .001, η2 = .026) demonstrating higher scores at the first assessment compared to all other periods but no significant time effect for the pure sample (p = .56, η2 = .009). As it does not appear that changing locations was a major explanation for the results, subsequent analyses included all offenders who participated in the study. (Complete statistical re‐sults are available upon request from the authors.)
Table 5. Number of Days by Location for each Group at each Testing Interval
Group Location Interval 1 Interval 2 Interval 3 Interval 4 Interval 5 n M (days) n M (days) n M (days) n M (days) n M (days)
CSP MI (n = 64)
CSP 62 19.8 60 78.3 57 91.2 50 88.2 44 83.0Other seg 56 88.9 2 4.5 2 9.5 0 ‐‐ 2 10.5SCCF 1 89.0 0 ‐‐ 0 ‐‐ 1 69.0 1 71.0GP 4 43.8 3 31.0 7 63.0 8 74.6 15 75.7Othera 6 32.0 5 12.4 9 8.9 5 20.2 5 14.2
CSP NMI (n = 63)
CSP 59 14.2 57 82.7 56 92.2 56 92.7 54 91.4Other seg 57 90.3 2 3.5 2 43.0 0 ‐‐ 0 ‐‐SCCF 0 ‐‐ 0 ‐‐ 0 ‐‐ 0 ‐‐ 0 ‐‐GP 4 5.0 0 ‐‐ 0 ‐‐ 0 ‐‐ 3 62.3Othera 5 39.0 5 8.4 2 15.5 4 1.8 1 1.0
GP MI (n = 33)
CSP 0 ‐‐ 0 ‐‐ 4 24.3 4 80.5 ‐‐Other seg 9 12.4 7 23.0 9 34.2 6 30.7 ‐‐SCCF 0 ‐‐ 0 ‐‐ 0 ‐‐ 0 ‐‐ ‐‐GP 32 87.2 32 89.9 27 84.8 25 88.8 ‐‐Othera 0 ‐‐ 3 1.0 1 1.0 1 11.0 ‐‐
GP NMI (n = 43)
CSP 0 ‐‐ 0 ‐‐ 0 ‐‐ 0 ‐‐ ‐‐Other seg 10 39.8 9 13.3 5 39.6 15 37.9 ‐‐SCCF 0 ‐‐ 0 ‐‐ 0 ‐‐ 1 46.0 ‐‐GP 41 79.2 41 89.1 39 85.3 35 83.7 ‐‐Othera 2 23.5 4 11.5 2 12.5 2 2.5 ‐‐
SCCF (n = 67)
CSP 0 ‐‐ 0 ‐‐ 0 ‐‐ 1 53.0 ‐‐Other seg 1 37.0 4 7.5 4 10.3 8 24.0 ‐‐SCCF 64 77.3 54 79.1 40 92.4 34 80.6 ‐‐GP 7 26.6 21 66.2 24 77.3 29 75.6 ‐‐Othera 5 12.0 6 32.5 3 39.7 6 9.7 ‐‐
Note. Individuals may have multiple locations within a study period, so the n’s within a group and interval can be larger than the group sample size. a Other included out to court (county jail), in custody of US Marshall, hospital or external medical, community placement, and time in transport.
VALIDITY OF RESPONSES
Most of the assessments used in this study were self‐report measures, which always carry the risk of not being completed accurately by the participant. Because of this risk, several measures were collected to as‐sess the validity of individual responses.
During data collection and data entry, responses were scanned for abnormal pattern of responses (e.g., the same response selected for all items). Each person’s pattern of response was coded as potentially question‐able or not. If the pattern was noticed during data collection, then the participant was questioned about his response pattern and asked to redo the test if he admitted to not being truthful. If the participant said he was being honest and the researcher still did not believe him, she marked the test as questionable. Overall, 12% of participants had a questionable response pattern on any measure at any time period (see Table 6);
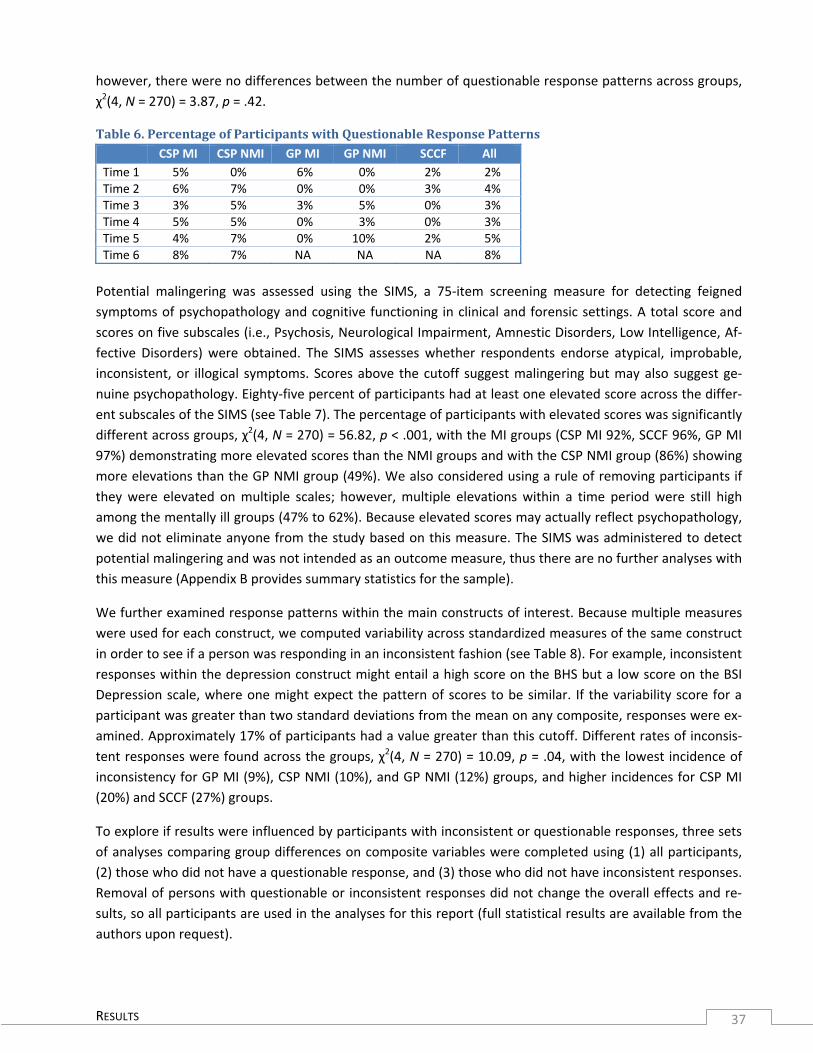
RESULTS 37
however, there were no differences between the number of questionable response patterns across groups, χ2(4, N = 270) = 3.87, p = .42.
Table 6. Percentage of Participants with Questionable Response Patterns
CSP MI CSP NMI GP MI GP NMI SCCF AllTime 1 5% 0% 6% 0% 2% 2%Time 2 6% 7% 0% 0% 3% 4%Time 3 3% 5% 3% 5% 0% 3%Time 4 5% 5% 0% 3% 0% 3%Time 5 4% 7% 0% 10% 2% 5%Time 6 8% 7% NA NA NA 8%
Potential malingering was assessed using the SIMS, a 75‐item screening measure for detecting feigned symptoms of psychopathology and cognitive functioning in clinical and forensic settings. A total score and scores on five subscales (i.e., Psychosis, Neurological Impairment, Amnestic Disorders, Low Intelligence, Af‐fective Disorders) were obtained. The SIMS assesses whether respondents endorse atypical, improbable, inconsistent, or illogical symptoms. Scores above the cutoff suggest malingering but may also suggest ge‐nuine psychopathology. Eighty‐five percent of participants had at least one elevated score across the differ‐ent subscales of the SIMS (see Table 7). The percentage of participants with elevated scores was significantly different across groups, χ2(4, N = 270) = 56.82, p < .001, with the MI groups (CSP MI 92%, SCCF 96%, GP MI 97%) demonstrating more elevated scores than the NMI groups and with the CSP NMI group (86%) showing more elevations than the GP NMI group (49%). We also considered using a rule of removing participants if they were elevated on multiple scales; however, multiple elevations within a time period were still high among the mentally ill groups (47% to 62%). Because elevated scores may actually reflect psychopathology, we did not eliminate anyone from the study based on this measure. The SIMS was administered to detect potential malingering and was not intended as an outcome measure, thus there are no further analyses with this measure (Appendix B provides summary statistics for the sample).
We further examined response patterns within the main constructs of interest. Because multiple measures were used for each construct, we computed variability across standardized measures of the same construct in order to see if a person was responding in an inconsistent fashion (see Table 8). For example, inconsistent responses within the depression construct might entail a high score on the BHS but a low score on the BSI Depression scale, where one might expect the pattern of scores to be similar. If the variability score for a participant was greater than two standard deviations from the mean on any composite, responses were ex‐amined. Approximately 17% of participants had a value greater than this cutoff. Different rates of inconsis‐tent responses were found across the groups, χ2(4, N = 270) = 10.09, p = .04, with the lowest incidence of inconsistency for GP MI (9%), CSP NMI (10%), and GP NMI (12%) groups, and higher incidences for CSP MI (20%) and SCCF (27%) groups.
To explore if results were influenced by participants with inconsistent or questionable responses, three sets of analyses comparing group differences on composite variables were completed using (1) all participants, (2) those who did not have a questionable response, and (3) those who did not have inconsistent responses. Removal of persons with questionable or inconsistent responses did not change the overall effects and re‐sults, so all participants are used in the analyses for this report (full statistical results are available from the authors upon request).

RESULTS 38
Table 7. Elevation on SIMS Scales CSP MI CSP NMI GP MI GP NMI SCCF AllAffective Disorders Time 1 59% 35% 55% 16% 72% 49%Time 2 60% 28% 58% 12% 69% 47%Time 3 68% 36% 62% 17% 69% 52%Time 4 58% 39% 59% 13% 59% 47%Time 5 41% 29% 55% 13% 65% 41%Time 6 61% 37% NA NA NA 48%Neurological Impairment Time 1 52% 32% 48% 21% 67% 46%Time 2 42% 30% 42% 17% 58% 40%Time 3 42% 33% 56% 12% 56% 40%Time 4 48% 41% 45% 10% 51% 41%Time 5 43% 25% 45% 16% 46% 35%Time 6 41% 24% NA NA NA 32%Psychosis Time 1 47% 29% 46% 7% 76% 43%Time 2 50% 22% 36% 12% 69% 41%Time 3 53% 24% 38% 15% 64% 41%Time 4 52% 23% 34% 10% 61% 39%Time 5 39% 18% 28% 10% 60% 33%Time 6 39% 18% NA NA NA 29%Low Intelligence Time 1 11% 5% 3% 2% 12% 7%Time 2 10% 7% 12% 2% 11% 8%Time 3 17% 9% 3% 2% 13% 10%Time 4 13% 9% 10% 8% 10% 10%Time 5 12% 11% 3% 0% 9% 8%Time 6 16% 11% NA NA NA 12%Amnestic Disorders Time 1 20% 2% 21% 2% 33% 16%Time 2 26% 5% 15% 2% 40% 20%Time 3 23% 5% 12% 0% 31% 16%Time 4 22% 7% 24% 3% 30% 18%Time 5 16% 5% 17% 0% 26% 14%Time 6 16% 4% NA NA NA 9%Total Score Time 1 50% 29% 46% 7% 78% 44%Time 2 50% 22% 48% 10% 72% 42%Time 3 57% 26% 53% 7% 60% 42%Time 4 52% 27% 48% 10% 61% 41%Time 5 41% 27% 41% 8% 53% 35%Time 6 45% 24% NA NA NA 34%

RESULTS 39
Table 8. Potentially Inconsistent Responses within a Composite Score CSP MI CSP NMI GP MI GP NMI SCCF AllAnxiety Time 1 0% 0% 0% 0% 0% 0%Time 2 0% 2% 0% 0% 2% 1%Time 3 0% 0% 0% 0% 0% 0%Time 4 0% 0% 0% 0% 0% 0%Time 5 0% 0% 0% 0% 2% 0%Time 6 0% 0% NA NA NA 0%Depression‐Hopelessness Time 1 0% 0% 0% 0% 0% 0%Time 2 0% 0% 0% 0% 2% 0%Time 3 0% 0% 0% 0% 0% 0%Time 4 2% 0% 0% 0% 0% 0%Time 5 2% 0% 0% 0% 0% 0%Time 6 0% 0% NA NA NA 0%Hostility‐Anger Control Time 1 5% 0% 0% 0% 2% 2%Time 2 6% 2% 0% 0% 3% 3%Time 3 3% 4% 0% 0% 3% 2%Time 4 5% 2% 0% 0% 5% 3%Time 5 5% 4% 0% 0% 2% 2%Time 6 0% 2% NA NA NA 1%Hypersensitivity Time 1 8% 3% 9% 5% 12% 7%Time 2 6% 2% 9% 0% 8% 5%Time 3 5% 4% 9% 2% 12% 6%Time 4 9% 7% 7% 3% 12% 8%Time 5 4% 2% 10% 5% 9% 6%Time 6 12% 2% NA NA NA 7%Psychosis Time 1 5% 2% 3% 0% 6% 3%Time 2 2% 0% 0% 0% 0% 0%Time 3 0% 0% 0% 2% 0% 0%Time 4 2% 0% 0% 0% 0% 0%Time 5 2% 4% 0% 0% 2% 2%Time 6 4% 2% NA NA NA 3%Somatization Time 1 2% 0% 0% 2% 2% 1%Time 2 0% 2% 0% 0% 0% <1%Time 3 7% 2% 0% 0% 0% 2%Time 4 3% 2% 0% 0% 0% 1%Time 5 2% 2% 3% 0% 0% 1%Time 6 0% 0% NA NA NA 0%Withdrawal‐Alienation Time 1 2% 2% 0% 5% 4% 3%Time 2 2% 3% 0% 5% 3% 12%Time 3 2% 4% 6% 2% 2% 3%Time 4 0% 2% 0% 3% 2% 1%Time 5 4% 2% 0% 3% 2% 2%Time 6 6% 4% NA NA NA 5%
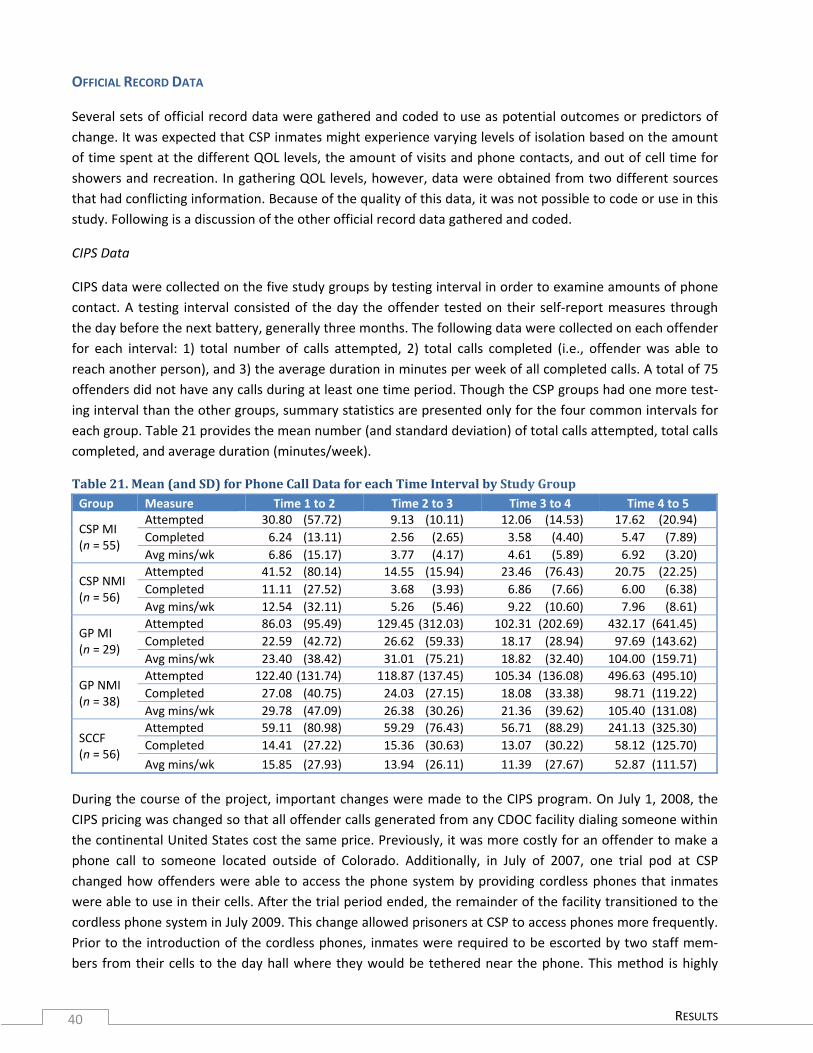
RESULTS 40
OFFICIAL RECORD DATA
Several sets of official record data were gathered and coded to use as potential outcomes or predictors of change. It was expected that CSP inmates might experience varying levels of isolation based on the amount of time spent at the different QOL levels, the amount of visits and phone contacts, and out of cell time for showers and recreation. In gathering QOL levels, however, data were obtained from two different sources that had conflicting information. Because of the quality of this data, it was not possible to code or use in this study. Following is a discussion of the other official record data gathered and coded.
CIPS Data
CIPS data were collected on the five study groups by testing interval in order to examine amounts of phone contact. A testing interval consisted of the day the offender tested on their self‐report measures through the day before the next battery, generally three months. The following data were collected on each offender for each interval: 1) total number of calls attempted, 2) total calls completed (i.e., offender was able to reach another person), and 3) the average duration in minutes per week of all completed calls. A total of 75 offenders did not have any calls during at least one time period. Though the CSP groups had one more test‐ing interval than the other groups, summary statistics are presented only for the four common intervals for each group. Table 21 provides the mean number (and standard deviation) of total calls attempted, total calls completed, and average duration (minutes/week).
Table 21. Mean (and SD) for Phone Call Data for each Time Interval by Study Group Group Measure Time 1 to 2 Time 2 to 3 Time 3 to 4 Time 4 to 5
CSP MI (n = 55)
Attempted 30.80 (57.72) 9.13 (10.11) 12.06 (14.53) 17.62 (20.94)Completed 6.24 (13.11) 2.56 (2.65) 3.58 (4.40) 5.47 (7.89)Avg mins/wk 6.86 (15.17) 3.77 (4.17) 4.61 (5.89) 6.92 (3.20)
CSP NMI (n = 56)
Attempted 41.52 (80.14) 14.55 (15.94) 23.46 (76.43) 20.75 (22.25)Completed 11.11 (27.52) 3.68 (3.93) 6.86 (7.66) 6.00 (6.38)Avg mins/wk 12.54 (32.11) 5.26 (5.46) 9.22 (10.60) 7.96 (8.61)
GP MI (n = 29)
Attempted 86.03 (95.49) 129.45 (312.03) 102.31 (202.69) 432.17 (641.45)Completed 22.59 (42.72) 26.62 (59.33) 18.17 (28.94) 97.69 (143.62)Avg mins/wk 23.40 (38.42) 31.01 (75.21) 18.82 (32.40) 104.00 (159.71)
GP NMI (n = 38)
Attempted 122.40 (131.74) 118.87 (137.45) 105.34 (136.08) 496.63 (495.10)Completed 27.08 (40.75) 24.03 (27.15) 18.08 (33.38) 98.71 (119.22)Avg mins/wk 29.78 (47.09) 26.38 (30.26) 21.36 (39.62) 105.40 (131.08)
SCCF (n = 56)
Attempted 59.11 (80.98) 59.29 (76.43) 56.71 (88.29) 241.13 (325.30)Completed 14.41 (27.22) 15.36 (30.63) 13.07 (30.22) 58.12 (125.70)
Avg mins/wk 15.85 (27.93) 13.94 (26.11) 11.39 (27.67) 52.87 (111.57)
During the course of the project, important changes were made to the CIPS program. On July 1, 2008, the CIPS pricing was changed so that all offender calls generated from any CDOC facility dialing someone within the continental United States cost the same price. Previously, it was more costly for an offender to make a phone call to someone located outside of Colorado. Additionally, in July of 2007, one trial pod at CSP changed how offenders were able to access the phone system by providing cordless phones that inmates were able to use in their cells. After the trial period ended, the remainder of the facility transitioned to the cordless phone system in July 2009. This change allowed prisoners at CSP to access phones more frequently. Prior to the introduction of the cordless phones, inmates were required to be escorted by two staff mem‐bers from their cells to the day hall where they would be tethered near the phone. This method is highly

RESULTS 41
staff intensive and because of other required staff duties, staff were not always able to escort offenders to the phone when requested.
The changes in the CIPS program makes interpretation of change over time difficult; it also impacts group comparisons because group assessments did not occur evenly over the study period (e.g., because there were a smaller number of potential CSP MI participants, we started data collection activities earlier for that group). Thus, further statistical analyses were not completed on these data because it is difficult to know to what causes any potential findings could be attributed.
Pod Activity Data
Pod activity data were collected on the two CSP groups. Pod activity data were gathered from records that housing staff at CSP keep on every offender at the facility to track offenders’ exercise and shower habits. Researchers were provided access to this data for use in the study. Data were coded by testing interval (i.e., activities that occurred from one testing period until the next testing period). The following data were col‐lected on each offender: 1) number of days each offender refused an offer to exercise and/or shower, 2) number of days each offender was not offered exercise and/or shower, 3) average number of hours per week an offender participated in exercise and/or shower, 4) the number of days the prisoner participated in exercise and/or shower, and 5) the number of unknowns for recreation and/or shower in that time period. Pod activity data also track an inmate’s work record, but because so few participants held jobs during the study period, this data was not included. Table 22 provides the mean number (and standard deviation) for each variable by group and testing interval.
Table 22. Summary Statistics for Pod Activities (Exercise and Showers) Activity Interval: Time 2 to 3 Time 3 to 4 Time 4 to 5 Time 5 to 6Exercise Activity M SD M SD M SD M SD
CSP MI (n = 61)
Days refused 26.02 12.43 29.52 16.38 30.18 17.47 29.74 19.38Days not offered 1.85 2.06 2.39 1.92 2.92 2.50 3.28 3.54Hours per week 0.71 1.02 0.98 1.17 0.98 1.26 1.00 1.19Days of activity 9.23 12.33 13.41 15.61 14.10 16.99 14.54 17.17Unknown 43.95 12.08 47.69 12.59 46.30 15.34 46.1 23.34
CSP NMI (n = 61)
Days refused 22.10 13.35 23.28 14.98 28.25 15.73 29.48 16.08Days not offered 2.16 2.05 2.80 1.78 2.69 2.16 4.59 5.27Hours per week 1.41 1.05 1.41 1.22 1.48 1.16 1.68 1.24Days of activity 18.00 13.23 20.69 16.46 22.07 16.12 23.66 17.39Unknown 41.49 9.80 44.20 12.29 39.82 6.99 37.39 9.47
Shower Activity M SD M SD M SD M SD
CSP MI (n = 61)
Days refused 9.90 10.36 12.74 12.76 12.61 12.55 12.28 12.97Days not offered 1.30 1.54 1.61 1.57 1.90 2.01 2.34 3.14Hours per week 1.41 0.59 1.43 0.65 1.37 0.68 1.22 0.64Days of activity 36.07 14.61 39.69 17.01 39.49 19.06 36.44 18.91Unknown 33.79 14.02 38.98 15.78 39.49 17.38 42.59 26.65
CSP NMI (n = 61)
Days refused 6.82 9.74 7.02 9.35 10.00 12.20 10.36 10.69Days not offered 1.44 1.36 1.77 1.43 1.93 1.97 3.52 5.09Hours per week 1.75 0.42 1.75 0.51 1.70 0.53 1.73 0.58Days of activity 44.07 9.77 48.95 12.58 48.70 12.80 50.13 14.92Unknown 31.41 6.13 33.23 8.46 32.18 5.02 31.1 7.19

RESULTS 42
Due to problems with coding this data, it was not felt that further analyses could be run. As was previously noted, the data were collected from records that CSP staff were already keeping on offenders and it was often difficult to decipher and/or interpret the records. For example, if a variable was left blank it was not known if that meant the offender was not offered the activity or if he refused to participate resulting in much of the data being coded as unknown.
Mental Health Crisis Data
Any situation that is not a scheduled appointment and requires immediate psychological intervention is consi‐dered a crisis event; crisis events are documented by clinicians in DCIS. For this study, these events were re‐viewed and coded for whether there was self‐harming ideation or behavior and whether there was a report of an inmate experiencing at least one symptom commonly associated with psychosis. A total of 36 participants had a self‐harming ideation or behavior or a report of altered thought patterns commonly associated with psychosis (see Figures 29 and 30). The self‐harm data were coded into three categories to indicate a range from self‐harm ideation to suicide attempt. Psychotic symptoms were reported as a single category, but the researchers used a low standard in coding psychotic symptoms. If there was any mention of hallucinations or delusionary thoughts, even if not observed by the clinician or if denied by the offender, the crisis event was coded as having a psychotic symptom. For example, one participant had threatened self‐injurious behavior but also reported the presence of visual hallucinations in the past; this was also coded as a psychotic symptom even though the clinician stated that there was no evidence for psychosis. It should be noted that some events involved both symptoms of psychosis and self‐harming ideation/behaviors; therefore case numbers represent the same person on both graphs.
There are several limitations of these data. These include that self‐harming ideation/behavior or psychotic symp‐toms could have occurred without staff’s knowledge, offenders may have discussed or exhibited thoughts or be‐haviors on these dimensions during regularly scheduled mental health appointments, and offenders’ self‐harming histories prior to study entry were unknown. For example, it was clear from the crisis notes that an individual with numerous crisis events had a long history of self‐harming behavior and SCCF placements prior to his enroll‐ment in the study; this is not reflected in the data. Furthermore, the reason for the self‐harming idea‐tion/behavior is not captured in the graphed data, but the reasons vary widely. As an example, one offender threatened suicide because he did not want to be removed from CSP to be placed in a new program for offenders with mental illness located at a lower security facility. In another example, one person reported self‐harming be‐havior due to a recent automobile accident where several family members died. Therefore, without more infor‐mation, it is not possible to attribute the reasons for their mental health crisis to their confinement setting.
We were interested in including the crisis data as an outcome measure in the change over time analyses in order to determine if the occurrence of crises was impacted by confinement conditions, mental status, and time. Be‐cause the number of participants who experienced a crisis event was so small, it was not possible to include this variable as an outcome measure in the change over time analyses. These data raise more questions than they provide answers; it was determined that further case study of participants’ mental health histories was outside the scope of the current research.

RESULTS 43
Figure 29. Crisis Events by Individual Participants who had SelfHarming Ideation or Behavior

RESULTS 44
Figure 30. Crisis Events by Individual Participants who had a Psychotic Symptom

RESULTS 45
GROUP COMPARISONS
Offender Characteristics
Study groups differed from each other at entry into the study in a number of statistically significant ways (see Table 9). Some differences were consistent with their AS placement or the mental health needs of the groups. The two CSP groups were more likely to have a prior AS placement and to have higher anger needs. The three mentally ill groups (CSP MI, GP MI, SCCF) had higher needs for medical and intellectual disability services. The CSP MI and SCCF groups had higher self destruction needs and were less likely to be gang members. The two GP groups had the lowest rates of sex offender treatment needs. Finally, ethnic/racial composition was different for each of the groups, with more whites in the GP MI and SCCF groups and more Hispanics in the CSP NMI group.
Table 9. Study Group Comparisons on Offender Characteristics CSP MI CSP NMI GP MI GP NMI SCCF pDemographics Mean age (SD) 31.2 (9.7) 30.0 (9.9) 30.2 (7.8) 33.5 (7.5) 33.9 (8.7) n.s.Ethnicity/Race .01White 41% 19% 52% 40% 55%Hispanic 33% 54% 39% 33% 24%African American 19% 22% 9% 26% 15%Other 8% 5% 0% 2% 6%
High school achievement n.s.HS diploma 12% 10% 7% 18% 19%HS equivalency 51% 54% 58% 63% 50%Neither 37% 36% 36% 20% 31%
Test of Adult Basic Education Mean reading score (SD) 8.7 (3.6) 7.8 (3.3) 8.7 (3.0) 10.2 (3.0) 7.7 (3.7) .01Mean math score (SD) 6.7 (2.5) 6.7 (2.5) 6.9 (2.6) 7.1 (3.3) 6.5 (3.4) n.s.Mean language score (SD) 7.7 (4.0) 7.2 (3.8) 7.9 (3.5) 7.8 (4.1) 7.0 (4.2) n.s.Mean total score (SD) 7.7 (3.5) 7.4 (3.4) 7.8 (3.0) 8.3 (3.8) 7.1 (3.7) n.s.
Sentence and Criminal History Mean prior incarcerations (SD) 0.5 (0.9) 0.4 (0.8) 0.4 (0.6) 0.5 (0.7) 0.7 (0.9) n.s.Mean felony class 1 – 6 (SD) 3.4 (1.1) 3.1 (1.1) 3.6 (1.1) 3.5 (1.0) 3.6 (1.0) n.s.Mean LSI‐R (SD) 35.3 (7.4) 33.1 (5.8) 35.4 (8.6) 31.8 (7.0) 33.7 (8.5) n.s.% Sentenced for violent crime 67% 70% 61% 54% 54% n.s.Institutional Behavior # Disciplinary violations 22.0 (27.5) 13.2 (10.8) 17.2 (15.3) 16.0 (15.5) 14.2 (16.6) n.s.% Prior AS placement 38% 32% 27% 19% 0% <.001% Gang member 30% 43% 21% 33% 10% <.001Need Levels (% scored 3‐5) % Academic 42% 41% 39% 26% 40% n.s.% Vocational 83% 87% 88% 77% 85% n.s.% Medical 23% 10% 18% 7% 27% .02% Substance abuse 83% 71% 91% 78% 71% n.s.% Sex offender 44% 30% 24% 14% 37% .02% Intellectual disability 11% 3% 9% 0% 20% .01% Anger 69% 70% 56% 51% 52% n.s.% Self‐destruction 34% 10% 16% 10% 39% <.001

RESULTS 46
NORMATIVE COMPARISONS
Because we used standardized assessments, normative data were available to compare to the study groups. Normative means were based on non‐clinical male samples when available; a general adult sample was used if a male sample was not available. If only clinical sample normative data were available then those were used. Figures 3 to 10 provide the means over time for the measures with total scores for each study group along with highlighted cutoff score ranges. Each graph shows the possible range of scores on the y axis. Fig‐ures 3 to 10 are presented for visual reference only; analyses are conducted in later sections. Normative comparisons for subscales used in this study are available in Appendix B.
Figure 3. Mean Scores over Time for the BHS Total Score by Group

RESULTS 47
Figure 4. Mean Scores over Time for the BSI Global Symptom Index by Group
Figure 5. Mean Scores over Time for the PAS Total Score by Group
Test 1 Test 2 Test 3 Test 4 Test 5
Low 0.00 0.00 0.00 0.00 0.00
Normal 0.06 0.06 0.06 0.06 0.06
Moderate 0.46 0.46 0.46 0.46 0.46
Severe 0.87 0.87 0.87 0.87 0.87
CSP MI 1.4 1.23 1.18 1.05 1.08
CSP NMI 0.82 0.58 0.62 0.64 0.61
GP MI 1.22 0.96 1.11 0.93 0.91
GP NMI 0.50 0.37 0.36 0.31 0.27
SCCF 1.61 1.41 1.42 1.47 1.35
0
0.5
1
1.5
2
2.5
3
3.5
4
Mean Group
Score
Test 1 Test 2 Test 3 Test 4 Test 5
Low/Normal 0 0 0 0 0
Mild/Moderate 16 16 16 16 16
Marked 24 24 24 24 24
Extreme 45 45 45 45 45
CSP MI 31.9 32.4 31.7 31.2 30.1
CSP NMI 27.4 26.0 25.9 26.4 25.9
GP MI 32.5 30.5 31.0 28.5 29.0
GP NMI 23.8 23.2 23.0 22.2 22.5
SCCF 35.8 34.2 34.1 34.4 33.6
0
10
20
30
40
50
60
Mean Group
Score

RESULTS 48
Figure 6. Mean Scores over Time for the POMS Total Score by Group
Figure 7. Mean Scores over Time for the STAI State Anxiety Score by Group
Test 1 Test 2 Test 3 Test 4 Test 5
Low ‐32.00 ‐32.00 ‐32.00 ‐32.00 ‐32.00
Normal ‐16.00 ‐16.00 ‐16.00 ‐16.00 ‐16.00
Moderate 53.00 53.00 53.00 53.00 53.00
Severe 83.00 83.00 83.00 83.00 83.00
CSP MI 68.48 61.77 58.21 58.67 52.02
CSP NMI 40.88 29.61 29.68 32.06 27.18
GP MI 70.68 59.33 64.17 55.81 50.01
GP NMI 23.99 12.73 13.78 10.44 8.92
SCCF 77.31 71.07 67.40 71.07 68.43
‐32
18
68
118
168Mean Group
Score
Test 1 Test 2 Test 3 Test 4 Test 5
Low 20.00 20.00 20.00 20.00 20.00
Normal 25.32 25.32 25.32 25.32 25.32
Moderate 46.12 46.12 46.12 46.12 46.12
Severe 56.52 56.52 56.52 56.52 56.52
CSP MI 46.90 45.83 45.45 44.01 42.59
CSP NMI 42.05 38.43 37.39 37.50 37.46
GP MI 47.64 44.53 47.29 45.08 43.77
GP NMI 39.39 36.68 34.65 33.80 33.81
SCCF 50.15 48.41 48.49 49.41 48.29
20
30
40
50
60
70
80
Mean Group
Score

RESULTS 49
Figure 8. Mean Scores over Time for the STAI Trait Anxiety Score by Group
Figure 9. Mean Scores over Time for the SLUMS Total Score by Group
Test 1 Test 2 Test 3 Test 4 Test 5
Low 20.00 20.00 20.00 20.00 20.00
Normal 25.70 25.70 25.70 25.70 25.70
Moderate 44.08 44.08 44.08 44.08 44.08
Severe 53.27 53.27 53.27 53.27 53.27
CSP MI 48.41 47.89 47.48 45.75 44.64
CSP NMI 42.78 38.77 38.40 39.26 38.70
GP MI 49.70 46.59 47.59 45.77 44.07
GP NMI 37.82 35.92 34.44 34.06 32.74
SCCF 54.45 52.64 51.50 52.76 52.27
20
30
40
50
60
70
80
Mean Group
Score
Test 1 Test 2 Test 3 Test 4 Test 5
Dementia 0 0 0 0 0
Mild NC Disorder 20 20 20 20 20
Normal 25 25 25 25 25
CSP MI 20.80 21.16 22.26 22.92 23.59
CSP NMI 21.73 22.64 24.02 24.38 24.25
GP MI 21.52 23.09 23.88 24.34 24.93
GP NMI 23.38 24.12 24.49 24.79 24.82
SCCF 20.54 21.49 22.85 23.38 23.26
0
5
10
15
20
25
30
Mean Group
Score
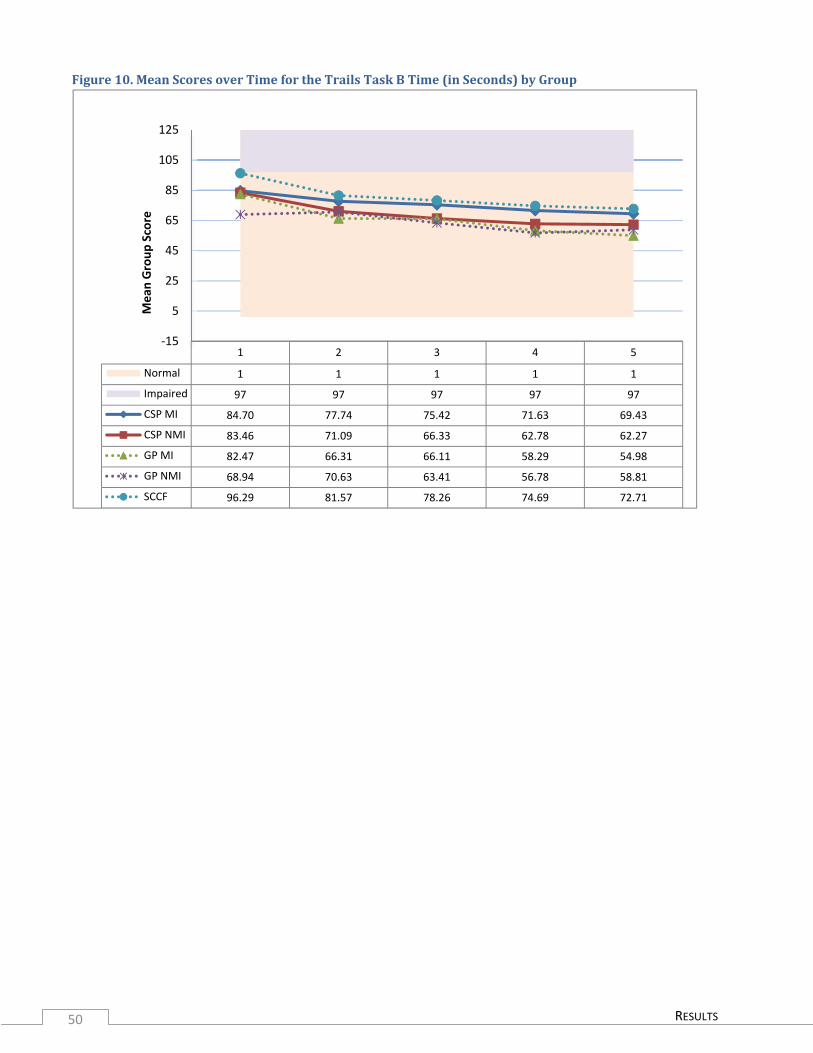
RESULTS 50
Figure 10. Mean Scores over Time for the Trails Task B Time (in Seconds) by Group
1 2 3 4 5
Normal 1 1 1 1 1
Impaired 97 97 97 97 97
CSP MI 84.70 77.74 75.42 71.63 69.43
CSP NMI 83.46 71.09 66.33 62.78 62.27
GP MI 82.47 66.31 66.11 58.29 54.98
GP NMI 68.94 70.63 63.41 56.78 58.81
SCCF 96.29 81.57 78.26 74.69 72.71
‐15
5
25
45
65
85
105
125Mean Group
Score

RESULTS 51
In this section, comparisons were made between each study groups’ mean and the normative mean using a one sample t test. One sample t tests indicated that, in general, scores were elevated above the normative data when entering the study and tended to stay that way for all groups except the GP NMI group. Table 10 provides a visual representation of the significant differences by group at each time period on each meas‐ure.
Table 10. Significant Differences of Study Groups from Normative Means
Measure Norm Mean
Norm Population
CSP MI CSP NMI GP MI GP NMI SCCF
Time Interval: 1 2 3 4 5 6 1 2 3 4 5 6 1 2 3 4 5 1 2 3 4 5 1 2 3 4 5BHS 2.32 College
Students
BHS 6.04 Psychiatric Adult
BSI GSI 0.25 Adult Males
PAS 16.66 Community Sample
POMS 14.80 Adult Males
SLUMS 25.70 Adult (<HS education)
STAI‐S 35.72 Working Adults
STAI‐T 34.89 Working Adults
Trails B/A
2.18 Adult (25 ‐ 54 yrs old)
Note. Red shading indicates that the group mean is significantly different from the normative mean in the direction of more psycho‐logical or cognitive problems, whereas green shading indicates that the group mean is significantly better than the normative mean. No shading indicates the groups were statistically similar to the normative data.
In addition to comparing group means to normative data, the percentage of participants within each group who scored in the elevated range of a measure was computed, using cutoff scores from the manual for moderately severe and above when available or using the percentage scoring beyond two standard devia‐tions from the mean. Table 11 presents this data.
Table 11. Percentage of Participants Scoring above Cutoffs at Time 1 Measure “Abnormal” range CSP MI CSP NMI GP MI GP NMI SCCFBHS ≥ 9 43% 17% 30% 9% 57% BSI GSI ≥ 0.46 28% 5% 19% 0% 37%PAS ≥ 16 92% 90% 90% 80% 98%POMS ≥ 53 58% 36% 66% 18% 67% STAI‐S ≥ 46.12 53% 44% 62% 18% 78%STAI‐T ≥ 44.08 68% 52% 66% 27% 84%SLUMS < 20 36% 24% 28% 18% 40% Trails B/A ≥ 3 40% 50% 53% 33% 39%
RESULTS 52
CHANGE OVER TIME
To compare change over time on the psychological measures, three sets of analyses comparing mean change over time were completed—comparisons between the two AS groups (CSP MI vs. CSP NMI) across the six time periods, comparisons of the NMI groups (CSP NMI vs. GP NMI) across the five common time pe‐riods, and comparisons of the MI groups (CSP MI vs. SCCF vs. GP MI) across the five common time periods. Mixed design analysis of variance was used to analyze the data for all participants who had data on the composite scores. Huyn‐Feldt correction factors were used to adjust the degrees of freedom due to lack of sphericity for the within subject factors. Partial eta‐square, providing the percentage of variance explained, was used as an effect size measure (represented by η2 in the tables). An effect was considered small if it ac‐counted for 1% to 5% of the variance, medium if it accounted for 6% to 14% of the variance, and large if it accounted for 15% or more of the variance. A significance level of .05 was used to determine a statistically significant effect. In addition to mean comparisons over time, a slopes analysis was completed in which slopes were computed for each individual to represent rate of change over time and then comparisons were made between groups.
As a reminder, higher scores on self‐report composites, Trails derived scores, correctional staff ratings, and clinician ratings indicate worse performance (e.g., more depression, more anxiety), whereas higher scores indicate better cognitive performance on the SLUMS. Composites are standardized scores and indicate devi‐ation from the first assessment period scores.
Comparisons between CSP Groups
A key purpose of the study was to compare segregated inmates with mental illness to those without mental illness to determine if AS has a differential impact on participants with different mental health needs. Partic‐ipants were compared across the six time periods. The first assessment was completed while participants were awaiting a hearing for potential placement in AS. The second assessment occurred within 2 weeks of being placed in CSP. The third through sixth assessments were completed approximately every three months following placement in CSP, with the sixth assessment at one year post‐placement in CSP.
Comparisons on Self‐Report Measures. Comparisons between the two CSP groups were made on the seven composite scores and the two cognitive measures. The summary statistics (mean and standard deviation) for each group at each time period on the composites and cognitive measures are given in Table 12 and the inferential statistics (F values and partial eta‐squared) are given in Table 13. Across all seven mental health composites, the MI group scored statistically higher than the NMI group indicating that there was more psy‐chological distress for the MI groups. The effect sizes for the differences between groups vary across com‐posites with large effects for anxiety, depression‐hopelessness, and somatization composites. The NMI group had significantly higher average scores on the SLUMS measure, although this was a small effect. There was no significant difference between the groups on the Trails derived score.
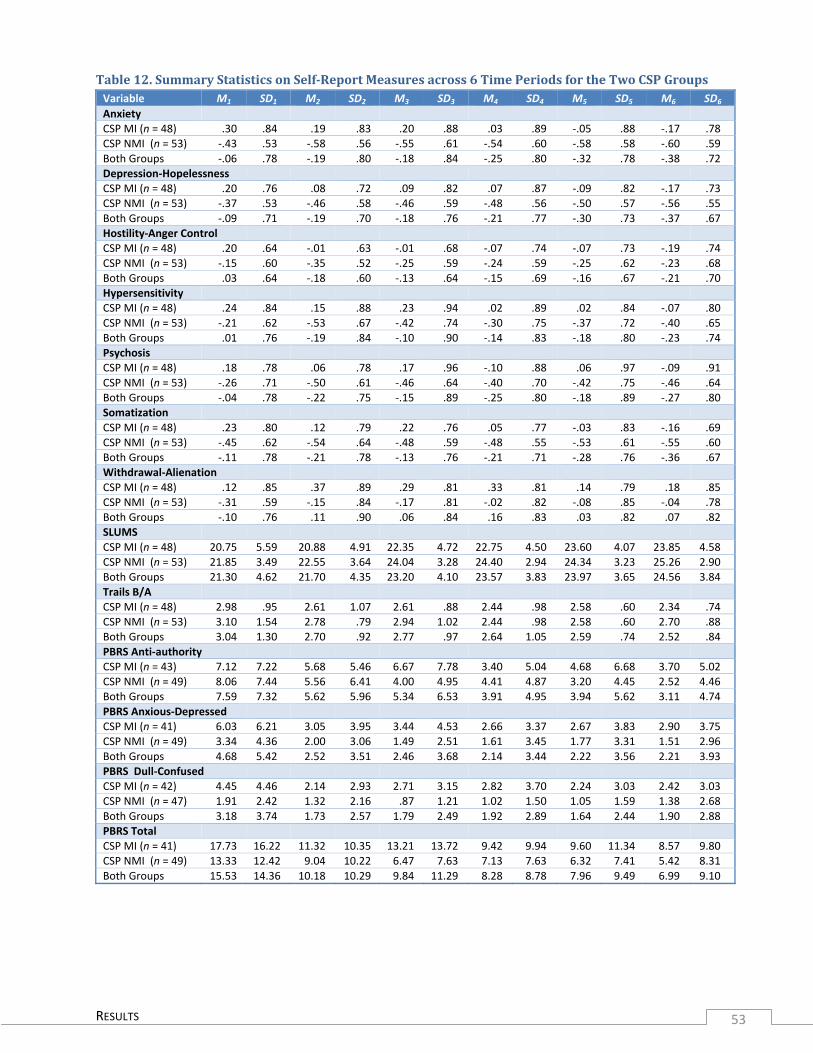
RESULTS 53
Table 12. Summary Statistics on SelfReport Measures across 6 Time Periods for the Two CSP Groups Variable M1 SD1 M2 SD2 M3 SD3 M4 SD4 M5 SD5 M6 SD6 Anxiety CSP MI (n = 48) .30 .84 .19 .83 .20 .88 .03 .89 ‐.05 .88 ‐.17 .78 CSP NMI (n = 53) ‐.43 .53 ‐.58 .56 ‐.55 .61 ‐.54 .60 ‐.58 .58 ‐.60 .59 Both Groups ‐.06 .78 ‐.19 .80 ‐.18 .84 ‐.25 .80 ‐.32 .78 ‐.38 .72 Depression‐Hopelessness CSP MI (n = 48) .20 .76 .08 .72 .09 .82 .07 .87 ‐.09 .82 ‐.17 .73 CSP NMI (n = 53) ‐.37 .53 ‐.46 .58 ‐.46 .59 ‐.48 .56 ‐.50 .57 ‐.56 .55 Both Groups ‐.09 .71 ‐.19 .70 ‐.18 .76 ‐.21 .77 ‐.30 .73 ‐.37 .67 Hostility‐Anger Control CSP MI (n = 48) .20 .64 ‐.01 .63 ‐.01 .68 ‐.07 .74 ‐.07 .73 ‐.19 .74 CSP NMI (n = 53) ‐.15 .60 ‐.35 .52 ‐.25 .59 ‐.24 .59 ‐.25 .62 ‐.23 .68 Both Groups .03 .64 ‐.18 .60 ‐.13 .64 ‐.15 .69 ‐.16 .67 ‐.21 .70 Hypersensitivity CSP MI (n = 48) .24 .84 .15 .88 .23 .94 .02 .89 .02 .84 ‐.07 .80 CSP NMI (n = 53) ‐.21 .62 ‐.53 .67 ‐.42 .74 ‐.30 .75 ‐.37 .72 ‐.40 .65 Both Groups .01 .76 ‐.19 .84 ‐.10 .90 ‐.14 .83 ‐.18 .80 ‐.23 .74 Psychosis CSP MI (n = 48) .18 .78 .06 .78 .17 .96 ‐.10 .88 .06 .97 ‐.09 .91 CSP NMI (n = 53) ‐.26 .71 ‐.50 .61 ‐.46 .64 ‐.40 .70 ‐.42 .75 ‐.46 .64 Both Groups ‐.04 .78 ‐.22 .75 ‐.15 .89 ‐.25 .80 ‐.18 .89 ‐.27 .80 Somatization CSP MI (n = 48) .23 .80 .12 .79 .22 .76 .05 .77 ‐.03 .83 ‐.16 .69 CSP NMI (n = 53) ‐.45 .62 ‐.54 .64 ‐.48 .59 ‐.48 .55 ‐.53 .61 ‐.55 .60 Both Groups ‐.11 .78 ‐.21 .78 ‐.13 .76 ‐.21 .71 ‐.28 .76 ‐.36 .67 Withdrawal‐Alienation CSP MI (n = 48) .12 .85 .37 .89 .29 .81 .33 .81 .14 .79 .18 .85 CSP NMI (n = 53) ‐.31 .59 ‐.15 .84 ‐.17 .81 ‐.02 .82 ‐.08 .85 ‐.04 .78 Both Groups ‐.10 .76 .11 .90 .06 .84 .16 .83 .03 .82 .07 .82 SLUMS CSP MI (n = 48) 20.75 5.59 20.88 4.91 22.35 4.72 22.75 4.50 23.60 4.07 23.85 4.58 CSP NMI (n = 53) 21.85 3.49 22.55 3.64 24.04 3.28 24.40 2.94 24.34 3.23 25.26 2.90 Both Groups 21.30 4.62 21.70 4.35 23.20 4.10 23.57 3.83 23.97 3.65 24.56 3.84 Trails B/A CSP MI (n = 48) 2.98 .95 2.61 1.07 2.61 .88 2.44 .98 2.58 .60 2.34 .74 CSP NMI (n = 53) 3.10 1.54 2.78 .79 2.94 1.02 2.44 .98 2.58 .60 2.70 .88 Both Groups 3.04 1.30 2.70 .92 2.77 .97 2.64 1.05 2.59 .74 2.52 .84 PBRS Anti‐authority CSP MI (n = 43) 7.12 7.22 5.68 5.46 6.67 7.78 3.40 5.04 4.68 6.68 3.70 5.02 CSP NMI (n = 49) 8.06 7.44 5.56 6.41 4.00 4.95 4.41 4.87 3.20 4.45 2.52 4.46 Both Groups 7.59 7.32 5.62 5.96 5.34 6.53 3.91 4.95 3.94 5.62 3.11 4.74 PBRS Anxious‐Depressed CSP MI (n = 41) 6.03 6.21 3.05 3.95 3.44 4.53 2.66 3.37 2.67 3.83 2.90 3.75 CSP NMI (n = 49) 3.34 4.36 2.00 3.06 1.49 2.51 1.61 3.45 1.77 3.31 1.51 2.96 Both Groups 4.68 5.42 2.52 3.51 2.46 3.68 2.14 3.44 2.22 3.56 2.21 3.93 PBRS Dull‐Confused CSP MI (n = 42) 4.45 4.46 2.14 2.93 2.71 3.15 2.82 3.70 2.24 3.03 2.42 3.03 CSP NMI (n = 47) 1.91 2.42 1.32 2.16 .87 1.21 1.02 1.50 1.05 1.59 1.38 2.68 Both Groups 3.18 3.74 1.73 2.57 1.79 2.49 1.92 2.89 1.64 2.44 1.90 2.88 PBRS Total CSP MI (n = 41) 17.73 16.22 11.32 10.35 13.21 13.72 9.42 9.94 9.60 11.34 8.57 9.80 CSP NMI (n = 49) 13.33 12.42 9.04 10.22 6.47 7.63 7.13 7.63 6.32 7.41 5.42 8.31 Both Groups 15.53 14.36 10.18 10.29 9.84 11.29 8.28 8.78 7.96 9.49 6.99 9.10
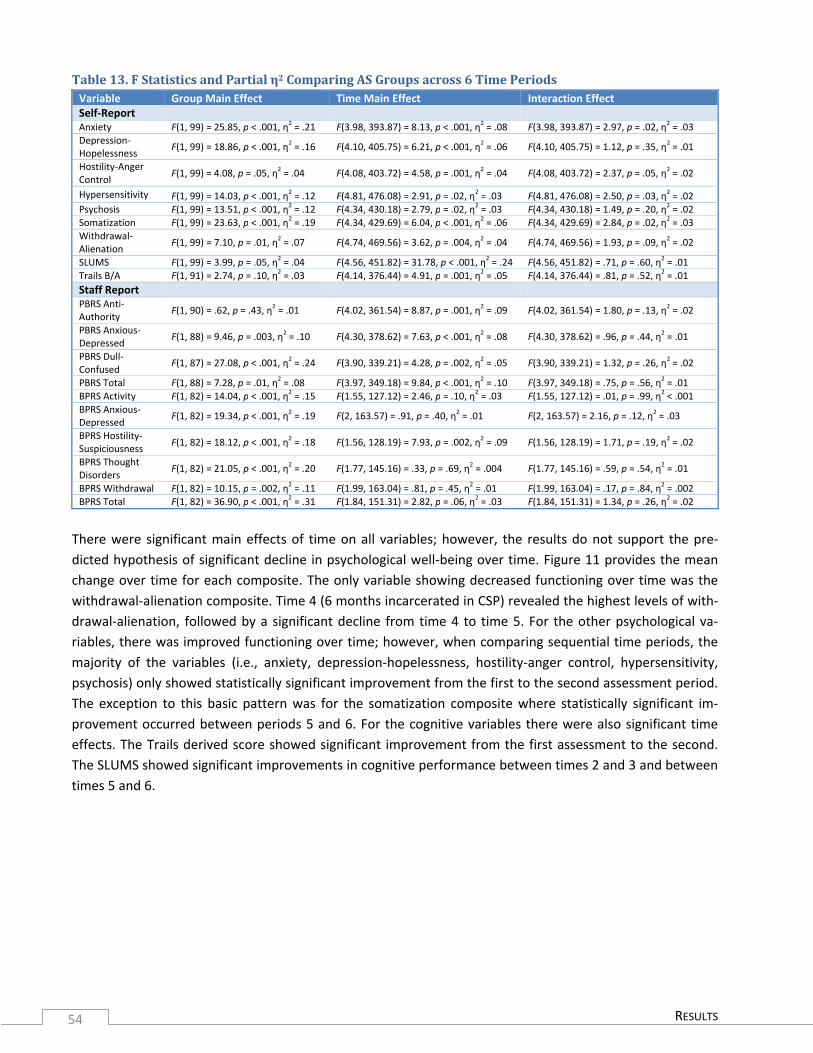
RESULTS 54
Table 13. F Statistics and Partial η2 Comparing AS Groups across 6 Time Periods Variable Group Main Effect Time Main Effect Interaction Effect Self‐Report Anxiety F(1, 99) = 25.85, p < .001, η2 = .21 F(3.98, 393.87) = 8.13, p < .001, η2 = .08 F(3.98, 393.87) = 2.97, p = .02, η2 = .03Depression‐Hopelessness
F(1, 99) = 18.86, p < .001, η2 = .16 F(4.10, 405.75) = 6.21, p < .001, η2 = .06 F(4.10, 405.75) = 1.12, p = .35, η2 = .01
Hostility‐Anger Control
F(1, 99) = 4.08, p = .05, η2 = .04 F(4.08, 403.72) = 4.58, p = .001, η2 = .04 F(4.08, 403.72) = 2.37, p = .05, η2 = .02
Hypersensitivity F(1, 99) = 14.03, p < .001, η2 = .12 F(4.81, 476.08) = 2.91, p = .02, η2 = .03 F(4.81, 476.08) = 2.50, p = .03, η2 = .02 Psychosis F(1, 99) = 13.51, p < .001, η2 = .12 F(4.34, 430.18) = 2.79, p = .02, η2 = .03 F(4.34, 430.18) = 1.49, p = .20, η2 = .02Somatization F(1, 99) = 23.63, p < .001, η2 = .19 F(4.34, 429.69) = 6.04, p < .001, η2 = .06 F(4.34, 429.69) = 2.84, p = .02, η2 = .03Withdrawal‐Alienation
F(1, 99) = 7.10, p = .01, η2 = .07 F(4.74, 469.56) = 3.62, p = .004, η2 = .04 F(4.74, 469.56) = 1.93, p = .09, η2 = .02
SLUMS F(1, 99) = 3.99, p = .05, η2 = .04 F(4.56, 451.82) = 31.78, p < .001, η2 = .24 F(4.56, 451.82) = .71, p = .60, η2 = .01Trails B/A F(1, 91) = 2.74, p = .10, η2 = .03 F(4.14, 376.44) = 4.91, p = .001, η2 = .05 F(4.14, 376.44) = .81, p = .52, η2 = .01Staff Report PBRS Anti‐Authority
F(1, 90) = .62, p = .43, η2 = .01 F(4.02, 361.54) = 8.87, p = .001, η2 = .09 F(4.02, 361.54) = 1.80, p = .13, η2 = .02
PBRS Anxious‐Depressed
F(1, 88) = 9.46, p = .003, η2 = .10 F(4.30, 378.62) = 7.63, p < .001, η2 = .08 F(4.30, 378.62) = .96, p = .44, η2 = .01
PBRS Dull‐Confused
F(1, 87) = 27.08, p < .001, η2 = .24 F(3.90, 339.21) = 4.28, p = .002, η2 = .05 F(3.90, 339.21) = 1.32, p = .26, η2 = .02
PBRS Total F(1, 88) = 7.28, p = .01, η2 = .08 F(3.97, 349.18) = 9.84, p < .001, η2 = .10 F(3.97, 349.18) = .75, p = .56, η2 = .01BPRS Activity F(1, 82) = 14.04, p < .001, η2 = .15 F(1.55, 127.12) = 2.46, p = .10, η2 = .03 F(1.55, 127.12) = .01, p = .99, η2 < .001BPRS Anxious‐Depressed
F(1, 82) = 19.34, p < .001, η2 = .19 F(2, 163.57) = .91, p = .40, η2 = .01 F(2, 163.57) = 2.16, p = .12, η2 = .03
BPRS Hostility‐Suspiciousness
F(1, 82) = 18.12, p < .001, η2 = .18 F(1.56, 128.19) = 7.93, p = .002, η2 = .09 F(1.56, 128.19) = 1.71, p = .19, η2 = .02
BPRS Thought Disorders
F(1, 82) = 21.05, p < .001, η2 = .20 F(1.77, 145.16) = .33, p = .69, η2 = .004 F(1.77, 145.16) = .59, p = .54, η2 = .01
BPRS Withdrawal F(1, 82) = 10.15, p = .002, η2 = .11 F(1.99, 163.04) = .81, p = .45, η2 = .01 F(1.99, 163.04) = .17, p = .84, η2 = .002BPRS Total F(1, 82) = 36.90, p < .001, η2 = .31 F(1.84, 151.31) = 2.82, p = .06, η2 = .03 F(1.84, 151.31) = 1.34, p = .26, η2 = .02
There were significant main effects of time on all variables; however, the results do not support the pre‐dicted hypothesis of significant decline in psychological well‐being over time. Figure 11 provides the mean change over time for each composite. The only variable showing decreased functioning over time was the withdrawal‐alienation composite. Time 4 (6 months incarcerated in CSP) revealed the highest levels of with‐drawal‐alienation, followed by a significant decline from time 4 to time 5. For the other psychological va‐riables, there was improved functioning over time; however, when comparing sequential time periods, the majority of the variables (i.e., anxiety, depression‐hopelessness, hostility‐anger control, hypersensitivity, psychosis) only showed statistically significant improvement from the first to the second assessment period. The exception to this basic pattern was for the somatization composite where statistically significant im‐provement occurred between periods 5 and 6. For the cognitive variables there were also significant time effects. The Trails derived score showed significant improvement from the first assessment to the second. The SLUMS showed significant improvements in cognitive performance between times 2 and 3 and between times 5 and 6.

RESULTS 55
Figure 11. Mean Scores over Time for the 7 Composites Summarized across the CSP Groups
Although there were significant changes across time for all variables, we were particularly interested in the group by time interaction to determine if there was differential change across times based on mental health status. There were statistically significant interactions for the anxiety, hostility‐anger, hypersensitivity, and somatization composites. Figures 12 to 15 provide graphical representations of these interactions. To fur‐ther understand these interactions, simple main effects of time were examined for each group using Bonfer‐roni pairwise comparisons of time periods.

RESULTS 56
For the anxiety composite, the CSP NMI group showed no significant change over time, but the CSP MI group did. Mean scores at the fourth, fifth and sixth assessments were significantly lower than means at the first three assessment periods, and the sixth assessment mean was significantly lower than the mean at the fourth assessment. Figure 12. Mean Scores over Time for the Anxiety Composite for each CSP Group
For the hostility‐anger control composite, the CSP NMI group showed no significant change over time. In contrast, the CSP MI group showed significant improvement over time with mean hostility‐anger control scores significantly elevated at the first assessment compared to all other time periods and the last assess‐ment period significantly lower than the first three assessment periods.
Figure 13. Mean Scores over Time for the HostilityAnger Control Composite for each CSP Group

RESULTS 57
For the hypersensitivity composite, both groups demonstrated significant change over time. The CSP NMI group showed significant improvement from time 1 to time 2 but then scores worsened over time so that scores at the fourth assessment were significantly worse than the scores at the second period. For the CSP MI group, there was a significant decline in scores from the first to the second assessment periods, then an increase in scores with an elevation occurring at time 3 (compared to time 2), and then a significant decline in scores at the fourth assessment period. Figure 14. Mean Scores over Time for the Hypersensitivity Composite for each CSP Group
For the somatization composite, there was significant change over time for the CSP MI group but not for the CSP NMI group. Significant decreases in scores occurred from the third to the fourth assessment periods and from the fifth to the sixth periods. Figure 15. Mean Scores over Time for the Somatization Composite for each CSP Group

RESULTS 58
Comparisons on Staff Report Measures. In addition to self‐report measures, data were collected from cor‐rectional staff using the PBRS and from clinicians using the BPRS. The PBRS was given at each of the 6 as‐sessment periods whereas the BPRS was given at 6 month intervals so that there were only three assess‐ments. Table 12 provides the means and standard deviations for the PBRS scores, Table 14 provides the summary statistics for the three BPRS assessments, and the inferential results for both variables are in Table 13.
Table 14. Summary Statistics on BPRS Scales across 3 Time Periods for All Study Groups BPRS Subscale M1 SD1 M3 SD3 M5 SD5
Activity CSP MI (n = 49) 6.39 1.72 6.08 1.74 6.00 1.53CSP NMI (n = 35) 5.60 1.14 5.26 .74 5.20 .53GP MI (n = 25) 6.40 1.63 5.88 1.20 6.04 1.59GP NMI (n = 25) 5.64 1.25 5.36 .86 5.28 .54SCCF (n = 55) 6.85 2.67 6.45 1.48 6.24 1.98Anxious‐Depressed CSP MI (n = 49) 9.51 3.11 9.35 2.93 8.47 3.02CSP NMI (n = 35) 7.37 2.07 6.74 2.24 7.42 3.14GP MI (n = 25) 8.68 3.13 7.96 2.47 8.40 2.31GP NMI (n = 25) 6.68 1.77 6.52 1.83 6.08 1.78SCCF (n = 55) 10.54 3.28 8.87 2.65 8.85 2.98Hostility‐Suspiciousness CSP MI (n = 49) 5.51 2.42 5.35 2.80 4.41 1.94CSP NMI (n = 35) 4.17 1.99 3.37 .69 3.31 .68GP MI (n = 25) 4.84 1.84 4.52 2.29 4.36 1.93GP NMI (n = 25) 3.96 1.97 3.60 1.53 3.72 1.67SCCF (n = 55) 5.53 3.01 4.51 1.91 4.64 2.12Thought Disorder CSP MI (n = 49) 6.53 2.34 6.71 2.18 6.35 2.24CSP NMI (n = 35) 5.43 1.04 5.14 .43 5.23 .55GP MI (n = 25) 5.64 .99 5.40 .91 5.24 .91GP NMI (n = 25) 5.20 .50 5.04 .20 5.44 1.44SCCF (n = 55) 8.40 3.55 6.49 1.91 5.24 .83Withdrawal CSP MI (n = 49) 7.59 1.63 7.67 1.98 7.39 1.50CSP NMI (n = 35) 6.68 .99 7.00 1.37 6.71 1.82GP MI (n = 25) 7.00 1.55 6.80 1.32 7.16 1.34GP NMI (n = 25) 6.44 .65 6.20 .50 6.32 .80SCCF (n = 55) 8.56 2.48 7.69 1.75 7.53 1.49Total CSP MI (n = 49) 35.53 7.19 35.16 8.90 32.61 6.81CSP NMI (n = 35) 29.26 4.85 27.51 3.71 27.89 4.92GP MI (n = 25) 32.56 5.86 30.56 4.98 31.20 4.17GP NMI (n = 25) 27.92 4.81 26.72 3.23 26.84 3.75SCCF (n = 55) 39.89 9.97 34.02 5.55 33.84 6.80 For the correctional staff ratings, there were statistically significant group differences on the Anxious‐Depressed, Dull‐Confused, and Total scales with the CSP MI group scoring significantly higher on each subs‐cale compared to the NMI group. There were significant changes across time for both groups with the first assessment showing higher ratings compared to the second assessment period ratings on all PBRS scales. Additionally, there was a statistically significant drop in Anti‐Authority scores from the third rating to the

RESULTS 59
fourth rating. There were no group by time interactions, indicating that change over time was the same for the two CSP groups.
As might be expected, the CSP MI group was elevated on each of the clinical rating scales of the BPRS com‐pared to the CSP NMI group. There was only significant change across time on the Hostility‐Suspiciousness subscale with scores at the last time period (M = 3.86, SE = .17) significantly lower than the first (M = 4.84, SE = .25) and middle assessment (M = 4.36, SE = .24) period means. There were no statistically significant group by time interaction effects.
Comparisons between NMI Groups
A significant advantage of this study is the use of comparison groups to determine if the CSP groups change over time differentially compared to similar groups of inmates who are not placed in AS. In the following analyses, participants without mental health issues are compared in order to determine if those in AS change over time on the measures differentially compared to those in the general prison population (CSP NMI vs. GP NMI). (A later section compares the participants who have been identified as mentally ill.) The groups are compared on the five common time assessments. Mixed design analysis of variance was used to compare change across time and between groups.
Comparisons on Self‐Report Measures. The summary statistics for the groups are provided in Table 15 and the analysis of variance results and effect sizes are provided in Table 16. For anxiety, depression‐hopelessness, hostility‐anger control, hypersensitivity, psychosis, and somatization composites, there were statistically significant group differences between the groups with the CSP NMI scoring significantly higher than the GP NMI group. For the withdrawal‐alienation composite, the SLUMS cognitive measure, and the Trails derived score, there were no statistically significant differences between groups.

RESULTS 60
Table 15. Summary Statistics on Measures across 5 Time Periods for the NMI Groups
Variable M1 SD1 M2 SD2 M3 SD3 M4 SD4 M5 SD5
Anxiety CSP NMI (n = 55) ‐.44 .53 ‐.59 .56 ‐.56 .60 ‐.55 .59 ‐.58 .58GP NMI (n = 38) ‐.71 .47 ‐.82 .40 ‐.85 .40 ‐.86 .35 ‐.88 .40Depression‐Hopelessness CSP NMI (n = 55) ‐.39 .52 ‐.47 .57 ‐.47 .58 ‐.50 .55 .50 .57GP NMI (n = 38) ‐.73 .35 ‐.82 .34 ‐.84 .39 ‐.81 .29 ‐.85 .30Hostility‐Anger Control CSP NMI (n = 55) ‐.13 .61 ‐.34 .52 ‐.23 .59 ‐.23 .64 ‐.24 .64GP NMI (n = 38) ‐.34 .49 ‐.45 .47 ‐.48 .54 ‐.54 .50 ‐.50 .51Hypersensitivity CSP NMI (n = 55) ‐.25 .65 ‐.54 .66 ‐.44 .74 ‐.31 .75 ‐.36 .72GP NMI (n = 38) ‐.50 .68 ‐.66 .62 ‐.73 .68 ‐.64 .51 ‐.73 .56Psychosis CSP NMI (n = 55) ‐.28 .71 ‐.51 .60 ‐.47 .63 ‐.41 .69 ‐.40 .75GP NMI (n = 38) ‐.60 .72 ‐.81 .53 ‐.81 .64 ‐.77 .53 ‐.86 .64Somatization CSP NMI (n = 55) ‐.46 .62 ‐.56 .63 ‐.50 .63 ‐.50 .56 ‐.52 .62GP NMI (n = 38) ‐.61 .51 ‐.77 .41 ‐.77 .41 ‐.72 .49 ‐.76 .49Withdrawal‐Alienation CSP NMI (n = 55) ‐.30 .60 ‐.12 .85 ‐.15 .82 .00 .82 ‐.07 .84GP NMI (n = 38) ‐.45 .78 ‐.32 .68 ‐.42 .70 ‐.32 .83 ‐.32 .80SLUMS CSP NMI (n = 55) 21.74 3.46 22.53 3.66 23.98 3.30 24.34 3.05 24.18 3.33GP NMI (n = 38) 23.16 3.97 23.92 3.26 24.47 3.55 24.71 3.69 24.82 3.24Trails B/A CSP NMI (n = 55) 3.11 1.52 2.84 .93 3.00 1.22 2.88 1.14 2.71 1.02GP NMI (n = 38) 2.82 .82 3.07 1.64 2.90 1.04 2.65 .76 2.80 .95PBRS Anti‐authority CSP NMI (n = 51) 7.75 7.75 5.46 6.30 3.92 4.87 4.38 4.79 3.40 4.48GP NMI (n = 22) 5.58 7.23 7.02 5.41 6.69 7.24 7.75 5.91 7.93 6.92PBRS Anxious‐Depressed CSP NMI (n = 51) 3.21 4.32 1.92 3.02 1.43 2.48 1.55 4.40 1.84 3.27GP NMI (n = 20) 2.70 3.66 2.80 3.49 3.69 3.90 3.86 5.28 3.10 4.05PBRS Dull‐Confused CSP NMI (n = 49) 1.84 2.40 1.26 2.13 .86 1.19 .98 1.48 1.12 1.60GP NMI (n = 20) 1.71 2.13 1.62 1.77 .09 2.08 2.10 2.65 2.07 2.83PBRS Total CSP NMI (n = 51) 12.81 12.44 8.80 10.09 6.31 7.52 6.99 7.51 6.64 7.47GP NMI (n = 20) 10.22 12.32 11.39 7.23 12.82 11.48 13.52 10.98 13.55 11.77

RESULTS 61
Table 16. F Statistics and Partial η2 Comparing NMI Groups across 5 Time Periods Variable Group Main Effect Time Main Effect Interaction Effect Self‐Report Anxiety F(1, 91) = 8.74, p = .004, η2 = .09 F(3.03, 275.73) = 4.52, p = .004, η2 = .05 F(3.03, 275.73) = .28, p = .84, η2 = .003Depression‐Hopelessness
F(1, 91) = 15.24, p < .001, η2 = .14 F(3.86, 351.74) = 4.74, p = .001, η2 = .05 F(3.86, 351.74) = 1.45, p = .22, η2 = .02
Hostility‐Anger Control
F(1, 91) = 4.69, p = .03, η2 = .05 F(3.50, 318.75) = 2.77, p = .03, η2 = .03 F(3.50, 318.75) = .13, p = .96, η2 = .001
Hypersensitivity F(1, 91) = 5.18, p = .02, η2 = .05 F(3.79, 345.07) = 4.70, p = .001, η2 = .05 F(3.79, 345.07) = 1.21, p = .31, η2 = .01 Psychosis F(1, 91) = 8.67, p = .004, η2 = .09 F(3.09, 281.17) = 5.11, p = .001, η2 = .05 F(3.09, 281.17) = .65, p = .59, η2 = .01Somatization F(1, 91) = 4.75, p = .03, η2 = .05 F(3.43, 312.15) = 2.42, p = .06, η2 = .03 F(3.43, 312.15) = .69, p = .58, η2 = .01Withdrawal‐Alienation
F(1, 91) = 2.79, p = .10, η2 = .03 F(3.88, 352.78) = 3.49, p = .01, η2 = .04 F(3.88, 352.78) = .52, p = .72, η2 = .01
SLUMS F(1, 91) = 2.09, p = .15, η2 = .02 F(3.77, 343.26) = 15.33, p < .001, η2 = .14 F(3.77, 343.26) = 1.17, p = .32, η2 = .01Trails B/A F(1, 86) = .13, p = .72, η2 = .001 F(3.53, 303.21) = 1.25, p = .29, η2 = .01 F(3.53, 303.21) = 1.29, p = .28, η2 = .02Staff Report PBRS Anti‐Authority
F(1, 71) = 4.67, p = .03, η2 = .06 F(3.43, 243.59) = .60, p = .64, η2 = .01 F(3.43, 243.59) = 3.64, p = .01, η2 = .05
PBRS Anxious‐Depressed
F(1, 69) = 4.63, p = .04, η2 = .06 F(3.62, 249.81) = .30, p = .86, η2 = .004 F(3.62, 249.81) = 1.92, p = .12, η2 = .03
PBRS Dull‐Confused
F(1, 67) = 7.61, p = .01, η2 = .10 F(3.59, 240.56) = .23, p = .91, η2 = .003 F(3.59, 240.56) = 1.45, p = .22, η2 = .02
PBRS Total F(1, 69) = 6.54, p = .01, η2 = .09 F(3.37, 232.76) = .40, p = .77, η2 = .01 F(3.37, 232.76) = 3.22, p = .02, η2 = .04BPRS Activity F(1, 58) = .19, p = .67, η2 = .003 F(1.43, 83.11) = 4.60, p = .01, η2 = .07 F(1.43, 83.11) = .03, p = .93, η2 < .001BPRS Anxious‐Depressed
F(1, 58) = 2.66, p = .11, η2 = .04 F(1.76, 101.84) = .81, p = .43, η2 = .01 F(1.76, 101.84) = 1.59, p = .21, η2 = .03
BPRS Hostility‐Suspiciousness
F(1, 58) = .22, p = .64, η2 = .004 F(1.47, 85.54) = 4.83, p = .02, η2 = .08 F(1.47, 85.54) = 1.15, p = .31, η2 = .02
BPRS Thought Disorder
F(1, 58) = .07, p = .78, η2 = .001 F(1.89, 109.66) = 2.54, p = .09, η2 = .04 F(1.89, 109.66) = 1.79, p = .17, η2 = .03
BPRS Withdrawal F(1, 58) = 5.95, p = .02, η2 = .09 F(1.73, 100.26) = .08, p = .90, η2 = .001 F(1.73, 100.26) = .97, p = .37, η2 = .02BPRS Total F(1, 58) = 1.35, p = .25, η2 = .02 F(1.83, 106.28) = 3.69, p = .03, η2 = .06 F(1.83, 106.28) = .11, p = .88, η2 = .002
For all variables except the somatization composite and Trails derived score, there were statistically signifi‐cant changes across time; however, there were not any significant group by time interactions, indicating that the two groups changed similarly across time. Figure 16 gives the mean change over time on the com‐posites (summarized across the two NMI groups). For all composite variables except withdrawal‐alienation, the pattern of change was the same when examining differences between sequential time periods. There were statistically significant improvements in reported psychological well‐being from the first to the second assessment but no other significant differences between time periods. The withdrawal‐alienation composite was the only variable that showed significantly higher scores over time, with statistically significant change on average from the first to second assessments and from the third to the fourth assessments. The SLUMS also showed change across time with significant improvement from the first (M = 22.45, SE = .39) to second (M = 23.22, SE = .27) assessment and from the second to third (M = 24.23, SE = .36) assessment.

RESULTS 62
Figure 16. Mean Scores over Time for the 7 Composites Summarized across the NMI Groups
Comparisons on Staff Report Measures. The summary statistics for the correctional officer ratings on the PBRS are given in Table 15, the summary statistics for the clinician ratings are given in Table 14, and the analysis of variance results for the staff report comparisons are given in Table 16.
For the correctional officer ratings, there are significant group differences on all four PBRS scales. When av‐eraged over time, the CSP NMI group scored significantly lower than the GP NMI group on each of the four scales. There were no significant main effects of time on any of the scales and no significant interaction ef‐fects for the Anxious‐Depressed or Dull‐Confused scales; however, there were significant interaction effects for Anti‐Authority and Total scales. These interactions are displayed in Figures 17 and 18. For both scales, the same basic pattern occurs with the CSP NMI scores tending to decrease across time with significant drops from the first to the second assessment and with the GP NMI scores showing no significant change across time (although scores tend to increase).

RESULTS 63
Figure 17. Mean Scores over Time for the PBRS AntiAuthority Subscale for each NMI Group
Figure 18. Mean Scores over Time for the PBRS Total Scale for each NMI Group
For the clinician ratings, there was a significant group difference on the Withdrawal subscale of the BPRS with the CSP NMI group (M = 6.80, SE = .13) rated significantly higher compared to the GP NMI group (M = 6.32, SE = .15). No other BPRS subscales had statistically significant group differences. There were significant time effects on Activity, Hostility‐Suspiciousness, and Total scores but no significant interaction effects for any of the BPRS subscales. For the Activity subscale, ratings at the first assessment (M = 5.62, SE = .16) were significantly higher than ratings at the third assessment (M = 5.24, SE = .10) but not different from ratings at

RESULTS 64
the second assessment (M = 5.24, SE = .07). For the Hostility‐Suspiciousness subscale, the ratings at the first assessment (M = 7.03, SE = .26) were significantly greater than ratings at the second (M = 6.63, SE = .27) and the third (M = 6.75, SE = .35) assessment periods. The total score showed this same pattern with first as‐sessment (M = 28.59, SE = .63) ratings significantly higher than second (M = 27.12, SE = .47) and third (M = 27.36, SE = .59) periods.
Comparisons between MI Groups
In the following analyses, the three groups with participants identified as mentally ill are compared. Like the comparisons between the NMI groups, there is a CSP MI group and a GP MI group plus a third group of in‐mates who have been placed in a psychiatric treatment facility (SCCF). Analyses were completed on the five common time periods using mixed design analysis of variance techniques.
Comparisons on Self‐Report Measures. The summary statistics for the groups are provided in Table 17 and the analysis of variance results and effect sizes are provided in Table 18. Significant group differences were found on the anxiety, depression‐hopelessness, psychosis, somatization, and withdrawal‐alienation compo‐sites. Using Bonferroni corrected pairwise comparisons, the SCCF group was always significantly higher than the GP MI group on these composites. Additionally, the SCCF group was significantly higher than the CSP MI group for the depression‐hopelessness, psychosis, and withdrawal‐alienation composites but not significant‐ly different for anxiety and somatization composites. The GP MI and CSP MI groups did not show any statis‐tically significant mean differences although the CSP MI group always had a higher mean. There were not significant group differences on the hostility‐anger control and hypersensitivity composites or on the cogni‐tive measures (SLUMS and Trails derived).

RESULTS 65
Table 17. Summary Statistics on Measures across 5 Time Periods for the MI Groups Variable M1 SD1 M2 SD2 M3 SD3 M4 SD4 M5 SD5 Anxiety CSP MI (n = 55) .26 .84 .14 .82 .12 .86 ‐.01 .86 ‐.10 .86 GP MI (n = 28) .11 .77 ‐.09 .65 ‐.06 .59 ‐.20 .56 ‐.22 .61 SCCF (n = 55) .51 .71 .35 .81 .27 .88 .32 .86 .21 .76 Depression‐Hopelessness CSP MI (n = 55) .19 .78 .07 .74 .04 .80 .03 .84 ‐.11 .81 GP MI (n = 28) .00 .76 ‐.19 .62 ‐.18 .53 ‐.22 .59 ‐.30 .54 SCCF (n = 55) .64 .89 .47 .93 .35 .98 .39 .95 .33 .86 Hostility‐Anger Control CSP MI (n = 55) .20 .67 .00 .67 ‐.03 .69 ‐.09 .74 ‐.12 .72 GP MI (n = 28) .11 .68 .01 .65 ‐.04 .58 ‐.08 .58 ‐.08 .55 SCCF (n = 55) .02 .69 ‐.08 .73 ‐.09 .65 ‐.05 .79 ‐.10 .71 Hypersensitivity CSP MI (n = 55) .16 .85 .08 .87 .11 .94 ‐.08 .90 ‐.05 .81 GP MI (n = 28) .13 .92 ‐.02 .71 .60 .65 ‐.14 .66 ‐.11 .69 SCCF (n = 55) .32 .78 .17 .78 .14 .91 .20 .77 .20 .75 Psychosis CSP MI (n = 55) .16 .80 .04 .78 .09 .95 ‐.14 .87 ‐.02 .94 GP MI (n = 28) .02 .80 ‐.29 .73 ‐.31 .65 ‐.46 .52 ‐.39 .64 SCCF (n = 55) .46 .84 .31 .94 .31 .88 .33 .95 .22 .86 Somatization CSP MI (n = 55) .23 .82 .14 .83 .21 .79 .09 .81 ‐.01 .85 GP MI (n = 28) .07 .71 ‐.10 .65 ‐.03 .83 ‐.24 .53 ‐.14 .59 SCCF (n = 55) .46 .67 .40 .68 .29 .81 .30 .83 .31 .76 Withdrawal‐Alienation CSP MI (n = 55) .15 .83 .34 .88 .25 .83 .30 .81 .18 .80 GP MI (n = 28) .08 .88 .03 .78 .12 .68 ‐.06 .71 ‐.02 .62 SCCF (n = 55) .43 .83 .53 .75 .56 .75 .50 .75 .55 .73 SLUMS CSP MI (n = 55) 20.80 5.44 21.20 4.86 22.27 4.68 22.84 4.38 23.51 4.03 GP MI (n = 28) 21.36 4.18 23.11 3.66 23.71 2.99 24.32 3.73 24.96 3.29 SCCF (n = 55) 20.96 3.55 21.81 4.24 23.11 4.37 23.52 4.07 23.35 4.04 PBRS Trails B/A CSP MI (n = 55) 2.99 1.04 2.74 1.15 2.67 .89 2.60 1.05 2.67 .76 GP MI (n = 28) 3.23 1.30 2.81 .68 2.75 .85 2.76 .87 2.62 .92 SCCF (n = 55) 2.97 1.16 2.95 1.13 2.90 1.16 2.80 .98 2.74 1.29 PBRS Anti‐Authority CSP MI (n = 50) 7.04 6.96 6.66 6.34 6.75 7.60 3.56 5.40 4.64 6.35 GP MI (n = 16) 5.31 4.61 6.48 5.05 8.58 10.14 7.00 6.75 7.56 9.77 SCCF (n = 41) 2.85 5.60 4.00 4.73 3.51 4.18 5.67 6.64 5.70 6.94 PBRS Anxious‐Depressed CSP MI (n = 49) 5.96 6.58 3.86 5.23 3.45 4.31 2.94 3.44 2.88 3.90 GP MI (n = 16) 2.31 3.53 4.32 6.30 5.00 4.63 2.89 3.83 3.62 5.20 SCCF (n = 41) 5.15 4.77 5.43 5.05 5.06 4.46 6.84 6.35 6.82 6.01 PBRS Dull‐Confused CSP MI (n = 49) 3.94 4.32 2.71 3.57 2.63 3.04 2.82 3.64 2.26 3.12 GP MI (n = 16) 1.69 2.15 2.50 3.14 2.62 3.28 1.81 2.95 1.25 1.95 SCCF (n = 41) 3.50 3.92 3.54 2.85 3.16 2.94 4.20 3.99 4.30 4.24 PBRS Total CSP MI (n = 49) 17.30 15.89 13.63 13.63 13.22 13.25 9.20 9.89 9.93 10.98 GP MI (n = 16) 9.38 9.62 12.35 12.68 16.28 15.04 11.72 11.77 12.44 15.05 Both Groups 11.70 13.46 13.26 10.59 11.97 9.31 16.99 15.90 17.22 15.58

RESULTS 66
Table 18. F Statistics and Partial η2 Comparing MI Groups across 5 Time Periods Variable Group Main Effect Time Main Effect Interaction Effect Self‐Report Anxiety F(2, 135) = 3.97, p = .02, η2 = .06 F(3.67, 495.07) = 9.11, p < .001, η2 = .06 F(7.34, 495.07) = .42, p = .90, η2 = .01Depression‐Hopelessness
F(2, 135) = 8.44, p < .001, η2 = .11 F(3.52, 475.64) = 6.76, p < .001, η2 = .05 F(7.04, 475.64) = .24, p =.98, η2 = .004
Hostility‐Anger Control
F(2, 135) = .13, p = .88, η2 = .002 F(3.45, 465.81) = 5.49, p = .001, η2 = .04 F(6.90, 465.81) = .70, p = .67, η2 = .01
Hypersensitivity F(2, 135) = 1.41, p = .25, η2 = .02 F(3.92, 529.43) = 2.80, p = .02, η2 = .02 F(7.84, 529.43) = .62, p = .76, η2 = .01Psychosis F(2, 135) = 7.28, p = .001, η2 = .10 F(3.82, 148.17) = 6.55, p < .001, η2 = .05 F(7.66, 148.17) = .97, p = .46, η2 = .01Somatization F(2, 135) = 4.26, p = .02, η2 = .06 F(3.87, 522.39) = 4.83, p = .001, η2 = .04 F(7.74, 522.39) = .89, p = .52, η2 = .01Withdrawal‐Alienation
F(2, 135) = 5.51, p = .01, η2 = .08 F(4.00, 539.26) = .79, p = .53, η2 = .01 F(7.99, 539.26) = .77, p = .63, η2 = .01
SLUMS F(2, 134) = 1.32 p = .27, η2 = .02 F(3.69, 494.42) = 28.64, p < .001, η2 = .18 F(7.38, 494.42) = .76, p = .63, η2 = .01Trails B/A F(2, 128) = .47, p = .63, η2 = .01 F(4, 512) = 4.50, p = .001, η2 = .03 F(8, 512) = .62, p = .76, η2 = .01Staff Report PBRS Anti‐Authority
F(2, 104) = 2.56, p = .08, η2 = .05 F(3.58, 372.72) = .63, p = .62, η2 = .01 F(7.17, 372.72) = 3.30, p = .002, η2 = .06
PBRS Anxious‐Depression
F(2, 103) = 5.92, p = .004, η2 = .10 F(3.62, 373.16) = .06, p = .99, η2 = .001 F(7.25, 373.16) = 2.97, p = .004, η2 = .05
PBRS Dull‐Confused
F(2, 103) = 5.03, p = .01, η2 = .09 F(3.46, 355.98) = .23, p = .90, η2 = .002 F(6.91, 355.98) = 1.38, p = .21, η2 = .03
PBRS Total F(2, 103) = .40, p = .67, η2 = .01 F(3.43, 352.95) = .13, p = .96, η2 = .001 F(6.85, 352.95) = 3.46, p = .001, η2 = .06BPRS Activity F(2, 126) = 1.36, p = .26, η2 = .02 F(1.82, 228.85) = 2.78, p = .07, η2 = .02 F(3.63, 228.85) = .16, p = .95, η2 = .003BPRS Anxious‐Depressed
F(2, 126) = 2.32, p = .10, η2 = .04 F(2, 252) = 5.15, p = .01, η2 = .04 F(4, 252) = 1.66, p = .16, η2 = .03
BPRS Hostility‐Suspiciousness
F(2, 126) = .73, p = .48, η2 = .01 F(1.92, 242.10) = 5.40, p = .01, η2 = .04 F(3.84, 242.10) = 1.31, p = .27, η2 = .02
BPRS Thought Disorder
F(2, 126) = 9.91, p < .001, η2 = .14 F(1.61, 203.27) = 5.50, p = .01, η2 = .04 F(3.23, 203.27) = 4.54, p = .003, η2 = .07
BPRS Withdrawal F(2, 126) = 5.46, p = .005, η2 = .08 F(1.99, 250.81) = 1.76, p = .17, η2 = .01 F(3.98, 250.81) = 2.02, p = .09, η2 = .03BPRS Total F(2, 126) = 7.10, p = .001, η2 = .10 F(1.85, 232.85) = 8.94, p < .001, η2 = .07 F(3.70, 232.85) = 2.95, p = .02, η2 = .04
There were significant changes across times for all composites except the withdrawal‐alienation composite. The hostility‐anger control composite also showed a significant interaction indicating differential change across time between groups. Figure 19 provides the mean plot demonstrating change across time for the five composites that had a significant time effect but no interaction effect. For the anxiety and depression‐hopelessness composites, there were significant decreases in mean scores from the first to second assess‐ment periods. For the psychosis and somatization composites, there were significant decreases in mean rat‐ings from the first to second and from the third to fourth assessment periods. The hypersensitivity compo‐site had a significant time effect, but the comparison of sequential time periods showed no significant change (pairwise comparisons indicated that the first assessment mean was significantly higher than mean scores at the fourth and fifth periods).

RESULTS 67
Figure 19. Mean Scores for the 7 Composites over Time Summarized across MI Groups
For the SLUMS cognitive assessment, there were significant increases in performance from the first (M = 21.04, SE = .40) to second (M = 22.04, SE = .39) and from the second to third (M = 23.03, SE = .38) assess‐ment periods. For the Trails derived score there were significant improvements in performance from the first (M = 3.08, SE = .10) to second (M = 2.83, SE = .10) assessment periods (indicated by a decrease in mean scores).
The significant interaction for the hostility‐anger control composite is graphed in Figure 20. There was signif‐icant change over time for the CSP MI group with time 1 scores significantly higher than all other assessment periods. There were not significant changes over time for the SCCF and GP MI groups.
‐0.15‐0.1
‐0.050
0.050.1
0.150.2
0.250.3
0.35
1 2 3 4 5
Mean Co
mpo
site Score
Assessment Period
Anxiety Depression‐Hopelessness Hostility‐Anger
Hypersensitivity Psychosis Somatization
Withdrawal‐Alienation

RESULTS 68
Figure 20. Mean Change over Time on the HostilityAnger Control Composite for each MI Group
Comparisons on Staff Report Measures. The summary statistics for the correctional staff ratings on the PBRS are given in Table 17, the summary statistics for the clinician ratings are given in Table 14, and the analysis of variance results for the staff report comparisons are given in Table 18.
For the correctional staff ratings, there were significant group differences for PBRS Anxious‐Depressed and Dull‐Confused subscale scores. The SCCF group (Mad = 5.86, SE = .48; Mdc = 3.74, SE = .31) scored significantly higher than the both the CSP MI (Mad = 3.82, SE = .44; Mdc = 2.87, SE = .28) and the GP MI (Mad = 3.63, SE = .76; Mdc = 1.98, SE = .50) groups on both subscales. The Anti‐Authority rating scale did not show statistically significant group differences (p = .08) but there was a small to moderate effect size (η2 = .05); the only signif‐icant difference was between the GP MI and the SCCF groups (p = .04). There were no statistically significant time effects for any of the subscales of the correctional officer ratings; however, there were significant group by time interactions for the Anti‐Authority, Anxious‐Depressed, and Total scores. Figures 21 to 23 demonstrate the interaction for these three variables.
Further analyses of the interaction effects showed the same pattern of significance – there were significant changes over time for the CSP MI group but not for the other two groups. Specifically, for the Anti‐Authority subscale, the fourth assessment had lower scores than the first three assessment periods; for the Anxious‐Depressed subscale, the first assessment was higher than all other assessment periods; and for the Total PBRS scale, the first assessment was significantly higher than the fourth and fifth assessments. There were not significant changes over time for the other two groups; however it is noteworthy that these scores tended to increase over time.

RESULTS 69
Figure 21. Mean Scores over Time for the PBRS AntiAuthority Subscale for each MI Group
Figure 22. Mean Scores over Time for the PBRS AnxiousDepressed Subscale for each MI Group

RESULTS 70
Figure 23. Mean Scores over Time for the PBRS Total Scale for each MI Group
For clinician ratings on the BPRS, there were significant mean group differences for the Total scale, the Thought Disorder subscale, and the Withdrawal subscale. The GP MI group (M = 31.44, SE = .99) had signifi‐cantly lower means on the total scale compared to both the CSP MI (M = 34.44, SE = .70) and the SCCF (M = 35.92, SE = .66) groups, but there was not a significant difference between the CSP MI and SCCF groups. All three groups were significantly different from each other on the Thought Disorder subscale with the GP MI (M = 5.43, SE = .32) having the lowest scores followed by CSP MI group (M = 6.53, SE = .23) and then the SCCF group (M = 7.16, SE = .22). For the Withdrawal subscale, the SCCF group had significantly higher means (M = 7.93, SE = .16) compared to both the CSP MI (M = 7.55, SE = .17) and the GP MI (M = 6.99, SE = .24) groups, but there was not a significant difference between the CSP MI and GP MI groups.
Time effects were statistically significant for all BPRS scales except Activity and Withdrawal subscales; how‐ever, there were also significant interactions for Thought Disorder and Total scales. Figure 24 provides the means for change over time for the Activity, Anxious‐Depressed, Hostility‐Suspiciousness, Though Disorder, and Withdrawal subscales of the BPRS. For the Anxious‐Depressed and Hostility‐Suspiciousness scales, mean ratings at the first assessment were greater than mean ratings at the third assessment for all three subs‐cales. Additionally, for the Anxious‐Depressed subscale, the mean rating at the first assessment was also significantly greater than the mean at the second assessment.

RESULTS 71
Figure 24. Mean Scores for the BPRS Subscales over Time Summarized across MI Groups
Figures 25 and 26 are mean plots to demonstrate the interaction effects for BPRS Thought Disorder subscale and BPRS Total scores. Simple main effects for each group on the Thought Disorder subscale indicate that there are significant changes over time for the SCCF group but not for the other two groups. The SCCF group had significantly higher scores at the first assessment compared to the other two assessment periods.
Figure 25. Mean Scores for the BPRS Thought Disorder Subscale over Time for each MI Group
For BPRS Total scores, the GP group does not change significantly over time but both of the other groups have significant time effects. In particular, the last assessment scores for the CSP MI group were significantly lower than the first two assessment periods, and the first assessment scores for the SCCF group were signifi‐cantly higher than each of the other assessment periods.
0
2
4
6
8
10
12
1 2 3
Mean BP
RS Sub
scale Score
Assessment Period
Activity Anxious‐Depressed Hostility‐Suspiciousness
Thought Disorder Withdrawal2

RESULTS 72
Figure 26. Mean Scores for the BPRS Total Scale over Time for each MI Group
Slopes Analysis
To compare change over time in another way, slopes analyses were conducted in addition to the means ana‐lyses. For these analyses, a slope and intercept were computed for each person on each composite using the available time periods for anyone who completed two or more assessments. These slopes and intercepts were then compared across groups. If AS was impacting change across time, we would expect slopes to be different across study groups. We also computed an intercept value for each person on each self‐report va‐riable; these intercepts were computed so that they represented an estimated value at initial assessment. Thus differences in groups would indicate different starting points. As a reminder, for all dependent va‐riables except the SLUMS, lower scores indicate better performance. Thus a positive slope would indicate a worsening of psychological well‐being over time and a negative slope would indicate an improvement over time. Similarly, a positive or larger intercept value indicates higher psychological distress (or lower cognitive functioning) at the outset compared to lower (or negative) values for all measures except the SLUMS.
Table 19 gives the means and standard deviations for the slopes and intercepts for each group on each composite and Table 20 provides the statistical results from a one‐way analysis of variance on each variable comparing if there are group differences in mean slopes and intercepts.

RESULTS 73
Table 19. Summary Statistics on Slopes and Intercepts for each SelfReport Variable for the Study Groups
Variable CSP MI CSP NMI GP MI GP NMI SCCF All
M SD M SD M SD M SD M SD M SD Anxiety Intercept .27 .82 ‐.48 .56 .10 .73 ‐.68 .48 .44 .69 ‐.02 .80 Slope ‐.11 .17 ‐.05 .20 ‐.06 .20 .03 .10 ‐.07 .19 ‐.06 .18 Depression‐Hopelessness Intercept .17 .70 ‐.38 .55 .003 .65 ‐.71 .40 .54 .84 ‐.02 .80 Slope ‐.07 .13 ‐.04 .15 ‐.05 .22 ‐.01 .10 ‐.21 .21 ‐.05 .17 Hostility‐Anger Control Intercept .16 .64 ‐.17 .57 .06 .64 ‐.37 .50 ‐.01 .65 ‐.05 .63 Slope ‐.07 .14 ‐.02 .14 ‐.04 .15 ‐.03 .09 ‐.04 .18 ‐.04 .14 Hypersensitivity Intercept .20 .78 ‐.33 .67 .16 .81 ‐.48 .72 .18 .66 ‐.04 .77 Slope ‐.09 .18 ‐.05 .26 ‐.04 .21 ‐.05 .15 .03 .26 ‐.04 .23 Psychosis Intercept .16 .72 ‐.34 .65 ‐.03 .79 ‐.63 .63 .38 .80 ‐.05 .80 Slope ‐.08 .19 ‐.05 .23 ‐.08 .29 ‐.04 .10 ‐.06 .28 ‐.06 .23 Somatization Intercept .25 .78 ‐.44 .68 .08 .68 ‐.59 .52 .46 .66 ‐.01 .79 Slope ‐.08 .17 ‐.03 .17 ‐.05 .16 ‐.04 .10 ‐.06 .27 ‐.05 .19 Withdrawal‐Alienation Intercept .26 .76 ‐.19 .71 .15 .78 ‐.37 .73 .37 .81 .07 .81 Slope ‐.02 .18 .05 .18 ‐.01 .23 .02 .17 .05 .34 .02 .24 SLUMS Intercept 20.74 4.71 22.01 3.29 21.93 3.62 23.53 3.16 20.72 3.83 21.61 3.93 Slope .65 .97 .78 .87 .81 .82 .38 .70 .83 1.42 .70 1.04 Trails B/A Intercept 2.94 .94 3.11 1.15 3.14 .87 3.08 1.09 3.05 .99 3.05 1.02 Slope ‐.10 .22 ‐.06 .30 ‐.15 .36 ‐.07 .28 ‐.98 .40 ‐.09 .32 Table 20. F Statistics and Partial η2 Comparing Study Groups on Slopes and Intercepts Self‐Report Measures Intercept Comparisons Slope Comparisons Anxiety F(4, 257) = 27.14, p < .001, η2 = .30 F(4, 257) = 1.39, p = .24, η2 = .02Depression‐Hopelessness F(4, 257) = 28.62, p < .001, η2 = .31 F(4, 257) = 1.30, p = .27, η2 = .02Hostility‐Anger Control F(4, 257) = 5.86, p < .001, η2 = .08 F(4, 257) = .88, p = .48, η2 = .01Hypersensitivity F(4, 257) = 10.23, p < .001, η2 = .14 F(4, 257) = 2.84, p = .02, η2 = .04Psychosis F(4, 257) = 16.34, p < .001, η2 = .20 F(4, 257) = .24, p = .92, η2 = .004Somatization F(4, 257) = 24.10, p < .001, η2 = .27 F(4, 257) = .58, p = .68, η2 = .01Withdrawal‐Alienation F(4, 257) = 9.00, p < .001, η2 = .12 F(4, 257) = 1.18, p = .32, η2 = .02SLUMS F(4, 257) = 4.50, p = .002, η2 = .07 F(4, 257) = 1.46, p = .21, η2 = .02Trails B/A F(4, 257) = .30, p = .88, η2 = .005 F(4, 257) = .54, p = .71, η2 = .008
As might be expected, there were significant group differences on intercepts for each self‐report variable except for the Trails B/A derived task. Figure 27 provides the mean intercept values for each self‐report composite for each group. In general, the MI groups had worse performance on these psychological va‐riables compared to the NMI groups. The exceptions to this general finding is that the CSP NMI was not sig‐nificantly different from SCCF and GP MI on hostility composite and was not different from GP MI on psy‐chosis and withdrawal‐alienation composites. Similarly, the GP NMI group was not significantly different from the GP MI on SLUMS. Another general finding for intercept differences is that groups with the same mental health status (MI, NMI) tended to be similar to one another. The exceptions to this general finding were that for the MI groups, the SCCF group was significantly higher than the GP MI group on depression‐hopelessness, psychosis, and withdrawal‐alienation composites.

RESULTS 74
Figure 27. Mean Intercept Values for each Composite by Study Group
In contrast to intercept analyses that showed many group differences, only hypersensitivity had significant differences in slopes between groups (see Table 20). The only significant differences were between the CSP MI group and the SCCF group. The CSP MI group had a negative slope indicating improvement over time and the SCCF group had a positive slope indicating a worsening trend over time.
To better understand how change is occurring across groups, we identified participants as having positive, negative, or no change over time. Participants were classified as positive changers if they had strong positive change on at least one variable (i.e., slope was more than 2 standard deviations from mean and in the direc‐tion of positive change) or had smaller positive change on three or more variables (i.e., slopes on at least three variables were more than 1 standard deviation from mean and in the direction of positive change). Likewise, participants were classified as negative changers if slopes were in negative direction. The remain‐ing participants who did not meet the rules for either positive or negative change were classified as not changing. Figure 28 provides the percentage of change types for each study group.
‐0.80
‐0.60
‐0.40
‐0.20
0.00
0.20
0.40
0.60
0.80
CSP MI CSP NMI GP MI GP NMI SCCF
Anxiety
Depression‐Hopelessness
Hostility‐Anger Control
Hypersensitivity
Psychosis
Somatization
Withdrawal‐Alienation

RESULTS 75
Figure 28. Percentage of Change Types by Study Group
Groups were significantly different in the percentage of change types, χ2(8, N = 270) = 16.26, p = .04. Using standardized residuals, the following conditions were found to be different from expectations: for the CSP MI group, there was a lower than expected percentage of persons changing negatively (5% vs. 8%); for the CSP NMI group, there was a lower percentage of people changing in positive direction than expected (14% vs. 24%); for the GP MI, there was a higher percentage of people changing in the positive direction (39% vs. 24%) and fewer than expected stable patterns (52% vs. 68%); for the GP NMI group, there was a lower per‐centage of people changing positively (14% vs. 24%) and more stable patterns than expected (81% vs. 68%); and for the SCCF group, there was a higher percentage of persons changing negatively (13% vs. 8%).
PREDICTOR ANALYSES
The purpose of these analyses was to explore if there were predictors of the rate of change across time on each composite. Using regression analyses to predict individual slopes as the dependent variable, we ex‐amined if the variables listed in Table 23 could explain rate of change. These variables were identified by the literature or the study advisory board as potential predictors. All study participants are used in these analys‐es, and MI status and AS status are used as two of the predictors.
0%
10%
20%
30%
40%
50%
60%
70%
80%
90%
CSP MI CSP NMI GP MI GP NMI SCCF
Negative Change (%) Positive Change (%) No Change (%)

RESULTS 76
Table 23. Variables Used to Predict Change over Time Predictor NotesMI status (study group membership) 0: NMI group; 1: MI groupAS status (study group membership) 0: Not AS; 1: ASDemographics Age (at start of study) DCIS variableEducation DCIS; 0: Less than HS; 1: HS diploma or GED Minority status DCIS; 0: Not a minority; 1: MinorityCriminal History Offense degree DCISPrevious AS confinement DCIS; 0: No; 1: YesPrior incarcerations DCIS Gang membership DCIS; 0: No; 1: Known gang memberPsychological History Anger needs DCISAnti‐social personality disorder CCIAnxiety (Axis I) CCIAvoidant personality disorder CCIBorderline personality disorder CCIDependent personality disorder CCIDepression (Axis I) CCIDepressive personality disorder CCIHistory of deliberate self harm DSHI (life time incidence)Histrionic personality disorder CCIImpulsivity CCINarcissistic personality disorder CCIObsessive‐compulsive personality disorder CCIParanoid personality disorder CCIPassive‐aggressive personality disorder CCIPsychotic thinking (Axis I) CCIPost traumatic stress disorder (Axis I) CCIPSI Attitudes towards AS PSI Time 1PSI Fear Level PSI Time 1PSI Safety PSI Time 1Sadistic personality disorder CCISchizoid personality disorder CCISchizophrenia (Axis I) CCI Schizotypal personality disorder CCISelf‐defeating personality disorder CCISelf‐destruction needs DCIS Sex offender needs DCIS Social Phobia (Axis I) CCITrauma symptoms TSIWithdrawal (Axis I) CCI
To determine which variables are potential predictors of self‐report outcomes, a forward statistical regres‐sion was used. The information in Table 24 presents the regression analysis results providing the adjusted R2 (proportion of variance explained in the slope variable by the predictors) and lists which variables were found to be significant predictors, along with standardized regression coefficients. The sign of the regression coefficient provides information about the direction of the relationship between the dependent variable and the predictor. Recall that the dependent variable is rate of change (slope) with positive scores indicating worsening of performance over time for all variables except on the SLUMS and negative scores indicating improving performance over time for all variables except on the SLUMS. Thus, a negative relationship of a

RESULTS 77
predictor with a slope implies that high scores on a variable covary with lower slope scores and thus more improvement for all variables (except SLUMS where a negative relationship implies higher scores on predic‐tor goes with more decline in SLUMS performance over time).
Table 24. Regression Results: Significant Predictors of Rate of Change over Time in Composite Variables Construct Adj. R2 Significant PredictorsAnxiety .11*** Schizophrenia (Axis 1; β = ‐0.32)
PSI Safety (β = ‐0.20) TSI Total (β = 0.21)
Depression‐Hopelessness
.17*** Paranoid PD (β = ‐0.23)Sadistic PD (β = 0.19) TSI Total (β = 0.30) Schizophrenia (Axis I; β = ‐0.38)
Hostility‐ Anger Control
.12*** Passive‐Aggressive PD (β = ‐0.29)TSI Total (β = 0.16) Withdrawal (Axis I; β = ‐0.21) PSI Safety (β = 0.19) Anger Needs (β = 0.13)
Hypersensitivity .04*** DSHI (β = ‐0.22)
Psychosis .03** Narcissistic PD (β = ‐0.20)SLUMS .08*** Obsessive‐Compulsive PD (β = 0.30)
PSI Fear Level (β = ‐0.24) Somatization .09*** PSI Safety (β = ‐0.26)
Narcissistic PD (β = ‐0.14) Withdrawal‐Alienation
.03** DSHI (β = ‐0 .18)
Trails B/A .08*** PSI AS Attitude (β = ‐0.25)Antisocial PD (β = 0.19) Narcissistic PD (β = ‐0.22) Depressive PD (β = 0.20)
*p < .05; **p < .01; ***p < .001
The study variables—MI status and AS confinement—were never significant predictors of outcomes. There were 15 different significant predictors on at least one outcome.For a predictor to have practical meaning in an applied setting, it would be important for predictors to be related to multiple outcome variables. There were no predictors that were significantly related to a majority of outcomes; however there were predictors that were significantly related to change over time on two or three multiple constructs. These were trauma history (positive relationship with change), PSI Safety (both positive and negative relationships with change), narcissistic personality disorder (negative relationship with change), schizophrenia scores ( negative rela‐tionship with change), and history of self harm ( negative relationship with change). To provide an interpre‐tive example, the positive relationships between trauma history and slopes for the anxiety composite indi‐cate that higher scores on trauma co‐vary with higher anxiety slopes. This implies that more trauma leads to worsening over time on the anxiety composite. Thus, generalizing to significant predictors, higher scores on trauma and lower scores on narcissistic personality disorder, schizophrenia (axis I), and self harm, lead to more negative change over time. The PSI Safety subscale had both positive and negative relationships with outcome variables. Higher scores on the PSI Safety subscale (i.e., feeling safer in AS) was related to im‐provements in anxiety and somatization but also to more hostility over time.

DISCUSSION 78
DISCUSSION
The results of this study were largely inconsistent with our hypotheses and the bulk of literature that indi‐cates AS is extremely detrimental to inmates with and without mental illness. We hypothesized that inmates in segregation would experience greater psychological deterioration over time than comparison inmates, who were comprised of similar offenders confined in non‐segregation prisons. Similar to other research, our study found that segregated offenders were elevated on multiple psychological and cognitive measures when compared to normative adult samples (Andersen et al, 2000; Haney, 2003; Suedfeld et al., 1982; Zin‐ger et al., 2001). However, there were elevations among the comparison groups too, suggesting that high degrees of psychological disturbances are not unique to the AS environment. The GP NMI group was the only one that was similar to the normative group on a number of scales.
In examining change over time patterns, there was initial improvement in psychological well‐being across all study groups, with the bulk of the improvements occurring between the first and second testing periods, followed by relative stability for the remainder of the study. On only one measure – withdrawal – did of‐fenders worsen over time, but this finding was only true for the two NMI groups, so it is not attributable to AS. Even given the improvements that occurred within the study timeframe, the elevations in psychological and cognitive functioning that were evident at the start of the study remained present at the end of the study.
Another hypothesis was that offenders with mental illness would deteriorate over time in AS at a rate more rapid and more extreme than for those without mental illness. Patterns indicated that the MI groups (CSP MI, GP MI, SCCF) tended to look similar to one another but were significantly elevated compared to the NMI groups (CSP NMI, GP NMI), regardless of their setting. For the AS offenders, the MI group scored worse than the NMI group on all self‐report measures except the Trails test and all staff measures except the PBRS Anti‐Authority scale. In addition to the changes over time described above, PBRS scores decreased significantly for segregated inmates regardless of their mental health status, which would be an indicator that staff may be perceiving improvements, but the significant differences were from the first to the second assessment periods when the majority of participants changed facilities, which suggests this is perhaps a measurement error rather than a true improvement. As hypothesized there was a differential time effect for the MI and NMI groups on several composite measures (i.e., anxiety, hostility‐anger control, hypersensitivity, somatiza‐tion), but the interactions were in the opposite direction of our hypothesis; on average, the CSP NMI group did not change while the CSP MI group improved.
We stated that offenders in segregation would develop an array of psychological symptoms consistent with the SHU syndrome. As already discussed, all of the study groups, with the exception of the GP NMI group, showed symptoms that were associated with the SHU syndrome. These elevations were present from the start and were more serious for the mentally ill than non‐mentally ill. In classifying people as improving, de‐clining, or staying the same over time, the majority remained the same. There was a small percentage (7%) who worsened and a larger proportion (20%) who improved. Therefore, this study cannot attribute the presence of SHU symptoms to confinement in AS. The features of the SHU syndrome appear to describe the most disturbed offenders in prison, regardless of where they are housed. In fact, the group of offenders who were placed in a psychiatric care facility (SCCF) had the greatest degree of psychological disturbances and the greatest amount of negative change.

DISCUSSION 79
Finally, in this study, we conducted some exploratory predictive analyses to determine if there were individ‐ual characteristics that could identify who may be at greater risk of psychological harm from segregation. There were no individual predictors that showed strong effects for predicting change. This could indicate that we did not have the correct predictors or that patterns of decompensation are individualized (i.e., not predictable), but it is more likely that the relative stability over time makes it difficult to predict change.
A review of the findings warrants a discussion of plausible alternative explanations that might account for our results. The use of a repeated measures design enabled us to determine that change was occurring and in which direction. Even given the debate about whether or not harmful effects resulted from AS, it was never suggested that inmates might improve as this study found. The presence of comparison groups avoids an attribution error; the changes, improvements in this case (i.e., 20%), are not due to segregation. These conclusions replicate those drawn by Zinger and colleagues (2001) where there was a similar lack of evi‐dence of harm. These studies suffered criticism for high refusal rates, high attrition rates, small sample sizes, and short durations – limitations that were corrected in the present study (note, however, that no generali‐zations should be made beyond the 1 year follow‐up period in this study). Furthermore, the use of reliable and valid standardized measures enabled the present research study to assess psychological functioning in an objective manner. Although the majority of these tests were not normed for prisoner populations, the current reliability and validity findings increased our confidence in these measures.
The most difficult finding to interpret is the improvement that occurred between the first and second testing sessions, which was significant for all groups except the GP NMI group. This effect may be due to reactivi‐ty—the participants know they are in a study and respond in a particular way. Perhaps they have a need to respond in a way that puts them in the most favorable light (e.g., ability to handle demands of prison con‐finement). (Sometimes improvement in performance due to being observed is called the Hawthorne effect; however this effect seems to be misunderstood and it was not merely the fact of being studied that led to those original finding of improvement [Gottfredson, 1996]). It is also possible that there are demand charac‐teristics introduced by the field researcher that cues the participants on how to respond; this seems unlikely as the participants would be expected to respond in the hypothesized direction. Although a testing or prac‐tice effect might explain the improvements on cognitive measures, we were unable to find support in the literature or from the study advisory board that psychological measures should be influenced by testing ef‐fects. Because the changes occurred in the AS and comparison groups, it is not possible to attribute the im‐provements to the confinement conditions; however it may be that participating in the study produces some unknown expectation. Although study demands may lead to positive ratings, it seems unlikely that these response biases would overshadow the negative impacts of AS if they really existed. However, there is not enough information in the data collected to understand the reason for the positive change. The most likely explanation is that study participants were included in our study when they were in the midst of a cri‐sis and, with time, the crisis dissipated.
LIMITATIONS
This study was able to incorporate several design features that improved upon the capability of previous research to draw conclusions about the effects of AS. On the other hand, this study has several limitations that affect its generalizability to other settings. First, this study included literate adult male offenders and should therefore not be generalized to female offenders, illiterate offenders, or juveniles. Second, this study can only be generalized to other prison systems to the extent that their conditions of AS confinement are

DISCUSSION 80
similar to Colorado’s. The same findings might not be found in other AS units that have different offender populations or criteria for placement, more restrictive confinement, or fewer mental health services.
The duration of this study was limited to one year. We believed this time period to be adequate to detect harmful effects because it was postulated in earlier research that the effects of segregation would be quickly evident (Grassian & Friedman, 1986; Haney, 2003; Kupers, 2008; Lovell et al., 2007; Rhodes, 2004; Toch, 1992). Kupers (2008, p. 1006) stated “that for just about all prisoners, being held in isolated confinement for longer than 3 months causes lasting emotional damage if not full‐blown psychosis and functional disability.” Therefore, we expected that deleterious effects would become evident within a year, but it is possible they do not appear until after longer periods of segregation.
This study used a moderate sample size because we anticipated moderate to large effects based on the lite‐rature (e.g., Grassian, 1983; Haney, 2003; Pizarro & Stenius, 2004). It is possible that the true magnitude of the negative effect is small and, therefore, larger sample sizes would be required to detect negative changes and predict the types of offenders who might be harmed by segregation. In support of this postulate, the present study found small to moderate effect sizes for change over time, however they were in the opposite (positive) direction.
This study examined group averages. It was not designed to identify if certain individuals might be worsened by the conditions of AS; rather the purpose was to examine whether offenders on the whole, both mentally ill and non‐mentally ill, are harmed by long‐term segregation. Also, in the design of this study, we assumed a general linear trend in the data and were not able to capture nonlinear changes over time that might have occurred. It is possible that a person in segregation could have had one or more brief episodes, possibly even severe episodes, of psychopathology that were not reflected in our data because testing occurred at three month intervals and that would not have been reflected in trend analyses of their psychological func‐tioning. This study was not designed to assess brief changes in psychological functioning, however serious.
This study attempted to triangulate data between inmate self‐report, staff observations, and official records. In the research study, we had the largest degree of success in gathering self‐report data. Some may question whether inmates’ self‐report is reliable because they may have reason to exaggerate their symptoms, but our testing of the measures’ psychometric properties indicated that the participants responded in remarka‐bly reliable and valid ways. The official record data, which was intended to help us understand the varying degree of social isolation to which study participants were exposed, was inconsistent and incomplete. Be‐cause our findings did not show negative change over time, the official record data would not have been as useful as originally intended; however, it would have still been beneficial in describing the conditions of con‐finement. Additionally, the data from the clinical staff suggested that there were issues with the BPRS data, where clinicians were able to rank order groups, but they did not estimate elevations to similar heights as those reported by inmates. These data also raise the possibility that clinical staff are aware of less distress than inmates validly report.
FUTURE RESEARCH
The definition of AS varies greatly from state to state, so much so that it is difficult to define or count the number of inmates held nationally in AS; therefore, replication is needed in other prison systems to deter‐mine whether these findings still hold true when the conditions of confinement are varied. The present re‐search was unable to determine which elements of CSP were essential to prevent harm from occurring, and

DISCUSSION 81
it did not assess the interventions used at CSP to monitor and treat inmates. Ongoing research is needed to better understand how the different components of segregation may impact offenders differentially. For example, the type and intensity of psychiatric services provided to AS inmates may have a particularly strong effect on whether they decompensate during extended periods of segregation. Research that incorporates qualitative data, such as mental health records and historical patient records, may also help to understand how individuals are impacted by their confinement conditions. It is important to study other high‐security settings that permit more out of cell time or increased interpersonal contact (i.e., group treatment).
Similar research is needed with female offenders in AS. Although they represent a small percentage of the AS population, there is a stunning lack of information about the pathways that lead women to segregation or how they adapt to this environment. Women offenders have high rates of mental illness (James & Glaze, 2006; O’Keefe & Schnell, 2008). Trauma appears to be a major determinant of mental illness in female of‐fender populations (Green, Miranda, Daroowalla, & Siddique, 2005; Zlotnik & Pearlstein, 1997); incarcerated women report much higher rates of abuse than incarcerated men (McClellan, Farabee, & Crouch, 1997). In examining coping mechanisms, the most unique gender differences exhibited by women are their strong need for social interaction and their propensity to cope with the prison environment predominantly through relationship formation (Severance, 2005). Given their higher rates of mental illness, trauma history, and needs for social interaction, women may be particularly vulnerable to potentially harmful effects of segrega‐tion.
One untapped topic in the area of segregation research is the role of staff, both how they affect the setting and the effects of the setting on them (Haney, 2008; Mears, 2008; Pizarro & Narag, 2008). Recognizing that correctional officers have the greatest amount of contact with offenders, Dvoskin and Spiers (2004) have suggested they need a larger role in the treatment and psychiatric care of offenders, including, but not li‐mited to, psychotherapeutic techniques to diffuse crisis situations, consultation with mental health profes‐sionals, and monitoring inmates’ compliance and adjustment to psychotropic medications. Evaluation re‐search would benefit the field in understanding the effectiveness of staff training and intervention programs implemented in AS. Finally, assessing inmate perceptions of staff may have value in understanding the im‐pact of long‐term segregation on inmates because how they are treated may have a significant impact on their adjustment to AS.
There were some findings in this study that were difficult to interpret or that did not fit into the same gen‐eral patterns described above. The Trails test did not differentiate between groups as did the other meas‐ures. In contrast, the BPRS tended to differentiate between offenders with and without mental illness even better than did the self‐report measures. The hypersensitivity construct showed more variability and more differential changes over time than the other constructs; for offenders in AS, those with mental illness im‐proved in hypersensitivity between times 1 and 2 but then showed a worsening trend while those without mental illness significantly improved between times 1 and 2, but then worsened between times 2 and 3, and then improved at the fourth interval. Further research may be needed to explore the reason for these dif‐ferent patterns or to determine if these were spurious findings.
POLICY IMPLICATIONS
Does this study legitimize the use of segregation with offenders, including those with serious and persistent mental illness? Because this study may not generalize to other prison systems, especially those that have conditions of confinement dissimilar to CSP, it is not possible to conclude that AS is not detrimental for all

DISCUSSION 82
offenders. Systems that are more restrictive and have fewer treatment and programming resources should not generalize these findings to their prisons. Replication is needed to understand how increased services, privileges, and out of cell time ameliorate the unintended consequences of AS, and research needs to inform prison systems about the standards and practices necessary to protect inmates in segregation from harmful psychological effects.
It is also important to note that there may be other negative consequences of AS that we did not study. For example, Lovell et al. (2007) found that inmates released directly from segregation to the streets had dra‐matically higher rates and severity of detected recidivism than AS inmates who first released to GP (but see Mears & Bales, 2009). We also did not study the degree to which AS met its purported goal of changing in‐mate behavior for the better over time. The only questions addressed by this study were related to psycho‐logical changes over time in segregation. Thus, we make no empirical or value judgments about whether and to what degree the use of AS balances the benefits (e.g., a safer prison system) with costs (e.g., significant reductions in freedom).
It is impossible to ignore the extremely disproportionate rate at which inmates with serious mental illness are assigned to AS (Lovell, 2008; Metzner & Fellner, 2010; O’Keefe, 2008a), which has to some degree “shocked the conscience” of the courts (see Jones ‘El v. Berge, 2001; Madrid v. Gomez, 1995; Ruiz v. John‐son, 1999). In an era when prisons are expected to implement evidence‐based practices and to rehabilitate offenders who will be releasing back to the community, is it enough to avoid harm? Must we ask ourselves another question: what are the conditions required to improve inmates’ mental well‐being while in segrega‐tion? Prison systems are held to a standard of treatment that is at least equivalent to community standards. It is likely that this most difficult segment of society has failed at all levels of community treatment and ear‐lier criminal justice interventions, but the quest to treat and improve services for the most needy is an im‐portant reality facing corrections agencies.
Regarding their psychological functioning and levels of distress, these data suggest, although the differences were small, that inmates with serious mental illness are less likely to improve in segregation and are less likely to get worse compared to mentally ill inmates in GP. We do not assume that the reasons for these ap‐parently contradictory findings are the same. For example, it is possible that fewer inmates with mental ill‐ness get worse because segregation is a safer and more structured environment. On the other hand, hypo‐theses regarding their unlikeliness to improve include the significant limitations that segregation places on various types of therapeutic activities and services such as group therapy. Further, the data do not tell us which aspects of AS prevent psychological improvement and deterioration, respectively, among inmates with mental illness. However, since prisons have a constitutional duty to respond to serious medical (includ‐ing psychiatric) needs, the possibility that segregation may prevent improvement is cause for concern and further study.
There remain significant implications for mental health staff who work in prison systems that permit the placement of mentally ill offenders in long‐term segregation. It is critical for mental health staff to screen and assess offenders prior to AS placement to determine their vulnerability to harm that might occur as a result of their segregation. While in segregation, it is important that the mental status of all offenders be assessed on a frequent, regular basis through rounds and individual sessions. Prison systems need to have a range of confinement options, such that offenders who are at risk of or are showing signs of decompensa‐

DISCUSSION 83
tion can be removed from segregation and placed in an alternative high security environment that permits greater out of cell time and interaction with others.
Other systems have rejected confinement models that isolated offenders and held them in extremely re‐strictive spaces. Even if the segregation models of the early 1900’s and the state psychiatric hospitals of the mid‐19th century are viewed as “primitive” compared to modern‐day AS facilities, it is important to examine and understand why these models failed and were ultimately dismantled. Although there are a number of researchers who predict that there is no end in sight to the supermax model (King, 1999; Mears, 2008; Pizar‐ro & Narag, 2008; Pizarro & Stenius, 2004), they have also raised empirical questions regarding their effica‐cy. Questions about the efficacy of AS will be asked until more is known about whether the use of AS in pris‐on systems improves conditions for the rest of the system, whether and how they improve inmate behavior within and beyond the prison walls, whether they are cost‐effective, whether they increase risks to public safety, and whether there are settings or individuals that are prone to psychological deterioration.

REFERENCES 84
REFERENCES
American Correctional Association (2009). 2009 directory: Adult correctional departments, institutions, agencies, and probation and parole authorities. Alexandria, VA: Author.
American Psychiatric Association. (1980). Diagnostic and statistical manual of mental disorders (3rd ed). Washington, DC: Author.
American Psychiatric Association. (2000). Diagnostic and statistical manual of mental disorders (4th ed., text revision). Washington, DC: Author.
American Psychological Association. (2009). Publication Manual of the American Psychological Association (6th ed.). Washington, DC: Author.
Andersen, H. S., Sestoft, D., Lillebaek, T., Gabrielsen, G., & Hemmingsen, R. (2003). A longitudinal study of prisoners on remand: Repeated measures of psychopathology in the initial phase of solitary versus nonsolitary confinement. International Journal of Law and Psychiatry, 26, 165‐177. Retrieved from http://sciencedirect.com
Andersen, H. S., Sestoft, D., Lillebaek, T., Gabrielsen, G., Hemmingsen, R., & Kramp, P. (2000). A longitudinal study of prisoners on remand: Psychiatric prevalence, incidence, and psychopathology in solitary vs. non‐solitary confinement. Acta Psychiatrica Scandinavica, 102, 19‐25.
Andrews, D. A., & Bonta, J. L. (1995). Level of Service Inventory—Revised. Toronto, ON: Multi‐Health Sys‐tems.
Andrews, D. A., & Bonta, J. L. (2003). Level of Service Inventory‐Revised (LSI‐R): U.S. norms manual supple‐ment. North Tonawanda, NY: Multi‐Health Systems, Inc.
Arrigo, B. A., & Bullock, J. L. (2008). The psychological effects of solitary confinement on prisoners in super‐max units: Reviewing what we know and recommending what should change. International Journal of Offender Therapy and Comparative Criminology, 52, 622‐641. doi: 10.1177/0306624X07309720
Atherton, E. (2001). Incapacitation with a purpose. Corrections Today, 63, 100‐103. Retrieved from http://vnwebnhwwilsonweb.com
Austin, J., Alexander, J., Anuskiewicz, S., & Chin, L. (1995). Evaluation of the Colorado Objective Prison Classi‐fication System. San Francisco, CA: National Council on Crime and Delinquency.
Beck, A. T., & Steer, R. A. (1993). Beck Hopelessness Scale: Manual. San Antonio, TX: The Psychological Cor‐poration—Harcourt Brace & Company.
Benjamin, T. B., & Lux, K. (1975). Constitutional and psychological implications of the use of solitary con‐finement: Experience at the Maine state prison. Clearinghouse Review, 9, 83‐84.
Briere, J. (1995). Trauma Symptom Inventory: Professional manual. Lutz, FL: Psychological Assessment Re‐sources, Inc.

REFERENCES 85
Briggs, C. S., Sundt, J. L., & Castellano, T.C. (2003). The effects of supermaximum security prisons on aggre‐gate levels of institutional violence. Criminology, 41, 1341‐1376. Retrieved from http://www3.interscience.wiley.com/cgi‐bin/fulltext/118866214/PDFSTART
Brodsky, S., & Scogin, F. (1988). Inmates in protective custody: First data on emotional effects. Forensic Re‐ports, 1, 267‐280.
Burger, K. G., Calsyn, R. J., Morse, G. A., Klinkenberg, W. D., & Trusty, M. L. (1997). Factor structure of the Expanded Brief Psychiatric Rating Scale. Journal of Clinical Psychology, 53, 451‐454. doi: 10.1002/(SICI)1097‐4679(199708)53:5<451::AID‐JCLP5>3.0.CO;2‐Q
Cohen, F. (2008). Penal Isolation: Beyond the Seriously Mentally Ill. Criminal Justice and Behavior, 35, 1017‐1047.
Collins, W. C. (2004). Correctional law for the correctional officer (4th ed.). Lanham, MA: American Correc‐tional Association.
Cooke, D. J. (1998). The development of the Prison Behavior Rating Scale. Criminal Justice and Behavior, 25, 482‐506. doi: 10.1177/0093854898025004005
Coolidge, F. L. (2004). An introduction to the Coolidge Correctional Inventory (CCI). Retrieved from http://www.uccs.edu/~faculty/fcoolidg//
CTB/McGraw‐Hill. (1994). Tests of Adult Basic Education (TABE): Version 7‐8. Monterey, CA: CTB/McGraw‐Hill.
CTB/McGraw‐Hill. (2004). Tests of Adult Basic Education (TABE): TABE Form 7 to the 2002 GED Linking Re‐port. Retrieved from http://www.ctb.com/media/articles/pdfs/AdultEducation/TABE_Form7_2002_GED_Linking_Report.pdf?FOLDER<>folder_id=59997&bmUID=1089131925485
Derogatis, L. (1993). Brief Symptom Inventory: Administration, scoring, and procedures manual. Minneapolis, MN: NCS Pearson, Inc.
Ditton, P. M. (1999, July). Mental health and treatment of inmates and probationers. Washington, DC: U.S. Department of Justice, Bureau of Justice Statistics.
Dvoskin, J. A., & Spiers, E. M. (2004). On the role of correctional officers in prison mental health. The Psy‐chiatric Quarterly, 75, 41‐59.
Ecclestone, C. E. J., Gendreau, P., & Knox, C. (1974). Solitary confinement of prisoners: An assessment of its effects on prisoners’ personal constructs and andrenocortical activity. Canadian Journal of Beha‐vioral Science, 6, 178 – 191.
Gawande, A. (2009, March 30). Hellhole: The United States holds tens of thousands of inmates in long‐term solitary confinement. Is this torture? The New Yorker, 36‐45. Retrieved from http://www.newyorker.com/reporting/2009/03/30/090330fa_fact_gawande
REFERENCES 86
Gendreau, P., & Bonta, J. (1984). Solitary confinement is not cruel and unusual punishment: People some‐times are! Canadian Journal of Criminology, 26, 467‐478.
Gendreau, P. E., Freedman, N., Wilde, G. J. S., & Scott, G. D. (1968). Stimulation seeking after seven days of perceptual deprivation. Perceptual and Motor Skills, 26, 547‐550.
Gendreau, P. E., Freedman, N., Wilde, G. J. S., & Scott, G. D. (1972). Changes in EEG alpha frequency and evoked response latency during solitary confinement. Abnormal Psychology, 79, 54‐59.
Gendreau, P., McLean, R., Parsons, T., Drake, R., and Ecclestone, J. (1970). Effect of two days’ monotonous confinement on conditioned eyelid frequency and topography. Perceptual and Motor Skills, 31, 291‐293.
Gottfredson, G. D. (1996). The Hawthorne misunderstanding (and how to get the Hawthorne effect in action research). Journal of Research in Crime and Delinquency, 33, 28‐48. doi: 10.1177/0022427896033001003
Grassian, S. (1983). Psychopathological effects of solitary confinement. American Journal of Psychiatry, 140, 1450‐1454.
Grassian, S., & Friedman, N. (1986). Effects of sensory deprivation in psychiatric seclusion and solitary con‐finement. International Journal of Law and Psychiatry, 8, 49‐65.
Gratz, K. L. (2001). Measurement of deliberate self‐harm: Preliminary data on the deliberate self‐harm in‐ventory. Journal of Psychopathology and Behavioral Assessment, 23, 253‐263.
Green, B. L., Miranda, J., Daroowalla, A., & Siddique, J. (2005). Trauma exposure, mental health functioning and program needs of women in jail. Crime & Delinquency, 51, 133‐151. doi: 10.1177/0011128704267477
Haney, C. (1993). Infamous punishment: The psychological effects of isolation. National Prison Project Jour‐nal, 8, 3‐21.
Haney, C. (2003). Mental health issues in long‐term solitary and "supermax" confinement. Crime and Delin‐quency, 49, 124‐156.
Haney, C. (2008). A culture of harm: Taming the dynamics of cruelty in supermax prisons. Criminal Justice and Behavior, 35, 956‐984.
Hedlund, J. L., & Vieweg, B. W. (1980). The Brief Psychiatric Rating Scale (BPRS): A comprehensive review. Journal of Operational Psychiatry, 11, 48‐64.
Hewitt v. Helms, 459 U.S. 460 (1983).
Hodgins, S., & Côté, G. (1991). The mental health of penitentiary inmates in isolation. Canadian Journal of Criminology, 33, 175‐182.
Human Rights Watch. (1997). Cold storage: Super‐maximum security confinement in Indiana. New York, NY: Human Rights Watch.

REFERENCES 87
Human Rights Watch. (1999). Red Onion State Prison: Super‐maximum security confinement in Virginia. Human Rights Watch, 11, 1‐24.
Human Rights Watch. (2000). Out of sight: Super‐maximum security confinement in the United States. Hu‐man Rights Watch, 12, 1‐9.
James, D., & Glaze, L. (2006). Mental health problems of prisons and jail inmates. Washington, DC: Bureau of Justice Statistics.
Jones v. Baker, 115 F.3d. 810 (6th Cir. 1998).
Jones ‘El v. Berge, 164 F. Supp. 2d 1096 (W.D. Wis. 2001).
King, R. D. (1999). The rise and rise of supermax: An American solution in search of a problem? Punishment and Society, 1, 163‐186. doi: 10.1177/14624749922227766
Kupers, T. (2008). What to do with the survivors? Coping with the long‐term effects of isolated confinement. Criminal Justice and Behavior, 35, 1005‐1016.
Kurki, L., & Morris, N. (2001). The purposes, practices, and problems of supermax prisons. Crime and Justice, 28, 1‐21.
Lovell, D. (2008). Patterns of disturbed behavior in a supermax population. Criminal Justice and Behavior, 35, 985‐1004.
Lovell, D., Johnson, L. C., & Cain, K. C. (2007). Recidivism of supermax prisoners in Washington state. Crime and Delinquency, 53, 633‐656. doi: 10.1177/0011128706296466
Lukoff, D., Nuechterlein, K., & Ventura, A. (1986). Manual for the expanded brief psychiatric rating scale. Schizophrenia Bulletin, 13, 261‐276.
Madrid v. Gomez, 899 F. Supp. 1146 (N.D. Cal. 1995).
McClary v. Kelly, 4 F. Supp. 2d 195 (W.D.N.Y. 1998).
McClellan, D. S., Farabee, D., & Crouch, B. M. (1997). Early victimization, drug use, and criminality: A com‐parison of male and female prisoners. Criminal Justice and Behavior, 24, 455‐476.
McNair, D. M., Lorr, M., & Droppleman, L. F. (1992). Manual: Profile of Mood States, Revised. San Diego, CA: Educational and Industrial Testing Service.
Mears, D. P. (2008). An assessment of supermax prisons using an evaluation research framework. The Prison Journal, 88, 43‐68.
Mears, D. P., & Bales, W. D. (2009). Supermax incarceration and recidivism. Criminology, 47, 1131‐1166. doi: 10.1111/j.1745‐9125.2009.00171.x
Mears, D. P., & Watson, J. (2006). Towards a fair and balanced assessment of supermax prisons. Justice Quarterly, 23, 232‐270. doi: 10.1080/07418820600688867

REFERENCES 88
Metzner, J. L., & Dvoskin, J. A. (2006). An overview of correctional psychiatry. Psychiatric Clinics of North America , 29, 761‐772. Retreived from http://psych.theclinics.com/issues/contents?issue_key=S0193‐953X(06)X0019‐9
Metzner, J. L., & Fellner, J. (2010). Solitary confinement and mental illness in U.S. prisons: A challenge for medical ethics. Journal of the American Academy of Psychiatry and the Law, 38, 104‐108. Retrieved from http://www.jaapl.org/cgi/reprint/38/1/104.pdf
Morey, L. C. (1997). Personality Assessment Screener: Professional manual. Lutz, FL: Psychological Assess‐ment Resources, Inc.
Motiuk, L. L., & Blanchette, K. (2001). Characteristics of administratively segregated offenders in federal cor‐rections. Canadian Journal of Criminology, 43, 131‐144.
Motiuk, M. S., Motiuk, L. L., & Bonta, J. (1992). A comparison between self‐report and interview‐based in‐ventories in offender classification. Criminal Justice and Behavior, 19, 143‐159. doi: 10.1177/0093854892019002003
Naday, A., Freilich, J. D., & Mellow, J. (2008). The elusive data on supermax confinement. The Prison Journal, 88, 69‐93.
National Institute of Corrections. (1997). Supermax housing: A survey of current practice, special issues in corrections. Longmont, CO: U.S. Department of Justice, National Institute of Corrections.
National Institute of Corrections. (1999). Supermax prisons: Overview and general considerations. Longmont, CO: US Department of Justice, National Institute of Corrections.
National Institute of Mental Health. (2010). The Numbers Count: Mental Disorders in America. Retrieved from http://www.nimh.nih.gov/health/publications/the‐numbers‐count‐mental‐disorders‐in‐america/index.shtml
O’Keefe, M. L. (2005). Analysis of Colorado’s administrative segregation. [Technical Report]. Colorado Springs, CO: Department of Corrections.
O’Keefe, M. L. (2008a). Administrative segregation for mentally ill inmates. Journal of Offender Rehabilita‐tion, 45, 149‐165.
O’Keefe, M. L. (2008b). Administrative segregation from within: A corrections perspective. The Prison Jour‐nal, 88, 123‐143.
O’Keefe, M. L., Klebe, K., & Hromas, S. (1998). Validation of the Level of Supervision Inventory (LSI) for com‐munity based offenders in Colorado: Phase II. [Technical Report]. Colorado Springs, CO: Colorado Department of Corrections.
O’Keefe, M. L., & Schnell, M. (2008). Offenders with Mental Illness in the Correctional System. Journal of Of‐fender Rehabilitation, 45, 81‐104.
Overall, J. E. & Gorham, D. R. (1962). The brief psychiatric rating scale. Psychological Reports, 10, 799‐812.

REFERENCES 89
Pizarro, J. M., & Narag, R., E. (2008). Supermax prisons: What we know, what we do not know, and where we are going. The Prison Journal, 88, 23‐42.
Pizzaro, J. & Stenius, V. M. K. (2004). Supermax prisons: Their rise, current practices and effect on inmates. The Prison Journal, 84, 248‐264.
Reitan, R. M. (1958). Validity of the Trail Making Test as an indicator of organic brain damage. Perceptual and Motor Skills, 8, 271‐276.
Rhodes, L. (2004). Total confinement: Madness and reason in maximum security. Berkeley, CA: University of California Press.
Ruiz v. Johnson, 37 F. Supp. 855 (S.D. Texas 1999).
Sandin v. Conner, 515 U.S. 473 (1995).
Severance, T. A. (2005). You know who you can go to: Cooperation and exchange between incarcerated women. The Prison Journal, 85, 343‐367.
Smith, P. S. (2008). “Degenerate criminals:” Mental health and psychiatric studies of Danish prisoners in soli‐tary confinement, 1870‐1920. Criminal Justice and Behavior, 35, 1048‐1064. doi: 10.1177/0093854808318782
Spielberger, C., Gorsuch, R., & Lushene, R. (1970). The State‐Trait Anxiety Inventory: Test manual for Form X. Palo Alto, CA: Consulting Psychologists Press.
Suedfeld, P., Ramirez, C., Deaton, J., & Baker‐Brown, G. (1982). Reactions and attributes of prisoners in soli‐tary confinement. Criminal Justice and Behavior, 9, 303‐340. doi: 10.1177/0093854882009003004
Sundt, J. L., Castellano, T. D., & Briggs, C. S. (2008). The sociopolitical context of prison violence and its con‐trol: A case study of supermax and its effect in Illinois. The Prison Journal, 88, 94‐122.
Tariq, S. H., Tumosa, N., Chibnall, J. T., Perry, M. H., & Morley, J. E. (2006). Comparison of the Saint Louis University Mental Status Examination and the Mini‐Mental State Examination for detecting demen‐tia and mild neurocognitive disorder—a pilot study. American Journal of Geriatric Psychiatry, 14, 900‐910.
Toch, H. (1992). Living in prison: The ecology of survival. Washington, DC: American Psychological Associa‐tion.
Toch, H. (2001). The future of supermax confinement. The Prison Journal, 81, 376‐388.
Turner v. Safley, 482 U.S. 78 (1987).
Ventura, J., Lukoff, D., Nuechterlein, K. H., Liberman, R. P., Green, M. F., & Shaner, A. (1993). Brief Psychia‐tric Rating Scale (BPRS) expanded version (4.0): Scales, anchor points, and administration manual. International Journal of Methods in Psychiatric Research, 3, 227‐244.
Ward, D. A., & Werlich, T. G. (2003). Alcatraz and Marion: Evaluating super‐maximum custody. Punishment and Society, 5, 53‐75. doi: 10.1177/1462474503005001295

REFERENCES 90
Widows, M. R., & Smith, G. P. (2005). Structured Inventory of Malingered Symptomatology: Professional ma‐nual. Lutz, FL: Psychological Assessment Resources, Inc.
Wilkinson v. Austin, 545 U.S. 209 (2005).
Zinger, I., Wichman, C., & Andrews, D. A. (2001). The psychological effects of 60 days in administrative se‐gregation. Canadian Journal of Criminology, 43, 47‐88.
Zlotnik, C., & Pearlstein, T. (1997). Posttraumatic stress disorder (PTSD) comorbidity, and childhood abuse among incarcerated women. Journal of Nervous and Mental Disease, 185, 761‐763.

APPENDICES 91
APPENDIX A
PSI Please rate how often the following items have applied to you in the past week.
Never True
Rarely True
SometimesTrue
Often True
Usually True
Always True
1. I find that even quiet noises are loud and disturbing.
0 1 2 3 4 5
2. My heart races faster than normal at times.
0 1 2 3 4 5
3. I am afraid for no reason.
0 1 2 3 4 5
4. I might go a day without brushing my teeth.
0 1 2 3 4 5
5. I do cardiovascular activity (jogging, running, speed walking, etc.).
0 1 2 3 4 5
6. I have difficulty catching my breath even when I am not exercising.
0 1 2 3 4 5
7. There are smells here that make me queasy.
0 1 2 3 4 5
8. I have pounding headaches that make it hard to concentrate.
0 1 2 3 4 5
9. I comb or brush my hair daily.
0 1 2 3 4 5
10. I struggle to get air.
0 1 2 3 4 5
11. I have a lot of energy.
0 1 2 3 4 5
12. My fear prevents me from doing things that I’d like to do.
0 1 2 3 4 5
13. I feel dizzy at times.
0 1 2 3 4 5
14. I look forward to getting back to the general population.
0 1 2 3 4 5 N/A
15. I do strength training (weight lift‐ing, pull‐ups, push‐ups, etc.).
0 1 2 3 4 5
16. I feel as though I am choking.
0 1 2 3 4 5
17. I feel lightheaded or like I am going to faint.
0 1 2 3 4 5
18. I avoid shaving or grooming my fa‐cial hair.
0 1 2 3 4 5
19. I sleep most of the day.
0 1 2 3 4 5
20. I find my whole body trembling for no apparent reason.
0 1 2 3 4 5
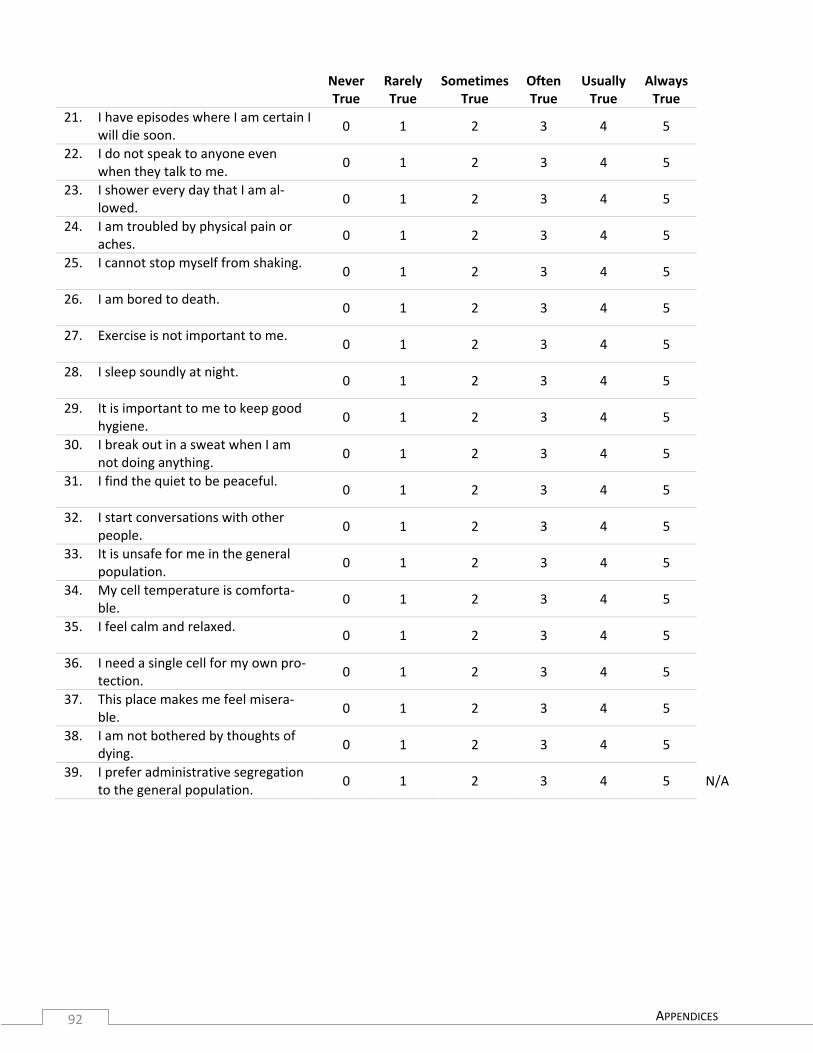
APPENDICES 92
Never True
Rarely True
SometimesTrue
Often True
Usually True
Always True
21. I have episodes where I am certain I will die soon.
0 1 2 3 4 5
22. I do not speak to anyone even when they talk to me.
0 1 2 3 4 5
23. I shower every day that I am al‐lowed.
0 1 2 3 4 5
24. I am troubled by physical pain or aches.
0 1 2 3 4 5
25. I cannot stop myself from shaking.
0 1 2 3 4 5
26. I am bored to death.
0 1 2 3 4 5
27. Exercise is not important to me.
0 1 2 3 4 5
28. I sleep soundly at night.
0 1 2 3 4 5
29. It is important to me to keep good hygiene.
0 1 2 3 4 5
30. I break out in a sweat when I am not doing anything.
0 1 2 3 4 5
31. I find the quiet to be peaceful.
0 1 2 3 4 5
32. I start conversations with other people.
0 1 2 3 4 5
33. It is unsafe for me in the general population.
0 1 2 3 4 5
34. My cell temperature is comforta‐ble.
0 1 2 3 4 5
35. I feel calm and relaxed.
0 1 2 3 4 5
36. I need a single cell for my own pro‐tection.
0 1 2 3 4 5
37. This place makes me feel misera‐ble.
0 1 2 3 4 5
38. I am not bothered by thoughts of dying.
0 1 2 3 4 5
39. I prefer administrative segregation to the general population.
0 1 2 3 4 5 N/A

APPENDICES 93
PRISON BEHAVIOR RATING SCALE
Instructions: Based on your interactions and records such as Chronological Notes, disciplinary infractions or other incidents, please rate the inmate’s behavior by circling your answer.
Never/ Rarely
Sometimes
Often
Most of the Time
1. Tried but failed to follow instructions
0 1 2 3
2. Appeared tense and unable to relax 0
1
2 3
3. Appeared close to tears
0 1 2 3
4. Caused trouble during his free time
0 1 2 3
5. Cursed and swore (in an abusive manner) 0
1
2 3
6. Appeared easily upset 0
1
2 3
7. Appeared sluggish and drowsy 0
1
2 3
8. Been held out of normal circulation (e.g. dry cell, mental health watch, special controls, RFP, punitive segregation etc.)
0 1 2 3
9. Had trouble sleeping at night
0 1 2 3
10. Appeared lacking in energy
0 1 2 3
11. Sought reassurance
0 1 2 3
12. Appeared to be brooding on something
0 1 2 3
13. Victimized weaker inmates
0 1 2 3
14. Appeared dull and unintelligent
0 1 2 3
15. Fidgeted and been unable to sit still
0 1 2 3
16. Tried to con staff
0 1 2 3
17. Appeared frightened of other inmates
0 1 2 3
18. Complained about staff
0 1 2 3
19. Not been aware of what is going on around him
0 1 2 3
20. Been aggressive towards staff
0 1 2 3
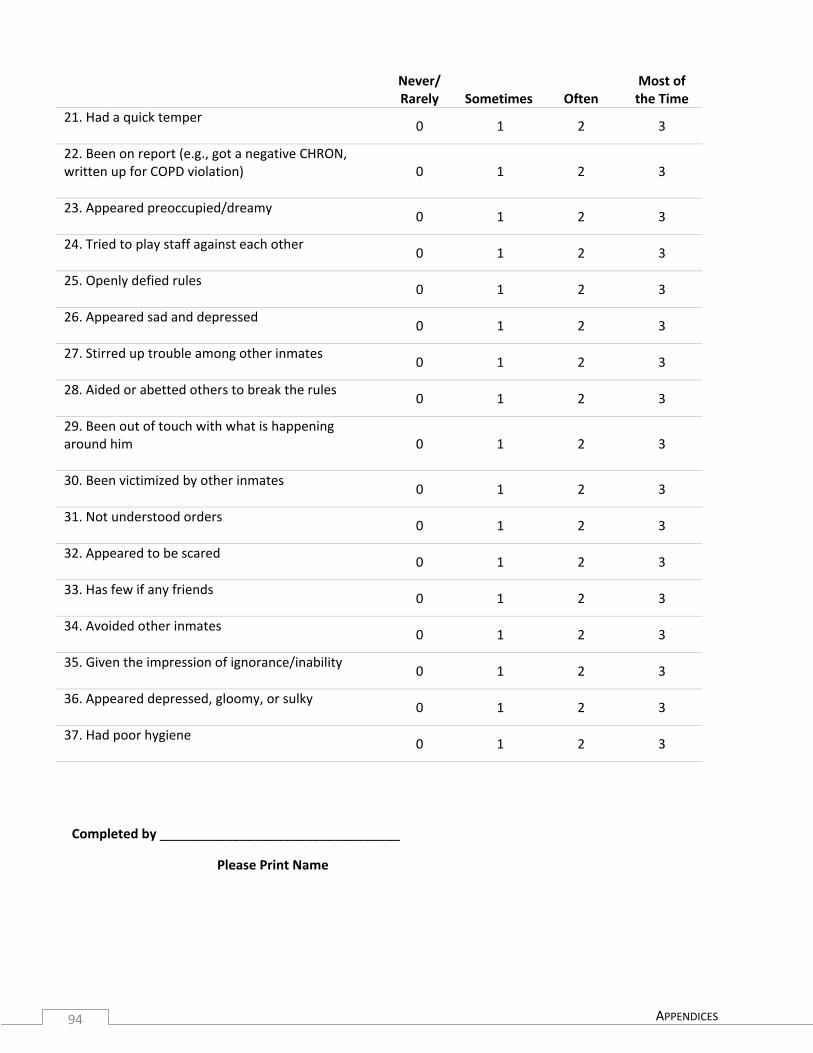
APPENDICES 94
Never/ Rarely
Sometimes
Often
Most of the Time
21. Had a quick temper
0 1 2 3
22. Been on report (e.g., got a negative CHRON, written up for COPD violation)
0 1 2 3
23. Appeared preoccupied/dreamy
0 1 2 3
24. Tried to play staff against each other
0 1 2 3
25. Openly defied rules
0 1 2 3
26. Appeared sad and depressed
0 1 2 3
27. Stirred up trouble among other inmates
0 1 2 3
28. Aided or abetted others to break the rules
0 1 2 3
29. Been out of touch with what is happening around him
0 1 2 3
30. Been victimized by other inmates
0 1 2 3
31. Not understood orders
0 1 2 3
32. Appeared to be scared
0 1 2 3
33. Has few if any friends
0 1 2 3
34. Avoided other inmates
0 1 2 3
35. Given the impression of ignorance/inability
0 1 2 3
36. Appeared depressed, gloomy, or sulky
0 1 2 3
37. Had poor hygiene
0 1 2 3
Completed by _________________________________
Please Print Name

APPENDICES 95
APPENDIX B SUMMARY OF STUDY MEASURES
Most of the measures included in this study were self‐report pencil‐and‐paper tests; however, we also col‐lected data from clinicians who completed the Brief Psychiatric Rating Scale (BPRS) and correctional staff who completed the Prison Behavior Rating Scale (PBRS). Two additional measures assessing cognitive func‐tioning (i.e., St. Louis University Memory Scale, Trail Making Test) were administered by a researcher. In‐struments used in this study were selected to assess a broad range of symptoms believed to be associated with long‐term segregation. We assessed eight constructs by means of 10 different measures (and/or ap‐propriate subscales). The constructs of interest in this study were anxiety, cognitive impairment, depression‐hopelessness, hostility‐anger control, hypersensitivity, psychosis, somatization, and withdrawal‐alienation. In addition to these key variables, we measured other variables that may be predictors of outcomes, includ‐ing trauma, personality disorders, malingering, and history of self‐harm.
Measures were selected for ease of administration and strength of psychometric properties. In this appen‐dix, we describe the measures used in this study, provide results concerning the psychometric properties of the measures, and describe the composites used for analyses in the report. Data are reported for the entire sample at each time period. Table B1 provides a quick reference guide to the tests used in this study as well as the constructs assessed by each of them.
Table B1. Study Measures Measure Construct Administration Times AssessedOutcome Variables Beck Hopelessness Scale (BHS) Depression‐Hopelessness Self‐Report B, every 3 monthsBrief Psychiatric Rating Scale (BPRS) Clinicians B, every 6 months Activity Anxious‐Depressed Anxiety, Depression‐Hopelessness Hostility‐Suspiciousness Hostility‐Anger Control Thought Disorder Psychosis Withdrawal Withdrawal‐Alienation Brief Symptom Inventory (BSI) Self‐Report B, every 3 months
Anxiety Anxiety Depression Depression‐Hopelessness Hostility Hostility‐Anger Control Interpersonal Sensitivity Hypersensitivity Obsessive‐Compulsive Anxiety Paranoid Ideation Psychosis Phobic Anxiety Anxiety Psychoticism Psychosis Somatization Somatization
Personality Assessment Screener (PAS) Self‐Report B, every 3 monthsActing Out Hostility‐Anger Control Alienation Withdrawal‐Alienation Anger Control Hostility‐Anger Control Health Problems Somatization Hostile Control Hostility‐Anger Control Negative Affect Anxiety, Depression‐Hopelessness Psychotic Features Psychosis Social Withdrawal Withdrawal‐Alienation Suicidal Thinking Depression‐Hopelessness

APPENDICES 96
Measure Construct Administration Times AssessedPrison Behavior Rating Scale (PBRS) Officers B, every 3 months
Anti‐Authority Hostility‐Anger ControlAnxious‐Depressed Anxiety, Depression‐HopelessnessDull‐Confused Cognitive Impairment
Prison Symptom Inventory (PSI) Self‐Report B, every 3 monthsPanic Disorder AnxietyHypersensitivity‐External Stimuli HypersensitivityPhysical Symptoms Somatization
Profile of Mood States (POMS) Self‐Report B, every 3 monthsAnger‐Hostility Hostility‐Anger ControlDepression‐Dejection Depression‐HopelessnessFatigue‐Inertia SomatizationTension‐Anxiety Anxiety
Saint Louis University Memory Scale (SLUMS)
Cognitive Impairment Researcher B, every 3 months
State‐Trait Anxiety Inventory (STAI) Self‐Report B, every 3 monthsState Anxiety Anxiety B, every 3 monthsTrait Anxiety Anxiety B, every 3 months
Trail Making Test (TMT) Researcher B, every 3 monthsTime to Complete A Task Cognitive ImpairmentTime to Complete B Task Cognitive ImpairmentB – A Time Cognitive ImpairmentB/A Time Cognitive Impairment
Predictor Variables Coolidge Correctional Inventory (CCI) Personality Disorders Yes BDeliberate Self‐harm Inventory DSHI) Self‐Harm Yes BStructured Inventory of Malingered Symptoms (SIMS)
Malingering Yes B, every 3 months
Trauma Symptom Inventory (TSI) Trauma 2nd
Note. Times assessed include the first time the test was administered as well as the interval at which it was given (unless it was only conducted at specific testing periods). B stands for baseline test.
DESCRIPTION OF INDIVIDUAL MEASURES
In this section, descriptions of the measures and summary statistics about reliability and validity are pro‐vided. Summary statistics include those published in the literature as well as those conducted with our study population. Cronbach’s alpha is used to estimate internal consistency reliability at each time period for the entire sample. Correlations between consecutive time periods are used to estimate test‐retest reliability. Convergent validity is estimated by correlations of each measure with other measures of the same construct for the entire sample at each time period. Tables for descriptive statistics on the measures are given with the description of the measure; reliability and validity statistics are presented in the description of the measure and/or with the description of the composites.
Beck Hopelessness Scale (BHS)
Designed to measure an individual’s degree of despair/depression, the BHS (Beck & Steer, 1993; Beck, Weissman, Lester, & Trexler, 1974) is a 20‐item self‐report measure on which scores can range from 0 to 20, with higher scores indicating a greater degree of despair about the future (Clum & Yang, 1995). Since this measure does not have any subscales, one total score is derived. Respondents answer true or false to

APPENDICES 97
statements about their attitudes over the past week (Beck & Steer, 1993). It takes approximately 5 to 10 minutes to complete this measure (Beck & Steer, 1993).
The psychometric properties of the BHS are solid, as it has demonstrated internal consistency estimates of .65 to .89 for nonclinical samples of college students (e.g., Beck et al., 1974; Durham, 1982; Steed, 2001), .86 to .93 for clinical in‐ or out‐patient samples (e.g., Beck et al., 1974; Durham, 1982; Dyce, 1996), and .83 in a forensic sample (Durham, 1982). Three‐week test‐retest reliability in a university sample was found to be acceptable (r = .85) for the entire sample and was slightly higher for males (r = .94; Holden & Fekken, 1988). In clinical samples, test‐retest correlations ranged from .66 (six‐week test‐retest correlation) to .69 (one‐week test‐retest correlation; Beck & Steer, 1993).
BHS self‐report ratings have also been correlated to clinician ratings of hopelessness, with correlations rang‐ing from .78 to .98 (Beck et al., 1974), which suggests that this measure possesses acceptable convergent validity. Additionally, the BHS is considered to be a predictor of suicide risk in clinical populations (e.g., Beck, 1986; Beck, Brown, Berchick, Stewart, & Steer, 1990; Beck et al., 1974; Brown, Beck, Steer, & Grisham, 2000), with scores of 9 and above being predictive of suicidal ideation (Beck, Steer, Kovacs, & Garrison, 1985). Additionally, the correlation between the BHS and the Modified Scale for Suicide Ideation was found to be moderate at .46 (Clum & Yang, 1995) in a nonclinical sample of college students. Further evidence for the BHS’s convergent validity comes from a study on a clinical inpatient sample; the BHS was found to be significantly correlated with the Beck Depression Inventory (BDI; r = .68) and the Current Suicidal Intent (r = .68; Kovacs, Beck, & Weissman, 1975).
Summary statistics are available for several different groups, including criminal psychiatric inpatients (Dur‐ham, 1982). Durham (1982) assessed college students, general psychiatric patients, and forensic psychiatric patients on the BHS. He found that the mean for the nonclinical, college student sample was 2.32 (SD = 2.25, n = 197), 6.04 (SD = 4.67, n = 118) for the clinical, general psychiatric sample, and 6.62 (SD = 4.88, n = 99) for the clinical, forensic sample. In another study, including 2,067 psychiatric outpatients, the mean total BHS score was 9.06 (SD = 5.61; Bieling, Beck, & Brown, 2000). Palmer and Connelly (2005) assessed BHS scores for prisoners with (n = 24) and without (n = 24) a history of self‐harming behavior. They found that the mean BHS score for prisoners with a history of self‐harming behavior was 10.13 (SD = 4.81); for offenders without a history of self‐harming behavior the BHS mean score was found to be significantly lower at 6.29 (SD = 4.49).
Summary statistics on the BHS for the current study are given in Table B2 for each group. Internal consisten‐cy estimates indicated excellent consistency across items at each time (mean Cronbach’s alpha = .93; range = .92 to .94). Test‐retest correlation coefficients ranged between .66 and .79 (M = .71). Examination of the validity coefficients, given in the composite section of this appendix, indicated that the BHS is correlated with other self‐report measures of depression (mean r = .58, range = .43 to .77); however, the correlations with relevant staff reports (BPRS Anxious‐Depressed and PBRS Anxious‐Depressed) were lower (mean r = .18, range = ‐.02 to .33).

APPENDICES 98
Table B2. Summary Statistics (M, SD, n) on BHS by Group and Time Time CSP MI CSP NMI GP MI GP NMI SCCF All
1 7.16 (5.63) n = 63
5.14 (4.52) n = 63
7.09 (5.38)n = 33
2.26 (3.16)n = 43
9.84 (6.28)n = 67
6.56 (5.75)n = 269
2 7.59 (6.62) n = 62
4.66 (4.96) n = 59
5.56 (4.68)n = 32
2.35 (3.06)n = 41
9.20 (6.89)n = 64
6.24 (6.11)n = 258
3 7.75 (6.37) n = 60
4.79 (4.88) n = 57
5.38 (4.58)n = 32
2.56 (3.92)n = 41
8.57 (6.85)n = 61
6.12 (5.99)n = 251
4 8.12 (6.90) n = 60
3.87 (4.11) n = 56
5.62 (4.91)n = 29
2.60 (2.89)n = 39
9.20 (7.05)n = 59
6.22 (6.16)n = 243
5 6.32 (6.31) n = 56
4.71 (5.03) n = 56
4.07 (4.22)n = 29
1.58 (2.06)n = 38
8.93 (6.88)n = 57
5.55 (5.92)n = 236
6 5.86 (5.57) n = 51
3.51 (4.10) n = 54
NA NA NA 4.61 (4.98)n = 106
Brief Psychiatric Rating Scale (BPRS)
The expanded Brief Psychiatric Rating Scale (BPRS‐E; Ventura et al., 1993) is a 24‐item measure administered by clinicians to assess patients with psychiatric disorders. It is designed to allow for the rapid review of psy‐chological symptoms over time (e.g., Ventura et al., 1993). Ratings are made after a semi‐structured clinical interview with a client. Clinicians rate the different items on the BPRS‐E by means of a 7‐point severity scale (1‐ not present to 7‐ extremely severe); higher scores on this measure generally indicate greater severity of psychopathology (Segal & Silverman, 2002; Thomas, Donnell, & Young, 2004). However, since clinicians also have an option of using a not assessed (N/A) rating on any given item, scores may not accurately reflect the degree of psychopathology (Ventura et al., 1993). The clinical interview takes approximately 10 to 40 mi‐nutes, depending on familiarity with the client as well as presenting symptoms at the time of the assessment (Thomas et al., 2004). Research has indicated that there are five factors to which the individual items of the BPRS‐E are associated: thought disorder (directly reflecting psychosis), withdrawal, anxious‐depressed, hos‐tility‐suspiciousness, and activity (Burger, Calsyn, Morse, Klinkenberg, & Trusty, 1997).
Internal consistency reliability for the total BPRS‐E was found to be between .74 and .79 for clinical popula‐tions (Perlick, Rosenheck, Clarkin, Sirey, & Raue, 1999; Segal & Silverman, 2002; Thomas et al., 2004). Fur‐thermore, when considering the internal consistency reliability for the 5‐factor structure, the coefficients for four out of the five scales ranged from .73 (i.e., anxiety‐depression) to .81 (i.e., activity); the Cronbach’s al‐pha for the hostility‐suspiciousness factor was found to be lower at .49 (Burger et al., 1997).
Mean total scores for clinical populations were found to be between 37.9 (SD = 11.1) and 61.6 (SD = 12.9; Biancosino et al., 2004; Brown, Chhina, & Dye, 2008; Segal & Silverman, 2002), while the mean total for the BPRS‐E among inmates with psychiatric problems in the prison population was found to be 49.29 (SD = 14.78; Gray, Bressington, Lathlean, & Mills, 2008). When individuals were tested over time in a clinical set‐ting, mean scores significantly decreased at each testing interval (Biancosino et al., 2004; Brown et al., 2008), which indicates that the test may be sensitive to change over time following an intervention.
The BPRS‐E has been shown to be correlated with the Brief Symptom Inventory (BSI), a self‐report measure of psychological symptoms (Morlan & Tan, 1998), indicating convergent validity. Furthermore, a study on female inmates showed that mental health referrals are more often done for those inmates who have re‐ceived higher BPRS‐E scores, suggesting that this assessment tool is useful in detecting psychopathology in inmates (Nicholls, Lee, Corrado, & Ogloff, 2004).

APPENDICES 99
Table B3 provides the summary statistics for the study groups on the BPRS scales at each time period. The BPRS scores tend to be lower than normative data found with other clinical populations, indicating a poten‐tial floor effect and potential rater bias.
Table B3. Summary Statistics (M, SD, n) on BPRS Scales by Group at each 6 month Time Period Assessment CSP MI CSP NMI GP MI GP NMI SCCF All Activity
Time 1 6.30 (1.74) n = 59
5.56 (1.05)n = 57
6.21 (1.54)n = 33
5.82 (1.34)n = 39
6.82 (2.58) n = 62
6.18 (1.84)n = 250
Time 3 5.92 (1.49) n = 54
5.26 (.67)n = 47
5.90 (1.27)n = 30
5.42 (1.18)n = 38
6.25 (1.44) n = 56
5.78 (1.31)n = 225
Time 5 6.17 (2.36) n = 48
5.18 (.49)n = 45
5.96 (1.56)n = 27
5.28 (.53)n = 29
6.27 (2.05) n = 51
5.82 (1.73)n = 200
Anxious‐Depressed
Time 1 9.51 (3.03) n = 59
7.37 (2.22)n = 57
9.03 (2.90)n = 33
6.67 (1.81)n = 39
10.40 (3.34) n = 62
8.74 (3.08)n = 250
Time 3 9.07 (2.95) n = 54
6.62 (2.15)n = 47
8.20 (2.44)n = 30
6.50 (1.84)n = 38
8.91 (2.64) n = 56
7.97 (2.71)n = 225
Time 5 8.44 (2.85) n = 48
7.04 (2.95)n = 45
8.22 (2.31)n = 27
5.97 (1.68)n = 29
9.06 (3.13) n = 51
7.90 (2.92)n = 200
Hostility‐Suspiciousness
Time 1 5.52 (2.46) n = 59
4.04 (1.76)n = 57
4.70 (1.72)n = 33
3.90 (1.83)n = 39
5.47 (3.01) n = 62
4.81 (2.39)n = 250
Time 3 5.17 (2.45) n = 54
3.34 (.64)n = 47
4.43 (2.16)n = 30
3.42 (1.26)n = 38
4.38 (1.54) n = 56
4.20 (1.86)n = 225
Time 5 4.54 (2.16) n = 48
3.36 (.71)n = 45
4.37 (1.86)n = 27
3.76 (1.62)n = 29
4.72 (2.17) n = 51
4.19 (1.88)n = 200
Thought Disorder
Time 1 6.59 (2.35) n = 59
5.32 (.87)n = 57
5.64 (.99)n = 33
5.18 (.51)n = 39
8.29 (3.33) n = 62
6.38 (2.41)n = 250
Time 3 6.50 (1.87) n = 54
5.17 (.48)n = 47
5.33 (.84)n = 30
5.10 (.39)n = 38
6.59 (1.94) n = 56
5.85 (1.54)n = 225
Time 5 6.35 (2.45) n = 48
5.18 (.49)n = 45
5.44 (1.22)n = 27
5.38 (1.35)n = 29
6.61 (2.11) n = 51
5.89 (1.84)n = 200
Withdrawal
Time 1 7.73 (1.76) n = 59
6.79 (1.18)n = 57
7.00 (1.41)n = 33
6.38 (.63)n = 39
8.61 (2.60) n = 62
7.43 (1.92)n = 250
Time 3 7.83 (1.96) n = 54
7.06 (1.40)n = 47
6.83 (1.26)n = 30
6.21 (.53)n = 38
7.59 (1.56) n = 56
7.20 (1.58)n = 225
Time 5 7.50 (1.62) n = 48
6.71 (1.74)n = 45
7.22 (1.42)n = 27
6.31 (.76)n = 29
7.59 (1.55) n = 51
7.14 (1.57)n = 200
Total
Time 1 35.66 (7.60)
n = 59 29.07 (4.71)
n = 57 32.58 (5.38)
n = 33 27.95 (4.88)
n = 39 39.60 (9.69)
n = 62 33.52 (8.28)n = 250
Time 3 34.50 (7.64)
n = 54 27.45 (3.51)
n = 47 30.70 (4.76)
n = 30 26.66 (3.77)
n = 38 33.71 (4.67)
n = 56 31.00 (6.13)n = 225
Time 5 33.00 (8.56)
n = 48 27.47 (4.59)
n = 45 31.22 (4.20)
n = 27 26.69 (3.57)
n = 29 34.25 (7.12)
n = 51 30.92 (6.93)n = 200
Table B4 provides the Cronbach’s alpha estimates for the subscales at each assessment period. The internal consistency estimates for the BPRS subscales (M = .55, range = .40 to .66) were lower than those found in normative samples but similar across time periods; however, the internal consistency estimates for the total score is similar to that found in normative samples. Correlations between sequential time periods (6 months

APPENDICES 100
apart) are provided in Table B5 and show low stability across time. It is possible that participants changed facilities from one testing session to the next, causing a switch in their assigned clinicians. This change in cli‐nicians could lower correlations between BPRS scores across time and present a picture of inmates’ psycho‐pathological instability when, in fact, inter‐rater disparity might be causing the change in BPRS scores over time. Correlations between the BPRS scales and relevant self‐report scales of the same construct ranged between .15 and .35 (M = .28). Correlations between the BPRS scales and the relevant correctional officer ratings (PBRS scales) ranged between .08 and .29 (M = .19). These convergent validity estimates are lower than expected and are likely impacted by restriction of range (i.e., scores on the BPRS are averaging at the low end of the possible scores and standard deviations are small).
Table B4. Internal Consistency Estimates (Cronbach’s alpha) for BPRS Scales at each Time Period BPRS Scale Time 1 Time 3 Time 5Activity .58 .53 .64 Anxious‐Depressed .55 .60 .66Hostility‐Suspiciousness .57 .61 .51Thought Disorder .64 .52 .57 Withdrawal .47 .49 .40Total Scale .81 .80 .79 Table B5. Correlations between Consecutive Time Periods for BPRS Scales BPRS Scale T1‐T3 T3‐T5 Activity .36 .40 Anxious‐Depressed .45 .43 Hostility‐Suspiciousness .36 .48 Thought Disorder .33 .58 Withdrawal .30 .23 Total Scale .41 .51
Brief Symptom Inventory (BSI)
The BSI (Derogatis, 1993) is a 53‐item self‐report measure that is widely employed to assess a broad range of psychological symptoms. It measures clinical symptoms across nine subscales (i.e., Somatization, Obses‐sive‐Compulsive, Interpersonal Sensitivity, Depression, Anxiety, Hostility, Phobic Anxiety, Paranoid Ideation, and Psychoticism) and three global scales (i.e., General Severity Index [GSI]; Positive Symptom Total; Positive Symptom Distress Index; Boulet & Boss, 1991). Respondents are asked to rate the degree of distress expe‐rienced over the last week, using a 5‐point rating scale (0 – not at all to 4 – extremely). Higher scores on the BSI indicate a greater degree of psychopathology. Despite having different subscales, the BSI seems to be better at providing information on the general degree of psychopathology instead of the nature of it (Boulet & Boss, 1991). A minimum of 6th grade reading ability is required to complete this measure, and it generally takes 10 minutes to complete (Boulet & Boss, 1991).
Internal consistency reliabilities across subscales are acceptable for clinical populations (range = .57 to .89; Boulet & Boss, 1991; Broday & Mason, 1991; Hayes, 1997; Kellett, Beail, Newman, & Frankish, 2003). Addi‐tionally, internal consistency reliabilities for nonclinical, community samples for the different subscales ranged from .60 to .81 (Kellett et al., 2003), whereas they ranged from .52 to .86 for forensic populations (Kellett et al., 2003; Zinger, Wichmann, & Andrews, 2001). Item‐total correlations for the scales ranged from

APPENDICES 101
.57 to .79, with a median correlation of .69, for clinical populations (Hayes, 1997) and ranged from .73 to .91 for forensic populations (Boulet & Boss, 1991). Two‐week test‐retest reliability is acceptable for the subs‐cales (range = .68 [Somatization] to .91 [i.e., Phobic Anxiety]) and the GSI (r = .90; Cundick, 1975; Derogatis, 1993; Kellett et al., 2003; Piersma, Reaume, Boes, 1994) across nonclinical, clinical, and forensic samples. The BSI has been shown to be valid for studying change over time (Long, Harring, Brekke, Test, & Greenberg, 2007).
Normative data are widely available for psychiatric in‐ and out‐patients and the general population but not for a prison population (Derogatis, 1993). Normative means for the different subscales ranged from .67 (SD = .71) to 1.65 (SD = 1.11) in psychiatric outpatients, from .71 (SD = .97) to 1.26 (SD = 1.15) in psychiatric in‐patients, and from .11 (SD = .25) to .37 (SD = .41) in nonclinical populations (Derogatis, 1993). Cochran and Hale (1985) conducted a normative study on male and female college students at a 4‐year college. They found that mean scores ranged from .29 (SD = .27) to 1.17 (SD = .77) for males (n = 143) and from .32 (SD = .45) to 1.12 (SD = .66) for females (n = 204). Furthermore, normative data are available on the global scales of the BSI; the normative mean for the BSI GSI was 1.20 (SD = .70) for psychiatric outpatients, .25 (SD = .24) for nonclinical populations, and .97 (SD = .78) for psychiatric inpatients (Derogatis, 1993).
Convergent validity has been assessed by means of comparing dimensions of the BSI to clusters on the Min‐nesota Multiphasic Personality Inventory (MMPI; Boulet & Boss, 1991; Cundick, 1975). Correlations of these comparisons were between .30 and .72 in Cundick’s (1975) study. In Boulet and Boss’s (1991) study, correla‐tions between the most relevant MMPI and BSI subscales were found to be moderate, ranging from .50 (MMPI Depression and BSI Depression) to .53 (MMPI Hypochondriasis and BSI Somatization). In a clinical sample, some of the BSI subscales were significantly correlated with the associated subscales on the BPRS: the depression scale on the BSI was significantly correlated to the depressive mood scale on the BPRS (r = .69), the anxiety scales on the BSI and BPRS correlated as well (r = .49), and the two hostility scales of both measures were also significantly correlated with one another (r = .49; Morlan & Tan, 1998). Overall, mod‐erate to high correlations with other measures seem to indicate that the BSI does, indeed, have adequate convergent validity.
Table B6 provides the summary statistics for the present study on the BSI scales at each time period. Inter‐nal consistency estimates for the BSI subscales were strong with Cronbach’s alphas ranging between .71 and .91 (M = .85). Test‐retest reliability estimates ranged between .53 and .79 (M = .72) indicating good stability within three month testing intervals. The BSI subscales showed reasonable convergent validity as correla‐tions with other self‐report measures of the same constructs ranged between .15 and .89 (M = .56) but there were lower validity estimates with staff reports with correlations ranging between ‐.01 and .43 (M = .23).
Table B6. Summary Statistics (M, SD, n) on BSI Scales by Group and Time Assessment CSP MI CSP NMI GP MI GP NMI SCCF All Anxiety
1 7.87 (6.52) n = 64
3.43 (4.00)n = 63
7.30 (5.56)n = 33
2.30 (3.15)n = 43
9.69 (5.75) n = 67
6.33 (5.92)n = 270
2 7.21 (6.01) n = 62
2.24 (3.71)n = 58
5.56 (5.58)n = 32
1.46 (2.65)n = 41
7.91 (6.29) n = 64
5.14 (5.77)n = 257
3 6.69 (6.50) n = 59
2.68 (3.65)n = 57
6.25 (5.75)n = 32
1.85 (4.19)n = 41
7.92 (6.11) n = 61
5.23 (5.88)n = 250
4 5.92 (6.39) n = 60
2.71 (3.36)n = 56
5.17 (5.52)n = 29
1.49 (2.21)n = 39
8.11 (6.27) n = 59
4.91 (5.66)n = 243

APPENDICES 102
Assessment CSP MI CSP NMI GP MI GP NMI SCCF All
5 5.61 (6.25) n = 56
2.43 (3.20)n = 56
4.79 (5.12)n = 29
1.08 (1.85)n = 38
7.47 (5.77)n = 57
4.47 (5.34) n = 236
6 4.84 (5.88) n = 51
2.78 (3.56)n = 54
NA NA NA 3.74 (4.91) n = 106
Depression
1 9.32 (6.43) n = 63
5.94 (5.24)n = 63
7.97 (6.34)n = 33
3.24 (3.65)n = 43
11.91 (6.22) n = 67
8.03 (6.42) n = 269
2 7.92 (5.92) n = 62
4.72 (5.05)n = 58
6.44 (5.86)n = 32
2.22 (3.49)n = 41
10.46 (7.02) n = 64
6.74 (6.34) n = 257
3 8.07 (6.94) n = 59
4.64 (5.10)n = 57
7.38 (6.01)n = 32
2.49 (4.18)n = 41
9.87 (7.24)n = 61
6.73 (6.62) n = 250
4 7.18 (6.48) n = 60
4.27 (4.63)n = 56
6.62 (5.25)n = 29
1.95 (2.62)n = 39
10.20 (7.28) n = 59
6.34 (6.32) n = 243
5 7.30 (6.41) n = 56
4.05 (4.76)n = 56
5.76 (4.98)n = 29
1.68 (2.58)n = 38
10.07 (7.16) n = 57
6.10 (6.28) n = 236
6 6.29 (5.98) n = 51
3.96 (4.70)n = 54
NA NA NA 5.05 (5.46) n = 106
Hostility
1 6.74 (5.20) n = 64
4.02 (3.95)n = 63
5.58 (5.01)n = 33
1.93 (2.77)n = 43
6.50 (5.47)n = 67
5.14 (4.95) n = 270
2 5.66 (4.56) n = 62
2.53 (3.72)n = 58
4.34 (3.92)n = 32
1.71 (1.98)n = 41
5.76 (5.22)n = 64
4.19 (4.47) n = 257
3 5.78 (5.23) n = 59
3.10 (4.04)n = 57
5.12 (4.16)n = 32
1.71 (2.78)n = 41
6.30 (5.12)n = 61
4.54 (4.76) n = 250
4 5.30 (5.50) n = 60
3.66 (4.54)n = 56
5.31 (5.25)n = 29
1.91 (2.64)n = 39
6.64 (6.23)n = 59
4.70 (5.31) n = 243
5 5.61 (5.15) n = 56
3.45 (4.36)n = 56
5.17 (4.23)n = 29
1.21 (1.92)n = 38
5.79 (4.96)n = 57
4.38 (4.69) n = 236
6 4.32 (4.77) n = 51
3.56 (4.64)n = 54
NA NA NA 3.89 (4.69) n = 106
Interpersonal Sensitivity
1 5.39 (4.67) n = 63
3.43 (3.22)n = 63
5.15 (3.99)n = 33
2.40 (3.43)n = 43
6.91 (3.96)n = 67
4.80 (4.20) n = 269
2 5.14 (4.02) n = 62
2.36 (2.81)n = 58
3.72 (3.60)n = 32
1.68 (2.36)n = 41
5.98 (4.04)n = 64
4.00 (3.85) n = 257
3 4.62 (4.44) n = 60
2.44 (3.21)n = 57
4.44 (3.99)n = 32
1.27 (2.42)n = 41
6.28 (4.34)n = 61
3.96 (4.19) n = 251
4 4.00 (4.07) n = 60
2.64 (3.11)n = 56
3.90 (4.04)n = 29
1.23 (2.04)n = 39
6.39 (4.57)n = 59
3.81 (4.10) n = 243
5 4.42 (4.21) n = 56
2.52 (2.79)n = 56
3.41 (3.63)n = 29
0.89 (1.72)n = 38
6.56 (4.33)n = 57
3.80 (4.02) n = 236
6 4.13 (4.43) n = 51
2.24 (2.72)n = 54
NA NA NA 3.13 (3.75) n = 106
Obsessive‐Compulsive
1 9.76 (6.52) n = 64
5.41 (4.19)n = 63
10.02 (6.54)n = 33
3.02 (3.29)n = 43
11.03 (5.36) n = 67
8.02 (6.07) n = 270
2 8.92 (6.48) n = 62
4.28 (4.09)n = 58
8.31 (5.99)n = 32
2.78 (3.35)n = 41
10.22 (6.44) n = 64
7.14 (6.18) n = 257
3 8.60 (7.16) n = 59
4.46 (4.14)n = 57
9.03 (5.86)n = 32
2.66 (3.76)n = 41
9.95 (6.66)n = 61
7.06 (6.39) n = 250
4 7.87 (6.54) n = 60
4.75 (96)n = 56
8.14 (5.60)n = 29
2.26 (3.19)n = 39
10.54 (6.62) n = 59
6.93 (6.32) n = 243
5 8.07 (6.51) n = 56
4.27 (4.33)n = 56
7.59 (5.21)n = 29
2.23 (3.19)n = 38
9.18 (6.36)n = 57
6.44 (5.95) n = 236
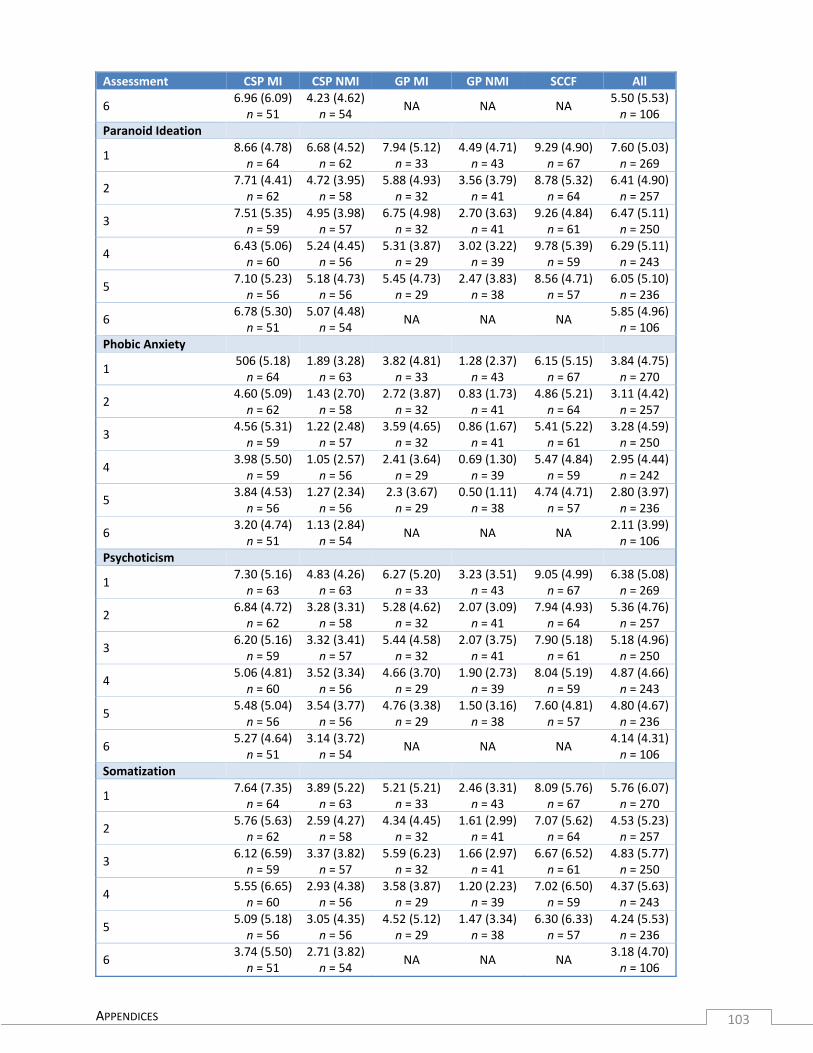
APPENDICES 103
Assessment CSP MI CSP NMI GP MI GP NMI SCCF All
6 6.96 (6.09) n = 51
4.23 (4.62)n = 54
NA NA NA 5.50 (5.53)n = 106
Paranoid Ideation
1 8.66 (4.78) n = 64
6.68 (4.52)n = 62
7.94 (5.12)n = 33
4.49 (4.71)n = 43
9.29 (4.90) n = 67
7.60 (5.03)n = 269
2 7.71 (4.41) n = 62
4.72 (3.95)n = 58
5.88 (4.93)n = 32
3.56 (3.79)n = 41
8.78 (5.32) n = 64
6.41 (4.90)n = 257
3 7.51 (5.35) n = 59
4.95 (3.98)n = 57
6.75 (4.98)n = 32
2.70 (3.63)n = 41
9.26 (4.84) n = 61
6.47 (5.11)n = 250
4 6.43 (5.06) n = 60
5.24 (4.45)n = 56
5.31 (3.87)n = 29
3.02 (3.22)n = 39
9.78 (5.39) n = 59
6.29 (5.11)n = 243
5 7.10 (5.23) n = 56
5.18 (4.73)n = 56
5.45 (4.73)n = 29
2.47 (3.83)n = 38
8.56 (4.71) n = 57
6.05 (5.10)n = 236
6 6.78 (5.30) n = 51
5.07 (4.48)n = 54
NA NA NA 5.85 (4.96)n = 106
Phobic Anxiety
1 506 (5.18) n = 64
1.89 (3.28)n = 63
3.82 (4.81)n = 33
1.28 (2.37)n = 43
6.15 (5.15) n = 67
3.84 (4.75)n = 270
2 4.60 (5.09) n = 62
1.43 (2.70)n = 58
2.72 (3.87)n = 32
0.83 (1.73)n = 41
4.86 (5.21) n = 64
3.11 (4.42)n = 257
3 4.56 (5.31) n = 59
1.22 (2.48)n = 57
3.59 (4.65)n = 32
0.86 (1.67)n = 41
5.41 (5.22) n = 61
3.28 (4.59)n = 250
4 3.98 (5.50) n = 59
1.05 (2.57)n = 56
2.41 (3.64)n = 29
0.69 (1.30)n = 39
5.47 (4.84) n = 59
2.95 (4.44)n = 242
5 3.84 (4.53) n = 56
1.27 (2.34)n = 56
2.3 (3.67)n = 29
0.50 (1.11)n = 38
4.74 (4.71) n = 57
2.80 (3.97)n = 236
6 3.20 (4.74) n = 51
1.13 (2.84)n = 54
NA NA NA 2.11 (3.99)n = 106
Psychoticism
1 7.30 (5.16) n = 63
4.83 (4.26)n = 63
6.27 (5.20)n = 33
3.23 (3.51)n = 43
9.05 (4.99) n = 67
6.38 (5.08)n = 269
2 6.84 (4.72) n = 62
3.28 (3.31)n = 58
5.28 (4.62)n = 32
2.07 (3.09)n = 41
7.94 (4.93) n = 64
5.36 (4.76)n = 257
3 6.20 (5.16) n = 59
3.32 (3.41)n = 57
5.44 (4.58)n = 32
2.07 (3.75)n = 41
7.90 (5.18) n = 61
5.18 (4.96)n = 250
4 5.06 (4.81) n = 60
3.52 (3.34)n = 56
4.66 (3.70)n = 29
1.90 (2.73)n = 39
8.04 (5.19) n = 59
4.87 (4.66)n = 243
5 5.48 (5.04) n = 56
3.54 (3.77)n = 56
4.76 (3.38)n = 29
1.50 (3.16)n = 38
7.60 (4.81) n = 57
4.80 (4.67)n = 236
6 5.27 (4.64) n = 51
3.14 (3.72)n = 54
NA NA NA 4.14 (4.31)n = 106
Somatization
1 7.64 (7.35) n = 64
3.89 (5.22)n = 63
5.21 (5.21)n = 33
2.46 (3.31)n = 43
8.09 (5.76) n = 67
5.76 (6.07)n = 270
2 5.76 (5.63) n = 62
2.59 (4.27)n = 58
4.34 (4.45)n = 32
1.61 (2.99)n = 41
7.07 (5.62) n = 64
4.53 (5.23)n = 257
3 6.12 (6.59) n = 59
3.37 (3.82)n = 57
5.59 (6.23)n = 32
1.66 (2.97)n = 41
6.67 (6.52) n = 61
4.83 (5.77)n = 250
4 5.55 (6.65) n = 60
2.93 (4.38)n = 56
3.58 (3.87)n = 29
1.20 (2.23)n = 39
7.02 (6.50) n = 59
4.37 (5.63)n = 243
5 5.09 (5.18) n = 56
3.05 (4.35)n = 56
4.52 (5.12)n = 29
1.47 (3.34)n = 38
6.30 (6.33) n = 57
4.24 (5.53)n = 236
6 3.74 (5.50) n = 51
2.71 (3.82)n = 54
NA NA NA 3.18 (4.70)n = 106

APPENDICES 104
Coolidge Correctional Inventory (CCI)
The Coolidge Correctional Inventory (CCI; Coolidge, 2004) is an adaptation of the Coolidge Axis II Inventory (CATI; Coolidge, n.d. a; Coolidge, Segal, Klebe, Cahill, & Whitcomb, 2009) designed for use by CDOC with new prison admissions to identify personality disorders and neuropsychological problems among inmates. The assessment follows a self‐report format with a 4‐point scale (1—strongly false to 4—strongly true) across 250 items. Scores are obtained for a total of 33 different scales (Coolidge et al., 2009) based on the Ameri‐can Psychiatric Association’s (2000) diagnostic criteria (DSM‐IV‐TR). The CCI can be used to assess 14 perso‐nality disorders – 10 from the DSM‐IV‐TR Axis II, 2 from the DSM‐IV‐TR (American Psychiatric Association, 2000) appendix, and 2 from the DSM‐III Axis II (American Psychiatric Association, 1980; Coolidge et al., 2009). The personality disorders assessed by the CCI are as follows: Antisocial, Avoidant, Borderline, Depen‐dent, Depressive, Histrionic, Narcissistic, Obsessive‐Compulsive, Paranoid, Passive‐Aggressive, Sadistic, Schi‐zoid, Schizotypal, and Self‐Defeating. Furthermore, the CCI is used to assess other psychological and neurop‐sychological problems and syndromes (i.e., Introversion‐Extroversion, Maladjustment, Executive Functions, Decision Difficulty, Planning Problems, Neuropsychological Dysfunction, Language, Memory, Neurosomatic Issues, Hostility‐Anger, Hostility‐Danger, Hostility‐Impulsivity, Hypersensitivity, Drug and Alcohol Problems) as well as five selected Axis I scales and associated subscales (i.e., ADHD, Post‐Traumatic Stress Disorder, Psychotic Thinking, Schizophrenia, Social Phobia, Withdrawal, Anxiety, and Depression; Coolidge et al., 2009). The CCI also has response validity scales available. For this study, the CCI personality disorders and Axis I scales were used as potential predictors of outcomes.
The Cronbach’s alphas for the CCI’s subscales were found to be acceptable within prison populations, with a median Cronbach’s alpha of .78 for the personality subscales (range = .65 ‐ .86) in a sample of 3,962 inmates (Coolidge et al., 2009) and a median Cronbach’s alpha of .75 (range = .47 ‐ .84) in a sample of 3,090 inmates (Whitcomb, 2006). Mean scores on the personality disorders subscales of the CCI ranged from 42.76 (SD = 8.59) to 54.27 (SD = 10.88), with a median of 47.67 (Coolidge et al., 2009). In another study, Whitcomb (2006) found mean scores ranging from 41.25 (SD = 9.47) to 58.80 (SD = 9.97) for violent offenders and from 41.38 (SD = 9.50) to 58.71 (SD = 9.29) for nonviolent offenders.
Because the CCI is an adaptation of the CATI and little research has been done on the CCI, test‐retest reliabil‐ity as well as convergent validity can, at the very least, be evaluated for the CATI as it measures many of the same components as the CCI but was not designed for correctional populations (Coolidge, n.d. a, Coolidge, n.d. b). One‐week test‐retest reliabilities were found to be strong, with an average correlation of .90 for the personality disorders (Coolidge, n.d. b). Scores on personality disorder scales of the CATI were correlated with scores on the respective Brief Millon Clinical Multiaxial Inventory II (MCMI‐II) scales (range = .10 to .87; Mdn = .58; Coolidge, n.d. b).
Cronbach’s alphas for the single assessment period of the CCI were varied with values ranging between .46 and .88 (M = .74). The majority of the internal consistency estimates were greater than .70 with lower esti‐mates for Histrionic (.66), Self‐defeating (.64), Schizoid (.55), and Impulsivity (.46) scales.
Deliberate Self‐Harm Inventory (DSHI)
In order to assess self‐harming behavior in inmates who participated in this study, we used the Deliberate Self‐Harm Inventory (DSHI; Gratz, 2001; Gratz & Chapman, 2007). The DSHI is a 17‐item measure that ques‐tions respondents about various self‐harming behaviors. Engagement in as well as frequency of engagement

APPENDICES 105
in different self‐harming behaviors are assessed. At the first testing session in this study, participants were asked about their lifetime history of deliberate self‐harm. Specifically, they were asked to indicate whether they have ever engaged in the various self‐harming behaviors and, if so, how old they were when they first engaged in the activity, how many times they engaged in the activity, when they most recently engaged in the behavior, how many years they engaged in the behavior, and whether engaging in the activity ever led to required medical treatment and/or hospitalization. Completion of this assessment takes most people less than 5 minutes (Fliege et al., 2006). For this study, self‐harming behavior was coded as a dichotomous varia‐ble; a self‐harm total score was computed by summing the yes/no responses across the 17 self‐harming be‐haviors. Additionally, the DSHI was administered at the last testing period for some of the participants; however, the number of participants was small and those assessments were not used in this report.
Internal consistency reliability for the DSHI in clinical populations was found to be .81, with a split‐half corre‐lation of .78 (Fliege et al., 2006). Item‐total correlations in Fliege et al.’s (2006) study were between .23 and .55. Item‐total correlations in a nonclinical sample ranged from .00 to .65, with a median item‐total correla‐tion of .45 (Gratz, 2001). Two‐ to four‐week test‐retest reliability was acceptable at .91 in a clinical popula‐tion (Fliege et al., 2006) and at .68 in a nonclinical population (Gratz, 2001). Among a nonclinical population, the internal consistency coefficient was .82 for the DSHI (Gratz, 2001). Gratz also assessed the convergent validity of the DSHI, finding significant moderate correlations with other self‐harm measures (range = .35 to .49), such as the mental health history self‐harm item, Diagnostic Interview for Borderlines‐Revised self‐harm item, and Suicide Behaviors Questionnaire self‐harm item.
For the current sample, the internal consistency estimate for the DSHI with dichotomous responses on the 17 items was acceptable at .84. Table B7 provides the proportion of people who responded yes to each item and summary statistics for the total score.
Table B7. Summary Statistics for the DSHI Items and Total Score Item CSP MI CSP NMI GP MI GP NMI SCCF AllCutting 47% 17% 33% 5% 61% 35%Burn with cigarette 44% 19% 24% 12% 25% 26%Burn with match/lighter 33% 14% 24% 9% 22% 21%Carved words into skin 16% 14% 21% 5% 25% 17%Carved pictures into skin 14% 14% 15% 2% 18% 13%Purposefully scratched 14% 5% 6% 0% 24% 11%Bitten self (broke skin) 9% 2% 3% 0% 18% 7%Rubbed sandpaper on body 3% 3% 0% 0% 9% 4%Dripped acid on skin 3% 0% 0% 2% 3% 2%Used bleach, comet, oven cleaner to scrub skin 6% 2% 0% 0% 4% 3%Stuck sharp objects into skin 30% 11% 9% 2% 28% 18%Rubbed glass into skin 5% 0% 0% 0% 6% 3%Broken own bones 5% 2% 0% 0% 6% 3%Banged head 20% 5% 18% 2% 27% 15%Punched self 11% 3% 9% 2% 13% 8%Prevented wounds from healing 8% 0% 3% 2% 16% 7%Any other self‐harm 34% 8% 18% 0% 42% 23%
Total M (SD) 3.05 (3.43)
1.19 (1.82)
1.85 (2.28)
0.46 (1.44)
3.50 (3.48)
2.17 (2.96)
Note. Item statistics are the percentage of persons who indicated a history of the self‐harm behavior over their lifetime prior to the study.

APPENDICES 106
Personality Assessment Screener (PAS)
The PAS is a quick and effective screening tool that gauges the social functioning of an individual globally and across 10 subscales (viz., Negative Affect, Acting Out, Health Problems, Psychotic Features, Social With‐drawal, Hostile Control, Suicidal Thinking, Alienation, Alcohol Problem, Anger Control; Harrison & Rogers, 2007). The alcohol problem subscale was not included in this study because it was not a construct of inter‐est. The PAS is a 22‐item screening measure that was originally derived from the larger Personality Assess‐ment Inventory (Morey, 1991). Respondents rate each statement on a 4‐point scale (F—false, ST—slightly true, MT—mostly true, VT—very true); higher scores on this measure indicate greater severity of clinical problems (Morey, 1997) or problems with impression management, as Holden, Book, Edwards, Wasylkiw, and Starzyk (2003) termed it. In order to complete this test, a 4th grade reading level is required; it should take no longer than 5 minutes to complete this assessment (Morey, 1997). For this study, raw scores rather than P‐scores were evaluated.
Levels of internal consistency reliability are acceptable for the PAS total score as well as for subscale scores. In a sample of county jail inmates (N = 100), the Cronbach’s alpha was .74 (Harrison & Rogers, 2007) for total scores but lower for subscales, which is likely due to the small number of items (2) on each subscale. Despite the low number of items on each subscale, 6 of the 10 subscales exhibited alpha coefficients of .60 or greater (i.e., Nega‐tive Affect, Health Problems, Psychotic Features, Social Withdrawal, Suicidal Thinking, and Alienation; Harrison & Rogers, 2007); alpha coefficients on the remaining subscales were not provided in Harrison and Rogers’ (2007) study. Alpha coefficients for the PAS total score have also been assessed in clinical and nonclinical samples. In a nonclinical sample, internal consistency was found to be .75 for the total score and ranged between .34 (i.e., Al‐cohol Problem) and .68 (i.e., Suicidal Thinking) for subscales (Morey, 1997). In a clinical sample, internal consis‐tency was found to be .79 for the total score and ranged between .48 and .84 for subscales (Morey, 1997).
Both the total score and subscale scores were assessed to have good test‐retest reliability. For a nonclinical sample, 1‐month test‐retest reliability was .89 for the total PAS score and ranged between .66 and .92 for the subscales (Morey, 1997), with a median test‐retest reliability of .77 across subscales. For a clinical sam‐ple, 1‐month test‐retest reliability was .85 for the total PAS score and ranged between .47 and .81 for the subscales (Morey, 1997), with a median test‐retest reliability of .66 across subscales.
Normative data on the PAS are available for both clinical and nonclinical populations. The mean raw PAS total score for a nonclinical, community sample was found to be 16.66 (SD = 7.40; Morey, 1997). Mean raw scores on subscales ranged from .37 (SD = .94) to 4.05 (SD = .54; Holden et al., 2003; Morey, 1997). The mean raw PAS total score for a clinical sample was found to be 25.83 (SD = 9.99; Morey, 1997). Mean raw scores on subscales ranged from 1.19 (SD = 1.53) to 4.99 (SD = 2.48; Morey, 1997). Additionally, the PAS has shown good convergent validity (Morey, 1997). The total score on the PAS has been positively correlated with scores on the PAI and MMPI (Gondolf, 2008; Morey, 1997). Furthermore, adequate convergent validity has also been shown for the different subscales of the PAS (Gondolf, 2008; Morey, 1997).
Table B8 provides the summary statistics for the study groups on the PAS scales at each time period. Cron‐bach’s alphas were computed to assess internal consistency reliability with coefficients ranging between .27 and .95 (M = .64). These estimates were somewhat lower than those found in the literature. The lowest re‐liability estimates were for the Acting Out and Hostile Control subscales. Test‐retest correlation coefficients ranged between .54 and .84 (M = .69). Correlations of the PAS subscales with other self‐report measures of

APPENDICES 107
the same construct ranged between .34 and .67 (M = .50) and with correctional officer and clinician ratings the correlations ranged between .08 and .34 (M = .21).
Table B8. Summary Statistics (M, SD, n) on PAS Scales by Group and Time Assessment CSP MI CSP NMI GP MI GP NMI SCCF All Acting Out
Time 1 6.38 (1.94) n = 64
6.40 (2.06)n = 63
7.24 (1.85)n = 33
6.40 (1.90)n = 43
6.79 (1.74)n = 67
6.59 (1.91) n = 270
Time 2 6.21 (2.07) n = 62
6.01 (1.99)n = 59
6.66 (1.94)n = 32
6.29 (1.93)n = 41
6.26 (1.88)n = 64
6.24 (1.96) n = 258
Time 3 5.98 (2.04) n = 60
5.79 (2.15)n = 57
6.81 (1.49)n = 32
5.95 (2.12)n = 41
6.03 (1.97)n = 61
6.05 (2.01) n = 251
Time 4 5.80 (2.07) n = 60
5.84 (2.21)n = 56
6.48 (1.57)n = 29
5.51 (2.39)n = 39
6.23 (2.02)n = 59
5.95 (2.10) n = 243
Time 5 5.52 (2.25) n = 56
6.07 (2.21)n = 56
6.66 (1.26)n = 29
5.78 (1.89)n = 38
6.32 (2.15)n = 57
6.02 (2.08) n = 236
Time 6 5.81 (2.42) n = 51
6.15 (206)n = 54
NA NA NA 5.96 (2.25) n = 106
Alienation
Time 1 3.44 (1.96) n = 63
3.08 (1.71)n = 63
3.88 (1.71)n = 33
2.63 (1.83)n = 43
4.06 (1.94)n = 67
3.43 (1.90) n = 269
Time 2 4.12 (1.73) n = 60
3.41 (1.92)n = 59
3.84 (1.48)n = 32
2.93 (1.65)n = 41
4.42 (1.73)n = 64
3.80 (1.80) n = 256
Time 3 3.92 (1.82) n = 60
3.35 (1.88)n = 57
4.06 (1.41)n = 32
2.83 (1.67)n = 41
4.44 (1.68)n = 61
3.76 (1.80) n = 251
Time 4 3.86 (1.81) n = 59
3.55 (1.90)n = 56
3.32 (1.47)n = 28
2.85 (1.71)n = 39
4.58 (1.45)n = 59
3.74 (1.78) n = 241
Time 5 3.86 (1.66) n = 56
3.45 (1.84)n = 56
3.48 (1.30)n = 29
2.84 (1.79)n = 37
4.46 (1.42)n = 57
3.70 (1.70) n = 235
Time 6 3.78 (1.79) n = 51
3.52 (1.79)n = 54
NA NA NA 3.64 (1.78) n = 106
Anger Control
Time 1 3.52 (1.82) n = 64
2.79 (1.63)n = 63
3.06 (1.69)n = 33
2.19 (1.30)n = 43
2.92 (1.78)n = 67
2.93 (1.72) n = 270
Time 2 3.39 (1.83) n = 62
2.47 (1.56)n = 58
2.91 (1.78)n = 32
2.10 (1.18)n = 41
3.03 (1.94)n = 64
2.82 (1.75) n = 257
Time 3 3.38 (1.76) n = 60
2.70 (1.65)n = 56
2.81 (1.47)n = 32
2.12 (1.42)n = 41
3.02 (1.78)n = 61
2.86 (1.69) n = 250
Time 4 3.24 (1.72) n = 59
2.61 (1.67)n = 56
2.66 (1.54)n = 29
2.08 (1.44)n = 39
2.90 (1.87)n = 59
2.75 (1.72) n = 242
Time 5 3.09 (1.69) n = 56
2.55 (1.49)n = 56
2.96 (1.73)n = 28
2.18 (1.61)n = 38
2.89 (1.75)n = 57
2.75 (1.67) n = 235
Time 6 2.98 (1.61) n = 51
2.52 (1.66)n = 54
NA NA NA 2.74 (1.63) n = 106
Health Problems
Time 1 2.00 (1.62) n = 64
1.24 (1.64)n = 63
2.30 (1.78)n = 33
1.28 (1.79)n = 43
2.94 (1.70)n = 67
1.98 (1.81) n = 270
Time 2 2.05 (2.02) n = 61
1.12 (1.66)n = 58
1.84 (1.72)n = 32
1.17 (1.32)n = 41
2.84 (1.64)n = 64
1.87 (1.83) n = 256
Time 3 2.43 (1.97) n = 60
1.18 (1.69)n = 56
1.91 (1.75)n = 32
1.05 (1.24)n = 41
2.54 (1.53)n = 61
1.88 (1.77) n = 250
Time 4 1.95 (1.66) n = 59
1.07 (1.26)n = 56
1.62 (1.29)n = 29
0.95 (1.10)n = 39
2.60 (1.67)n = 58
1.70 (1.58) n = 241

APPENDICES 108
Assessment CSP MI CSP NMI GP MI GP NMI SCCF All
Time 5 2.02 (1.93) n = 54
0.94 (1.13) n = 55
2.00 (1.58)n = 29
0.97 (1.28)n = 38
2.53 (1.59)n = 57
1.72 (1.66) n = 233
Time 6 1.96 (1.65) n = 50
1.17 (1.38) n = 54
NA NA NA 1.53 (1.56) n = 105
Hostile Control
Time 1 3.35 (1.76) n = 62
3.44 (1.62) n = 63
2.76 (1.58)n = 33
3.28 (1.45)n = 42
2.61 (1.75)n = 67
3.10 (1.68) n = 267
Time 2 3.00 (1.67) n = 61
3.26 (1.50) n = 58
2.91 (1.55)n = 32
3.07 (1.37)n = 41
2.11 (1.44)n = 64
2.84 (1.56) n = 256
Time 3 2.78 (1.61) n = 60
3.32 (1.66) n = 57
2.81 (1.45)n = 32
3.17 (1.46)n = 41
2.48 (1.51)n = 61
2.90 (1.57) n = 251
Time 4 2.85 (1.63) n = 59
3.29 (1.50) n = 55
3.17 (1.07)n = 29
3.13 (1.32)n = 39
2.51 (1.60)n = 59
2.95 (1.50) n = 241
Time 5 2.87 (1.60) n = 55
3.18 (1.54) n = 55
2.76 (1.33)n = 29
3.16 (1.52)n = 38
2.16 (1.36)n = 55
2.81 (1.52) n = 232
Time 6 2.90 (1.78) n = 50
3.17 (1.60) n = 53
NA NA NA 3.04 (1.68) n = 104
Negative Affect
Time 1 4.89 (2.48) n = 64
3.40 (1.56) n = 63
4.73 (2.30)n = 33
2.64 (1.64)n = 43
5.60 (2.32)n = 67
4.34 (2.35) n = 270
Time 2 4.79 (2.06) n = 62
3.06 (1.88) n = 59
4.56 (2.50)n = 32
2.68 (1.88)n = 41
5.08 (2.16)n = 64
4.10 (2.28) n = 258
Time 3 4.50 (2.20) n = 60
3.17 (1.74) n = 57
4.59 (2.11)n = 32
2.34 (1.77)n = 41
4.95 (2.33)n = 61
3.97 (2.26) n = 251
Time 4 4.68 (2.35) n = 60
3.21 (1.99) n = 56
4.07 (1.93)n = 29
2.38 (1.60)n = 39
5.36 (2.31)n = 59
4.06 (2.34) n = 243
Time 5 4.09 (2.32) n = 56
3.18 (1.88) n = 56
4.17 (1.98)n = 29
2.21 (1.51)n = 38
5.12 (2.25)n = 57
3.83 (2.26) n = 236
Time 6 3.94 (2.14) n = 51
3.06 (1.73) n = 54
NA NA NA 3.50 (1.98) n = 106
Psychotic Features
Time 1 1.95 (1.54) n = 64
1.46 (1.51) n = 63
1.91 (1.55)n = 33
0.95 (1.25)n = 43
2.31 (1.88)n = 65
1.76 (1.64) n = 268
Time 2 1.90 (1.68) n = 61
1.24 (1.28) n = 59
1.62 (1.74)n = 32
0.85 (1.11)n = 41
2.17 (2.05)n = 64
1.61 (1.69) n = 257
Time 3 2.05 (1.82) n = 60
1.23 (1.27) n = 57
1.59 (1.62)n = 32
0.93 (1.33)n = 41
2.38 (1.72)n = 60
1.70 (1.66) n = 250
Time 4 1.80 (1.64) n = 60
1.38 (1.45) n = 56
1.00 (.92)n = 29
1.03 (1.20)n = 39
2.30 (1.87)n = 59
1.60 (1.59) n = 243
Time 5 2.04 (1.70) n = 56
1.45 (1.55) n = 55
1.28 (1.13)n = 29
0.79 (1.23)n = 38
2.14 (1.92)n = 57
1.63 (1.66) n = 235
Time 6 1.74 (1.82) n = 51
1.33 (1.24) n = 54
NA NA NA 1.52 (1.56) n = 106
Social Withdrawal
Time 1 3.14 (1.74) n = 64
2.28 (1.42) n = 63
2.91 (1.88)n = 33
2.05 (1.68)n = 43
3.46 (1.88)n = 67
2.82 (1.78) n = 270
Time 2 3.53 (1.82) n = 62
2.51 (1.68) n = 59
2.75 (1.87)n = 32
2.20 (1.42)n = 41
3.61 (1.81)n = 64
3.01 (1.81) n = 258
Time 3 3.30 (1.82) n = 60
2.43 (1.69) n = 56
2.91 (1.61)n = 32
2.05 (1.38)n = 40
3.73 (1.66)n = 60
2.96 (1.76) n = 248
Time 4 3.52 (1.69) n = 60
2.68 (1.65) n = 56
2.72 (1.41)n = 29
2.31 (1.73)n = 39
3.48 (1.66)n = 58
3.02 (1.71) n = 242
Time 5 3.13 (1.77) n = 56
2.55 (1.62) n = 56
2.66 (1.37)n = 29
2.26 (1.62)n = 38
3.82 (1.75)n = 56
2.96 (1.74) n = 2356

APPENDICES 109
Assessment CSP MI CSP NMI GP MI GP NMI SCCF All
Time 6 3.16 (1.76) n = 50
2.57 (1.60)n = 53
NA NA NA 2.88 (1.70) n = 104
Suicidal Thinking
Time 1 0.95 (1.64) n = 62
0.35 (1.12)n = 62
0.53 (1.08)n = 32
0.05 (.21)n = 43
2.64 (2.27)n = 67
1.04 (1.81) n = 266
Time 2 0.93 (1.63) n = 61
0.29 (.90)n = 58
0.53 (1.22)n = 32
0.05 (.31)n = 41
2.41 (2.36)n = 64
0.96 (1.78) n = 256
Time 3 0.83 (1.59) n = 58
0.21 (.86)n = 57
0.62 (1.36)n = 32
0.10 (.49)n = 41
2.31 (2.40)n = 61
0.90 (1.77) n = 249
Time 4 1.03 (1.83) n = 60
0.21 (.97)n = 56
0.52 (1.30)n = 29
0.02 (.16)n = 39
2.39 (2.24)n = 59
0.95 (1.80) n = 243
Time 5 0.87 (1.62) n = 55
0.20 (.80)n = 56
0.52 (1.30)n = 29
0.10 (.51)n = 38
2.02 (2.00)n = 57
0.82 (1.58) n = 235
Time 6 0.86 (1.71) n = 51
0.26 (1.08)n = 53
NA NA NA 0.55 (1.44) n = 105
Prison Behavior Rating Scale (PBRS)
The PBRS was developed by Cooke (1998) for correctional staff to rate inmates’ behaviors in prison. While the use of the PBRS in U.S. prisons has been limited, we were unable to find another rating scale that could be easily used by correctional staff to record direct observations of inmates’ behaviors. The PBRS is a 36‐item measure comprising three subscales: Anti‐Authority, Anxious‐Depressed, and Dull‐Confused. Higher scores on the PBRS indicate worse behavior assessments of inmates by officers. Correctional staff use a 4‐point rating scale (0—never/rarely, 1—sometimes, 2—often, 3—most of the time) to rate the inmates’ beha‐viors within the 4 weeks preceding the assessment. The PBRS was modified to use language that was more relevant for a United States sample; the questionnaire is given in Appendix A.
The PBRS demonstrated adequate internal consistency reliability across the three subscales in a sample of 467 male prisoners: .91 for Anti‐Authority, .84 for Anxious‐Depressed, and .72 for Dull‐Confused (Cooke, 1998). Cooke also demonstrated good test‐retest reliability over 2 to 3 weeks, with .76 for Anti‐Authority, .86 for Anxious‐Depressed, and .82 for Dull‐Confused.
Table B9 provides the summary statistics for the study groups on the PBRS scales at each time period. Inter‐nal consistency estimates for the PBRS scales at each time period are provided in Table B10. These alphas indicate strong internal consistency with a mean alpha of .90. Correlations between sequential time periods are provided in Table B11. Correlations between the first and second testing intervals tended to have the weakest correlation coefficients (M = .16); this period is when many of the participants switched facilities so there was a change in raters who may lack familiarity with the participants. Correlations between PBRS scales and relevant clinician ratings were low (range = .08 to .24, M = .19) as they were with self‐report as‐sessments (range = ‐.07 to .27, M = .10). Although the PBRS shows strong internal consistency estimates and some evidence for test‐retest reliability, it does not relate well with other measures of similar constructs.

APPENDICES 110
Table B9. Summary Statistics (M, SD, n) on PBRS Scales by Group and Time Assessment CSP MI CSP NMI GP MI GP NMI SCCF AllAnti‐Authority
Time 1 7.62 (7.37) n = 63
7.68 (7.33)n = 63
6.05 (5.67)n = 26
6.28 (7.39)n = 36
2.90 (5.51) n = 67
6.05 (6.99)n = 255
Time 2 6.21 (7.40) n = 61
5.48 (6.67)n = 59
7.06 (5.07)n = 28
8.02 (6.96)n = 35
4.59 (5.34) n = 64
5.97 (6.19)n = 247
Time 3 6.17 (7.40) n = 57
3.73 (4.75)n = 56
9.01 (9.05)n = 28
6.92 (6.29)n = 34
4.75 (5.62) n = 51
5.71 (6.68)n = 226
Time 4 4.02 (5.84) n = 59
4.56 (4.88)n = 55
6.85 (7.96)n = 26
8.66 (6.32)n = 31
5.34 (6.24) n = 55
5.43 (6.21)n = 225
Time 5 4.88 (6.42) n = 56
3.32 (4.38)n = 54
7.30 (9.92)n = 27
7.63 (7.37)n = 36
6.00 (7.14) n = 54
5.50 (6.98)n = 227
Time 6 3.90 (5.11) n = 49
2.48 (4.27)n = 54
NA NA NA 3.15 (4.72)n = 103
Anxious‐Depressed
Time 1 6.87 (7.26) n = 64
3.56 (4.61)n = 63
4.08 (5.73)n = 26
2.89 (3.59)n = 36
5.25 (5.06) n = 67
4.79 (5.65)n = 256
Time 2 4.39 (5.81) n = 61
2.00 (3.42)n = 59
5.24 (6.58)n = 28
3.59 (4.08)n = 34
5.25 (5.06) n = 256
4.30 (5.32)n = 246
Time 3 3.14 (4.10) n = 57
1.51 (2.72)n = 56
5.81 (3.91)n = 28
3.97 (3.64)n = 33
6.31 (5.46) n = 246
3.76 (4.18)n = 224
Time 4 3.41 (4.49) n = 59
1.51 (3.29)n = 55
3.59 (4.37)n = 26
8.66 (5.06)n = 30
5.73 (4.73) n = 224
3.73 (5.04)n = 224
Time 5 3.45 (4.57) n = 55
1.74 (3.21)n = 54
3.70 (4.90)n = 27
3.51 (5.39)n = 35
6.36 (6.20) n = 224
3.99 (5.40)n = 225
Time 6 4.00 (5.24) n = 48
1.63 (3.06)n = 54
NA NA NA 2.74 (4.37)n = 102
Dull‐Confused
Time 1 3.80 (4.04) n = 64
2.14 (2.90)n = 63
6.05 (5.67)n = 26
6.28 (7.39)n = 36
3.51 (3.94) n = 67
2.94 (3.50)n = 256
Time 2 3.08 (4.01) n = 61
1.38 (2.44)n = 58
7.06 (5.07)n = 28
8.02 (6.96)n = 34
4.18 (4.05) n = 64
2.78 (3.50)n = 245
Time 3 2.35 (2.93) n = 57
0.93 (1.23)n = 56
9.01 (9.05)n = 28
6.92 (6.29)n = 33
3.84 (3.63) n = 51
2.36 (2.85)n = 225
Time 4 2.78 (3.55) n = 59
0.96 (1.41)n = 55
6.85 (7.96)n = 26
8.66 (6.32)n = 31
4.01 (3.96) n = 54
2.45 (3.29)n = 225
Time 5 2.64 (3.43) n = 55
1.05 (1.56)n = 53
7.30 (9.92)n = 27
7.63 (7.37)n = 35
4.69 (4.82) n = 54
2.54 (3.65)n = 224
Time 6 3.12 (3.64) n = 49
1.37 (2.64)n = 54
NA NA NA 2.20 (3.26)n = 103
Total Score
Time 1 18.53 (15.94)
n = 64 13.53 (12.84)
n = 63 13.17 (13.80)
n = 26 11.06 (11.93)
n = 36 11.90 (13.52)
n = 67 13.97 (14.01)
n = 256
Time 2 13.98 (14.41)
n = 61 9.00 (11.15)
n = 59 15.12 (12.58)
n = 28 13.64 (10.66)
n = 34 15.43 (12.16)
n = 64 13.25 (12.54)
n = 246
Time 3 11.90 (13.52)
n = 57 6.23 (7.60)n = 56
17.77 (12.88)n = 28
13.27(9.58)n = 33
14.65 (11.77) n = 51
12.05 (11.58)n = 225
Time 4 10.55 (11.75)
n = 59 7.10 (7.44)n = 55
12.63 (12.74)n = 26
14.45 (11.97)n = 30
15.96 (15.24) n = 54
11.77 (12.34)n = 224
Time 5 11.10 (12.04)
n = 55 6.38 (7.35)n = 54
12.26 (14.76)n = 27
13.54 (14.87)n = 35
18.39 (16.48) n = 54
12.24 (13.74)n = 225
Time 6 10.94 (12.11)
n = 48 6.38 (7.35)n = 54
NA NA NA 8.06 (10.53)n = 102

APPENDICES 111
Table B10. Internal Consistency Estimates (Cronbach’s alpha) for PBRS Scales at each Time Period PBRS Scale Time 1 Time 2 Time 3 Time 4 Time 5 Time 6Anti‐Authority .94 .93 .94 .94 .95 .90Anxious‐Depressed .90 .90 .94 .90 .90 .90Dull‐Confused .84 .84 .78 .85 .87 .82Total .95 .94 .94 .95 .95 .94 Table B11. Testretest Correlations between Consecutive Time Periods for each PBRS Subscale Measure T1–T2 T2–T3 T3–T4 T4–T5 T5–T6Anti‐Authority .24 .36 .33 .55 .59Anxious‐Depressed .14 .33 .46 .58 .48Dull‐Confused .08 .38 .39 .55 .31Total .16 .38 .42 .66 .51
Prison Symptom Inventory (PSI)
The PSI was created by the research staff for this study to measure variables that were not assessed by oth‐er existing psychological measures but were thought to be important in association with long‐term segrega‐tion. Using the literature concerning the impact of AS on psychological functioning (e.g., Grassian, 1983; Ha‐ney, 2003), questions were written to assess symptoms associated with this form of confinement, including nervousness, headaches, lethargy, chronic tiredness, trouble sleeping, a sense of impending breakdown, perspiring hands, heart palpitations, dizziness, nightmares, trembling hands, and fainting. Furthermore, questions about exercise, grooming, and safety issues within administration segregation were included in the PSI. The scale has 39 items, rated on a 6‐point scale (0‐ never true to 5‐ always true). Questions were grouped into the following nine areas: fear level, safety, panic disorder, sensitivity to external stimuli, physi‐cal hygiene, physical well‐being and exercise, mental well‐being, mutism, and attitudes about administrative segregation. The questionnaire is given in Appendix A.
Three subscales were used as part of the major constructs of interest: panic disorder as a measure of anxie‐ty, sensitivity to external stimuli as a measure of hypersensitivity, and physical well‐being and exercise as a measure of somatization. Fear level, safety, and attitudes about segregation subscales were used as predic‐tors of how people changed over time, rather than as outcome variables. Analyses comparing groups on all of the PSI scales are included in Appendix C. Table B12 provides the summary statistics for the study groups on PSI scales at each time period.
Table B12. Summary Statistics (M, SD, n) on PSI Scales by Group and Time Assessment CSP MI CSP NMI GP MI GP NMI SCCF AllAttitudes about Segregation
Time 1 2.95 (3.19) n = 57
1.68 (2.57)n = 56
2.46 (3.00)n = 28
1.00 (2.10)n = 30
4.58 (3.47) n = 67
2.81 (3.24)n = 238
Time 2 2.97 (3.54) n = 61
1.68 (2.63)n = 56
2.24 (2.76)n = 25
1.54 (2.42)n = 26
5.55 (3.30) n = 60
3.09 (3.42)n = 228
Time 3 3.02 (3.36) n = 55
1.04 (2.39)n = 56
2.04 (2.30)n = 25
1.22 (1.60)n = 27
4.62 (3.45) n = 55
2.58 (3.18)n = 218
Time 4 2.60 (3.21) n = 55
1.29 (2.43)n = 55
1.91 (2.45)n = 22
1.83 (2.58)n = 24
4.96 (3.42) n = 46
2.61 (3.20)n = 202
Time 5 3.12 (3.51) n = 52
1.45 (2.32)n = 55
2.54 (2.67)n = 22
1.30 (1.98)n = 20
5.24 (3.57) n = 45
2.89 (3.32)n = 194
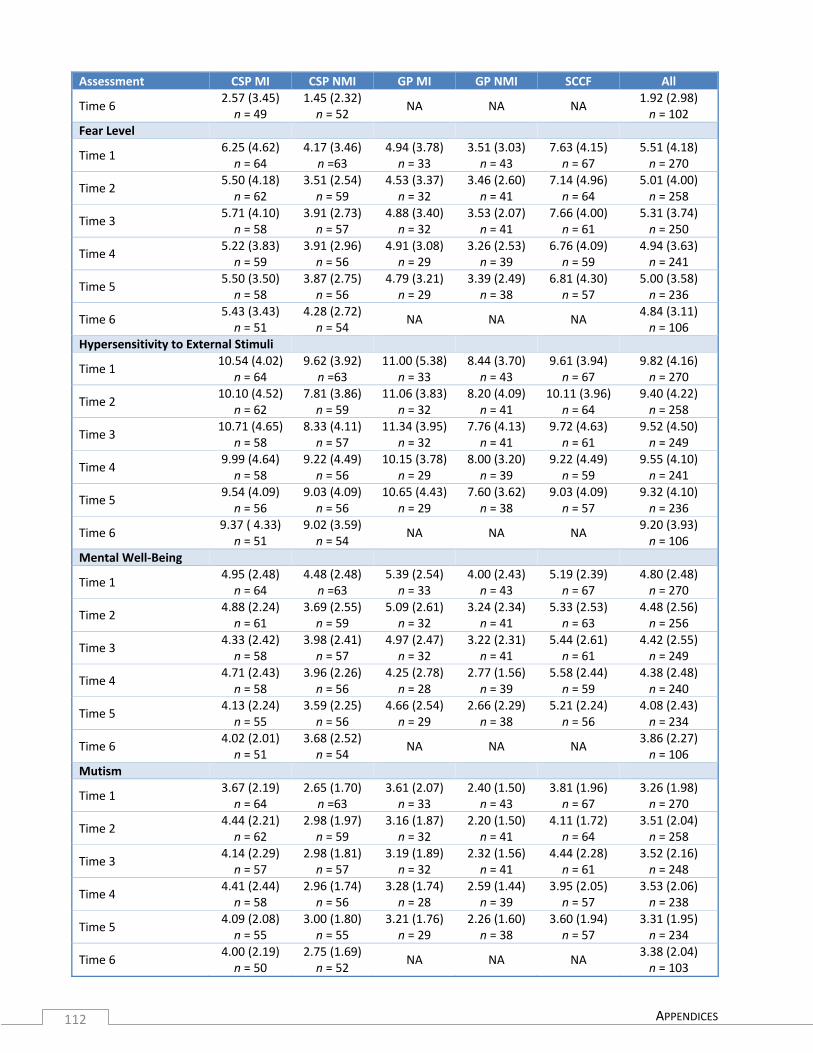
APPENDICES 112
Assessment CSP MI CSP NMI GP MI GP NMI SCCF All
Time 6 2.57 (3.45) n = 49
1.45 (2.32)n = 52
NA NA NA 1.92 (2.98)n = 102
Fear Level
Time 1 6.25 (4.62) n = 64
4.17 (3.46)n =63
4.94 (3.78)n = 33
3.51 (3.03)n = 43
7.63 (4.15) n = 67
5.51 (4.18)n = 270
Time 2 5.50 (4.18) n = 62
3.51 (2.54)n = 59
4.53 (3.37)n = 32
3.46 (2.60)n = 41
7.14 (4.96) n = 64
5.01 (4.00)n = 258
Time 3 5.71 (4.10) n = 58
3.91 (2.73)n = 57
4.88 (3.40)n = 32
3.53 (2.07)n = 41
7.66 (4.00) n = 61
5.31 (3.74)n = 250
Time 4 5.22 (3.83) n = 59
3.91 (2.96)n = 56
4.91 (3.08)n = 29
3.26 (2.53)n = 39
6.76 (4.09) n = 59
4.94 (3.63)n = 241
Time 5 5.50 (3.50) n = 58
3.87 (2.75)n = 56
4.79 (3.21)n = 29
3.39 (2.49)n = 38
6.81 (4.30) n = 57
5.00 (3.58)n = 236
Time 6 5.43 (3.43) n = 51
4.28 (2.72)n = 54
NA NA NA 4.84 (3.11)n = 106
Hypersensitivity to External Stimuli
Time 1 10.54 (4.02)
n = 64 9.62 (3.92)
n =63 11.00 (5.38)
n = 33 8.44 (3.70)n = 43
9.61 (3.94) n = 67
9.82 (4.16)n = 270
Time 2 10.10 (4.52)
n = 62 7.81 (3.86)n = 59
11.06 (3.83)n = 32
8.20 (4.09)n = 41
10.11 (3.96) n = 64
9.40 (4.22)n = 258
Time 3 10.71 (4.65)
n = 58 8.33 (4.11)n = 57
11.34 (3.95)n = 32
7.76 (4.13)n = 41
9.72 (4.63) n = 61
9.52 (4.50)n = 249
Time 4 9.99 (4.64) n = 58
9.22 (4.49)n = 56
10.15 (3.78)n = 29
8.00 (3.20)n = 39
9.22 (4.49) n = 59
9.55 (4.10)n = 241
Time 5 9.54 (4.09) n = 56
9.03 (4.09)n = 56
10.65 (4.43)n = 29
7.60 (3.62)n = 38
9.03 (4.09) n = 57
9.32 (4.10)n = 236
Time 6 9.37 ( 4.33)
n = 51 9.02 (3.59)n = 54
NA NA NA 9.20 (3.93)n = 106
Mental Well‐Being
Time 1 4.95 (2.48) n = 64
4.48 (2.48)n =63
5.39 (2.54)n = 33
4.00 (2.43)n = 43
5.19 (2.39) n = 67
4.80 (2.48)n = 270
Time 2 4.88 (2.24) n = 61
3.69 (2.55)n = 59
5.09 (2.61)n = 32
3.24 (2.34)n = 41
5.33 (2.53) n = 63
4.48 (2.56)n = 256
Time 3 4.33 (2.42) n = 58
3.98 (2.41)n = 57
4.97 (2.47)n = 32
3.22 (2.31)n = 41
5.44 (2.61) n = 61
4.42 (2.55)n = 249
Time 4 4.71 (2.43) n = 58
3.96 (2.26)n = 56
4.25 (2.78)n = 28
2.77 (1.56)n = 39
5.58 (2.44) n = 59
4.38 (2.48)n = 240
Time 5 4.13 (2.24) n = 55
3.59 (2.25)n = 56
4.66 (2.54)n = 29
2.66 (2.29)n = 38
5.21 (2.24) n = 56
4.08 (2.43)n = 234
Time 6 4.02 (2.01) n = 51
3.68 (2.52)n = 54
NA NA NA 3.86 (2.27)n = 106
Mutism
Time 1 3.67 (2.19) n = 64
2.65 (1.70)n =63
3.61 (2.07)n = 33
2.40 (1.50)n = 43
3.81 (1.96) n = 67
3.26 (1.98)n = 270
Time 2 4.44 (2.21) n = 62
2.98 (1.97)n = 59
3.16 (1.87)n = 32
2.20 (1.50)n = 41
4.11 (1.72) n = 64
3.51 (2.04)n = 258
Time 3 4.14 (2.29) n = 57
2.98 (1.81)n = 57
3.19 (1.89)n = 32
2.32 (1.56)n = 41
4.44 (2.28) n = 61
3.52 (2.16)n = 248
Time 4 4.41 (2.44) n = 58
2.96 (1.74)n = 56
3.28 (1.74)n = 28
2.59 (1.44)n = 39
3.95 (2.05) n = 57
3.53 (2.06)n = 238
Time 5 4.09 (2.08) n = 55
3.00 (1.80)n = 55
3.21 (1.76)n = 29
2.26 (1.60)n = 38
3.60 (1.94) n = 57
3.31 (1.95)n = 234
Time 6 4.00 (2.19) n = 50
2.75 (1.69)n = 52
NA NA NA 3.38 (2.04)n = 103
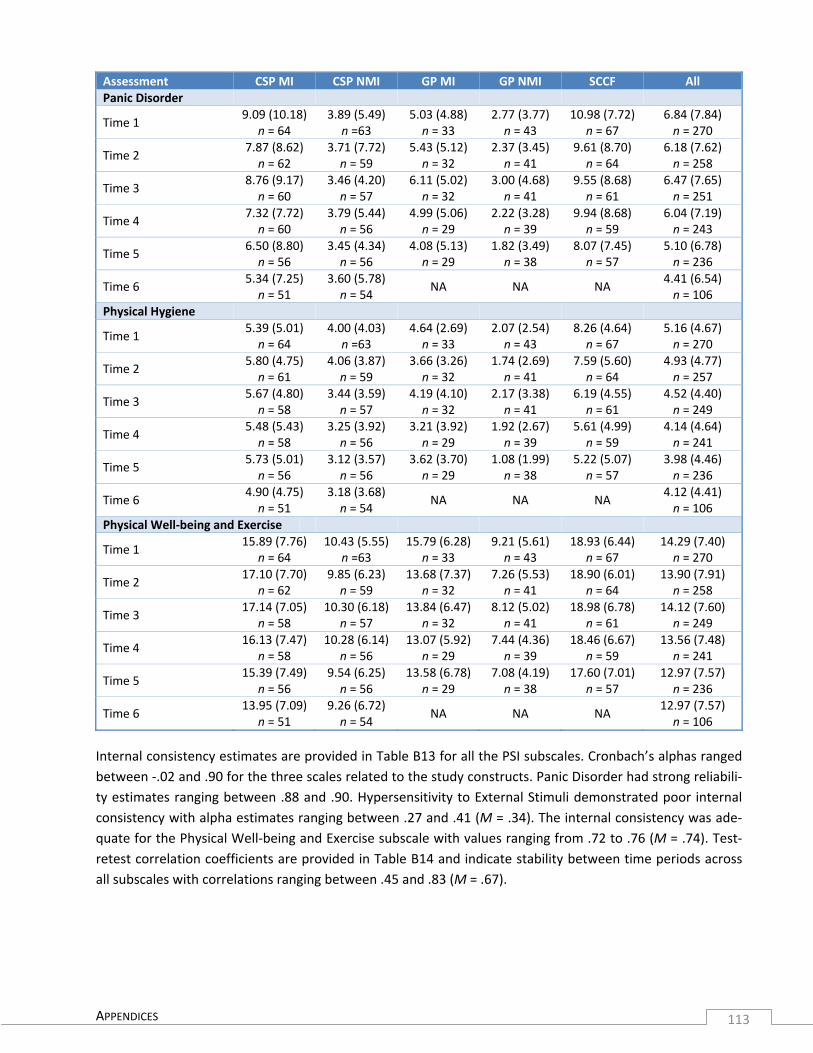
APPENDICES 113
Assessment CSP MI CSP NMI GP MI GP NMI SCCF AllPanic Disorder
Time 1 9.09 (10.18)
n = 64 3.89 (5.49)
n =63 5.03 (4.88)n = 33
2.77 (3.77)n = 43
10.98 (7.72) n = 67
6.84 (7.84)n = 270
Time 2 7.87 (8.62) n = 62
3.71 (7.72)n = 59
5.43 (5.12)n = 32
2.37 (3.45)n = 41
9.61 (8.70) n = 64
6.18 (7.62)n = 258
Time 3 8.76 (9.17) n = 60
3.46 (4.20)n = 57
6.11 (5.02)n = 32
3.00 (4.68)n = 41
9.55 (8.68) n = 61
6.47 (7.65)n = 251
Time 4 7.32 (7.72) n = 60
3.79 (5.44)n = 56
4.99 (5.06)n = 29
2.22 (3.28)n = 39
9.94 (8.68) n = 59
6.04 (7.19)n = 243
Time 5 6.50 (8.80) n = 56
3.45 (4.34)n = 56
4.08 (5.13)n = 29
1.82 (3.49)n = 38
8.07 (7.45) n = 57
5.10 (6.78)n = 236
Time 6 5.34 (7.25) n = 51
3.60 (5.78)n = 54
NA NA NA 4.41 (6.54)n = 106
Physical Hygiene
Time 1 5.39 (5.01) n = 64
4.00 (4.03)n =63
4.64 (2.69)n = 33
2.07 (2.54)n = 43
8.26 (4.64) n = 67
5.16 (4.67)n = 270
Time 2 5.80 (4.75) n = 61
4.06 (3.87)n = 59
3.66 (3.26)n = 32
1.74 (2.69)n = 41
7.59 (5.60) n = 64
4.93 (4.77)n = 257
Time 3 5.67 (4.80) n = 58
3.44 (3.59)n = 57
4.19 (4.10)n = 32
2.17 (3.38)n = 41
6.19 (4.55) n = 61
4.52 (4.40)n = 249
Time 4 5.48 (5.43) n = 58
3.25 (3.92)n = 56
3.21 (3.92)n = 29
1.92 (2.67)n = 39
5.61 (4.99) n = 59
4.14 (4.64)n = 241
Time 5 5.73 (5.01) n = 56
3.12 (3.57)n = 56
3.62 (3.70)n = 29
1.08 (1.99)n = 38
5.22 (5.07) n = 57
3.98 (4.46)n = 236
Time 6 4.90 (4.75) n = 51
3.18 (3.68)n = 54
NA NA NA 4.12 (4.41)n = 106
Physical Well‐being and Exercise
Time 1 15.89 (7.76)
n = 64 10.43 (5.55)
n =63 15.79 (6.28)
n = 33 9.21 (5.61)n = 43
18.93 (6.44) n = 67
14.29 (7.40)n = 270
Time 2 17.10 (7.70)
n = 62 9.85 (6.23)n = 59
13.68 (7.37)n = 32
7.26 (5.53)n = 41
18.90 (6.01) n = 64
13.90 (7.91)n = 258
Time 3 17.14 (7.05)
n = 58 10.30 (6.18)
n = 57 13.84 (6.47)
n = 32 8.12 (5.02)n = 41
18.98 (6.78) n = 61
14.12 (7.60)n = 249
Time 4 16.13 (7.47)
n = 58 10.28 (6.14)
n = 56 13.07 (5.92)
n = 29 7.44 (4.36)n = 39
18.46 (6.67) n = 59
13.56 (7.48)n = 241
Time 5 15.39 (7.49)
n = 56 9.54 (6.25)n = 56
13.58 (6.78)n = 29
7.08 (4.19)n = 38
17.60 (7.01) n = 57
12.97 (7.57)n = 236
Time 6 13.95 (7.09)
n = 51 9.26 (6.72)n = 54
NA NA NA 12.97 (7.57)n = 106
Internal consistency estimates are provided in Table B13 for all the PSI subscales. Cronbach’s alphas ranged between ‐.02 and .90 for the three scales related to the study constructs. Panic Disorder had strong reliabili‐ty estimates ranging between .88 and .90. Hypersensitivity to External Stimuli demonstrated poor internal consistency with alpha estimates ranging between .27 and .41 (M = .34). The internal consistency was ade‐quate for the Physical Well‐being and Exercise subscale with values ranging from .72 to .76 (M = .74). Test‐retest correlation coefficients are provided in Table B14 and indicate stability between time periods across all subscales with correlations ranging between .45 and .83 (M = .67).
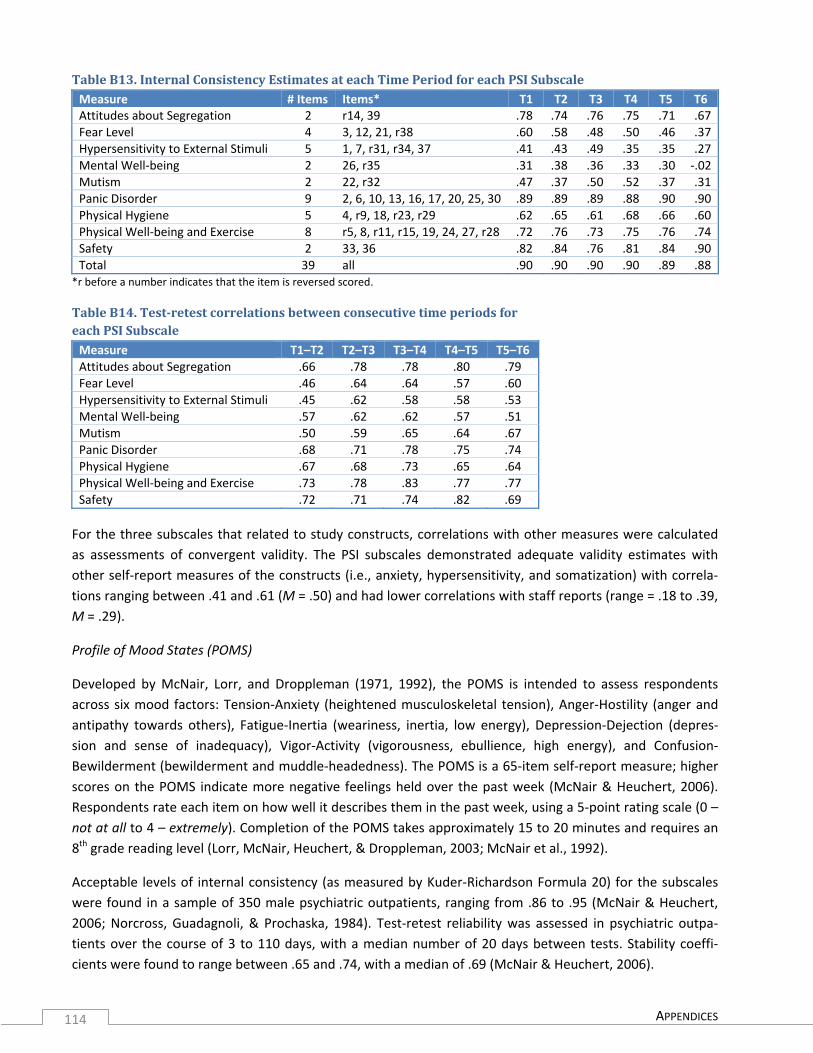
APPENDICES 114
Table B13. Internal Consistency Estimates at each Time Period for each PSI Subscale Measure # Items Items* T1 T2 T3 T4 T5 T6Attitudes about Segregation 2 r14, 39 .78 .74 .76 .75 .71 .67Fear Level 4 3, 12, 21, r38 .60 .58 .48 .50 .46 .37Hypersensitivity to External Stimuli 5 1, 7, r31, r34, 37 .41 .43 .49 .35 .35 .27Mental Well‐being 2 26, r35 .31 .38 .36 .33 .30 ‐.02Mutism 2 22, r32 .47 .37 .50 .52 .37 .31Panic Disorder 9 2, 6, 10, 13, 16, 17, 20, 25, 30 .89 .89 .89 .88 .90 .90Physical Hygiene 5 4, r9, 18, r23, r29 .62 .65 .61 .68 .66 .60Physical Well‐being and Exercise 8 r5, 8, r11, r15, 19, 24, 27, r28 .72 .76 .73 .75 .76 .74Safety 2 33, 36 .82 .84 .76 .81 .84 .90Total 39 all .90 .90 .90 .90 .89 .88
*r before a number indicates that the item is reversed scored.
Table B14. Testretest correlations between consecutive time periods for each PSI Subscale Measure T1–T2 T2–T3 T3–T4 T4–T5 T5–T6Attitudes about Segregation .66 .78 .78 .80 .79Fear Level .46 .64 .64 .57 .60Hypersensitivity to External Stimuli .45 .62 .58 .58 .53Mental Well‐being .57 .62 .62 .57 .51Mutism .50 .59 .65 .64 .67Panic Disorder .68 .71 .78 .75 .74Physical Hygiene .67 .68 .73 .65 .64Physical Well‐being and Exercise .73 .78 .83 .77 .77Safety .72 .71 .74 .82 .69
For the three subscales that related to study constructs, correlations with other measures were calculated as assessments of convergent validity. The PSI subscales demonstrated adequate validity estimates with other self‐report measures of the constructs (i.e., anxiety, hypersensitivity, and somatization) with correla‐tions ranging between .41 and .61 (M = .50) and had lower correlations with staff reports (range = .18 to .39, M = .29).
Profile of Mood States (POMS)
Developed by McNair, Lorr, and Droppleman (1971, 1992), the POMS is intended to assess respondents across six mood factors: Tension‐Anxiety (heightened musculoskeletal tension), Anger‐Hostility (anger and antipathy towards others), Fatigue‐Inertia (weariness, inertia, low energy), Depression‐Dejection (depres‐sion and sense of inadequacy), Vigor‐Activity (vigorousness, ebullience, high energy), and Confusion‐Bewilderment (bewilderment and muddle‐headedness). The POMS is a 65‐item self‐report measure; higher scores on the POMS indicate more negative feelings held over the past week (McNair & Heuchert, 2006). Respondents rate each item on how well it describes them in the past week, using a 5‐point rating scale (0 – not at all to 4 – extremely). Completion of the POMS takes approximately 15 to 20 minutes and requires an 8th grade reading level (Lorr, McNair, Heuchert, & Droppleman, 2003; McNair et al., 1992).
Acceptable levels of internal consistency (as measured by Kuder‐Richardson Formula 20) for the subscales were found in a sample of 350 male psychiatric outpatients, ranging from .86 to .95 (McNair & Heuchert, 2006; Norcross, Guadagnoli, & Prochaska, 1984). Test‐retest reliability was assessed in psychiatric outpa‐tients over the course of 3 to 110 days, with a median number of 20 days between tests. Stability coeffi‐cients were found to range between .65 and .74, with a median of .69 (McNair & Heuchert, 2006).

APPENDICES 115
Normative data are available for a variety of populations but not for a prison population. Means for outpa‐tients ranged from 10.0 (SD = 6.5) to 26.0 (SD = 15.8; McNair & Heuchert, 2006; Norcross et al., 1984). In a nonclinical, community sample comprised of males only, mean scores across subscales ranged from 5.6 (SD = 4.1) to 19.8 (SD = 6.8; McNair & Heuchert, 2006; Nyenhuis, Yamamoto, Luchetta, Terrien, & Parmentier, 1999). In a nonclinical, male college student sample, mean scores across subscales ranged from 8.6 (SD = 4.6) to 15.6 (SD = 6.0; McNair & Heuchert, 2006; Nyenhuis et al., 1999). Convergent validity has also been assessed for the POMS and found to be acceptable for the total and subscale scores (Nyenhuis et al., 1999).
Table B15 provides the summary statistics for the study groups on the POMS subscales at each time period. Estimates of internal consistency reliability were strong with Cronbach’s alphas ranging between .89 and .96 (M = .93). Correlations between sequential time periods indicated stability over time with coefficients rang‐ing between .54 and .80 (M = .68). Convergent validity estimates with other self‐report measures of the same construct ranged between .35 and .81 (M = .57), and with staff reports the coefficients ranged be‐tween .14 and .38 (M = .25).
Table B15. Summary Statistics (M, SD, n) on POMS Subscales by Group and Time Assessment CSP MI CSP NMI GP MI GP NMI SCCF AllAnger‐Hostility
Time 1 20.92 (11.86)
n = 64 14.78 (9.21)
n = 63 19.28 (11.10)
n = 33 10.37 (8.80)
n = 43 18.03 (12.51)
n = 66 16.88 (11.41)
n = 269
Time 2 17.46 (11.29)
n = 61 11.07 (9.36)
n = 58 17.74 (10.34)
n = 32 7.54 (6.76)n = 41
17.80 (12.07)n = 64
14.54 (11.06)n = 256
Time 3 16.88 (12.16)
n = 59 12.23 (10.88)
n = 57 18.61 (10.48)
n = 31 7.67 (8.05)n = 41
17.74 (10.69)n = 61
14.72 (11.30)n = 249
Time 4 17.22 (13.07)
n = 60 12.18 (10.75)
n = 56 16.87 (11.56)
n = 29 7.54 (7.46)n = 39
18.64 (12.34)n = 59
14.81 (12.01)n = 243
Time 5 16.02 (12.01)
n = 56 12.02 (10.64)
n = 55 15.17 (9.80)
n = 29 6.71 (7.61)n = 38
17.63 (11.84)n = 57
13.86 (11.32)n = 235
Time 6 14.03 (11.11)
n = 51 11.65 (10.62)
n = 54 NA NA NA
12.80 (10.88)n = 105
Depression‐Dejection
Time 1 25.13 (15.64)
n = 64 17.17 (13.77)
n = 63 25.34 (16.57)
n = 33 12.27 (11.39)
n = 43 28.92 (14.33)
n = 67 22.19 (15.51)
n = 270
Time 2 22.25 (14.17)
n = 61 13.55 (12.14)
n = 58 21.56 (13.46)
n = 32 8.28 (8.66)n = 41
26.33 (15.39)n = 64
18.98 (14.65)n = 256
Time 3 20.69 (14.91)
n = 59 13.27 (13.42)
n = 57 23.18 (15.04)
n = 31 8.56 (12.16)
n = 41 25.17 (15.23)
n = 61 18.40 (15.52)
n = 249
Time 4 21.18 (14.85)
n = 60 13.90 (12.77)
n = 56 20.38 (15.02)
n = 29 7.36 (7.20)n = 39
8.56 (12.16) n = 59
18.19 (14.80)n = 243
Time 5 19.35 (14.48)
n = 56 12.28 (11.24)
n = 56 19.03 (13.43)
n = 29 6.90 (7.73)n = 38
7.36 (7.20) n = 57
16.97 (14.21)n = 236
Time 6 18.49 (13.01)
n = 51 11.86 (11.94)
n = 54 NA NA NA
15.08 (12.85)n = 105
Fatigue‐Inertia
Time 1 10.10 (6.92)
n = 64 5.99 (6.18)n = 63
10.17 (7.26)n = 33
4.56 (4.78)n = 43
11.26 (6.76) n = 66
8.54 (6.92)n = 269
Time 2 9.36 (6.65) n = 61
4.60 (4.36)n = 58
9.44 (5.52)n = 32
3.39 (4.15)n = 41
10.19 (6.28) n = 64
7.54 (6.21)n = 256
Time 3 8.84 (7.23) n = 59
4.82 (5.32)n = 57
10.45 (7.28)n = 31
3.63 (4.86)n = 41
9.94 (7.02) n = 61
7.54 (6.92)n = 249
Time 4 9.07 (6.99) n = 60
5.20 (5.06)n = 56
8.21 (6.98)n = 29
3.00 (3.49)n = 39
10.55 (7.26) n = 59
7.46 (6.73)n = 243
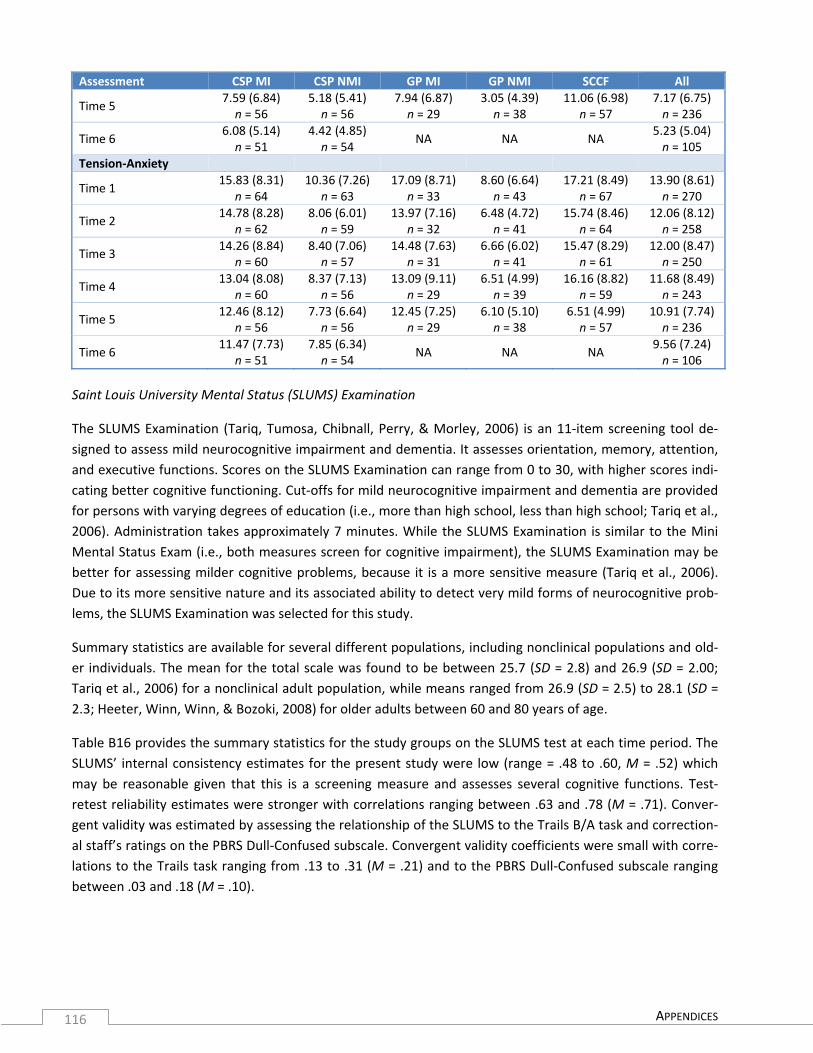
APPENDICES 116
Assessment CSP MI CSP NMI GP MI GP NMI SCCF All
Time 5 7.59 (6.84) n = 56
5.18 (5.41)n = 56
7.94 (6.87)n = 29
3.05 (4.39)n = 38
11.06 (6.98) n = 57
7.17 (6.75)n = 236
Time 6 6.08 (5.14) n = 51
4.42 (4.85)n = 54
NA NA NA 5.23 (5.04)n = 105
Tension‐Anxiety
Time 1 15.83 (8.31)
n = 64 10.36 (7.26)
n = 63 17.09 (8.71)
n = 33 8.60 (6.64)n = 43
17.21 (8.49) n = 67
13.90 (8.61)n = 270
Time 2 14.78 (8.28)
n = 62 8.06 (6.01)n = 59
13.97 (7.16)n = 32
6.48 (4.72)n = 41
15.74 (8.46) n = 64
12.06 (8.12)n = 258
Time 3 14.26 (8.84)
n = 60 8.40 (7.06)n = 57
14.48 (7.63)n = 31
6.66 (6.02)n = 41
15.47 (8.29) n = 61
12.00 (8.47)n = 250
Time 4 13.04 (8.08)
n = 60 8.37 (7.13)n = 56
13.09 (9.11)n = 29
6.51 (4.99)n = 39
16.16 (8.82) n = 59
11.68 (8.49)n = 243
Time 5 12.46 (8.12)
n = 56 7.73 (6.64)n = 56
12.45 (7.25)n = 29
6.10 (5.10)n = 38
6.51 (4.99) n = 57
10.91 (7.74)n = 236
Time 6 11.47 (7.73)
n = 51 7.85 (6.34)n = 54
NA NA NA 9.56 (7.24)n = 106
Saint Louis University Mental Status (SLUMS) Examination
The SLUMS Examination (Tariq, Tumosa, Chibnall, Perry, & Morley, 2006) is an 11‐item screening tool de‐signed to assess mild neurocognitive impairment and dementia. It assesses orientation, memory, attention, and executive functions. Scores on the SLUMS Examination can range from 0 to 30, with higher scores indi‐cating better cognitive functioning. Cut‐offs for mild neurocognitive impairment and dementia are provided for persons with varying degrees of education (i.e., more than high school, less than high school; Tariq et al., 2006). Administration takes approximately 7 minutes. While the SLUMS Examination is similar to the Mini Mental Status Exam (i.e., both measures screen for cognitive impairment), the SLUMS Examination may be better for assessing milder cognitive problems, because it is a more sensitive measure (Tariq et al., 2006). Due to its more sensitive nature and its associated ability to detect very mild forms of neurocognitive prob‐lems, the SLUMS Examination was selected for this study.
Summary statistics are available for several different populations, including nonclinical populations and old‐er individuals. The mean for the total scale was found to be between 25.7 (SD = 2.8) and 26.9 (SD = 2.00; Tariq et al., 2006) for a nonclinical adult population, while means ranged from 26.9 (SD = 2.5) to 28.1 (SD = 2.3; Heeter, Winn, Winn, & Bozoki, 2008) for older adults between 60 and 80 years of age.
Table B16 provides the summary statistics for the study groups on the SLUMS test at each time period. The SLUMS’ internal consistency estimates for the present study were low (range = .48 to .60, M = .52) which may be reasonable given that this is a screening measure and assesses several cognitive functions. Test‐retest reliability estimates were stronger with correlations ranging between .63 and .78 (M = .71). Conver‐gent validity was estimated by assessing the relationship of the SLUMS to the Trails B/A task and correction‐al staff’s ratings on the PBRS Dull‐Confused subscale. Convergent validity coefficients were small with corre‐lations to the Trails task ranging from .13 to .31 (M = .21) and to the PBRS Dull‐Confused subscale ranging between .03 and .18 (M = .10).

APPENDICES 117
Table B16. Summary Statistics (M, SD, n) on SLUMS Score by Group and Time Time CSP MI CSP NMI GP MI GP NMI SCCF All
1 20.80 (5.43)
n = 64 21.73 (3.34)
n = 63 21.52 (4.04)
n = 33 23.38 (3.73)
n = 43 20.54 (3.73)
n = 67 21.45 (4.24) n = 270
2 21.16 (4.77)
n = 62 22.64 (3.63)
n = 59 23.09 (3.68)
n = 32 24.12 (3.23)
n = 41 21.49 (4.33)
n = 63 22.30 (4.16) n = 257
3 22.26 (4.59)
n = 60 24.02 (3.25)
n = 57 23.88 (2.88)
n = 32 24.49 (3.49)
n = 41 22.85 (4.37)
n = 61 23.37 (3.95) n = 251
4 22.92 (4.31)
n = 60 24.38 (3.03)
n = 56 23.34 (3.67)
n = 29 24.79 (3.68)
n = 39 23.38 (3.91)
n = 59 23.84 (3.80) n = 243
5 23.59 (4.04)
n = 56 24.25 (3.34)
n = 56 24.93 (3.24)
n = 29 24.82 (3.24)
n = 38 23.26 (4.05)
n = 57 24.03 (3.69) n = 236
6 23.94 (4.57)
n = 49 25.30 (2.88)
n = 54 NA NA NA
24.62 (3.82) n = 104
State‐Trait Anxiety Inventory (STAI)
The STAI (Spielberger, Gorsuch, & Lushene, 1970) partitions anxiety into that which is attributable to the condition one is in (i.e., state) and into the inherent anxiety of an individual (i.e., trait). It is a 40‐item self‐report inventory that includes two 20‐item subscales. The first subscale assesses state anxiety and is ans‐wered on a 4‐point scale (1—not at all, 2—somewhat, 3—moderately so, 4—very much so); the second subscale assesses trait anxiety and is also answered on a 4‐point scale (1—almost never, 2—sometimes, 3—often, 4—almost always).
Internal consistency is acceptable for the STAI with coefficients between .81 and .92 and a median .84 (Metzger, 1976). In a variety of nonclinical samples (i.e., college students, high school students, military re‐cruits, working adults), the median alpha coefficient was .60 (Novy, Nelson, Goodwin, & Rowzee, 1993). Across males of three different ethnicities (i.e., White, Black, Latino), alpha coefficients were found to be between .93 and .95 for state anxiety and between .92 and .95 for trait anxiety (Novy et al., 1993). Internal consistency measures are high in prison populations (.83; Zinger et al., 2001). Overall, this inventory is valu‐able in its ability to distinguish between types of anxiety and because normative data exist for a prisoner population (Spielberger et al., 1970).
Test‐retest reliability has been variable for the two subscales on the STAI. In a replication study by Joisting (1976), the STAI was administered both before and after a class examination. Correlations between the two tests were .66 for trait anxiety and .60 for state anxiety (Joesting, 1976). For a 104‐day test‐retest assess‐ment, test‐retest reliability ranged from .73 to .84 (Spielberger et al., 1970). Furthermore, test‐retest relia‐bility in another nonclinical sample was found to be .16, .26, and .15 for state anxiety assessed for different intervals (3 months, 8 months, 11 months; Nixon & Steffeck, 1977). Test‐retest reliability was also assessed for trait anxiety in the same nonclinical sample and was found to be .48, .54, and .29 for trait anxiety as‐sessed for the same three intervals (3 months, 8 months, 11 months; Nixon & Steffeck, 1977). In another study with college students, test‐retest reliability was found to be .97 for trait anxiety and .45 for state an‐xiety (Metzger, 1976).
Means for state anxiety in nonclinical populations seem to range from 32.90 (SD = 11.10) to 49.20 (SD = 11.89), while means for trait anxiety in nonclinical populations ranged from 35.60 (SD = 9.90) to 45.89 (SD = 12.96; Joesting, 1976; Nixon & Steffeck, 1977; Novy et al., 1993; Nyenhuis et al., 1999).

APPENDICES 118
The STAI has shown to be a valid measure, demonstrating convergent validity from .52 to .85 and good dis‐criminant validity (Spielberger, 1983). Novy et al. (1993) found moderate to high correlations between the BDI and the STAI State/Trait scale (range = .59 to .81 for BDI and STAI State; range = .44 to .71 for BDI and STAI Trait) and between the BHS and the STAI State/Trait (range = .67 to .92 for BHS and STAI State; range = .26 to .76 for BHS and STAI Trait).
Table B17 provides the summary statistics for the study groups on the STAI scales at each time period. Cron‐bach’s alpha coefficients ranged between .93 and .95 (M = .94) for the two subscales, which indicates strong internal consistency estimates. Correlations between sequential time periods (range = .65 to .82, M = .73) suggest good stability over 3 month intervals with trait anxiety showing slightly stronger correlations (M = .79) than state anxiety (M = .68). Convergent validity with other self‐report measures of anxiety indicated good validity with coefficients ranging between .37 and .85 (M = .64); however, correlations with staff re‐ports of anxiety were lower (ranging from .07 to .49 with a mean of .23).
Table B17. Summary Statistics (M, SD, n) on STAI Subscales by Group and Time Assessment CSP MI CSP NMI GP MI GP NMI SCCF All State Anxiety
Time 1 46.90 (12.16)
n = 62 42.05 (11.42)
n = 63 47.64 (13.52)
n = 33 39.39 (12.04)
n = 43 50.14 (12.72)
n = 67 45.46 (12.80)
n = 268
Time 2 45.83 (12.43)
n = 62 38.43 (10.39)
n = 59 44.53 (13.14)
n = 32 36.68 (10.98)
n = 41 48.42 (13.39)
n = 64 43.16 (12.86)
n = 258
Time 3 45.45 (12.40)
n = 60 37.89 (12.05)
n = 57 47.29 (11.68)
n = 32 34.65 (7.35)
n = 41 48.49 (12.78)
n = 61 42.83 (12.78)
n = 251
Time 4 44.01 (13.38)
n = 60 37.50 (10.89)
n = 56 45.08 (11.90)
n = 29 33.80 (8.69)
n = 39 49.41 (12.48)
n = 59 42.31 (12.93)
n = 243
Time 5 42.60 (12.98)
n = 56 37.46 (11.54)
n = 56 43.76 (12.07)
n = 29 33.81 (9.40)
n = 38 48.29 (11.70)
n = 57 41.48 (12.65)
n = 236
Time 6 43.28 (12.23)
n = 51 36.89 (9.98)
n = 54 NA NA NA
40.09 (11.52)n = 106
Trait Anxiety
Time 1 48.41 (12.36)
n = 62 42.78 (11.11)
n = 63 49.70 (12.79)
n = 33 37.82 (9.99)
n = 43 54.45 (11.48)
n = 67 47.06 (12.79)
n = 269
Time 2 47.89 (11.91)
n = 62 38.77 (10.25)
n = 59 46.59 (11.84)
n = 32 35.93 (10.76)
n = 41 52.64 (12.28)
n = 64 44.92 (12.97)
n = 258
Time 3 47.49 (12.33)
n = 60 38.40 (10.82)
n = 57 47.59 (10.05)
n = 32 34.44 (10.15)
n = 41 51.50 (12.94)
n = 61 44.27 (13.10)
n = 250
Time 4 45.75 (13.11)
n = 60 39.27 (10.10)
n = 56 45.78 (10.69)
n = 29 34.06 (8.86)
n = 39 52.77 (11.10)
n = 59 44.09 (12.70)
n = 243
Time 5 44.65 (12.85)
n = 56 38.70 (11.02)
n = 56 44.06 (10.01)
n = 29 32.74 (8.98)
n = 38 52.28 (11.65)
n = 57 43.09 (12.93)
n = 236
Time 6 43.95 (12.10)
n = 51 37.54 (10.62)
n = 53 NA NA NA
40.70 (11.71)n = 105
Structured Inventory of Malingered Symptomatology (SIMS)
The SIMS (Widows & Smith, 2005) is a 75‐item screening measure intended to detect feigned symptoms of psychopathology and cognitive functioning in clinical and forensic settings. A total score and scores on five subscales—Psychosis (bizarre or unusual psychotic symptoms), Neurologic Impairment (illogical or highly atypical neurological symptoms), Amnestic Disorders (symptoms of memory impairment), Low Intelligence (general cognitive incapacity or intellectual deficit), and affective disorders (atypical symptoms of depression and anxiety)—are obtained (Widows & Smith, 2005). The subscales are comprised of 15 items each; comple‐

APPENDICES 119
tion of this measure takes approximately 10 to 15 minutes (Widows & Smith, 2005). Participants answer whether statements are applicable to them or are generally considered true (T); if a statement does not de‐scribe them or cannot be considered true, an F is circled as the answer choice. The SIMS assesses whether respondents endorse atypical, improbable, inconsistent, or illogical symptoms. Scores above the cutoff mark suggest probable malingering but may also suggest genuine psychopathology. For this study, we used eleva‐tions above these cutoff scores as an indicator of possible malingering.
Internal consistency estimates have ranged from .24 to .86 for subscales and were found to be .72 to .88 for total scores (Merckelbach & Smith, 2003; Smith, as cited in Widows & Smith, 2005). Three‐week test‐retest reliability in honest responders was found to be .72 in a Dutch sample.
Also reported in the manual are validity studies that indicated the SIMS to be a valid screening device for malingering. The SIMS total score correlated strongly with validity scales of the MMPI, including the F scale (“faking bad”; r = .84) and F‐K index scores (“honesty”; r = .81; Widows & Smith, 2005). A moderate correla‐tion (r = .45) was found between the SIMS total score and the 16 Personality Factor Questionnaire Faking Bad scale (Widows & Smith, 2005). Furthermore, the SIMS total score was highly correlated with other commonly used indexes of malingering, such as the MMPI‐2 validity scales (range = .44 to .51), the Struc‐tured Interview of Report Symptoms (SIRS) scales (.43 < r < .80), and the M Test (.46 < r < .67; Heinze & Pu‐risch, 2001). A study by Edens, Poythress, and Watkins‐Clay (2009) indicated that the SIMS correlated highly with the SIRS (.81) and Personality Assessment Inventory NIM (.84) and that it correlated moderately with the Personality Assessment Inventory MAL (.68) and RDF (.45) scales. Furthermore, the SIMS total scores have been found to correlate significantly (p < .01) with the BDI (.64) as well as the STAI Trait (.55). Thus, the SIMS scales seem to be related to both validity and psychopathology measures.
Mean scores on the SIMS were given in Lewis, Simcox, and Berry’s (2002) study. Mean scores across subs‐cales for a forensic sample ranged from 1.2 (SD = 2.1) to 5.2 (SD = 2.6) and the mean total score for the sam‐ple was found to be 14.5 (SD = 8.8; Lewis et al., 2002). Edens, Poythress, and Watkins‐Clay (2009) also found that the SIMS nearly always correctly classified non‐malingering inmates but that there were more errors with mentally ill, such that caution against classification of inmates with mental illness as malingerers is war‐ranted. While it is suggested to administer follow‐up tests once an elevated score has been found on the SIMS, this measure by itself is yet another way to gain a more comprehensive picture of the inmates in this study, be it in regards to the degree of their malingering or their psychopathology.
Table B18 provides the summary statistics for the study groups on the SIMS scales at each time period. In‐ternal consistency estimates ranged between .50 and .93 (M = .76) with the lowest alphas for the Affective Disorder subscale (M = .55) and the Low Intelligence subscale (M = .59). Table B19 provides the internal con‐sistency estimates for the SIMS scales at each time period. Test‐retest coefficients were quite variable rang‐ing between .06 and .83 (M = .48) with total scores showing the least variability (range = .54 to .79, M = .68). There were not correlations with other malingering variables to assess validity; however, correlations be‐tween subscales were computed for each time period. Correlations between subscales ranged between .34 and .98 with variability in which measures demonstrated the weakest and strongest correlations at each time period.
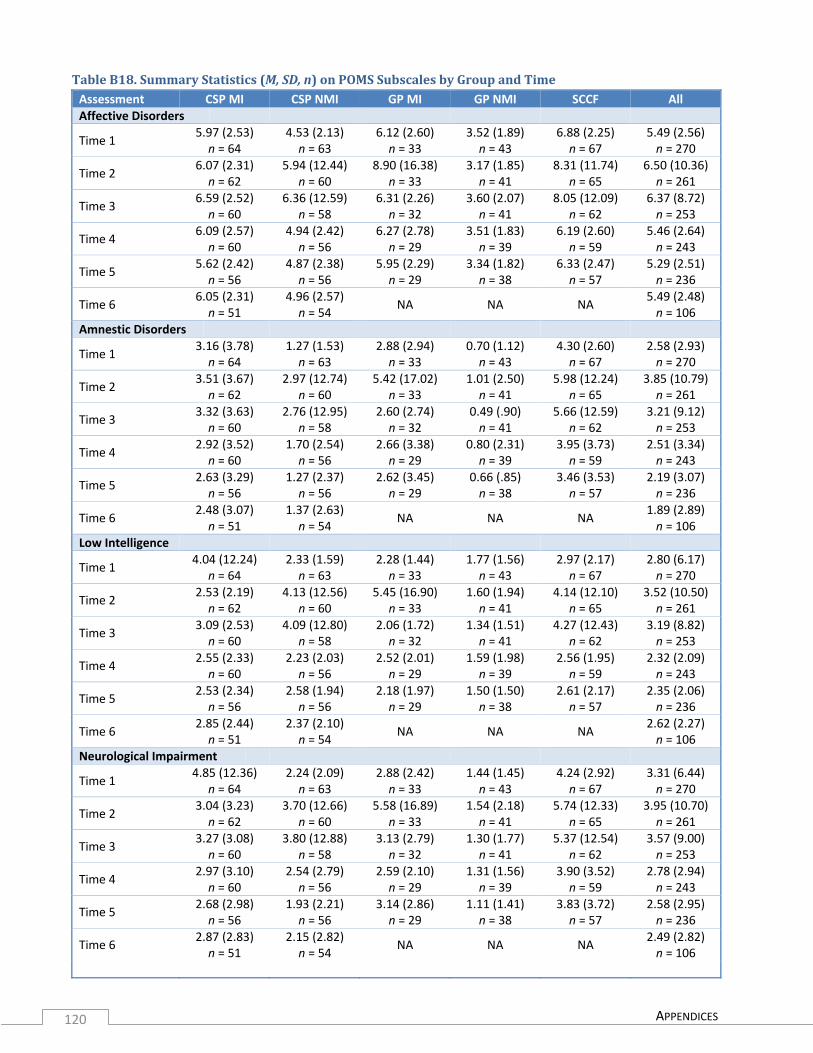
APPENDICES 120
Table B18. Summary Statistics (M, SD, n) on POMS Subscales by Group and Time Assessment CSP MI CSP NMI GP MI GP NMI SCCF AllAffective Disorders
Time 1 5.97 (2.53) n = 64
4.53 (2.13)n = 63
6.12 (2.60)n = 33
3.52 (1.89)n = 43
6.88 (2.25) n = 67
5.49 (2.56)n = 270
Time 2 6.07 (2.31) n = 62
5.94 (12.44)n = 60
8.90 (16.38)n = 33
3.17 (1.85)n = 41
8.31 (11.74) n = 65
6.50 (10.36)n = 261
Time 3 6.59 (2.52) n = 60
6.36 (12.59)n = 58
6.31 (2.26)n = 32
3.60 (2.07)n = 41
8.05 (12.09) n = 62
6.37 (8.72)n = 253
Time 4 6.09 (2.57) n = 60
4.94 (2.42)n = 56
6.27 (2.78)n = 29
3.51 (1.83)n = 39
6.19 (2.60) n = 59
5.46 (2.64)n = 243
Time 5 5.62 (2.42) n = 56
4.87 (2.38)n = 56
5.95 (2.29)n = 29
3.34 (1.82)n = 38
6.33 (2.47) n = 57
5.29 (2.51)n = 236
Time 6 6.05 (2.31) n = 51
4.96 (2.57)n = 54
NA NA NA 5.49 (2.48)n = 106
Amnestic Disorders
Time 1 3.16 (3.78) n = 64
1.27 (1.53)n = 63
2.88 (2.94)n = 33
0.70 (1.12)n = 43
4.30 (2.60) n = 67
2.58 (2.93)n = 270
Time 2 3.51 (3.67) n = 62
2.97 (12.74)n = 60
5.42 (17.02)n = 33
1.01 (2.50)n = 41
5.98 (12.24) n = 65
3.85 (10.79)n = 261
Time 3 3.32 (3.63) n = 60
2.76 (12.95)n = 58
2.60 (2.74)n = 32
0.49 (.90)n = 41
5.66 (12.59) n = 62
3.21 (9.12)n = 253
Time 4 2.92 (3.52) n = 60
1.70 (2.54)n = 56
2.66 (3.38)n = 29
0.80 (2.31)n = 39
3.95 (3.73) n = 59
2.51 (3.34)n = 243
Time 5 2.63 (3.29) n = 56
1.27 (2.37)n = 56
2.62 (3.45)n = 29
0.66 (.85)n = 38
3.46 (3.53) n = 57
2.19 (3.07)n = 236
Time 6 2.48 (3.07) n = 51
1.37 (2.63)n = 54
NA NA NA 1.89 (2.89)n = 106
Low Intelligence
Time 1 4.04 (12.24)
n = 64 2.33 (1.59)n = 63
2.28 (1.44)n = 33
1.77 (1.56)n = 43
2.97 (2.17) n = 67
2.80 (6.17)n = 270
Time 2 2.53 (2.19) n = 62
4.13 (12.56)n = 60
5.45 (16.90)n = 33
1.60 (1.94)n = 41
4.14 (12.10) n = 65
3.52 (10.50)n = 261
Time 3 3.09 (2.53) n = 60
4.09 (12.80)n = 58
2.06 (1.72)n = 32
1.34 (1.51)n = 41
4.27 (12.43) n = 62
3.19 (8.82)n = 253
Time 4 2.55 (2.33) n = 60
2.23 (2.03)n = 56
2.52 (2.01)n = 29
1.59 (1.98)n = 39
2.56 (1.95) n = 59
2.32 (2.09)n = 243
Time 5 2.53 (2.34) n = 56
2.58 (1.94)n = 56
2.18 (1.97)n = 29
1.50 (1.50)n = 38
2.61 (2.17) n = 57
2.35 (2.06)n = 236
Time 6 2.85 (2.44) n = 51
2.37 (2.10)n = 54
NA NA NA 2.62 (2.27)n = 106
Neurological Impairment
Time 1 4.85 (12.36)
n = 64 2.24 (2.09)n = 63
2.88 (2.42)n = 33
1.44 (1.45)n = 43
4.24 (2.92) n = 67
3.31 (6.44)n = 270
Time 2 3.04 (3.23) n = 62
3.70 (12.66)n = 60
5.58 (16.89)n = 33
1.54 (2.18)n = 41
5.74 (12.33) n = 65
3.95 (10.70)n = 261
Time 3 3.27 (3.08) n = 60
3.80 (12.88)n = 58
3.13 (2.79)n = 32
1.30 (1.77)n = 41
5.37 (12.54) n = 62
3.57 (9.00)n = 253
Time 4 2.97 (3.10) n = 60
2.54 (2.79)n = 56
2.59 (2.10)n = 29
1.31 (1.56)n = 39
3.90 (3.52) n = 59
2.78 (2.94)n = 243
Time 5 2.68 (2.98) n = 56
1.93 (2.21)n = 56
3.14 (2.86)n = 29
1.11 (1.41)n = 38
3.83 (3.72) n = 57
2.58 (2.95)n = 236
Time 6 2.87 (2.83) n = 51
2.15 (2.82)n = 54
NA NA NA 2.49 (2.82)n = 106

APPENDICES 121
Assessment CSP MI CSP NMI GP MI GP NMI SCCF AllPsychosis
Time 1 2.87 (3.52) n = 64
1.10 (1.66)n = 63
1.97 (2.47)n = 33
0.42 (.66)n = 43
4.55 (3.59) n = 67
2.37 (3.12)n = 270
Time 2 2.67 (3.06) n = 62
2.42 (12.73)n = 60
4.48 (17.06)n = 33
0.80 (2.09)n = 41
5.43 (12.35) n = 65
3.24 (10.75)n = 261
Time 3 2.68 (3.06) n = 60
2.66 (12.94)n = 58
1.38 (1.62)n = 32
0.69 (.94)n = 41
5.37 (12.67) n = 62
2.85 (9.06)n = 253
Time 4 2.55 (3.10) n = 60
1.18 (2.12)n = 56
1.79 (2.37)n = 29
0.51 (1.02)n = 39
3.73 (3.92) n = 59
2.11 (3.03)n = 243
Time 5 2.07 (2.84) n = 56
0.86 (1.54)n = 56
1.76 (3.11)n = 29
0.50 (.86)n = 38
3.44 (3.76) n = 57
1.82 (2.87)n = 236
Time 6 2.26 (3.11) n = 51
1.02 (2.34)n = 54
NA NA NA 1.63 (2.79)n = 106
Total
Time 1 18.79 (15.41)
n = 64 11.46 (5.85)
n = 63 16.13 (8.36)
n = 33 7.85 (4.38)n = 43
22.96 (9.56) n = 67
16.05 (11.25)n = 270
Time 2 17.82 (11.97)
n = 62 12.55 (12.69)
n = 60 17.83 (16.58)
n = 33 8.13 (9.43)n = 41
23.49 (15.63) n = 65
16.50 (14.33)n = 261
Time 3 18.94 (12.00)
n = 60 12.83 (12.82)
n = 58 15.47 (7.88)
n = 32 7.41 (4.78)n = 41
22.30 (16.32) n = 62
16.06 (13.15)n = 253
Time 4 17.07 (12.16)
n = 60 12.59 (8.97)
n = 56 15.81 (9.60)
n = 29 7.72 (5.17)n = 39
20.33 (12.53) n = 59
15.18 (11.17)n = 243
Time 5 15.53 (10.87)
n = 56 11.51 (7.43)
n = 56 15.63 (10.48)
n = 29 7.11 (4.06)n = 38
19.68 (13.31) n = 57
14.23 (10.78)n = 236
Time 6 16.53 (10.90)
n = 51 11.88 (9.33)
n = 54 NA NA NA
14.13 (10.29)n = 106
Table B19. Internal Consistency Estimates (Cronbach’s alpha) for SIMS Scales at each Time Period SIMS Scale Time 1 Time 2 Time 3 Time 4 Time 5 Time 6Affective disorder .55 .60 .58 .56 .52 .50Amnesia .80 .86 .86 .88 .87 .87Low Intelligence .52 .52 .62 .63 .60 .65Neurological Impairment .75 .82 .79 .81 .83 .83Psychosis .85 .85 .84 .87 .86 .87Total .90 .92 .92 .93 .92 .91
Trail Making Test (TMT)
The TMT (Reitan, 1958) measures neurocognitive deficits related to attention, speed, and mental flexibility. There are two tasks (A and B) and the length of time to complete each task was recorded as total score for each task. Completion time on this measure varies widely but is generally around 5 to 10 minutes for both tasks (Strauss, Sherman, & Spreen, n.d.). While individuals connect only numbers in ascending order on Trails A, they have to connect numbers and letters alternately in ascending order for Trails B (Tombaugh, 2004). We computed two derived scores—ratio of times on the two tasks (B/A) and the difference between times on the two tasks (B – A); these derived scores provide an indication of the time difference between Trails A and Trails B (Tombaugh, 2004); however, for the analysis in the report the Trails ratio (B/A) was used to assess change over time. The TMT has been shown to be sensitive to neurocognitive deficits (Sherrill‐Pattison, Donders, & Thompson, 2000); it is important to consider age and education of participants when interpreting scores though.

APPENDICES 122
The TMT has demonstrated adequate test‐retest reliability over a 14‐ to 24‐week period (Mdn = 20 weeks; Trails A r = .46; Trails B r = .44; Matarazzo, Wiens, Matarazzo, & Goldstein, 1974) although stability may be impacted by population groups and time intervals. Practice effects might be a problem (McCaffrey, Ortega, & Haase, 1993) although research has shown that practice effects between administrations separated by at least 3 months may be negligible (e.g., Basso, Bornstein, & Lang, 1999). Another study found that the TMT’s 3‐week test‐retest reliability was moderate to high, with Trails A having a correlation of .55 and Trails B hav‐ing a correlation of .75 (Bornstein, Baker, & Douglass, 1987).
Normative data are available on nonclinical populations, separated by age group (Tombaugh, 2004). For people aged 18 to 59, mean times on the Trails A ranged from 22.93 (SD = 6.87; 18‐24 years) to 35.10 (SD = 10.94; 55‐59 years); mean times on the Trails B ranged from 48.97 (SD = 12.69; 18‐24 years) to 78.84 (SD = 19.09; 55‐59 years; Tombaugh, 2004). Additionally, Matarazzo et al. (1974) found means for the Trails A and B to be 21.76 (SD = 5.65) and 54.17 (SD = 12.54), respectively. Descriptive statistics were also provided on the two scores that will be derived in the current study. While B‐A was found to have a mean of 39.7 (SD = 21.5), B/A was found to have a mean of 2.1 (SD = .6) for an older adult, community‐dwelling sample (Sán‐chez‐Cubillo et al., 2009). Convergent validity is adequate for the total scores on each of the trials as well as for the B‐A score (Sánchez‐Cubillo et al., 2009). The ratio score of B/A did not show significant correlations with any of the other assessed cognitive measures in Sánchez‐Cubillo et al.’s (2009) study but Periáñez et al. (2007) suggested that the B/A might be a purer measure of executive functioning.
After consultation with a neuropsychologist, it was decided to use a derived score by taking the ratio of time to complete Task B with time to complete Task A; however, information about all Trails scores are provided in this section. Table B20 provides the summary statistics for the study groups on the Trails tasks at each time period. Correlations between sequential time periods for the entire sample are given in Table B21. Cor‐relations between the Trails tasks at each time period ranged between .21 and .97 (absolute values of corre‐lations are given; the Trails B/A was always negatively correlated with Trails A time). Table B21 also provides the mean correlation of each task with the other tasks over time. The Trails tasks were correlated with per‐formance on the SLUMS and the PBRS Dull‐Confused subscale. Correlation coefficients were small with the SLUMS (range = .13 to .31, M = .21) and with the correctional officer ratings on the PBRS Dull‐Confused (range = ‐.12 to .09, M = ‐.01), indicating that these measures are assessing distinct aspects of cognitive functioning.
Table B20. Summary Statistics (M, SD, n) on TMT Scores by Group and Time Assessment CSP MI CSP NMI GP MI GP NMI SCCF All Task A Time
Time 1 29.36 (14.18)
n = 62 27.20 (8.76)
n = 61 25.65 (7.70)
n = 33 24.28 (6.00)
n = 43 32.36 (19.80)
n = 67 28.34 (13.51)
n = 266
Time 2 29.70 (17.34)
n = 61 24.46 (7.00)
n = 59 24.09 (8.22)
n = 32 22.25 (4.84)
n = 41 29.46 (13.36)
n = 64 26.54 (12.10)
n = 256
Time 3 29.45 (21.46)
n = 60 23.06 (7.36)
n = 57 24.52 (6.79)
n = 32 21.70 (5.97)
n = 41 28.13 (15.10)
n = 61 25.78 (14.01)
n = 251
Time 4 29.78 (19.01)
n = 59 22.63 (7.94)
n = 56 21.99 (7.32)
n = 29 21.04 (4.17)
n = 39 26.64 (11.00)
n = 59 25.02 (12.27)
n = 242
Time 5 27.54 (15.32)
n = 56 23.48 (8.91)
n = 56 21.34 (6.67)
n = 29 20.97 (3.94)
n = 38 27.57 (15.45)
n = 57 24.78 (12.11)
n = 235
Time 6 27.27 (15.95)
n = 48 20.91 (5.59)
n = 54 NA NA NA
23.81 (12.02)n = 103

APPENDICES 123
Assessment CSP MI CSP NMI GP MI GP NMI SCCF AllTask B Time
Time 1 84.70 (55.39)
n = 61 83.46 (42.82)
n = 62 82.46 (34.64)
n = 33 68.94 (23.83)
n = 43 96.29 (58.26)
n = 67 84.50 (47.67)
n = 266
Time 2 77.74 (44.98)
n = 60 71.09 (29.85)
n = 59 66.30 (27.77)
n = 31 70.63 (35.41)
n = 40 81.57 (34.51)
n = 63 74.62 (35.86)
n = 253
Time 3 75.42 (45.66)
n = 60 66.33 (26.20)
n = 57 66.11 (27.25)
n = 32 63.41 (24.79)
n = 41 78.26 (38.12)
n = 61 70.90 (34.93)
n = 251
Time 4 71.63 (37.92)
n = 59 62.78 (25.66)
n = 56 58.29 (22.17)
n = 29 56.78 (19.63)
n = 38 74.69 (37.81)
n = 59 66.38 (31.78)
n = 241
Time 5 69.43 (32.73)
n = 56 62.27 (30.01)
n = 56 54.98 (20.41)
n = 29 58.81 (19.96)
n = 38 72.71 (41.64)
n = 57 65.04 (32.04)
n = 236
Time 6 62.75 (32.75)
n = 48 55.84 (20.71)
n = 54 NA NA NA
59.09 (27.13)n = 102
B – A Time
Time 1 55.27 (47.23)
n = 61 56.33 (40.60)
n = 60 56.81 (31.14)
n = 33 44.66 (21.75)
n = 43 63.93 (46.29)
n = 67 56.17 (40.64)
n = 264
Time 2 48.82 (35.29)
n = 60 46.63 (26.48)
n = 59 42.40 (21.97)
n = 31 48.41 (34.89)
n = 40 52.11 (27.20)
n = 63 48.28 (29.82)
n = 253
Time 3 45.98 (31.68)
n = 60 43.27 (24.97)
n = 57 41.59 (23.35)
n = 32 41.71 (22.39)
n = 41 50.13 (30.18)
n = 61 45.12 (27.45)
n = 251
Time 4 41.84 (27.51)
n = 59 40.15 (23.39)
n = 56 36.30 (19.15)
n = 29 35.81 (18.01)
n = 38 48.04 (30.67)
n = 59 41.35 (25.45)
n = 241
Time 5 41.89 (23.20)
n = 56 38.78 (25.33)
n = 56 33.64 (18.59)
n = 29 37.58 (18.81)
n = 37 45.14 (32.39)
n = 57 40.24 (25.25)
n = 235
Time 6 34.48 (22.88)
n = 48 34.93 (18.53)
n = 54 NA NA NA
35.19 (20.59)n = 102
B/A Ratio
Time 1 2.95 (1.11) n = 61
3.19 (1.54)n = 60
3.30 (1.21)n = 33
2.89 (.88)n = 43
3.04 (1.12) n = 67
3.06 (1.20)n = 264
Time 2 2.84 (1.19) n = 60
2.94 (1.01)n = 59
2.80 (.74)n = 31
3.27 (1.84)n = 40
2.80 (.74) n = 63
2.95 (1.20)n = 253
Time 3 2.68 (.82)n = 60
3.02 (1.24)n = 57
2.71 (.84)n = 32
2.97 (1.00)n = 41
2.71 (.84) n = 61
2.87 (1.05)n = 251
Time 4 2.59 (1.00) n = 59
2.92 (1.15)n = 56
2.74 (.84)n = 29
2.72 (.82)n = 38
2.74 (.84) n = 59
2.77 (.99)n = 241
Time 5 2.64 (.74)n = 56
2.73 (1.00)n = 56
2.67 (.90)n = 29
2.87 (1.05)n = 37
2.67 (.90) n = 57
2.72 (.99)n = 235
Time 6 2.40 (.74)n = 48
2.73 (.86)n = 54
NA NA NA 2.57 (.82)n = 102
Table B21. TestRetest Correlation Coefficients for Trails Tasks at Consecutive Testing Intervals Trails Task Time 1 to 2 Time 2 to 3 Time 3 to 4 Time 4 to 5 Time 5 to 6 r* Trails A .70 .65 .83 .81 .87 .41 Trails B .66 .70 .73 .76 .75 .71 Trails B – A .58 .63 .58 .63 .59 .69 Trails B/A .36 .37 .44 .44 .39 .50
*means correlation of task with other Trails tasks over time.
Trauma Symptom Inventory (TSI)
The TSI (Briere, 1995) is a 100‐item self‐report assessment of posttraumatic stress and other psychological consequences of traumatic events, including but not limited to rape, child abuse, spouse abuse, physical as‐sault, combat, major accidents, and natural disasters. Respondents use a 4‐point rating scale (0—never to

APPENDICES 124
3—often) to report on the experience of 100 events that could have occurred within the last 6 months. Scores are obtained on three validity scales (Atypical Response, Response Level, and Inconsistent Response) and 10 clinical symptom domains (Anxious Arousal, Depression, Anger/Irritability, Intrusive Experiences, De‐fensive Avoidance, Dissociation, Sexual Concerns, Dysfunctional Sexual Behavior, Impaired Self‐Reference, and Tension Reduction Behavior). Greater scores indicate more symptoms associated with trauma (Fernan‐dez, 1998). It has been found that a fifth‐ to seventh‐grade reading level is required to complete the TSI; it takes approximately 20 minutes to complete this assessment (Fernandez, 1998).
The TSI’s clinical subscales have demonstrated internal reliability with different samples. Alpha coefficients ranged between .74 and .91 for the standardization sample (nonclinical) with a median alpha coefficient of .88; alphas ranged from .69 to .90 with a median alpha of .86 for the university sample; furthermore, inter‐nal consistency reliability ranged from .74 to .90 with a median alpha coefficient of .89 for a clinical sample (Briere, 1995). The three validity scales were also found to have internal consistency reliabilities between .51 and .80 across the standardization as well as a military sample (Briere, 1995). There are no known test‐retest reliability estimates or studies completed with prison populations.
Normative data are available by gender and age groups for the general population as well as for a clinical sample separated by gender (Briere, 1995). Means on the subscales ranged from 2.32 (SD = 4.20) to 7.69 (SD = 6.03) for nonclinical, younger males (i.e., 18‐54; Briere, 1995). Clinical samples were separated by trauma history; means for males in the group without trauma history ranged from 2.24 (SD = 3.17) to 9.45 (SD = 5.90), whereas means for males in the group with trauma history ranged from 6.30 (SD = 7.44) to 16.32 (SD = 5.27; Briere, 1995).
Reasonable convergent validity was found between the TSI and other measures, such as the BSI, Symptom Checklist, Impact of Event Scale, and the Personality Assessment Inventory (Briere, 1995). More specifically, three of the TSI’s clinical subscales that are most closely associated with subscales of the BSI were found to have high correlations: Anxious Arousal (TSI) and Anxiety (BSI) had a high correlation of .75, Anger/Irritability (TSI) and Hostility (BSI) correlated at .77, and Defensive Avoidance (TSI) and Depression (BSI) had a correla‐tion of .82 (Briere, 1995). The correlations of the TSI subscales and the subscales from two posttraumatic stress scales (i.e., Impact of Event Scale, Symptom Checklist) were found to range between .35 and .74, indi‐cating convergent validity (Briere, 1995). The Sexual Concern subscale of the TSI was moderately correlated (r = .53) with a measure tapping into sexual concerns (Briere, 1995). Furthermore, the Dysfunctional Sexual Behavior subscale was moderately correlated (r = .32) with a question on another measure on how many sexual partners the person had over the course of the past 12 months as well as with four questions assess‐ing the likelihood of the participant engaging in sex with an attractive stranger (r = .32), sex with any stran‐ger (r = .19), posing for pornography (r = .22), and sex for money (r = .17; Briere, 1995). The Borderline Per‐sonality Disorder subscale of the PAI was found to correlate moderately with the Impaired Self‐Reference scale (r = .65) as well as the Tension Reduction Behavior scale (r = .54; Briere, 1995).
Table B22 provides the summary statistics for the study groups on the TSI Total Score. The internal consis‐tency estimates were similar across groups and high (M = .97).

APPENDICES 125
Table B22. Summary Statistics (M, SD, n) on TSI Total Score by Group and Time Statistic CSP MI CSP NMI GP MI GP NMI SCCF AllM 98.43 53.66 87.86 40.64 119.55 83.12SD 58.85 42.04 50.06 30.34 58.40 58.17n 62 60 33 41 60 262Cronbach’s α .98 .97 .96 .96 .97 .98
NORMATIVE COMPARISONS
Because we used standardized assessments in this study, it is possible to compare scores for the study sam‐ple to normative data. In this section, comparisons were made between each study groups’ mean and the normative mean using a one sample t test. Normative values were taken from the test manuals when avail‐able or were gathered from the literature. Normative data from general adult populations were typically used; if male norms were available they were used. If only normative data for clinical samples were available then outpatient norms were used. One sample t tests indicated that in general, for all groups except the GP NMI group, scores were elevated above the normative data when participants entered the study and tended to stay that way. There were also fewer elevations on the SIMS malingering subscales with study groups fre‐quently scoring similarly to “honest responders.” Table B23 provides a visual representation of the signifi‐cant differences by group at each time period on each measure. Red shading indicates that the group mean is significantly different from the normative mean in the direction of more psychological or cognitive prob‐lems, whereas green shading indicates that the group mean is significantly better than the normative mean. No shading indicates the groups were statistically similar to the normative data.

APPENDICES 126
Table B23. Significant Differences of Study Groups from Normative Means
Measure Norm Mean
CSP MI CSP NMI GP MI GP NMI SCCF
Time Interval*: 1 2 3 4 5 6 1 2 3 4 5 6 1 2 3 4 5 1 2 3 4 5 1 2 3 4 5BHS‐college 2.32 BHS‐clinical 6.04 BPRS Total 49.29 BSI Anxiety 1.56 BSI Depression 1.26 BSI Hostility 1.70 BSI Interpersonal Sensitivity 0.96 BSI Obsessive‐Compulsive 2.22 BSI Paranoid Ideation 1.65 BSI Phobic Anxiety 0.55 BSI Psychotic 0.75 BSI Somatization 1.61 BSI GSI 0.25 PAS Acting Out 2.45 PAS Alienation 1.70 PAS Anger Control 1.73 PAS Health Problems 1.13 PAS Hostile Control 2.52 PAS Negative Affect 2.84 PAS Psychotic Features 0.71 PAS Social Withdrawal 2.17 PAS Suicidal Thinking 0.37 PAS Total 16.66 POMS Anger‐Hostility 7.10 POMS Depression‐Dejection 7.50 POMS Fatigue‐Inertia 7.30 POMS Tension‐Anxiety 7.10 POMS Vigor <19.80 POMS Total 14.80 SIMS Affective Disorders 5.2 SIMS Amnestic Disorders 2.5 SIMS Low Intelligence 3.2 SIMS Neurological Impairment 2.4 SIMS Psychosis 1.2 SIMS Total 14.5 SLUMS <25.70 STAI‐State 35.72 STAI‐Trait 34.89 Trails A Time 22.93 Trails B Time 48.97 Trails B – A 29 Trails B/A 2.18
*There are six assessments for CSP groups and five for the other three groups.
COMPOSITE SCORES
A composite score was developed for seven of the eight primary constructs by standardizing scores from the scales on the self‐report assessments. Clinician and correctional officer ratings are not included in compo‐sites so that comparisons between self‐report and staff reports can be made. Self‐report scores were stan‐

APPENDICES 127
dardized so that comparisons between different measures could be made more easily and to create a single measure for constructs assessed by multiple self‐report assessments. Scores were standardized by centering on the mean of the entire sample at the first assessment and dividing by the standard deviation. A compo‐site score was computed by standardizing each assessment and averaging the standardized scores across the individual assessments as the composite score. Internal consistency reliability estimates, test‐retest cor‐relations, and validity coefficient estimates for these composites and associated subscales are presented within the discussion of each construct. Composite means and standard deviations are reported in the main body of the report.
Anxiety Construct
Anxiety was measured by eight self‐report variables assessed at each time period. The self‐report measures used to create the anxiety composite score were the State and Trait subscales of the STAI; the Anxiety, Ob‐sessive‐Compulsive, and Phobic Anxiety subscales of the BSI; the Negative Affect subscale of the PAS; the Tension‐Anxiety subscale of the POMS; and the Panic Disorder subscale of the PSI. This construct was also assessed with ratings by correctional staff (PBRS Anxious‐Depressed) and clinicians (BPRS Anxiety‐Depression).
Internal consistency reliabilities were computed for each assessment period for the entire sample. The in‐ternal consistency estimates are provided in Table B24. The reliability estimates were strong, indicating good internal consistency at each time period for the composite. Reliabilities for individual scales were similar across testing intervals, and they were similar to internal consistency estimates from normative samples; only the BPRS showed low internal consistency estimates.
Table B24. Internal Consistency Estimates for Anxiety Construct Measure # of items Time 1 Time 2 Time 3 Time 4 Time 5 Time 6 Anxiety Composite 8 .89 .90 .91 .91 .90 .89 BSI Anxiety 6 .86 .90 .91 .91 .90 .90 BSI Obsessive‐Compulsive 6 .88 .89 .90 .91 .88 .88 BSI Phobic Anxiety 5 .83 .86 .86 .87 .82 .88 PAS Negative Affect 3 .68 .65 .65 .70 .65 .60 POMS Tension‐Anxiety 9 .91 .91 .92 .92 .91 .89 PSI Panic Disorder 9 .89 .89 .89 .89 .90 .90 STAI State 10 .93 .94 .94 .94 .94 .93 STAI Trait 10 .93 .94 .94 .94 .95 .93 PBRS Anxious‐Depressed 14 .90 .90 .94 .90 .90 .90 BPRS Anxious‐Depressed 5 .55 NA .60 NA .66 NA
Test‐retest correlations for the anxiety composite are provided in Table B25 and indicate stable constructs for three month assessments.
Table B25. TestRetest Correlation Coefficients for Anxiety Composite at Consecutive Time Periods for each Study Group Interval CSP MI CSP NMI GP MI GP NMI SCCF AllTime 1‐2 .76 .57 .71 .80 .49 .56Time 2‐3 .73 .86 .82 .84 .71 .82Time 3‐4 .86 .86 .75 .70 .73 .84Time 4‐5 .83 .76 .77 .76 .71 .83Time 5‐6 .75 .83 NA NA NA .80

APPENDICES 128
The validity coefficients between anxiety measures are provided in Table B26 and indicate good convergent validity for all measures except for the PBRS Anxious‐Depressed subscale. The pattern of relationships is sim‐ilar across time periods.
Table B26. Correlations between Anxiety Construct Measures at each Time Period Time 1 BSI OC BSI PA PAS NA POMS TA PSI PD STAI‐S STAI‐T PBRS AD BPRS ADBSI Anxiety .79 .75 .65 .81 .71 .60 .68 .05 .42BSI Obsessive‐Compulsive .66 .69 .70 .64 .55 .66 .12 .35BSI Phobic Anxiety .50 .58 .56 .46 .50 .05 .33PAS Negative Affect .71 .46 .62 .76 .12 .35POMS Tension‐Anxiety .52 .70 .76 .10 .37PSI Panic Disorder .37 .41 .06 .35STAI‐State .78 .07 .36STAI‐Trait .11 .37PBRS Anxious Depressed .33BPRS Anxious‐Depressed Time 2 BSI OC BSI PA PAS NA POMS TA PSI PD STAI‐S STAI‐T PBRS AD BPRS ADBSI Anxiety .78 .78 .62 .82 .73 .63 .67 .10 BSI Obsessive‐Compulsive .69 .60 .69 .68 .59 .68 .04 BSI Phobic Anxiety .55 .59 .65 .54 .56 .09 PAS Negative Affect .66 .39 .63 .79 .13 POMS Tension‐Anxiety .56 .72 .78 .11 PSI Panic Disorder .44 .46 .06 STAI‐State .83 .18 STAI‐Trait .17 PBRS Anxious‐Depressed Time 3 BSI OC BSI PA PAS NA POMS TA PSI PD STAI‐S STAI‐T PBRS AD BPRS ADBSI Anxiety .83 .83 .69 .83 .73 .67 .70 .04 .41BSI Obsessive‐Compulsive .75 .69 .73 .72 .66 .70 .04 .39BSI Phobic Anxiety .59 .64 .69 .55 .58 .06 .36PAS Negative Affect .73 .48 .68 .80 .14 .40POMS Tension‐Anxiety .58 .74 .79 .16 .40PSI Physical Symptoms .48 .48 ‐.02 .34STAI‐State .85 .12 .40STAI‐Trait .14 .49PBRS Anxious‐Depressed .12BPRS Anxiety‐Depression Time 4 BSI OC BSI PA PAS NA POMS TA PSI PD STAI‐S STAI‐T PBRS AD BPRS ADBSI Anxiety .81 .78 .63 .82 .69 .69 .72 .20 BSI Obsessive‐Compulsive .66 .64 .75 .69 .71 .72 .12 BSI Phobic Anxiety .52 .59 .58 .54 .63 .15 PAS Negative Affect .70 .48 .66 .77 .13 POMS Tension‐Anxiety .60 .77 .78 .17 PSI Physical Symptoms .51 .51 .19 STAI‐State .84 .15 STAI‐Trait .18 PBRS Anxious‐Depressed Time 5 BSI OC BSI PA PAS NA POMS TA PSI PD STAI‐S STAI‐T PBRS AD BPRS ADBSI Anxiety .80 .79 .66 .79 .72 .62 .65 .20 .33BSI Obsessive‐Compulsive .74 .69 .77 .67 .63 .70 .22 .33BSI Phobic Anxiety .62 .60 .58 .51 .58 .19 .26PAS Negative Affect .68 .47 .62 .76 .21 .38POMS Tension‐Anxiety .61 .78 .78 .27 .40

APPENDICES 129
PSI Physical Symptoms .44 .47 .20 .32STAI‐State .83 .19 .36STAI‐Trait .21 .46PBRS Anxious‐Depressed .26BPRS Anxiety‐Depression Time 6 BSI OC BSI PA PAS NA POMS TA PSI PD STAI‐S STAI‐T PBRS AD BPRS ADBSI Anxiety .77 .74 .62 .81 .74 .57 .64 .12BSI Obsessive‐Compulsive .67 .55 .64 .66 .55 .61 .14BSI Phobic Anxiety .49 .52 .62 .37 .49 .05PAS Negative Affect .69 .45 .65 .77 .13POMS Tension‐Anxiety .63 .76 .77 .18PSI Physical Symptoms .44 .49 ‐.01STAI‐State .85 .09STAI‐Trait .08PBRS Anxious‐Depressed
Note: Only Times 1, 3, and 5 had the BPRS administered. Time 6 includes only the CSP NMI and CSP MI groups.
Cognitive Impairment Construct
Cognitive impairment was assessed by two individually administered tests and ratings by the researcher. The SLUMS was used to assess orientation, memory, attention, and executive function. The TMT was used to assess attention. The time required to complete the Trails A (connect sequential numbers) and B (connect alternating numbers and letters) tasks were collected, and the ratio of times (B/A) was used as the attention measure. Because these measures were not correlated (see descriptions of measures above), we did not combine these scores into a composite measure of cognitive impairment and each was used individually. The correctional staff completed ratings on the PBRS Dull‐Confused scale.
Internal consistency estimates for the SLUMS were provided earlier in the description of the measure. Table B27 provides the correlations between consecutive testing periods and Table B28 has the correlations be‐tween the cognitive assessments, including the correctional officer ratings. The correlations between con‐secutive time periods are moderate in size and indicate stability across 3 month assessment periods. There are some variations in size of coefficients across groups. The validity coefficients are small and indicate that these assessments are likely measuring unique aspects of cognitive function.
Table B27. TestRetest Correlation Coefficients for Cognitive Impairment Measures at Consecutive Time Intervals by Study Group Interval CSP MI CSP NMI GP MI GP NMI SCCF AllSLUMS Scores Time 1‐2 0.72 0.55 0.64 0.38 0.59 0.63Time 2‐3 0.63 0.74 0.65 0.59 0.78 0.70Time 3‐4 0.75 0.77 0.67 0.70 0.76 0.75Time 4‐5 0.75 0.42 0.67 0.64 0.75 0.67Time 5‐6 0.84 0.67 NA NA NA 0.78Trails B/A Scores Time 1‐2 0.51 0.32 0.29 0.48 0.40 0.36Time 2‐3 0.20 0.63 0.40 0.32 0.33 0.37Time 3‐4 0.31 0.55 0.58 0.64 0.28 0.44Time 4‐5 0.59 0.33 0.66 0.70 0.30 0.44Time 5‐6 0.47 0.35 NA NA NA 0.39

APPENDICES 130
Table B28. Correlations between Cognitive Impairment Measures at each Time Period Time 1 TMT B/A PBRS DC Time 4 TMT B/A PBRS DC SLUMS ‐.26 ‐.12 SLUMS ‐.14 ‐.10 TMT B/A .09 TMT B/A ‐.01 PBRS Dull‐Confused PBRS Dull‐Confused Time 2 TMT B/A PBRS DC Time 5 TMT B/A PBRS DC SLUMS ‐.170 ‐.081 SLUMS ‐.30 ‐.18 TMT B/A ‐.019 TMT B/A ‐.05 PBRS Dull‐Confused PBRS Dull‐Confused Time 3 TMT B/A PBRS DC Time 6 TMT B/A PBRS DC SLUMS ‐.26 ‐.11 SLUMS ‐.13 ‐.03 TMT B/A .04 TMT B/A ‐.12 PBRS Dull‐Confused PBRS Dull‐Confused
Note: Only times 1, 3, and 5 had the BPRS administered. Time 6 includes only the CSP NMI and CSP MI groups.
Depression/Hopelessness Construct
The depression construct was assessed using five self‐report measures. The subscales used to create this composite were the BHS, the BSI Depression subscale, the PAS Negative Affect and Suicidal subscales, and the POMS Depression‐Dejection subscale. Table B29 provides estimates of internal consistency reliability for each subscale and the composite at each time period. There is evidence for adequate internal consistency for the composite (M = .75; range = .71 to .77). Internal consistency estimates for the subscales were similar to reliabilities found with normative samples with subscales with fewer items demonstrating lower alphas.
Table B29. Internal Consistency Estimates for Depression Construct by Time Interval Measure # of items Time 1 Time 2 Time 3 Time 4 Time 5 Time 6 Depression Composite 5 .74 .76 .76 .77 .76 .71 BHS Total 20 .92 .94 .94 .94 .94 .92 BSI Depression 6 .87 .89 .90 .89 .90 .86 PAS Negative Affect 3 .68 .65 .65 .70 .65 .60 PAS Suicidal Thinking 2 .86 .91 .94 .95 .90 .94 POMS Depression‐Dejection 15 .95 .95 .96 .95 .95 .93 PBRS Anxious‐Depressed 14 .90 .90 .94 .90 .90 .90 BPRS Anxiety‐Depression 5 .55 NA .60 NA .66 NA
Table B30 provides estimates of test‐retest reliability. The correlations between consecutive assessments for the depression composite were strong (M = .76, range = .57 to .90) indicating good stability over time. Al‐though there was some variability in estimates across groups and times, there is reasonable stability esti‐mates for each group.
Table B30. TestRetest Correlation Coefficients for Depression Composite at Consecutive Time Intervals for each Study Group Interval CSP MI CSP NMI GP MI GP NMI SCCF AllTime 1‐2 .77 .69 .57 .79 .65 .59Time 2‐3 .68 .82 .74 .85 .73 .80Time 3‐4 .88 .90 .73 .69 .72 .84Time 4‐5 .77 .74 .82 .71 .77 .83Time 5‐6 .70 .79 NA NA NA .76
Table B31 provides the correlations between the measures of the depression construct. The validity coeffi‐cients between assessments of the depression construct indicate good convergent validity with the excep‐

APPENDICES 131
tion of the PBRS Anxious Depressed subscale. The magnitude and general pattern of relationships between measures were similar across assessment periods.
Table B31. Correlations between DepressionHopelessness Measures at each Time Period Time 1 BSI Dep PAS NA PAS ST POMS DD PBRS AD BPRS AD BHS .71 .61 .47 .60 .12 .32 BSI Depression .71 .59 .85 .10 .43 PAS Negative Affect .46 .65 .12 .35 PAS Suicidal Thinking .44 ‐.01 .34 POMS Depression‐Dejection .45 .13 PBRS Anxious Depressed ‐.03 BPRS Anxiety Depression Time 2 BSI Dep PAS NA PAS ST POMS DD PBRS AD BPRS AD BHS .70 .54 .45 .61 .10 BSI Depression .63 .62 .88 .14 PAS Negative Affect .46 .67 .13 PAS Suicidal Thinking .54 .18 POMS Depression‐Dejection .12 PBRS Anxious Depressed Time 3 BSI Dep PAS NA PAS ST POMS DD PBRS AD BPRS AD BHS .74 .61 .43 .65 ‐.02 .33 BSI Depression .69 .60 .88 .07 .37 PAS Negative Affect .41 .71 .15 .40 PAS Suicidal Thinking .53 .11 .30 POMS Depression‐Dejection .10 .44 PBRS Anxious Depressed .12 BPRS Anxiety Depression Time 4 BSI Dep PAS NA PAS ST POMS DD PBRS AD BPRS AD BHS .77 .61 .43 .69 .13 BSI Depression .67 .58 .88 .18 PAS Negative Affect .42 .66 .13 PAS Suicidal Thinking .46 .23 POMS Depression‐Dejection .18 PBRS Anxious Depressed Time 5 BSI Dep PAS NA PAS ST POMS DD PBRS AD BPRS AD BHS .75 .61 .39 .66 .19 .27 BSI Depression .69 .51 .89 .25 .42 PAS Negative Affect .39 .68 .21 .38 PAS Suicidal Thinking .48 .29 .39 POMS Depression‐Dejection .27 .42 PBRS Anxious Depressed .26 BPRS Anxiety Depression Time 6 BSI Dep PAS NA PAS ST POMS DD PBRS AD BPRS AD BHS .58 .46 .45 .45 .14 BSI Depression .62 .51 .84 .20 PAS Negative Affect .35 .62 .13 PAS Suicidal Thinking .42 .41 POMS Depression‐Dejection .12 PBRS Anxious Depressed
Note: Only times 1, 3, and 5 had the BPRS administered. Time 6 includes only the CSP NMI and CSP MI groups.

APPENDICES 132
Hostility/Anger Control Construct
The hostility/anger control construct was assessed using five self‐report measures: the BSI Hostility subscale; the Anger Control, Hostile Control, and Acting Out subscales on the PAS; and the POMS Anger‐Hostility subscale. Ratings by correctional staff (PBRS Anti‐authority) and clinicians (BPRS Hostility) also assess the hostility construct. Table B32 provides the internal consistency reliabilities for the subscales and composite. The composite internal consistency was low (M = .57) for the six time periods. Subscale reliabilities were lower than expected for the PAS subscales and the BPRS, although the smaller internal consistency esti‐mates were for scales with a small number of items and these reliability estimates are similar to other litera‐ture.
Table B32. Internal Consistency Estimates for Hostility Construct by Time Interval Measure # of items Time 1 Time 2 Time 3 Time 4 Time 5 Time 6 Hostility Composite 5 .54 .56 .57 .61 .55 .60BSI Hostility 5 .85 .84 .87 .90 .87 .88PAS Anger Control 2 .53 .60 .51 .56 .52 .33PAS Hostile Control 2 .52 .47 .42 .37 .36 .61PAS Acting Out 3 .27 .28 .30 .39 .39 .46POMS Anger‐Hostility 12 .92 .93 .94 .94 .94 .94PBRS Anti‐Authority 13 .94 .93 .94 .94 .95 .90BPRS Hostility 3 .57 NA .61 NA .51 NA
The correlations between consecutive time periods are given in Table B33. These estimates of test‐retest reliability indicate that the hostility composite is stable between 3 month assessment periods. Groups are fairly similar in the magnitude of correlation coefficients between testing periods.
Table B33. TestRetest Correlation Coefficients for Hostility Composite at Consecutive Time Intervals for each Study Group Interval CSP MI CSP NMI GP MI GP NMI SCCF AllTime 1‐2 .73 .75 .83 .78 .69 .71Time 2‐3 .67 .82 .76 .77 .80 .77Time 3‐4 .80 .84 .76 .80 .77 .80Time 4‐5 .76 .78 .56 .79 .77 .76Time 5‐6 .66 .72 NA NA NA .69
Table B34 provides the correlations between measures of the hostility‐anger control construct for each time period. The validity coefficients were quite variable across all measures and time periods (ranging between ‐.11 and .84). Although scores on these measures tend to be stable, the different assessments may be tap‐ping into quite different aspects of hostility given these variable and lower correlations. Examination of the content of the PAS items suggested that these items tapped into useful domains for understanding hostile and acting out behavior of the participants and thus these measures were kept, even though this leads to lower internal consistency estimates. Removing these items from the composite did increase internal consis‐tency estimates but did not substantially change the study results, thus all subscales were kept as part of the composite (additional results are available from the authors upon request).
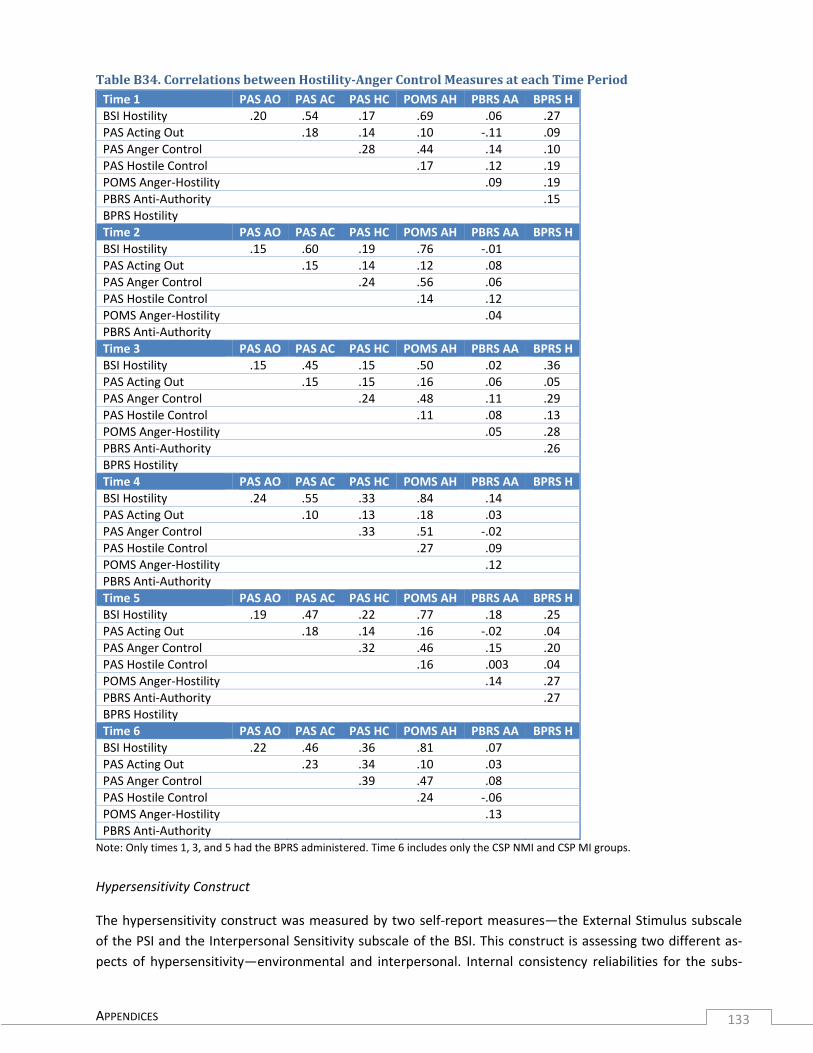
APPENDICES 133
Table B34. Correlations between HostilityAnger Control Measures at each Time Period Time 1 PAS AO PAS AC PAS HC POMS AH PBRS AA BPRS H BSI Hostility .20 .54 .17 .69 .06 .27PAS Acting Out .18 .14 .10 ‐.11 .09PAS Anger Control .28 .44 .14 .10 PAS Hostile Control .17 .12 .19POMS Anger‐Hostility .09 .19PBRS Anti‐Authority .15 BPRS Hostility Time 2 PAS AO PAS AC PAS HC POMS AH PBRS AA BPRS H BSI Hostility .15 .60 .19 .76 ‐.01 PAS Acting Out .15 .14 .12 .08PAS Anger Control .24 .56 .06PAS Hostile Control .14 .12 POMS Anger‐Hostility .04PBRS Anti‐Authority Time 3 PAS AO PAS AC PAS HC POMS AH PBRS AA BPRS H BSI Hostility .15 .45 .15 .50 .02 .36PAS Acting Out .15 .15 .16 .06 .05PAS Anger Control .24 .48 .11 .29 PAS Hostile Control .11 .08 .13POMS Anger‐Hostility .05 .28PBRS Anti‐Authority .26 BPRS Hostility Time 4 PAS AO PAS AC PAS HC POMS AH PBRS AA BPRS H BSI Hostility .24 .55 .33 .84 .14 PAS Acting Out .10 .13 .18 .03PAS Anger Control .33 .51 ‐.02PAS Hostile Control .27 .09 POMS Anger‐Hostility .12PBRS Anti‐Authority Time 5 PAS AO PAS AC PAS HC POMS AH PBRS AA BPRS H BSI Hostility .19 .47 .22 .77 .18 .25PAS Acting Out .18 .14 .16 ‐.02 .04PAS Anger Control .32 .46 .15 .20 PAS Hostile Control .16 .003 .04POMS Anger‐Hostility .14 .27PBRS Anti‐Authority .27 BPRS Hostility Time 6 PAS AO PAS AC PAS HC POMS AH PBRS AA BPRS H BSI Hostility .22 .46 .36 .81 .07 PAS Acting Out .23 .34 .10 .03PAS Anger Control .39 .47 .08PAS Hostile Control .24 ‐.06 POMS Anger‐Hostility .13PBRS Anti‐Authority
Note: Only times 1, 3, and 5 had the BPRS administered. Time 6 includes only the CSP NMI and CSP MI groups.
Hypersensitivity Construct
The hypersensitivity construct was measured by two self‐report measures—the External Stimulus subscale of the PSI and the Interpersonal Sensitivity subscale of the BSI. This construct is assessing two different as‐pects of hypersensitivity—environmental and interpersonal. Internal consistency reliabilities for the subs‐

APPENDICES 134
cales computed for each assessment period for the entire sample indicate that there is substantial variability in the internal consistency estimates (see Table B35); however, examination of each scale shows that the BSI has strong internal consistency estimates whereas the PSI has low estimates. The PSI was created by the researchers, and its purpose was to capture variables not measured by existing measures, thus it may not be a unidimensional construct. The internal estimates of the composite are lower than might be hoped for and are evidence for the lack of a homogeneous construct.
Although internal consistency estimates were low, the composite demonstrated modest estimates of test‐retest reliability (see Table B36) and the correlations between these two subscales provided evidence of convergent validity (see Table B37). Thus these scales were analyzed as a composite for the major analyses completed in the report. Results for analyses done on each individual variable are available from the re‐searchers upon request.
Table B35. Internal Consistency Estimates for Hypersensitivity Construct by Time Interval Measure # of items Time 1 Time 2 Time 3 Time 4 Time 5 Time 6 Hypersensitivity Composite 2 .55 .58 .61 .51 .48 .47 BSI Interpersonal Hypersensitivity 4 .81 .71 .86 .84 .84 .83 PSI External Stimulus 5 .22 .32 .28 .39 .34 .27 Table B36. TestRetest Correlation Coefficients for Hypersensitivity Composite at Consecutive Time Intervals for each Study Group Interval CSP MI CSP NMI GP MI GP NMI SCCF AllTime 1‐2 .56 .59 .56 .67 .21 .46Time 2‐3 .59 .74 .78 .80 .60 .71Time 3‐4 .71 .71 .63 .65 .57 .70Time 4‐5 .68 .64 .75 .72 .60 .71Time 5‐6 .67 .65 NA NA NA .68 Table B37. Correlations between Hypersensitivity Measures at each Time Period
Time: 1 2 3 4 5 6BSI IS with PSI ES .38 .41 .44 .34 .32 .31
Note: Time 6 includes only the CSP NMI and CSP MI groups.
Psychosis Construct
The psychosis construct was assessed by three self‐report measures—the Paranoid Ideation and Psychotic subscales of the BSI and the Psychotic Features subscale of the PAS—and clinician ratings (BPRS Thought Disorder). Table B38 provides the Cronbach’s alphas for each subscale and the psychosis composite. Internal consistency estimates were good for this composite and its components. Internal consistency estimates for the subscales were similar to those found with normative samples.
Table B38. Internal Consistency Estimates for Psychosis Construct by Time Interval Measure # of items Time 1 Time 2 Time 3 Time 4 Time 5 Time 6 Psychosis Composite 3 .73 .78 .80 .79 .80 .76 BSI Paranoid Ideation 5 .78 .80 .82 .83 .82 .82 BSI Psychoticism 5 .77 .78 .80 .77 .79 .75 PAS Psychotic Features 2 .62 .72 .71 .71 .79 .73 BPRS Thought Disorder 5 .64 NA .52 NA .57 NA

APPENDICES 135
Table B39 provides correlations between sequential time periods. Examination of these test‐retest reliability estimates indicates good stability between assessment periods. The study groups are similar in magnitude of correlations.
Table B39. TestRetest Correlation Coefficients for Psychosis Composite at Consecutive Time Intervals for each Study Group Interval CSP MI CSP NMI GP MI GP NMI SCCF AllTime 1‐2 .59 .61 .67 .74 .55 .55Time 2‐3 .52 .83 .75 .87 .73 .75Time 3‐4 .76 .74 .70 .81 .77 .80Time 4‐5 .71 .69 .78 .82 .68 .75Time 5‐6 .64 .79 NA NA NA .71
Table B40 provides estimates of validity coefficients between the measures of the psychosis construct. Cor‐relations indicate reasonable convergent validity for this sample, although correlations are stronger be‐tween self‐report assessments than between self‐ and staff‐report assessments.
Table B40. Correlations between Psychosis Measures at each Time Period Time Measure BSI Psy PAS Psy BPRS TD
1
BSI Paranoid Ideation .71 .57 .22BSI Psychoticism .35 .27PAS Psychotic Features .32BPRS Thought Disorder
2 BSI Paranoid Ideation .74 .66BSI Psychoticism .48PAS Psychotic Features
3
BSI Paranoid Ideation .77 .76 .31BSI Psychoticism .56 .30PAS Psychotic Features .25BPRS Thought Disorder
4 BSI Paranoid Ideation .78 .71BSI Psychoticism .47PAS Psychotic Features
5
BSI Paranoid Ideation .79 .72 .15BSI Psychoticism .53 .13PAS Psychotic Features .14BPRS Thought Disorder
6 BSI Paranoid Ideation .72 .64BSI Psychoticism .42PAS Psychotic Features
Note: Only times 1, 3, and 5 had the BPRS administered. Time 6 includes only the CSP NMI and CSP MI groups.
Somatization Construct
The somatization construct was measured by four self‐report assessments, including the Somatization sub‐scale of the BSI, the Health Problems subscale of the PAS, the POMS Fatigue‐Inertia subscale, and the Physi‐cal Well‐Being subscale of the PSI. The mean Cronbach’s alpha across somatization measures and time pe‐riods was .79 (see Table B41) and for the composite the mean alpha was .77, indicating adequate internal consistency for this sample. Estimates were similar across time periods.
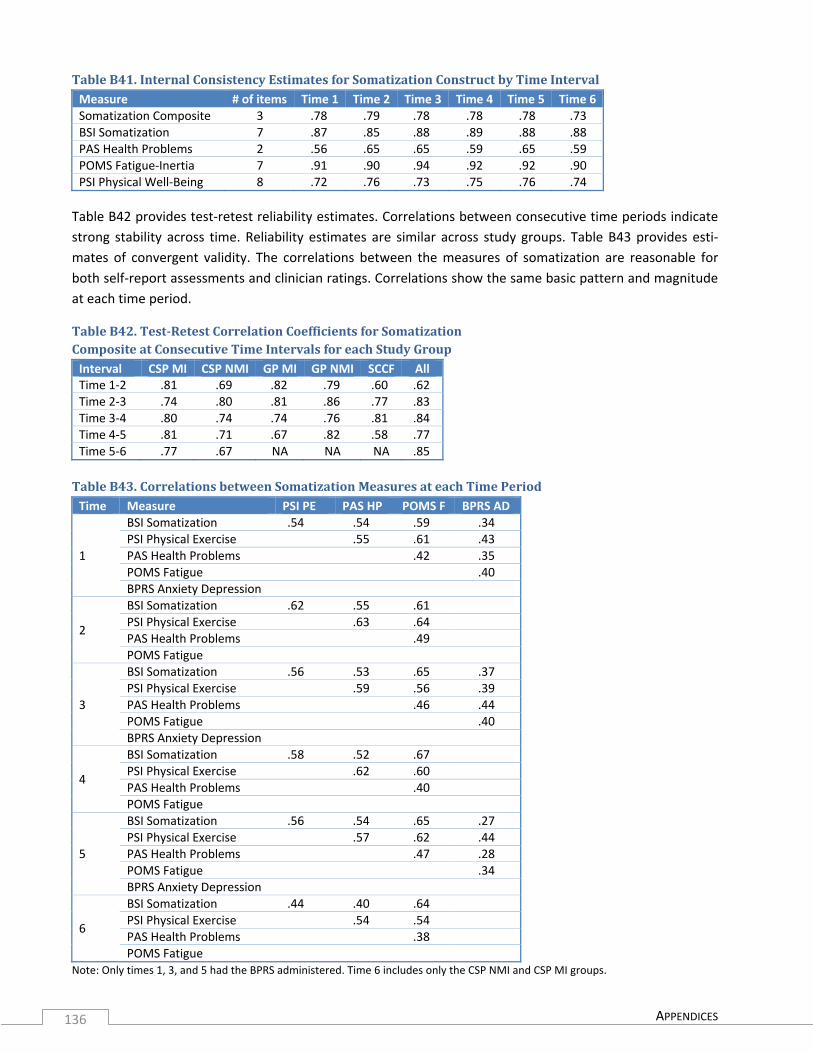
APPENDICES 136
Table B41. Internal Consistency Estimates for Somatization Construct by Time Interval Measure # of items Time 1 Time 2 Time 3 Time 4 Time 5 Time 6 Somatization Composite 3 .78 .79 .78 .78 .78 .73 BSI Somatization 7 .87 .85 .88 .89 .88 .88 PAS Health Problems 2 .56 .65 .65 .59 .65 .59 POMS Fatigue‐Inertia 7 .91 .90 .94 .92 .92 .90 PSI Physical Well‐Being 8 .72 .76 .73 .75 .76 .74
Table B42 provides test‐retest reliability estimates. Correlations between consecutive time periods indicate strong stability across time. Reliability estimates are similar across study groups. Table B43 provides esti‐mates of convergent validity. The correlations between the measures of somatization are reasonable for both self‐report assessments and clinician ratings. Correlations show the same basic pattern and magnitude at each time period.
Table B42. TestRetest Correlation Coefficients for Somatization Composite at Consecutive Time Intervals for each Study Group Interval CSP MI CSP NMI GP MI GP NMI SCCF AllTime 1‐2 .81 .69 .82 .79 .60 .62Time 2‐3 .74 .80 .81 .86 .77 .83Time 3‐4 .80 .74 .74 .76 .81 .84Time 4‐5 .81 .71 .67 .82 .58 .77Time 5‐6 .77 .67 NA NA NA .85 Table B43. Correlations between Somatization Measures at each Time Period Time Measure PSI PE PAS HP POMS F BPRS AD
1
BSI Somatization .54 .54 .59 .34PSI Physical Exercise .55 .61 .43PAS Health Problems .42 .35POMS Fatigue .40BPRS Anxiety Depression
2
BSI Somatization .62 .55 .61PSI Physical Exercise .63 .64PAS Health Problems .49POMS Fatigue
3
BSI Somatization .56 .53 .65 .37PSI Physical Exercise .59 .56 .39PAS Health Problems .46 .44POMS Fatigue .40BPRS Anxiety Depression
4
BSI Somatization .58 .52 .67PSI Physical Exercise .62 .60PAS Health Problems .40POMS Fatigue
5
BSI Somatization .56 .54 .65 .27PSI Physical Exercise .57 .62 .44PAS Health Problems .47 .28POMS Fatigue .34BPRS Anxiety Depression
6
BSI Somatization .44 .40 .64PSI Physical Exercise .54 .54PAS Health Problems .38POMS Fatigue
Note: Only times 1, 3, and 5 had the BPRS administered. Time 6 includes only the CSP NMI and CSP MI groups.

APPENDICES 137
Withdrawal/Alienation Construct
The withdrawal/alienation construct was assessed using two PAS subscales—Alienation and Social With‐drawal—and clinicians’ ratings on the BPRS Withdrawal subscale. Internal consistency reliabilities were computed for each assessment period for the entire sample and are provided in Table B44. The Cronbach’s alphas indicate adequate internal consistency estimates for the self‐report measures but are lower for the clinicians’ ratings. Estimates are of similar magnitude across time periods.
Table B44. Internal Consistency Estimates for WithdrawalAlienation Construct by Time Interval Measure # of items Time 1 Time 2 Time 3 Time 4 Time 5 Time 6 Withdrawal Composite 2 .63 .71 .67 .70 .71 .62 PAS Alienation 2 .79 .74 .75 .72 .72 .72 PAS Social Withdrawal 2 .69 .74 .72 .78 .75 .83 BPRS Withdrawal 6 .47 NA .49 NA .40 NA
Table B45 provides the estimates of test‐retest reliability for the withdrawal composite. Correlations be‐tween sequential time periods were strong indicating good stability. Reliabilities were similar across testing intervals, although there was some variability.
Table B45. TestRetest Correlation Coefficients for Withdrawal Composite at Consecutive Time Intervals for each Study Group Interval CSP MI CSP NMI GP MI GP NMI SCCF AllTime 1‐2 .65 .67 .55 .64 .87 .60Time 2‐3 .72 .83 .75 .65 .50 .73Time 3‐4 .76 .83 .61 .69 .52 .73Time 4‐5 .63 .81 .60 .49 .69 .71Time 5‐6 .67 .76 NA NA NA .72
The convergent validity estimates are provided in Table B46. The correlations between the self‐report as‐sessments (both PAS subscales) indicate strong correlation coefficients; however, the correlations of the self‐report with the clinician reports are low. The same pattern is shown across all time periods.
Table B46. Correlations between WithdrawalAlienation Measures at each Time Period Time Measure PAS SW BPRS W
1 PAS Alienation .46 .17 PAS Social Withdrawal .16BPRS Withdrawal
2 PAS Alienation .55 PAS Social Withdrawal
3 PAS Alienation .50 .06PAS Social Withdrawal .14 BPRS Withdrawal
4 PAS Alienation .53PAS Social Withdrawal
5 PAS Alienation .54 .18PAS Social Withdrawal .19BPRS Withdrawal
6 PAS Alienation .45PAS Social Withdrawal
Note: Only times 1, 3, and 5 had the BPRS administered. Time 6 includes only the CSP NMI and CSP MI groups.

APPENDICES 138
SUMMARY
Using standardized measures allowed us to assess if the scores we obtained in this sample were reliable and valid; we were also able to compare scores from our sample to known values. The self‐report assessment variables in general tended to perform similarly across study groups, across time, and to normative samples when examining internal consistency and test‐retest reliability. Self‐report measures of similar constructs tended to demonstrate convergent validity. In order to combine measures, a composite was developed for each construct of interest, except cognitive impairment, by standardizing scores from the first assessment and computing the mean across measures of the same construct. These composites demonstrated adequate research reliability (internal consistency and test‐retest).
This study included self‐report and staff report information to allow for convergence using different sources of information. Clinician ratings were gathered using the well‐known BPRS. The scores from this measure had a floor effect with scores much lower than normative data (used with clinical populations, including pa‐tients who were not in crisis). These scores had lower than expected reliability and validity estimates, al‐though some subscales correlated modestly with self‐report measures. There are several possible reasons for this, none of which have been tested in this study—participants were not forthcoming with clinicians, changing of locations may lead to unfamiliarity between participant and clinicians; lack of familiarity with measures by clinicians; clinicians have been desensitized to extreme behaviors in a prison setting so partici‐pants seem to be functioning well; clinicians are accurate but participants are exaggerating. Although the floor effect is a concern, because we hypothesized the scores to increase over time on the BPRS, the meas‐ure should be able to assess if the mean scores are getting worse over time.
We also used the only measure we could find that allowed for ratings by correctional staff. The only study available on the PBRS as a reference described the development of this measure. The PBRS assessments showed good internal consistency reliability; however, test‐retest reliabilities were low and there was little evidence of convergent validity.
Mean scores for each sample were compared to means from normative samples or published research. These comparisons to general adult populations (typically, but sometimes psychiatric populations were used) tended to show that all groups except the general prison participants without mental illness (GP NMI) had statistically significant elevations for the majority of measures across the study assessment periods. This finding suggests that participants entering administrative segregation have significant mental health issues to start, which underscores the importance of assessing individuals over time to explore changes that condi‐tions of confinement might engender.
In summary, the demonstration of good psychometric properties of the data would suggest that responses are not given randomly or haphazardly and that participants are responding in a consistent fashion.

APPENDICES 139
APPENDIX B REFERENCES
American Psychiatric Association. (1980). Diagnostic and statistical manual of mental disorders (3rd ed). Washington, DC: Author.
American Psychiatric Association. (2000). Diagnostic and statistical manual of mental disorders (4th ed., text revision). Washington, DC: Author.
Basso, M. R., Bornstein, R. A., & Lang, J. M. (1999). Practice effects on commonly used measures of executive function across twelve months. The Clinical Neuropsychologist, 13, 283‐292. doi: 10.1076/clin.13.3.283.1743
Beck, A. T. (1986). Hopelessness as a predictor of eventual suicide. Annals of the New York Academy of Sciences, 487, 90‐96. doi: 10.1111/j.1749‐6632.1986.tb27888.x
Beck, A. T., Brown, G., Berchick, R. J., Stewart, B. L., & Steer, R. A. (1990). Relationship between hopelessness and ultimate suicide: A replication with psychiatric outpatients. American Journal of Psychiatry, 147, 190‐195. Retrieved from http://ajp.psychiatryonline.org/
Beck, A. T., & Steer, R. A. (1993). Beck Hopelessness Scale: Manual. San Antonio, TX: The Psychological Cor‐poration: Harcourt Brace & Company.
Beck, A. T., Steer, R. A., Kovacs, M., & Garrison, B. (1985). Hopelessness and eventual suicide: A 10 year prospective study of patients hospitalized with suicidal ideation. American Journal of Psychiatry, 142, 559‐563. Retrieved from http://www.lexisnexis.com/
Beck, A. T., Weissman, A., Lester, D., & Trexler, L. (1974). The measurement of pessimism: The hopelessness scale. Journal of Consulting and Clinical Psychology, 42, 861‐865. doi: 10.1037/h0037562
Biancosino, B., Barbui, C., Pera, V., Osti, M., Rocchi, D., Marmai, L., & Grassi, L. (2004). Patient opinions on the benefits of treatment programs in residential psychiatric care. The Canadian Journal of Psychia‐try, 49, 613‐619. Retrieved from http://server03.cpa‐apc.org:8080/Publications/Archives/CJP/2004/september/biancosino.pdf
Bieling, P. J., Beck, A. T., & Brown, G. K. (2000). The Sociotropy‐Autonomy Scale: Structure and implications. Cognitive Therapy and Research, 24, 763‐780. doi: 10.1023/A:1005599714224
Bornstein, R. A., Baker, G. B., & Douglass, A. B. (1987). Short‐term retest reliability of the Halstead‐Reitan Battery in a normal sample. The Journal of Nervous and Mental Disease, 175, 229‐232. doi: 10.1097/00005053‐198704000‐00007
Boulet, J., & Boss, M. W. (1991). Reliability and validity of the Brief Symptom Inventory. Psychological As‐sessment, 3, 433‐437. doi: 10.1037/1040‐3590.3.3.433
Briere, J. (1995). Trauma Symptom Inventory: Professional manual. Lutz, FL: Psychological Assessment Re‐sources, Inc.
Broday, S. F., & Mason, J. L. (1991). Internal consistency of the Brief Symptom Inventory for counseling‐center clients. Psychological Reports, 68, 94. doi: 10.2466/PR0.68.1.94‐94

APPENDICES 140
Brown, G. K., Beck, A. T., Steer, R. A., & Grisham, J. R. (2000). Risk factors for suicide in psychiatric outpa‐tients: A 20‐year prospective study. Journal of Consulting and Clinical Psychology, 68, 371‐377. doi: 10.1037/0022‐006X.68.3.371
Brown, S., Chhina, N., & Dye, S. (2008). The psychiatric intensive care unit: A prospective survey of patient demographics and outcomes at seven English PICUs. Journal of Psychiatric Intensive Care, 4, 17‐27. doi: 10.1017/S1742646408001295
Burger, K. G., Calsyn, R. J., Morse, G. A., Klinkenberg, W. D., & Trusty, M. L. (1997). Factor structure of the Expanded Brief Psychiatric Rating Scale. Journal of Clinical Psychology, 53, 451‐454. doi: 10.1002/(SICI)1097‐4679(199708)53:5<451::AID‐JCLP5>3.0.CO;2‐Q
Clum, G. A., & Yang, B. (1995). Additional support for the reliability and validity of the Modified Scale for Sui‐cide Ideation. Psychological Assessment, 7, 122‐125. doi: 10.1037/1040‐3590.7.1.122
Cochran, C. D., & Hale, W. D. (1985). College norms on the Brief Symptom Inventory. Journal of Clinical Psy‐chology, 41, 777‐779. doi: 10.1002/1097‐4679(198511)41:6<777::AID‐JCLP2270410609>3.0.CO;2‐2
Cooke, D. J. (1998). The development of the Prison Behavior Rating Scale. Criminal Justice and Behavior, 25, 482‐506. doi: 10.1177/0093854898025004005
Coolidge, F. L. (n.d. a). An introduction to the Coolidge Correctional Inventory (CCI). Retrieved from http://www.uccs.edu/~faculty/fcoolidg//
Coolidge, F. L. (n.d. b). Coolidge Axis Two Inventory‐Revised (CATI+): Manual. Retrieved from http://www.uccs.edu/~faculty/fcoolidg//
Coolidge, F. L. (2004). Coolidge Correctional Inventory. Colorado Springs, CO: Author.
Coolidge, F. L., Segal, D. L., Klebe, K. J., Cahill, B. S., & Whitcomb, J. M. (2009). Psychometric properties of the Coolidge Correctional Inventory in a sample of 3,962 prison inmates. Behavioral Sciences and the Law, 27, 713‐726. doi: 10.1002/bsl.896
Cundick, B. P. (1975). Review of the Brief Symptom Inventory. In J. Close Conoley & J. J. Kramer (Eds.), The tenth mental measurement yearbook (pp. 111‐112). Lincoln, NE: University of Nebraska Press.
Derogatis, L. (1993). Brief Symptom Inventory: Administration, scoring, and procedures manual. Minneapo‐lis, MN: NCS Pearson, Inc.
Durham, T. W. (1982). Norms, reliability, and item analysis of the Hopelessness Scale in general psychiatric, forensic psychiatric, and college populations. Journal of Clinical Psychology, 38, 597‐600. doi: 10.1002/1097‐4679(198207)38:3<597::AID‐JCLP2270380321>3.0.CO;2‐6
Dyce, J. A. (1996). Factor structure of the Beck Hopelessness Scale. Journal of Clinical Psychology, 52, 555‐558. doi: 10.1002/(SICI)1097‐4679(199609)52:5<555::AID‐JCLP10>3.0.CO;2‐D
Edens, J. F., Poythress, N. G., & Watkins‐Clay, M. M. (2009). Detection of malingering in psychiatric unit and general population prison inmates: A comparison of the PAI, SIMS, and SIRS. Journal of Personality Assessment, 88, 33‐42. doi: 10.1207/s15327752jpa8801_05

APPENDICES 141
Fernandez, E. (1998). Review of the Beck Hopelessness Scale [revised]. In J. C. Impara & B. S. Plake (Eds.), The thir‐teenth mental measurement yearbook (pp. 123‐125). Lincoln, NE: University of Nebraska Press.
Fliege, H., Kocalevent, R. D., Walter, O. B., Beck, S., Gratz, K. L., Guiterrez, P. M., & Klapp, B. F. (2006). Three assessment tools for deliberate self‐harm and suicide behavior: Evaluation and psychopathological correlates. Journal of Psychosomatic Research, 61, 113‐121. doi: 10.1016/j.jpsychores.2005.10.006
Gondolf, E. W. (2008). Supplemental mental health treatment for batterer program participants (Document no. 223030). Retrieved from http://www.ncjrs.gov/pdffiles1/nij/grants/223030.pdf
Grassian, S. (1983). Psychopathological effects of solitary confinement. American Journal of Psychiatry, 140, 1450‐1454. Retrieved from http://ajp.psychiatryonline.org/index.dtl
Gratz, K. L. (2001). Measurement of deliberate self‐harm: Preliminary data on the deliberate self‐harm in‐ventory. Journal of Psychopathology and Behavioral Assessment, 23, 253‐263. doi: 10.1023/A:1012779403943
Gratz, K. L., & Chapman, A. L. (2007). The role of emotional responding and childhood maltreatment in the development and maintenance of deliberate self‐harm among male undergraduates. Psychology of Men & Masculinity, 8, 1‐14. doi: 10.1037/1524‐9220.8.1.1
Gray, R., Bressington, D., Lathlean, J., & Mills, A. (2008). Relationship between adherence, symptoms, treat‐ment attitudes, satisfaction, and side effects in prisoners taking antipsychotic medication. The Jour‐nal of Forensic Psychiatry & Psychology, 19, 335‐351. doi: 10.1080/14789940802113493
Haney, C. (2003). Mental health issues in long‐term solitary and "supermax" confinement. Crime and Delin‐quency, 49, 124‐156. doi: 10.1177/0011128702239239
Harrison, K. S., & Rogers, R. (2007). Axis I screens and suicide risk in jails: A comparative analysis. Assess‐ment, 14, 171‐180. doi: 10.1177/1073191106296483
Hayes, J. A. (1997). What does the Brief Symptom Inventory measure in college and university counseling center clients? Journal of Counseling Psychology, 44, 360‐367. doi: 10.1037/0022‐0167.44.4.360
Heeter, C., Winn, B., Winn, J., & Bozoki, A. (2008). The challenge of challenge: Avoiding and embracing diffi‐culty in a memory game (Unpublished manuscript). Retrieved from http://meaningfulplay.msu.edu/proceedings2008/mp2008_paper_31.pdf
Heinze, M. C., & Purisch, A. D. (2001). Beneath the mask: Use of psychological tests to detect and subtype malingering in criminal defendants. Journal of Forensic Psychology Practice, 1, 23‐52. doi: 10.1300/J158v01n04_02
Holden, R. R., Book, A. S., Edwards, M. J., Wasylkiw, L. , & Starzyk, K. B. (2003). Experimental faking in self‐reported psychopathology: Unidimensional or multidimensional? Personality and Individual Differ‐ences, 35, 1107‐1117. doi: 10.1016/S0191‐8869(02)00321‐5
Holden, R. R., & Fekken, C. (1988). Test‐retest reliability of the Hopelessness Scale and its items in a universi‐ty population. Journal of Clinical Psychology, 44, 40‐43. doi: 10.1002/1097‐4679(198801)44:1<40::AID‐JCLP2270440108>3.0.CO;2‐P
APPENDICES 142
Joesting, J. (1976). Test‐retest reliabilities of state‐trait anxiety inventory in an academic setting: replication. Psychological Reports, 38, 318. Retrieved from http://ejournals.ammonsscientific.com/
Kellett, S., Beail, N., Newman, D. W., & Frankish, P. (2003). Utility of the Brief Symptom Inventory in the as‐sessment of psychological distress. Journal of Applied Research in Intellectual Disabilities, 16, 127‐134. doi: 10.1046/j.1468‐3148.2003.00152.x
Kovacs, M., Beck, A. T., & Weissman, A. (1975). Hopelessness: An indicator of suicidal risk. Suicide, 5, 98‐103.
Lewis, J. L., Simcox, A. M., & Berry, D. T. R. (2002). Screening for feigned psychiatric symptoms in a forensic sample by using the MMPI‐2 and the Structured Inventory of Malingered Symptomatology. Psycho‐logical Assessment, 14, 170‐176. doi: 10.1037/1040‐3590.14.2.170
Long, J. D., Harring, J. R., Brekke, J. S., Test, M.A., & Greenberg, J. (2007). Longitudinal construct validity of Brief Symptom Inventory subscales in schizophrenia. Psychological Assessment, 19, 298‐308. doi: 10.1037/1040‐3590.19.3.298
Lorr, M., McNair, D. M., Heuchert, JW. P., & Droppleman, L. F. (2003). POMS: profile of mood states. Toron‐to, Canada: Multi‐Health Systems.
Matarazzo, J., Wiens, A., Matarazzo, R., & Goldstein, S. (1974). Psychometric and clinical test‐retest reliabili‐ty of the Halstead Impairment Index in a sample of healthy, young, normal men. Journal of Nervous and Mental Disease, 158, 37‐49. doi: 10.1097/00005053‐197401000‐00006
McCaffrey, R. J., Ortega, A., & Haase, R. F. (1993). Effects of repeated neuropsychological assessments. Arc‐hives of Clinical Neuropsychology, 8, 519‐524. doi: 10.1016/0887‐6177(93)90052‐3
McNair, D. M., & Heuchert, J. W. P. (2006). POMS: Profile of Mood States, technical update. North Tonawan‐da, NY: Multi‐Health Systems Inc.
McNair, D. M., Lorr, M., & Droppleman, L. F. (1971). Manual: Profile of Mood States. San Diego, CA: Educa‐tional and Industrial Testing Service.
McNair, D. M., Lorr, M., & Droppleman, L. F. (1992). Manual: Profile of Mood States, Revised 1992. San Di‐ego, CA: Educational and Industrial Testing Service.
Merckelbach, H., & Smith, G. P. (2003). Diagnostic accuracy of the structured inventory of malingered symp‐tomatology (SIMS) in detecting instructed malingering. Archives of Clinical Neuropsychology, 18, 145‐152. doi: 10.1093/arclin/18.2.145
Metzger, R. L. (1976). A reliability and validity study of the State‐Trait Anxiety Inventory. Journal of Clinical Psychology, 32, 276‐278. doi: 10.1002/1097‐4679(197604)32:2<276::AID‐JCLP2270320215>3.0.CO;2‐G
Morey, L. C. (1991). Personality Assessment Inventory: Professional manual. Odessa, FL: Psychological As‐sessment Resources, Inc.
Morey, L. C. (1997). Personality Assessment Screener: Professional manual. Lutz, FL: Psychological Assess‐ment Resources, Inc.

APPENDICES 143
Morlan, K. K., & Tan, S. (1998). Comparison of the Brief Psychiatric Rating Scale and the Brief Symptom In‐ventory. Journal of Clinical Psychology, 54, 885‐894. doi: 10.1002/(SICI)1097‐4679(199811)54:7<885::AID‐JCLP3>3.0.CO;2‐E
Nicholls, T. L., Lee, Z., Corrado, R. R., & Ogloff, J. R. P. (2004). Women inmates’ mental health needs: Evi‐dence of the validity of the Jail Screening Assessment Tool (JSAT). International Journal of Forensic Mental Health, 3, 167‐184. Retrieved from http://www.iafmhs.org/iafmhs.asp
Nixon, G. F., & Steffeck, J. C. (1977). Reliability of the State‐Trait Anxiety Inventory. Psychological Reports, 40, 357‐358. Retrieved from http://ejournals.ammonsscientific.com/
Norcross, J. C., Guadagnoli, E., & Prochaska, J. O. (1984). Factor structure of the Profile of Mood States (POMS): Two partial replications. Journal of Clinical Psychology, 40, 1270‐ 1277. doi: 10.1002/1097‐4679(198409)40:5<1270::AID‐JCLP2270400526>3.0.CO;2‐7
Novy, D. M., Nelson, D. V., Goodwin, J., & Rowzee, R. D. (1993). Psychometric comparability of the State‐Trait Anxiety Inventory for different ethnic subpopulations. Psychological Assessment, 5, 343‐349. doi: 10.1037/1040‐3590.5.3.343
Nyenhuis, D. L., Yamamoto, C., Luchetta, T., Terrien, A., & Parmentier, A. (1999). Adult and geriatric norma‐tive data and validation of the Profile of Mood States. Journal of Clinical Psychology, 55, 79‐86. doi: 10.1002/(SICI)1097‐4679(199901)55:1<79::AID‐JCLP8>3.0.CO;2‐7
Palmer, E. J., & Connelly, R. (2005). Depression, hopelessness and suicide ideation among vulnerable prison‐ers. Criminal Behaviour and Mental Health, 15, 164‐170. doi: 10.1002/cbm.4
Periáñez, J. A., Ríos‐Lago, M., Rodríguez‐Sánchez, J. M., Adrover‐Roig, D., Sánchez‐Cubillo, I., Crespo‐Facorro, B., Quemade, J. I., … (2007). Trail Making Test in traumatic brain injury, schizophrenia, and normal ageing: Sample comparisons and normative data. Archives of Clinical Neuropsychology, 22, 433‐447. doi: 10.1016/j.acn.2007.01.022
Perlick, D. A., Rosenheck, R. A., Clarkin, J. F., Sirey, J., & Raue, P. (1999). Symptoms predicting inpatient ser‐vice use among patients with bipolar affective disorder. Psychiatric Services, 50, 806‐812. Retrieved from http://ps.psychiatryonline.org/index.dtl
Piersma, H. L., Reaume, W. M., & Boes, J. L. (1994). The Brief Symptom Inventory (BSI) as an outcome meas‐ure for adult psychiatric inpatients. Journal of Clinical Psychology, 50, 555‐563. doi: 10.1002/1097‐4679(199407)50:4<555::AID‐JCLP2270500410>3.0.CO;2‐G
Reitan, R. M. (1958). Validity of the Trail Making Test as an indicator of organic brain damage. Perceptual and Motor Skills, 8, 271‐276. doi: 10.2466/PMS.8.7.271‐276
Sánchez‐Cubillo, I., Periáñez, J. A., Adrover‐Roig, D., Rodriguez‐Sánchez, J. M., Rios‐Lago, M., Tirapu, J., & Barceló, F. (2009). Construct validity of the Trail Making Test: Role of task‐switching, working memo‐ry, inhibition/inference control, and visuomotor abilities. Journal of International Neuropsychologi‐cal Society, 15, 438‐450. doi: 10.1017/S1355617709090626

APPENDICES 144
Segal, S. P., & Silverman, C. (2002). Determinants of client outcomes in self‐help agencies. Psychiatric Servic‐es, 53, 304‐309. doi: 10.1176/appi.ps.53.3.304
Sherrill‐Pattison, S., Donders, J., & Thompson, E. (2000). Influence of demographic variables on neuropsy‐chological test performance after traumatic brain injury. The Clinical Neuropsychologist, 14, 496‐503. doi: 10.1076/clin.14.4.496.7196
Spielberger, C., Gorsuch, R., & Lushene, R. (1970). The State‐Trait Anxiety Inventory: Test manual for Form X. Palo Alto, CA: Consulting Psychologists Press.
Spielberger, C., Gorsuch, R., Lushene, R., Vagg, P. R., & Jacobs, G. A. (1983). The State‐Trait Anxiety Inventory for adults: Sampler set. Palo Alto, CA: Consulting Psychologists Press.
Steed, L. (2001). Further validity and reliability evidence for Beck Hopelessness Scale scores in a nonclinical sample. Educational and Psychological Measurement, 61, 303‐316. doi: 10.1177/00131640121971121
Strauss, E., Sherman, E. M. S., & Spreen, O. (Eds.). A compendium of neuropsychological tests: Administra‐tion, norms, and commentary (3rd ed., pp. 3‐28). New York, NY: Oxford University Press.
Tariq, S. H., Tumosa, N., Chibnall, J. T., Perry, M. H., & Morley, J. E. (2006). Comparison of the Saint Louis University Mental Status Examination and the Mini‐Mental State Examination for detecting demen‐tia and mild neurocognitive disorder—a pilot study. American Journal of Geriatric Psychiatry, 14, 900‐910. doi: 10.1097/01.JGP.0000221510.33817.86
Thomas, A., Donnell, A. J., & Young, T. R. (2004). Factor structure and differential validity of the Expanded Brief Psychiatric Rating Scale. Assessment, 11, 177‐187. doi: 10.1177/1073191103262893
Tombaugh, T. N. (2004). Trail Making Test A and B: Normative data stratified by age and education. Archives of Clinical Neuropsychology, 19, 203‐214. doi: 10.1016/S0887‐6177(03)00039‐8
Ventura, J., Lukoff, D., Nuechterlein, K. H., Liberman, R. P., Green, M. F., & Shaner, A. (1993). Brief Psychia‐tric Rating Scale (BPRS) expanded version (4.0): Scales, anchor points, and administration manual. International Journal of Methods in Psychiatric Research, 3, 227‐244.
Whitcomb, J. M. (2006). Psychometric Properties of the Coolidge Correctional Inventory (CCI) in a sample of 4872 prison inmates (Unpublished master’s thesis). University of Colorado at Colorado Springs, CO.
Widows, M. R., & Smith, G. P. (2005). Structured Inventory of Malingered Symptomatology: Professional ma‐nual. Lutz, FL: Psychological Assessment Resources, Inc.
Zinger, I., Wichmann, C., & Andrews, D. A. (2001). The psychological effects of 60 days in administrative se‐gregation. Canadian Journal of Criminology, 43, 47‐83. Retrieved from http://www.ccja‐acjp.ca/en/cjc.html

APPENDICES 145
APPENDIX C PRISON SYMPTOM INVENTORY ANALYSES
The Prison Symptom Inventory (PSI) was developed by the researchers to assess potential responses to AS confinement that were not covered by other measures. These variables were identified through examina‐tion of the professional literature and include nervousness, headaches, lethargy, chronic tiredness, trouble sleeping, a sense of impending breakdown, perspiring hands, heart palpitations, dizziness, nightmares, trembling hands, and fainting. Additionally, items about exercise, grooming, and safety issues within AS were included. The 39‐item inventory is given in Appendix A and information about the psychometric prop‐erties of the scale are provided in Appendix B.
PSI items were grouped by the researchers into subscales which were thought to measure specific con‐structs. Three of these subscales (Hypersensitivity to External Stimuli, Panic Disorder, and Physical Well‐Being and Exercise) related to constructs assessed by the composites and were included in the composite analyses reported in the main body of the report. In this appendix we provide results from the analyses comparing the study groups on all of the PSI subscales to address the major hypotheses. Table C1 gives a list of the subscales along with items and possible range of scores. Higher scores on the PSI subscales indicate more negative behaviors except on the Attitudes about Segregation subscale where higher scores indicate a preference for AS. Table C2 (a replication of Table B12) provides the summary statistics on each subscale for each study group.
Table C1. PSI Subscales and Range of Possible Scores Subscale # Items Items Range of Possible ScoresAttitudes about Segregation 2 r14, 39 0 – 10Fear Level 4 3, 12, 21, r38 0 – 20Hypersensitivity to External Stimuli 5 1, 7, r31, r34, 37 0 – 25Mental Well‐Being 2 26, r35 0 – 10Mutism 2 22, r32 0 – 10Panic Disorder 9 2, 6, 10, 13, 16, 17, 20, 25, 30 0 – 45Physical Hygiene 5 4, r9, 18, r23, r29 0 – 25Physical Well‐Being and Exercise 8 r5, 8, r11, r15, 19, 24, 27, r28 0 – 40Safety 2 33, 36 0 – 10
Note. Item numbers with an r indicate that the item is reversed coded.
Table C2. Summary Statistics (M, SD, n) on PSI Scales by Group and Time Assessment CSP MI CSP NMI GP MI GP NMI SCCF AllAttitudes about Segregation
1 2.95 (3.19) n = 57
1.68 (2.57)n = 56
2.46 (3.00)n = 28
1.00 (2.10)n = 30
4.58 (3.47) n = 67
2.81 (3.24)n = 238
2 2.97 (3.54) n = 61
1.68 (2.63)n = 56
2.24 (2.76)n = 25
1.54 (2.42)n = 26
5.55 (3.30) n = 60
3.09 (3.42)n = 228
3 3.02 (3.36) n = 55
1.04 (2.39)n = 56
2.04 (2.30)n = 25
1.22 (1.60)n = 27
4.62 (3.45) n = 55
2.58 (3.18)n = 218
4 2.60 (3.21) n = 55
1.29 (2.43)n = 55
1.91 (2.45)n = 22
1.83 (2.58)n = 24
4.96 (3.42) n = 46
2.61 (3.20)n = 202
5 3.12 (3.51) n = 52
1.45 (2.32)n = 55
2.54 (2.67)n = 22
1.30 (1.98)n = 20
5.24 (3.57) n = 45
2.89 (3.32)n = 194
6 2.57 (3.45) n = 49
1.45 (2.32)n = 52
NA NA NA 1.92 (2.98)n = 102

APPENDICES 146
Assessment CSP MI CSP NMI GP MI GP NMI SCCF AllFear Level
1 6.25 (4.62) n = 64
4.17 (3.46)n =63
4.94 (3.78)n = 33
3.51 (3.03)n = 43
7.63 (4.15) n = 67
5.51 (4.18)n = 270
2 5.50 (4.18) n = 62
3.51 (2.54)n = 59
4.53 (3.37)n = 32
3.46 (2.60)n = 41
7.14 (4.96) n = 64
5.01 (4.00)n = 258
3 5.71 (4.10) n = 58
3.91 (2.73)n = 57
4.88 (3.40)n = 32
3.53 (2.07)n = 41
7.66 (4.00) n = 61
5.31 (3.74)n = 250
4 5.22 (3.83) n = 59
3.91 (2.96)n = 56
4.91 (3.08)n = 29
3.26 (2.53)n = 39
6.76 (4.09) n = 59
4.94 (3.63)n = 241
5 5.50 (3.50) n = 58
3.87 (2.75)n = 56
4.79 (3.21)n = 29
3.39 (2.49)n = 38
6.81 (4.30) n = 57
5.00 (3.58)n = 236
6 5.43 (3.43) n = 51
4.28 (2.72)n = 54
NA NA NA 4.84 (3.11)n = 106
Hypersensitivity to External Stimuli
1 10.54 (4.02)
n = 64 9.62 (3.92)
n =63 11.00 (5.38)
n = 33 8.44 (3.70)n = 43
9.61 (3.94) n = 67
9.82 (4.16)n = 270
2 10.10 (4.52)
n = 62 7.81 (3.86)n = 59
11.06 (3.83)n = 32
8.20 (4.09)n = 41
10.11 (3.96) n = 64
9.40 (4.22)n = 258
3 10.71 (4.65)
n = 58 8.33 (4.11)n = 57
11.34 (3.95)n = 32
7.76 (4.13)n = 41
9.72 (4.63) n = 61
9.52 (4.50)n = 249
4 9.99 (4.64) n = 58
9.22 (4.49)n = 56
10.15 (3.78)n = 29
8.00 (3.20)n = 39
9.22 (4.49) n = 59
9.55 (4.10)n = 241
5 9.54 (4.09) n = 56
9.03 (4.09)n = 56
10.65 (4.43)n = 29
7.60 (3.62)n = 38
9.03 (4.09) n = 57
9.32 (4.10)n = 236
6 9.37 ( 4.33)
n = 51 9.02 (3.59)n = 54
NA NA NA 9.20 (3.93)n = 106
Mental Well‐Being
1 4.95 (2.48) n = 64
4.48 (2.48)n =63
5.39 (2.54)n = 33
4.00 (2.43)n = 43
5.19 (2.39) n = 67
4.80 (2.48)n = 270
2 4.88 (2.24) n = 61
3.69 (2.55)n = 59
5.09 (2.61)n = 32
3.24 (2.34)n = 41
5.33 (2.53) n = 63
4.48 (2.56)n = 256
3 4.33 (2.42) n = 58
3.98 (2.41)n = 57
4.97 (2.47)n = 32
3.22 (2.31)n = 41
5.44 (2.61) n = 61
4.42 (2.55)n = 249
4 4.71 (2.43) n = 58
3.96 (2.26)n = 56
4.25 (2.78)n = 28
2.77 (1.56)n = 39
5.58 (2.44) n = 59
4.38 (2.48)n = 240
5 4.13 (2.24) n = 55
3.59 (2.25)n = 56
4.66 (2.54)n = 29
2.66 (2.29)n = 38
5.21 (2.24) n = 56
4.08 (2.43)n = 234
6 4.02 (2.01) n = 51
3.68 (2.52)n = 54
NA NA NA 3.86 (2.27)n = 106
Mutism
1 3.67 (2.19) n = 64
2.65 (1.70)n =63
3.61 (2.07)n = 33
2.40 (1.50)n = 43
3.81 (1.96) n = 67
3.26 (1.98)n = 270
2 4.44 (2.21) n = 62
2.98 (1.97)n = 59
3.16 (1.87)n = 32
2.20 (1.50)n = 41
4.11 (1.72) n = 64
3.51 (2.04)n = 258
3 4.14 (2.29) n = 57
2.98 (1.81)n = 57
3.19 (1.89)n = 32
2.32 (1.56)n = 41
4.44 (2.28) n = 61
3.52 (2.16)n = 248
4 4.41 (2.44) n = 58
2.96 (1.74)n = 56
3.28 (1.74)n = 28
2.59 (1.44)n = 39
3.95 (2.05) n = 57
3.53 (2.06)n = 238
5 4.09 (2.08) n = 55
3.00 (1.80)n = 55
3.21 (1.76)n = 29
2.26 (1.60)n = 38
3.60 (1.94) n = 57
3.31 (1.95)n = 234
6 4.00 (2.19) n = 50
2.75 (1.69)n = 52
NA NA NA 3.38 (2.04)n = 103

APPENDICES 147
Assessment CSP MI CSP NMI GP MI GP NMI SCCF AllPanic Disorder
1 9.09 (10.18)
n = 64 3.89 (5.49)
n =63 5.03 (4.88)n = 33
2.77 (3.77)n = 43
10.98 (7.72) n = 67
6.84 (7.84)n = 270
2 7.87 (8.62) n = 62
3.71 (7.72)n = 59
5.43 (5.12)n = 32
2.37 (3.45)n = 41
9.61 (8.70) n = 64
6.18 (7.62)n = 258
3 8.76 (9.17) n = 60
3.46 (4.20)n = 57
6.11 (5.02)n = 32
3.00 (4.68)n = 41
9.55 (8.68) n = 61
6.47 (7.65)n = 251
4 7.32 (7.72) n = 60
3.79 (5.44)n = 56
4.99 (5.06)n = 29
2.22 (3.28)n = 39
9.94 (8.68) n = 59
6.04 (7.19)n = 243
5 6.50 (8.80) n = 56
3.45 (4.34)n = 56
4.08 (5.13)n = 29
1.82 (3.49)n = 38
8.07 (7.45) n = 57
5.10 (6.78)n = 236
6 5.34 (7.25) n = 51
3.60 (5.78)n = 54
NA NA NA 4.41 (6.54)n = 106
Physical Hygiene
1 5.39 (5.01) n = 64
4.00 (4.03)n =63
4.64 (2.69)n = 33
2.07 (2.54)n = 43
8.26 (4.64) n = 67
5.16 (4.67)n = 270
2 5.80 (4.75) n = 61
4.06 (3.87)n = 59
3.66 (3.26)n = 32
1.74 (2.69)n = 41
7.59 (5.60) n = 64
4.93 (4.77)n = 257
3 5.67 (4.80) n = 58
3.44 (3.59)n = 57
4.19 (4.10)n = 32
2.17 (3.38)n = 41
6.19 (4.55) n = 61
4.52 (4.40)n = 249
4 5.48 (5.43) n = 58
3.25 (3.92)n = 56
3.21 (3.92)n = 29
1.92 (2.67)n = 39
5.61 (4.99) n = 59
4.14 (4.64)n = 241
5 5.73 (5.01) n = 56
3.12 (3.57)n = 56
3.62 (3.70)n = 29
1.08 (1.99)n = 38
5.22 (5.07) n = 57
3.98 (4.46)n = 236
6 4.90 (4.75) n = 51
3.18 (3.68)n = 54
NA NA NA 4.12 (4.41)n = 106
Physical Well‐Being and Exercise
1 15.89 (7.76)
n = 64 10.43 (5.55)
n =63 15.79 (6.28)
n = 33 9.21 (5.61)n = 43
18.93 (6.44) n = 67
14.29 (7.40)n = 270
2 17.10 (7.70)
n = 62 9.85 (6.23)n = 59
13.68 (7.37)n = 32
7.26 (5.53)n = 41
18.90 (6.01) n = 64
13.90 (7.91)n = 258
3 17.14 (7.05)
n = 58 10.30 (6.18)
n = 57 13.84 (6.47)
n = 32 8.12 (5.02)n = 41
18.98 (6.78) n = 61
14.12 (7.60)n = 249
4 16.13 (7.47)
n = 58 10.28 (6.14)
n = 56 13.07 (5.92)
n = 29 7.44 (4.36)n = 39
18.46 (6.67) n = 59
13.56 (7.48)n = 241
5 15.39 (7.49)
n = 56 9.54 (6.25)n = 56
13.58 (6.78)n = 29
7.08 (4.19)n = 38
17.60 (7.01) n = 57
12.97 (7.57)n = 236
6 13.95 (7.09)
n = 51 9.26 (6.72)n = 54
NA NA NA 12.97 (7.57)n = 106
The analyses in this section follows the same structure as in the main body of the report: (1) comparisons between the two CSP groups are made on the six time periods; (2) comparisons between the two NMI groups are completed on the five common time periods; and (3) comparisons between the three MI groups are completed on the five common time periods. Mixed design analysis of variance (ANOVA) techniques are used to compare group differences, change over time, and the interaction between groups and time. We were most interested in whether there are significant interactions which would imply that groups are chang‐ing differentially over time. The analyses in this section help address goals 2 and 3 of the project—to assess whether offenders with mental illness decompensate differentially in AS compared to offenders without mental illness and to compare psychological functioning of participants AS to relevant comparisons groups.

APPENDICES 148
Comparisons between CSP Groups
Table C3 gives the results from the ANOVA analyses comparing mean change over time and mean differenc‐es between the two AS groups. For each PSI subscale, the MI group scored significantly higher than the NMI group although the strength of the difference varied over the subscales (.05 ≤ η2 ≤ .23). For the Physical Well‐Being and Exercise and Mental Well‐Being subscales there were significant time effects, but not signifi‐cant interaction effects. For both subscales, there was a general decrease over time with scores at the last time period showing significantly lowered mean scores compared to scores at earlier assessment periods. For the Panic Disorder and Hypersensitivity to External Stimuli subscales, there were significant interaction effects. For the Panic Disorder subscale, there was a significant decrease over time for the MI group; how‐ever, the NMI group did not change significantly over time. Figure C1 provides a graphical display of this in‐teraction.
Table C3. F Statistics and Partial η2 Comparing AS Groups across 6 Time Periods Subscale Group Main Effect Time Main Effect Interaction Effect Attitudes about Segregation
F(1, 77) = 3.35, p = .07, η2 = .04 F(3.82, 294.12) = 0.63, p = .48, η2 = .01 F(3.82, 294.12) = 1.93, p = .11, η2 = .02
Fear Level F(1, 97) = 17.82, p < .001, η2 = .16 F(4.36, 422.41) = 0.73, p = .58, η2 = .01 F(4.36, 422.41) = 1.54, p = .18, η2 = .02
Hypersensitivity to External Stimuli
F(1, 96) = 8.11, p = .005, η2 = .08 F(5, 480) = 1.55, p = .17, η2 = .02 F(5, 480) = 2.65, p = .02, η2 = .03
Mental Well‐Being F(1, 94) = 5.10, p = .03, η2 = .05 F(4.70, 441.37) = 3.25, p = .01, η2 = .03 F(4.70, 441.37) = 2.44, p = .53, η2 = .01
Mutism F(1, 92) = 17.80, p < .001, η2 = .16 F(5, 460) = 1.93, p = .09, η2 = .02 F(5, 460) = 0.26, p = .94, η2 = .003
Panic Disorder F(1, 99) = 12.60, p = .001, η2 = .11 F(4.00, 396.25) = 2.75, p = .03, η2 = .03 F(4.00, 396.25) = 3.10, p = .02, η2 = .03
Physical Hygiene F(1, 95) = 8.76, p = .004, η2 = .08 F(5, 475) = 1.84, p = .10, η2 = .02 F(5, 475) = 1.46, p = .20, η2 = .02
Physical Well‐Being and Exercise
F(1, 96) = 27.30, p < .001, η2 = .22 F(4.60, 441.67) = 2.45, p = .03, η2 = .02 F(4.60, 441.67) = 1.00, p = .42, η2 = .01
Figure C1. Mean Scores over Time for AS Groups on the PSI Panic Disorder Scale
0
5
10
15
20
25
30
35
40
45
1 2 3 4 5 6
CSP MI
CSP NMI

APPENDICES 149
For the Hypersensitivity to External Stimuli Scale, the interaction is displayed in Figure C2. There was a signif‐icant change over time for the NMI group but the MI group did not change significantly over time. For the NMI group, there was a significant decrease in mean scores from time 1 to time 2 but scores were signifi‐cantly higher at times 4, 5, and 6 than time 2.
Figure C2. Mean Scores over Time for AS Groups on the PSI Hypersensitivity to External Stimuli Scale
Comparisons between NMI groups Comparisons were made between the CSP NMI and GP NMI groups on the five common time periods. Table C4 provides the results from the mixed design ANOVA analyses comparing mean change over time and mean differences between groups.
Table C4. F Statistics and Partial η2 Comparing NMI Groups across 5 Time Periods Subscale Group Main Effect Time Main Effect Interaction Effect
Attitudes about Segregation
F(1, 55) = 0.01, p = .93, η2 < .001 F(4, 220) = 1.66, p = .16, η2 = .03 F(4, 220) = 1.01, p = .40, η2 = .02
Fear Level F(1, 91) = 1.88, p = .17, η2 = .02 F(4, 364) = 0.28, p = .89, η2 = .003 F(4, 364) = 0.32, p = .85, η2 = .003
Hypersensitivity to External Stimuli
F(1, 91) = 1.74, p = .19, η2 = .02 F(4, 364) = 2.59, p = .04, η2 = .03 F(4, 364) = 1.01, p = .40, η2 = .01
Mental Well‐Being F(1, 91) = 4.32, p = .04, η2 = .04 F(3.64, 330.90) = 3.97, p = .005, η2 = .04 F(3.64, 330.90) = 1.42, p = .23, η2 = .02
Mutism F(1, 90) = 5.76, p = .02, η2 = .06 F(4, 360) = 0.70, p = .59, η2 = .01 F(4, 360) = 1.24, p = .29, η2 = .01
Panic Disorder F(1, 91) = 4.01, p = .05, η2 = .04 F(3.52, 319.86) = 0.28, p = .87, η2 = .003 F(3.52, 319.86) = 0.59, p = .65, η2 = .01
Physical Hygiene F(1, 91) = 9.47, p = .003, η2 = .09 F(4, 364) = 2.20, p = .07, η2 = .02 F(4, 364) = 1.56, p = .18, η2 = .02
Physical Well‐Being and Exercise
F(1, 91) = 6.36, p = .01, η2 = .06 F(3.84, 349.56) = 1.73, p = .14, η2 = .02 F(3.84, 349.56) = 0.90, p = .46, η2 = .01
The CSP NMI group had significantly higher mean scores than the GP NMI group for all PSI subscales except Fear Level, Hypersensitivity to External Stimuli, and Attitudes about Segregation. There were significant main effects of time for Hypersensitivity to External Stimuli and for Mental Well‐Being. Follow‐up tests for changes in sequential time periods indicated that the first assessment period scores were higher than the
0
3
6
9
12
15
18
21
24
1 2 3 4 5 6
CSP MI
CSP NMI

APPENDICES 150
second assessment period scores for both scales with significant time effects. There were no statistically sig‐nificant interactions between groups and time implying that scores over time were similar in the groups.
Comparisons between MI groups
Comparisons were made between the CSP MI, GP NMI, and SCCF groups on the five common time periods. Table C5 provides the results from the mixed design ANOVA analyses comparing mean change over time and mean differences between groups.
Table C5. F Statistics and Partial η2 Comparing MI Groups across 5 Time Periods Subscale Group Main Effect Time Main Effect Interaction Effect Attitudes about Segregation
F(2, 91) = 12.56, p < .001, η2 = .22 F(3.60, 327.62) = 1.34, p = .26, η2 = .02 F(7.20, 327.62) = 1.12, p = .35, η2 = .02
Fear Level F(2, 132) = 6.86, p = .001, η2 = .09 F(3.72, 491.72) = 1.27, p = .28, η2 = .01 F(7.45, 491.72) = 0.49, p = .86, η2 = .01
Hypersensitivity to External Stimuli
F(1, 131) = 0.65, p = .52, η2 = .01 F(4, 524) = 0.77, p = .55, η2 = .01 F(4, 524) = 0.58, p = .80, η2 = .01
Mental Well‐Being F(2, 126) = 3.46, p = .03, η2 = .05 F(4, 504) = 2.06, p = .08, η2 = .02 F(8, 504) = 1.03, p = .41, η2 = .02
Mutism F(2, 127) = 2.11, p = .12, η2 = .03 F(4, 508) = 0.62, p = .65, η2 = .005 F(8, 508) = 1.32, p = .23, η2 = .02
Panic Disorder F(2, 135) = 4.65, p = .01, η2 = .06 F(3.62, 489.00) = 3.33, p = .01, η2 = .02 F(7.24, 489.00) = 0.69, p = .69, η2 = .01
Physical Hygiene F(2, 130) = 4.05, p = .02, η2 = .06 F(3.91, 508.46) = 3.13, p = .02, η2 = .02 F(7.82, 508.46) = 2.87, p = .004, η2 = .04
Physical Well‐Being and Exercise
F(2, 131) = 5.73, p = .004, η2 = .08 F(3.70, 485.27) = 2.42, p = .05, η2 = .02 F(7.41, 485.27) = 1.02, p = .42, η2 = .02
There were significant group differences on all of the subscales except Hypersensitivity to External Stimuli and Mutism. For the Fear Level and Attitudes toward Segregation subscales, the SCCF group scored signifi‐cantly higher than the other two groups. For the Panic Disorder, Physical Hygiene, Physical Well‐Being and Exercise subscales, the GP MI group scored significantly lower than the other two groups. For the Mental Well‐Being subscale, the SCCF group scored significantly higher than the CSP MI group but there were no other significant differences.
The Panic Disorder and Physical Well‐Being and Exercise subscales showed statistically significant changes over time; however for both variables the changes showed improvement over time. Just one of the subs‐cales showed a statistically significant time effect and interaction effect—Physical Hygiene. For this subscale, the SCCF group showed significant decreases across time (i.e., improved hygiene over time) whereas the CSP MI and GP MI groups did not show significant change over time.
SUMMARY
Although there were statistically significant findings, the results did not support the hypotheses of the study. We expected that there would be a worsening over time in reported behavior/sensations and that this change would be worse for inmates with mental illness in AS. However, we found that when significant changes over time occurred, they tended to be in the direction of improvement and this improvement tended to occur more frequently for inmates with mental illness. When making comparisons of the AS groups to the relevant comparison groups, there was no indication that the segregation groups behavior and attitudes declined over time in comparison to the non‐segregated groups.

APPENDICES 151
Ps