evaluation of the rural math excel partnership project ... · evaluation of the rural math excel...
TRANSCRIPT

July 8, 2016
Evaluation of the Rural Math Excel Partnership Project
Final Report SRI P21756, SRI Sub-award under VASS i3 Grant No. U411C120091
Submitted to: Virginia Advanced Study Strategies Hobart Harmon, Ph.D., Project Director 324 Factory St. South Boston, VA 24592 Phone: 434-575-0692 Prepared by: Katherine Nagle Jaunelle Pratt-Williams Rebecca Schmidt Cara Swantek Marianna Lyulchenko Raymond McGhee

Contents Executive Summary ...................................................................................................................................... iii
Project Overview ...................................................................................................................................... iii Changes to the RMEP Project .................................................................................................................. iii Key Implementation and Impact Findings ............................................................................................... iii Lessons Learned and Overall Conclusions ............................................................................................... iv
Introduction .................................................................................................................................................. 1 Background 2
Project Objectives ..................................................................................................................................... 4 Project Modifications ................................................................................................................................ 4
SRI Evaluation Activities and Management Tasks......................................................................................... 5 Implementation Evaluation .......................................................................................................................... 6
Study Design ............................................................................................................................................. 6 Implementation Findings .......................................................................................................................... 6
Broader Contextual Factors of the LEAs, Schools, and Communities ................................................... 6 RMEP Project Core Components: Delivery and Fidelity of Implementation ........................................ 7 Research Question 3: Barriers and Challenges to Implementing ....................................................... 14 Implementation Variation across LEAs, Schools, and Communities ................................................... 15
Impact Study ............................................................................................................................................... 15 Study Design ........................................................................................................................................... 16
Sample ................................................................................................................................................. 16 Instruments ......................................................................................................................................... 18 Data and Methods .............................................................................................................................. 19
Impact Study Findings ............................................................................................................................. 20 Research Question 1: Impact of the Intervention on Student Achievement ..................................... 20 Research Question 2 and 3: Impact of the Intervention on Students’ Attitudes toward Mathematics and Interest in STEM Careers ....................................................................................... 21
Summary and Discussion ............................................................................................................................ 22 References ................................................................................................................................................. 24

Evaluation of the Rural Mathematics Excel Partnership Project: Final Report Page | ii
Exhibits Exhibit 1. Rural Math Excel Partnership Logic Model ............................................................................... 3 Exhibit 2. High-Implementing Teacher by School ..................................................................................... 5 Exhibit 3. Assignment of Khan Academy Videos, by School, Year 2.......................................................... 8 Exhibit 4. Teacher Assignments by LEA (MARi)a...................................................................................... 10 Exhibit 5. Year 2 Student and Parent Evaluation of the FMN Event ....................................................... 11 Exhibit 6. Year 3 Student and Parent Appreciation of the FMN Event ................................................... 12 Exhibit 7. Page Views per Month, Year 3 ................................................................................................ 12 Exhibit 8. Community STEM Events Held ................................................................................................ 13 Exhibit 9. Characteristics Used for Propensity Score Matching at the LEA Level.................................... 17 Exhibit 10. Demographics of Treatment and Comparison LEAs ................................................................ 18 Exhibit 11. Difference in SOL Scores of Treatment and Comparison Students
Before the Intervention, in Standard Deviation Units ............................................................ 21 Exhibit 12. Difference in SOL Scores of Treatment and Comparison Students
After the Intervention, in Standard Deviation Units ............................................................... 21 Exhibit 13. Difference in Average Student Attitudes Before and After the Intervention ......................... 22 Exhibit 14. Difference in the Odds of Student Interest in STEM Careers
Before and After the Intervention ........................................................................................... 22
Appendix Appendix A. Additional Tables and Resources .......................................................................................... A-1

Evaluation of the Rural Mathematics Excel Partnership Project: Final Report Page | iii
Executive Summary
Project Overview The Virginia Advanced Study Strategies, Inc. (VASS) created the Rural Math Excel Partnership (RMEP) Project to develop a rural workforce qualified for science, technology, engineering, and math (STEM) jobs in their local communities. The RMEP Project is funded by an Investing in Innovation (I3) development grant from the U.S. Department of Education and was implemented from 2013 to 2015. The RMEP Project included 14 schools across six rural Virginia Local Education Agencies (LEAs) in five counties. The goal of the RMEP Project was to develop and implement a model of shared responsibility among families, teachers, and communities in rural areas to prepare students to be successful in advanced high school and postsecondary STEM studies. The long term outcome was for students to leave school ready, at a minimum, to enroll in a certificate program for a technician-level career in STEM-related fields. The RMEP Project had six core implementation activities: (1) a gap analysis and development of a Math Advanced Study (MAS) guide, (2) professional development (PD) and ongoing coaching for participating teachers, (3) a Family Math Night (FMN), conducted by teachers (4) a project website and social media presence, (5) community-based STEM events, and (6) access to technology for students. SRI Education, a division of SRI International (SRI), was the external evaluator for the RMEP Project conducting the implementation study and impact study for the RMEP Project.
Changes to the RMEP Project The RMEP team faced a number of barriers when initiating the RMEP Project in Year 1 (2013) and to implementing the model in Year 2 (2014). Staff considered the lessons learned from these challenges and created new systems to eliminate some of the barriers. Initially, the RMEP Project included all Algebra I, Geometry, Algebra II, and Algebra Functions and Data Analysis (AFDA) teachers at 14 schools. Due to low levels of implementation by some teachers, in fall 2015 (Year 3) the RMEP team focused their supports and services on a group of 24 teachers who they believed were high implementers of the model.
Key Implementation and Impact Findings There are several key findings from the implementation study:
• The RMEP team completed five of the six core implementation activities meeting the standard of performance set by the evaluation team. The only activity that did not meet performance standards was technology access.
• Providing student and family access to technology was challenging for several reasons. RMEP staff tried several tablet technologies to stream online videos before finding a product that worked reliably in each area. It was difficult and time consuming to locate students and families in need of tablets and broadband access at the 14 schools and then to provide these individuals with the necessary services in their homes. Furthermore, teacher comfort level with technology, district firewalls, and registration requirements for the online video platform, MARi, created significant delays for the RMEP Project throughout Year 2. However, by the end of the Project, RMEP provided technology access to all the students and their families in the classrooms of high-implementing teachers.
• Although RMEP staff made every effort to maintain that the quality of each component was maintained, the willingness of individual teachers to perform their role in the model

Evaluation of the Rural Mathematics Excel Partnership Project: Final Report Page | iv
of shared responsibility varied, especially in the number videos that teachers assigned to students and their efforts to hold Family Math Nights.
• Recognizing the lack of buy-in on the part of some teachers, RMEP focused its resources and staff on high-implementing teachers during fall 2015. Although full implementation of the model was restricted to a single semester, there was evidence that this higher level of support was beginning to have positive impacts on the high-implementing teachers in terms of video assignments and student completion of these assignments.
• Evaluations from families and students showed that participating in RMEP-related events were useful and worth their time, though attendance was lower than expected for these events. Teachers and community members reported that organizing these events required a large time commitment and that they needed more help in identifying ways to increase attendance.
SRI evaluators found that the RMEP Project had no impact on students’ achievement or attitudes. There are several possible reasons for these findings:
• There are differences between the content knowledge that the Virginia Standards of Learning (SOL) exams assess and the content emphasized by the RMEP Project. It may appear that there was no or little improvement in student achievement because of these content differences.
• Due to state data limitations, the evaluators were not able to limit the sample to only those students whose teachers implemented the intervention in the 2015–16 school year (the high-implementing teachers). Any effect may have been diluted by the inclusion of scores from students who did not have access to the intervention because their teachers were not participating in the RMEP Project in fall 2015.
• The RMEP Project was only fully implemented in the fall 2015 semester, a short time period, which may have contributed to the lack of effect on achievement and attitudes.
• The small sample size of students may not have been large enough to detect a very small effect.
Lessons Learned and Overall Conclusions The challenges that the RMEP team experienced in implementing the model of shared responsibility are not surprising for a development grant, especially one that included 14 schools in six communities, incorporated technology, and took place in remote rural areas. A crucial lesson learned was that the level of direct support required by teachers and community leaders to perform their roles in the model should not be underestimated. For example, two RMEP staff engaged in the schools on a regular basis, but they had limited capacity to sustain the buy-in of the larger group of original participants. Once the RMEP staff decided to focus resources in fall 2015 on high-implementing teachers, SRI evaluators began to see more videos being assigned by teachers and completed by students. This finding suggests that the level of supports and resources necessary to promote buy-in and adoption by participants was greater than RMEP staff could meet at the original scale.
Another important lesson learned relates to the use of technology. Problems with technology led to delays in beginning of the RMEP Project in Year 1 and in implementing it throughout Year 2. These delays, along with competing instructional priorities and existing school commitments, may have contributed to the reluctance of a majority of teachers to use the MAS guide in their classrooms, hold FMNs, and assign video homework.

Evaluation of the Rural Mathematics Excel Partnership Project: Final Report Page | v
The components of the model were not fully implemented until fall 2015, and this was an insufficient time period for the intervention to have a significant impact on the targeted outcomes. Nevertheless, the RMEP Project can serve as an illustrative example for other such initiatives, and suggests that similar projects should consider level of participant buy-in, anticipate and be able to troubleshoot technology access issues, and provide enough time as well as staff support for full implementation.

SRI International Evaluation of the Rural Math Excel Partnership Project
Final Report
Introduction For many years, the Virginia Advanced Study Strategies, Inc. (VASS) has been a part of rural Virginia communities. Since 2007, VASS has provided professional development and ongoing support to teachers, counselors, and administrators in an effort to improve academic rigor and increase student access to coursework that prepares them for college and career success. In addition, VASS has provided student support sessions after school, on Saturdays, and via evening webinars to increase success on standardized assessments such as Advanced Placement (AP) exams and the Virginia Placement Test. Through these activities, VASS learned that the content in foundational math courses, such as Algebra I, Algebra II, and Geometry, did not prepare students for AP or college credit dual enrollment courses. Without this level of mastery, it was unlikely that students would be ready for postsecondary education, for careers as skilled technicians, or higher level professional positions in science, technology, engineering, and math (STEM) focused careers (Lee, 2012). After considering this potential disadvantage, VASS created the Rural Math Excel Partnership (RMEP) Project. The RMEP Project was designed to address the need for a more highly-qualified rural workforce capable of pursuing technician-level and higher career choices in the STEM fields.
The RMEP Project was funded by an Investing in Innovation (I3) development grant from the U.S. Department of Education. Development grants provide funding “to support the development or testing of practices that are supported by evidence of promise or strong theory and whose efficacy should be systematically studied.”1 The goal of the RMEP Project was to develop and implement a model of shared responsibility among families, teachers, and communities in rural areas for student preparation for and success in advanced high school and postsecondary STEM studies. The RMEP Project’s long term outcome was for students to leave school ready, at a minimum, to pursue postsecondary preparation for a technician-level career in STEM-related fields.
SRI Education, a division of SRI International (SRI), was the external evaluator for the RMEP Project. SRI engaged in data collection, data analysis, and the reporting of subtasks in both the implementation and impact studies. SRI evaluators produced a combination of evaluation briefs and annual reports. The evaluation team reported evidence on performance measures to determine if the proposed shared responsibility model for supporting student excellence in math (i.e., innovation) is feasible as a promising practice and therefore worthy of further efficacy testing and implementation in other rural school districts. This report is the final report for the RMEP Project. It provides a summary of Project-related activities across the 3 years of implementation and evaluates the implementation and the impact of the RMEP Project. Year 1 of the RMEP Project was the 2013 calendar year, Year 2 was the 2014 calendar year, and Year 3 was the 2015 calendar year.
1 U.S. Department of Education. (2015) Investing in Innovation Fund (i3) Program Guidance and Frequently Asked Questions (FAQs): FY 2015 Development Competition.

Evaluation of the Rural Mathematics Excel Partnership Project: Final Report Page | 2
Background The RMEP Project was created through a partnership between VASS and six rural LEAs in Virginia: City of Martinsville School Division (in Henry County), Charlotte County School Division, Cumberland County School Division, Halifax County School Division, Henry County School Division, and Prince Edward County School Division. To protect confidentiality, the evaluators assigned each of the participating counties, LEAs, and schools a randomly generated identification number. These numbers are presented in each table in the report and in all findings.
VASS designed the partnership to address the need for a more highly-qualified rural workforce that could pursue STEM careers. Through VASS’s experience operating a tutoring program, the Virginia model of the National Math and Science initiative (NMSI) in 73 schools, as well as through other work with rural communities, VASS found that a strong sense of shared responsibility between teachers, families, and the community was necessary to raise the academic bar for middle and high school students in high-poverty rural areas. VASS planned for the RMEP Project to have six core components: (1) a gap analysis and Math Advanced Study (MAS) guide, (2) professional development (PD) and ongoing coaching, (3) Family Math Night (FMN), (4) a project website and social media presence, (5) community-based STEM events, and (6) technology access.
Exhibit 1 represents the logic model of how the RMEP Project proposed to achieve its intended long term outcome of increasing the number of students who pursue and are prepared for STEM technician-level careers. The logic model provides a conceptual framework for understanding the RMEP Project’s inputs, core components, outputs, mediators, and expected outcomes. The RMEP Project’s inputs, in the circle in the bottom left corner, represent resources and assets that support the key components. On the far left are the RMEP Project strategies (core components). Moving to the right, the RMEP Project strategies are linked to outputs, which are indicators that the program was being implemented as intended. These outputs were expected to lead to the mediators: changes in knowledge, attitudes, and behaviors on the part of teachers, families, and community organizers. The ultimate impact of the RMEP Project is to create a pool of students who graduate high school ready to pursue postsecondary education that will prepare them for, at a minimum, technician-level careers (the right-most column).

Evaluation of the Rural Mathematics Excel Partnership Project: Final Report Page | 3
Exhibit 1. Rural Math Excel Partnership Logic Model
Evaluation of the Rural Mathematics Excel Partnership Project: Final Report Page | 4
Project Objectives The objectives for the RMEP Project were to use the six core components shown in Exhibit 1 to:
1. Address foundational math content gaps required for high school graduates to pursue postsecondary preparation for careers that require advanced STEM courses.
2. Prepare all teachers of Algebra I, Geometry, Algebra II, and Algebra Functions and Data Analysis (AFDA) courses in seven middle schools and seven high schools to integrate digital math videos into their lesson plans and make subsequent student homework assignments.
3. Engage the parents/family members of students in Algebra I, Geometry, Algebra II, and AFDA courses in reinforcing the focus on students learning essential math competencies through completion of the video-based homework assignments.
4. Engage representatives of community-based organizations in each LEA service area (i.e., school district) to reinforce to students and families the importance of math achievement to STEM-related careers.
Project Modifications As reported in SRI’s annual evaluation reports,2 RMEP staff faced a number of barriers to initiating the RMEP Project in Year 1 (2013) and implementing the model in Year 2 (2014).3 Barriers included a delay in hiring a math expert/specialist and ongoing challenges with technology access for students. Additionally, SRI noted that, in fall semester 2014, few teachers assigned more than 10 videos in total and that 61 percent of participating math teachers had assigned no videos during the semester. This percentage was distributed evenly across schools. At most sites, either one individual or a small group of teachers disproportionately accounted for the total number of videos assigned. These challenges continued into Year 3 (2015), and SRI evaluators shared this information with VASS leadership. Based on this information, in March 2015, VASS staff and the I3 program officer for the RMEP Project determined that modifications should be considered for the fall 2015 RMEP continued implementation. Specifically, VASS proposed identifying and focusing services and supports on a subset of high-implementing teachers for the remainder of the RMEP Project. The VASS team identified 26 high-implementing teachers, along with their associated students and parents, based on prior online video assignment and perceived willingness to continue in the RMEP Project.
Considering the proposed modifications, SRI evaluators consulted with their ABT technical assistance liaison, Dr. Jill Lammert, and her colleagues at ABT about the impact of this change on the evaluation design and sample size. One notable concern was that narrowing the evaluation to this sample of teachers, students, and parents would decrease the strength of evidence and the power to detect effects. Additionally, the evaluators discussed that focusing the intervention on the high-implementing teachers would require changing the impact evaluation design from a matched comparison group at the LEA level to a matched comparison group at the teacher/classroom level. After exploring the required data, the SRI evaluators discovered that a teacher/classroom level evaluation would not be possible
2 McGhee, R. & Nagle, K. (2014). Evaluation of the Rural Mathematics Excel Partnership Project Year 1 Report January 1 – December 31, 2013. SRI International, Menlo Park, CA.; McGhee, R., Nagle, K., Brown, J., Schmidt, R., Tiell, S., and Lyulchenko, M. (2014). Evaluation of the Rural Mathematics Excel Partnership Project Year 2 Report January 1 – December 31, 2014. SRI International, Menlo Park, CA.; McGhee, R., Nagle, K., Pratt-Williams, J., Lyulchenko, M, Swantek, C., and Schmidt, R. (2016) Evaluation of the Rural Mathematics Excel Partnership Project: Year 3 Report January 1 – December 31, 2015. SRI International, Menlo Park, CA. 3 The RMEP team/staff refers to all VASS staff who supported the RMEP Project.

Evaluation of the Rural Mathematics Excel Partnership Project: Final Report Page | 5
because Virginia Standards of Learning (SOL) data do not include information that allows for the matching of students with particular teachers. Without these data, the teacher/classroom level evaluation would mean the study would be downgraded from a Quasi-Experimental Design (QED) to a study that Demonstrates Evidence of Promise. Considering these factors, SRI decided not to modify the study to focus on the smaller high-implementing teacher sample, and instead, to continue to include all teachers, students, and parents who participated in the RMEP Project from the beginning. The SRI evaluators did, however, decide to delay the May 2015 administration of Part II of the student and parent surveys until December 2015 and Part II of the teacher survey until March 2016 to give the high-implementing teachers time to perform their role in the model of shared responsibility during the fall semester. Additionally, SRI used the sample of students in high-implementing teachers’ classrooms for the analysis of student surveys.
High-Implementing Teachers. VASS staff identified high-implementing teachers in each of the original six participating LEAs (Exhibit 2). Initially, the RMEP team trained 26 teachers for the fall 2015 implementation, but two teachers later learned they were no longer teaching the RMEP-targeted courses that semester, leaving 24 teachers. Eleven of the 14 schools that originally participated in the RMEP Project had at least one high-implementing teacher identified by VASS. In fall 2015, the RMEP team expected only high-implementing teachers to assign online homework and conduct FMNs.4
Exhibit 2. High-Implementing Teacher, by School LEA Number of High-Implementing Teachers
LEA 2 4 LEA 3 2 LEA 4 5 LEA 7 9 LEA 8 2 LEA 11 3
SRI Evaluation Activities and Management Tasks SRI engaged in internal and external management tasks, including evaluation activities, managing SRI’s internal IRB requirements, and communicating with the RMEP team. This section includes a summary of these evaluation activities and management tasks. The evaluators included detailed documentation of the activities and tasks for each year in each annual report for the RMEP Project.
Throughout the implementation of the Partnership, the SRI evaluation team maintained regular contact with the VASS Project leaders through a variety of methods, such as conference calls, email correspondence, and face-to-face meetings. Each month SRI evaluators provided VASS with a brief report of their evaluation activities, which VASS staff shared with their I3 Project officer, Folake Reed. SRI prepared an annual report for each year of the RMEP Project implementation for VASS as well as “just in time” memos related to Project activities. The evaluators regularly called into the VASS monthly staff meetings and were updated on Project activities associated with implementing the key components of the model of shared responsibility. SRI evaluators participated in “as needed” calls with VASS to discuss implementation and coordination of site visits. In addition, SRI evaluators reviewed the online RMEP calendar on the VASS website to track Project activities.
4 The RMEP team refers to all VASS staff who supported the RMEP Project.

Evaluation of the Rural Mathematics Excel Partnership Project: Final Report Page | 6
Implementation Evaluation The implementation study documents the implementation fidelity of the RMEP model of shared responsibility at the program, school/LEA, and local community levels. There are three dimensions of implementation fidelity: adherence (the presence or absence of core program elements), quality of program delivery (the manner in which the program innovation is delivered), and participant responsiveness (the extent to which participants are engaged by and involved in the activities and content of the program innovation)5. SRI evaluators used adherence as the main dimension for assessing whether or not a component was implemented with fidelity, though the other two dimensions were included in the overall discussion. Five research questions guided the implementation study:
1. What are the broader contextual factors of the schools, LEAs, and communities where the RMEP Project is being implemented?
2. To what extent are the core components of the RMEP Project delivered as planned? 3. What was the overall level of fidelity of implementation of the key components of the
intervention? 4. What are the barriers and challenges to implementing the RMEP Project as planned? 5. Was there variation in implementation of the key components across the different
schools/LEAs/communities, and what factors contributed to that variation?
Study Design In accordance with National Evaluation of i3 (NEi3), SRI evaluators utilized a fidelity matrix to assess the implementation of the RMEP Project (See Appendix A-8 through A-11). This matrix includes the indicators of fidelity for each core component, an operational definition of the indicator, and school/LEA/community-level and sample-level thresholds for implementation. The evaluators used multiple data sources to measure fidelity for each component, including event evaluations, event observations, interviews with participants and RMEP team members, reports from the RMEP team, video back-end usage data, website data, and teacher surveys where teachers shared their opinions and experiences with the RMEP Project as a whole. The RMEP Project used MARi, an online platform that allows teachers to assign videos and other assignments to students who also have access to the platform. This platform collected the back-end usage data. The implementation study focused on adherence, that is, whether the core program components were implemented as intended. The researchers examined the other two dimensions of fidelity, program quality and participant responsive, but the emphasis was on adherence. SRI evaluators assessed implementation fidelity for each key component of the model at the program, school, LEA, and community levels as appropriate and considered the fidelity threshold at the appropriate site level (i.e., LEA/community).
Implementation Findings This section describes the findings from the 3-year implementation study, framed by the topics in the guiding research questions.
Broader Contextual Factors of the LEAs, Schools, and Communities The six LEAs who participated in the RMEP were located in rural areas of Virginia. Though many of these areas had close-knit communities, the remoteness of some towns had the potential to leave families 5 Dane, A. and Schneider, B. (1998). Program integrity in primary and early secondary prevention: are implementation effects out of control? Clinical Psychology Review, 18 (1), 23–45.
Evaluation of the Rural Mathematics Excel Partnership Project: Final Report Page | 7
isolated or required them to travel long distances to reach schools or events. Severe weather was also a possibility, especially during the winter months. In Year 2, these areas experienced severe winter weather that made travelling to schools and LEAs challenging for both families attending RMEP Project-supported events and the RMEP team providing coaching and supports to participating teachers. In Year 3, the RMEP team incorporated more virtual methods of communication, such as WebEx and online sharing sites, to ensure that they could support teachers even when severe weather made travel difficult. Teachers were also encouraged to use technology as an alternate form of communication with students who may not be able to get to school or an event.
Like many rural areas, these communities were still establishing the technological infrastructure needed for internet access and general communication. Some families in the RMEP LEAs did not have access to reliable internet from major communication companies or access to technological devices capable of streaming online videos from Khan Academy, the RMEP Project’s main source for instructional videos. The RMEP team had to be mindful of these issues as they attempted to provide greater technology access. As the ability to view teacher-assigned video homework on tablets was a part of the intervention, the RMEP Project took numerous steps to ensure that students and their families could access technology and the internet from home. Initially, the RMEP team provided tablets to students who did not have such devices, and if necessary, broadband internet access to individual families. This process was not without challenges, as the RMEP team needed to identify technology tablets capable of streaming online videos, struggled to identify students who required access to technology, and had to address improper student use of the internet. However, by the end of the implementation, RMEP staff were able to obtain the needed permissions from parents and to limit improper internet use, allowing most students in high-implementing teachers’ classroom to have access.
There were additional contextual factors to consider at the district and school levels. Like many districts, some of the participating districts had multiple areas of focus for professional development, making the RMEP Project one among multiple initiatives taking place in schools. Each initiative required time and commitment from teachers and staff. The RMEP team had to be mindful of participants’ initiative fatigue as they tried to support the implementation of the teacher role in the model of shared responsibility. As required by state and federal law, each school also participated in annual state assessments (the SOLs). Some teachers were concerned that teaching content aligned with workforce skills may take time away from instruction in the SOLs and students would not be prepared for them. Recognizing this conflict, the RMEP Project enhanced the Math Advanced Studies (MAS) guide to include content that supported the SOLs so that participating teachers incorporated career specific content and supported SOLs. Research indicates that when an intervention aligns with practitioners’ beliefs and philosophies they are more likely to implement with fidelity (Horner, Blitz, & Ross, 2014; Shaver, Wagner, Nagle, & Ryan, 2015). Helping teachers see the connections between implementing the REMP Project and their instructional objectives was critical for buy-in and implementation fidelity. In addition, RMEP staff took time to reassure parents that the RMEP Project would enhance students’ overall math skills and prepare them for the STEM workforce.
RMEP Project Core Components: Delivery and Fidelity of Implementation The six core components of the RMEP Project included: (1) a gap analysis and Math Advanced Study (MAS) guide, (2) professional development (PD) and ongoing coaching, (3) Family Math Night (FMN), (4) a project website and social media presence, (5) community-based STEM events, and (6) technology access. The focus of this report is on the fidelity of each component; the evaluators include a brief description of the components as well as any details that aid in better understanding the implementation (Appendix A-3, A-4, A-5). Additional contextual details for each component can be found in the annual reports.
Evaluation of the Rural Mathematics Excel Partnership Project: Final Report Page | 8
Gap Analysis. The first critical component to implementing the RMEP Project was conducting the gap analysis to assess gaps between essential math workforce competencies and the Virginia math SOLs. The RMEP team and members of the Teacher Development Team (TDT), made up of six teachers from participating LEAs, used the results of the analysis to create the MAS guide to address these gaps.
Led by Dr. Hobart Hamon, the RMEP team held Developing a Curriculum (DACUM) meetings during the first year of implementation. A DACUM is a formal process of defining the duties and tasks that are performed by expert workers in any job or occupation and developing a curriculum that can prepare workers in that job or occupation. The meetings utilized the expertise of STEM technicians and community college faculty. The RMEP team used the findings from the DACUM meetings to work with the TDT on evaluating the math skills included in the SOLs that are required by technicians and community colleges. For the competencies that the RMEP and TDT determined were not taught effectively, the TDT identified Khan Academy videos that could support these competencies. The TDT and RMEP math expert also created the MAS guide that included the competency, related SOL, and a real-life math problem that teachers could use. The meetings of both the DACUM groups and TDT were held regularly, as indicated, with an emphasis on quality interactions and outcomes. Those that participated in the process reported being engaged and valuing of the process. The SRI evaluators determined that the Project met the adherence, the quality, and responsiveness standards for the gap analysis and MAS Guide component.
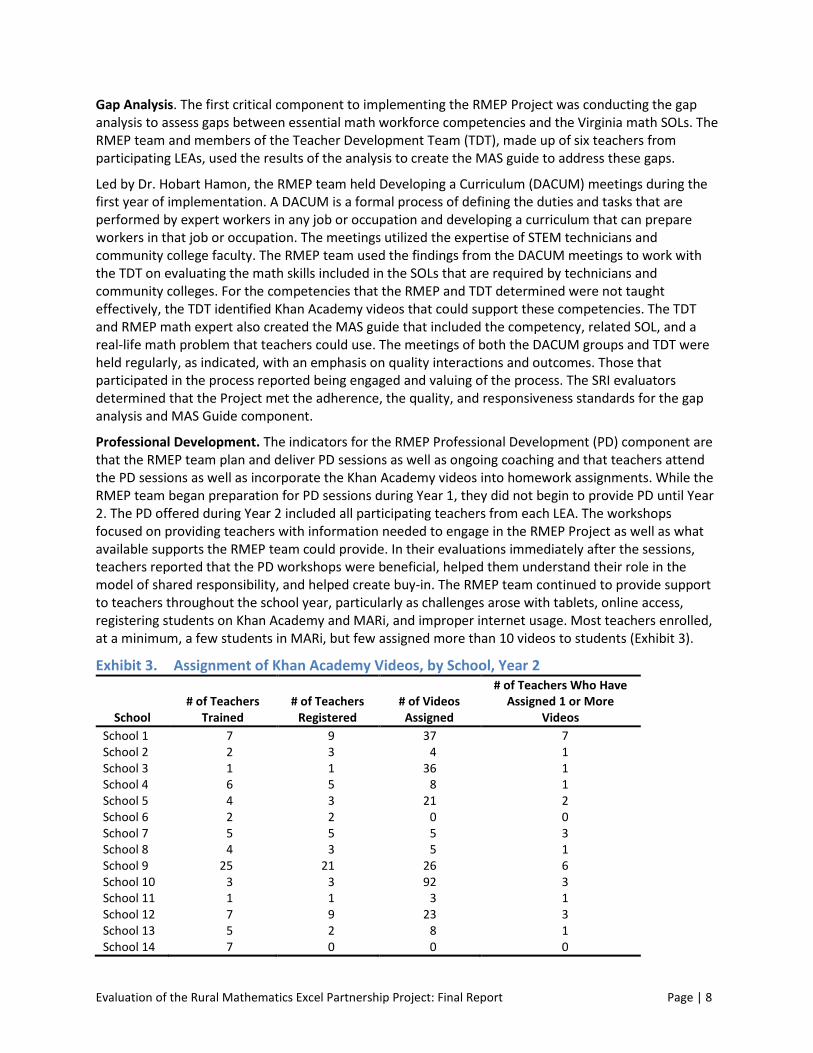
Professional Development. The indicators for the RMEP Professional Development (PD) component are that the RMEP team plan and deliver PD sessions as well as ongoing coaching and that teachers attend the PD sessions as well as incorporate the Khan Academy videos into homework assignments. While the RMEP team began preparation for PD sessions during Year 1, they did not begin to provide PD until Year 2. The PD offered during Year 2 included all participating teachers from each LEA. The workshops focused on providing teachers with information needed to engage in the RMEP Project as well as what available supports the RMEP team could provide. In their evaluations immediately after the sessions, teachers reported that the PD workshops were beneficial, helped them understand their role in the model of shared responsibility, and helped create buy-in. The RMEP team continued to provide support to teachers throughout the school year, particularly as challenges arose with tablets, online access, registering students on Khan Academy and MARi, and improper internet usage. Most teachers enrolled, at a minimum, a few students in MARi, but few assigned more than 10 videos to students (Exhibit 3).
Exhibit 3. Assignment of Khan Academy Videos, by School, Year 2
School # of Teachers
Trained # of Teachers
Registered # of Videos
Assigned
# of Teachers Who Have Assigned 1 or More
Videos School 1 7 9 37 7 School 2 2 3 4 1 School 3 1 1 36 1 School 4 6 5 8 1 School 5 4 3 21 2 School 6 2 2 0 0 School 7 5 5 5 3 School 8 4 3 5 1 School 9 25 21 26 6 School 10 3 3 92 3 School 11 1 1 3 1 School 12 7 9 23 3 School 13 5 2 8 1 School 14 7 0 0 0
Evaluation of the Rural Mathematics Excel Partnership Project: Final Report Page | 9
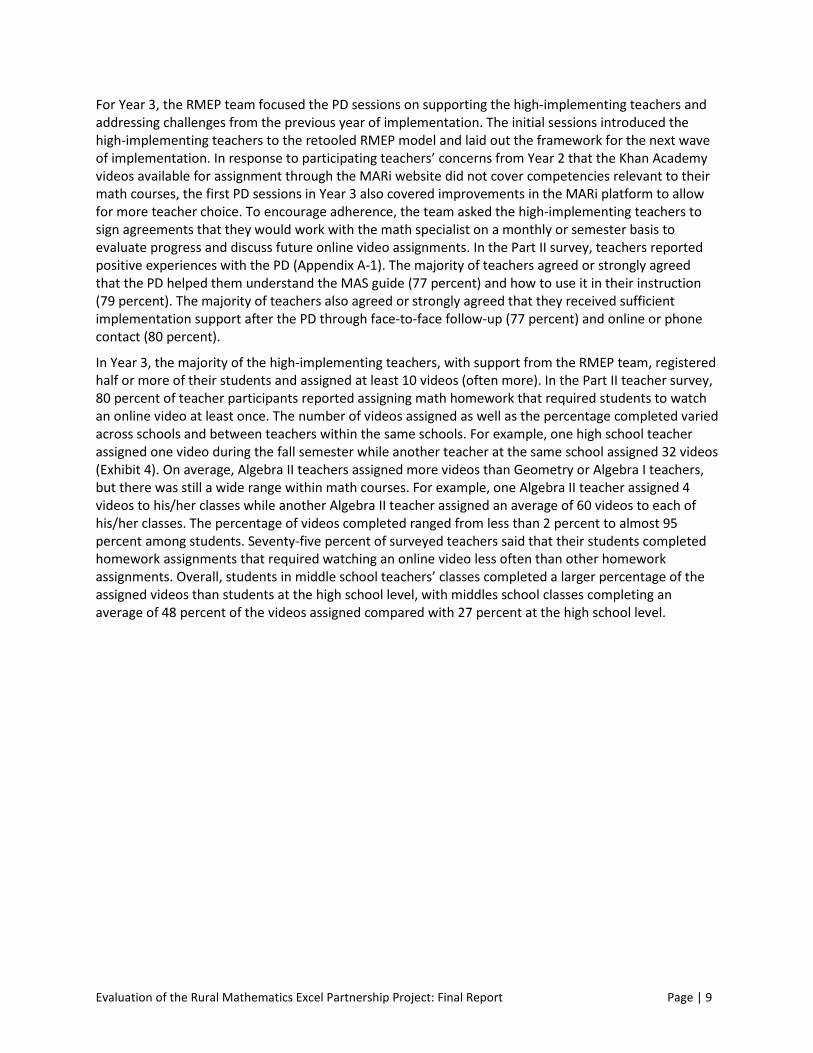
For Year 3, the RMEP team focused the PD sessions on supporting the high-implementing teachers and addressing challenges from the previous year of implementation. The initial sessions introduced the high-implementing teachers to the retooled RMEP model and laid out the framework for the next wave of implementation. In response to participating teachers’ concerns from Year 2 that the Khan Academy videos available for assignment through the MARi website did not cover competencies relevant to their math courses, the first PD sessions in Year 3 also covered improvements in the MARi platform to allow for more teacher choice. To encourage adherence, the team asked the high-implementing teachers to sign agreements that they would work with the math specialist on a monthly or semester basis to evaluate progress and discuss future online video assignments. In the Part II survey, teachers reported positive experiences with the PD (Appendix A-1). The majority of teachers agreed or strongly agreed that the PD helped them understand the MAS guide (77 percent) and how to use it in their instruction (79 percent). The majority of teachers also agreed or strongly agreed that they received sufficient implementation support after the PD through face-to-face follow-up (77 percent) and online or phone contact (80 percent).
In Year 3, the majority of the high-implementing teachers, with support from the RMEP team, registered half or more of their students and assigned at least 10 videos (often more). In the Part II teacher survey, 80 percent of teacher participants reported assigning math homework that required students to watch an online video at least once. The number of videos assigned as well as the percentage completed varied across schools and between teachers within the same schools. For example, one high school teacher assigned one video during the fall semester while another teacher at the same school assigned 32 videos (Exhibit 4). On average, Algebra II teachers assigned more videos than Geometry or Algebra I teachers, but there was still a wide range within math courses. For example, one Algebra II teacher assigned 4 videos to his/her classes while another Algebra II teacher assigned an average of 60 videos to each of his/her classes. The percentage of videos completed ranged from less than 2 percent to almost 95 percent among students. Seventy-five percent of surveyed teachers said that their students completed homework assignments that required watching an online video less often than other homework assignments. Overall, students in middle school teachers’ classes completed a larger percentage of the assigned videos than students at the high school level, with middles school classes completing an average of 48 percent of the videos assigned compared with 27 percent at the high school level.

Evaluation of the Rural Mathematics Excel Partnership Project: Final Report Page | 10
Exhibit 4. Teacher Assignments by LEA (MARi)a
Students Registered
(#) Videos Assignedb
(#)
Videos Completed
(%)
Assessments Assignedc
(#)
Assessments Completed
(%) LEA 2 170 74 44% 92 29% School 1 69 38 35% 56 22%
Teacher A 41 28 16% 46 16% Teacher B 28 10 53% 10 28%
School 10 101 36 53% 36 36% Teacher A 44 18 46% 16 45% Teacher B 57 18 61% 20 27%
LEA 3 38 24 38% 23 21% School 7 19 14 4% 15 3%
Teacher A 19 14 4% 15 3% School 11 19 10 72% 8 40%
Teacher A 19 10 72% 8 40% LEA 4 178 106 44% 90 24% School 2 66 81 70% 78 39%
Teacher A 20 32 57% 27 30% Teacher B 22 11 83% 11 36% Teacher C 24 38 70% 40 52%
School 4 112 25 18% 12 8% Teacher A 56 14 2% 3 2% Teacher B 56 11 33% 9 15%
LEA 7 456 175 62% 250 41% School 9 340 164 36% 175 20%
Teacher A 12 19 57% 12 26% Teacher B 5 1 40% 1 0% Teacher C 40 26 31% 18 19% Teacher D 62 32 17% 44 8% Teacher E 12 18 61% 6 47% Teacher F 71 24 19% 18 23% Teacher G 82 12 44% 18 23% Teacher H 34 32 20% 18 12%
School 12 116 11 88% 75 63% Teacher A 34 6 80% 26 67% Teacher B 82 5 95% 49 58%
LEA 8 115 252 9% 247 8% School 5 59 70 2% 148 13%
Teacher A 59 70 2% 148 13% School 13 56 182 16% 99 3%
Teacher A 56 182 16% 99 3% Teacher B 28 10 53% 10 28%
LEA 11 120 105 51% 36 10% School 8 120 106 51% 36 10%
Teacher A 69 66 37% 27 9% a Usage data were for the period of August 2015 to December 2015 b Total number of videos assigned across all of the teachers courses c Total number of assessments assigned across teachers’ courses d School 9 had seven high-implementing teachers; the additional teacher came from a co-taught course

Evaluation of the Rural Mathematics Excel Partnership Project: Final Report Page | 11
Although each of the PD indicators was not implemented during Year 1, the RMEP team and participants did adhere to the indicators in Year 2 and Year 3, allowing for overall fidelity adherence. In addition, positive participant evaluations of the PD sessions indicated that it was of high quality, indicating that the quality standard was met; however, participant responsiveness varied considerably with teachers assigning videos inconsistently, which may have been in part due to technology challenges. Research indicates that concentrated and intensive professional development, meaning PD that is offered over longer periods of time and includes many hours, in addition to sustained ongoing coaching often are the most effective (Joyce & Showers, 1988; McEwan & Loeb 2010). RMEP participating teachers engaged in 2 days of PD in the summer which likely was not enough to garner true buy-in or allow teachers to fully develop an understanding of all aspects of the RMEP Project. RMEP staff provided coaching during the school year, but additional PD throughout the year likely was needed to see changes in teachers’ practice and participation that aligned with the goals of the RMEP Project. In addition, the RMEP team only had one math expert to provide coaching in content to all participating teachers and a single technology expert to deal with the many technology issues, bringing into question the capacity of the team, at least in Years 1 and 2, to provide the level of support teachers needed. This conclusion is supported by the increased participant responsiveness observed in fall 2015 when the number of participating teachers decreased.
Family Math Nights (FMN). For the FMN to be implemented with fidelity, participating teachers had to plan the events and to hold at least one FMN each year for each school, though two a year was ideal. During Year 2 and Year 3, the RMEP staff worked with teachers of Algebra I, Geometry, Algebra II, and Algebra Functions and Data Analysis (AFDA) courses in each school division to plan and hold at least one FMN during the academic year for parents and students in their courses. These events were to be held early in the first and second semesters of the academic year. The events, organized and conducted by the participating math teachers in each LEA/school and supported by RMEP staff, were intended to introduce families to the RMEP Project and model of shared responsibility, explain the family role and responsibilities in the model, and help parents understand how to use the technology (e.g., checking Khan Academy video assignments, accessing RMEP website, tablet usage, etc.)
Participating teachers held nine FMNs during Year 2 (in fall 2014) and nine FMNs in Year 3 (three in early 2015 and six in fall 2015). Some schools chose to combine their FMNs. For example, two schools in one LEA (a middle and a high school) combined the event offered in fall 2015. The majority of the families who attended the FMNs across the 2 years reported that the events were worth attending and that the events helped with their understanding of STEM (Exhibits 5 and 6). In Year 2, 93 percent of students and 97 percent of parents reported that the event was worth attending. Similarly, 89 percent of students and 95 percent of parents said that the FMN helped them understand why STEM courses are important.
Exhibit 5. Year 2 Student and Parent Evaluation of the FMN Event
Survey Question
Students Agree and
Strongly Agreed
Parents Agree and
Strongly Agreed This event was worth attending 93% 97% Helped me understand how my parent/family’s role in helping me succeed in math
88% 97%
Helped me understand how to use the tablet 75% 68% Know where to get help if I have problems with the tablet 72% 74% Helped me understand why STEM courses are important 89% 95% Parents n=62 Students n=70

Evaluation of the Rural Mathematics Excel Partnership Project: Final Report Page | 12
Parent and student responses about the Year 3 FMNs mirrored the responses from Year 2. The same percentage of parents and students reported that the event was worth attending (97 percent and 93 percent respectively). A larger percentage of students (96 percent) reported that the event helped them understand why STEM courses are important; the percentage of parents remained the same (95 percent).
Exhibit 6. Year 3 Student and Parent Appreciation of the FMN Event
Survey Question
Students Agree and
Strongly Agree
Parents Agree and
Strongly Agree This event was worth attending 93% 97% Helped me understand how my parent/family’s/my role in helping me/my child succeed in math
95% 97%
Helped me understand how to use the tablet 92% 68% Know where to get help if I have problems with the tablet 90% 74% Helped me understand why STEM courses are important 96% 95% Parents n=154 Students n=154
Teachers at each school planned and held one, and often more than one, FMN in Year 2 and Year 3, indicating adherence and participant responsiveness for this component. Though family attendance was often low, their positive evaluations and reports of the overall value of the FMNs indicate that parents and students perceived them as quality events, thus meeting the quality standard. However, teachers indicated that they would like additional support with improving family attendance and the evaluators shared this information with the RMEP team.
Project Website. The expectation for the website component was that the RMEP Project would create a site to serve as a resource to teachers, students, and families. During Year 1, the RMEP team shared information and materials related to the RMEP Project through VASS’s website. By Year 2, the team created a standalone website that could also be accessed through a link on VASS’s homepage. SRI evaluators reviewed analytics for the website during Year 3 and found that there were visitors each month who viewed the website and related pages (Exhibit 7). Increases in page views coincided with times when the RMEP team or participants held events like FMNs or PD sessions. The SRI evaluators determined that the Project met the adherence, the quality, and responsiveness standards for this component.
Exhibit 7. Page Views per Month, Year 3 Month Page Views January 1,370 February 235 March 161 April 103 May 59 June 51 July 77 August 100 September 75 October 434 November 140 December 50 Total 2,855

Evaluation of the Rural Mathematics Excel Partnership Project: Final Report Page | 13
Community-based STEM Events. The RMEP team set out to have members of the five communities in the RMEP Project form a team that would plan and hold a STEM event each year. The RMEP co-director identified community leaders, most often, though not always, the Co-operative Extension Services (CES) 4-H youth development agents, to act as community liaisons. During Year 1, these CES 4-H agent youth development agents formed the community teams for the events and identified business, civic, and faith-based organizations that would be a part of the events. Some planning took place during Year 1, but the actual events did not occur until Year 2. There were three community-led events during Year 2 and two during Year 3 (Exhibit 8). Two community teams chose to hold their Year 3 events together, so although there were only 2 events, three communities had access to these events. One county community held its first community event in March 2016 after the completion of the evaluation.
Exhibit 8. Community STEM Events Held Community Site Name Year Event Held County 2 Year 2 County 7 Year 2 County 8 Year 2 Counties 2 and 8 Year 3 County 3 Year 3
The RMEP team identified community leaders for the STEM events in all five of the communities and more than half of these communities planned and held community STEM events in Year 2 and Year 3, indicating adherence for this component. Attendance at these events varied, often less well attended than the teams had hoped, suggesting less responsiveness from communities. The majority of the families that attended the events in both years provided positive feedback about their experiences, indicating that the quality of the events was high (Appendix A-4 and A-5). The community leaders balanced the planning for the events with other responsibilities from their careers and other obligations. The challenges that some teams faced in holding the events indicates that some of these leaders may not be the best individuals to plan and lead the events.
Technology Access. The RMEP team was expected to work with the school principal and district technology staff to ensure that all students and families had access to the necessary technology. This access included providing tablets and internet to families without existing access, allowing students to complete online videos through the MARi website. Implementing this component proved to be the most challenging for the RMEP team. Technology infrastructure in the communities was nascent, and managing the tablets and online use became a critical part of providing appropriate technology access to students and families. Technology access efforts were very slow to start in Year 1, and during Year 2 the RMEP team encountered numerous challenges. These challenges included identifying tablet technologies with sufficient capability to stream online videos, distributing tablets to students, identifying families with Internet needs and providing broadband access, and setting up families to use the MARi platform along with Khan Academy online videos. Similar challenges continued into early Year 3, but the team was able to address many of them by fall 2015 when the RMEP team decided to focus RMEP activities on high-implementing teachers during the 2015–16 school year.
By the end of Year 3, the RMEP Project team was able to provide all students in the classes of high-implementing teachers with a tablet and, if necessary, broadband Internet access to most individual families. The RMEP staff and high-implementing teachers also had consent forms prepared to distribute during schools’ open houses, when they would see the most parents, minimizing delays due to lack of parental permission to accept the tablet. While schools waited for the forms to be returned, the RMEP Project staff provided each high-implementing teacher with a classroom set of tablets. Although students were not able to take the tablets home, it allowed both the high-implementing teachers and
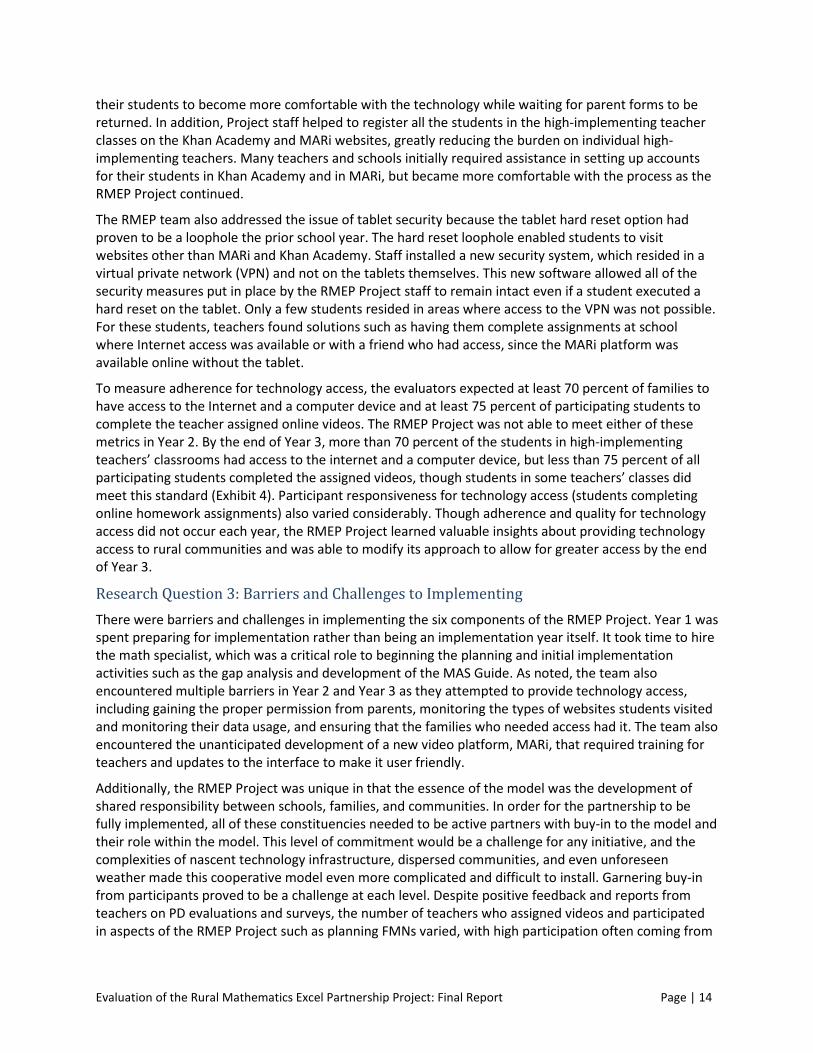
Evaluation of the Rural Mathematics Excel Partnership Project: Final Report Page | 14
their students to become more comfortable with the technology while waiting for parent forms to be returned. In addition, Project staff helped to register all the students in the high-implementing teacher classes on the Khan Academy and MARi websites, greatly reducing the burden on individual high-implementing teachers. Many teachers and schools initially required assistance in setting up accounts for their students in Khan Academy and in MARi, but became more comfortable with the process as the RMEP Project continued.
The RMEP team also addressed the issue of tablet security because the tablet hard reset option had proven to be a loophole the prior school year. The hard reset loophole enabled students to visit websites other than MARi and Khan Academy. Staff installed a new security system, which resided in a virtual private network (VPN) and not on the tablets themselves. This new software allowed all of the security measures put in place by the RMEP Project staff to remain intact even if a student executed a hard reset on the tablet. Only a few students resided in areas where access to the VPN was not possible. For these students, teachers found solutions such as having them complete assignments at school where Internet access was available or with a friend who had access, since the MARi platform was available online without the tablet.
To measure adherence for technology access, the evaluators expected at least 70 percent of families to have access to the Internet and a computer device and at least 75 percent of participating students to complete the teacher assigned online videos. The RMEP Project was not able to meet either of these metrics in Year 2. By the end of Year 3, more than 70 percent of the students in high-implementing teachers’ classrooms had access to the internet and a computer device, but less than 75 percent of all participating students completed the assigned videos, though students in some teachers’ classes did meet this standard (Exhibit 4). Participant responsiveness for technology access (students completing online homework assignments) also varied considerably. Though adherence and quality for technology access did not occur each year, the RMEP Project learned valuable insights about providing technology access to rural communities and was able to modify its approach to allow for greater access by the end of Year 3.
Research Question 3: Barriers and Challenges to Implementing There were barriers and challenges in implementing the six components of the RMEP Project. Year 1 was spent preparing for implementation rather than being an implementation year itself. It took time to hire the math specialist, which was a critical role to beginning the planning and initial implementation activities such as the gap analysis and development of the MAS Guide. As noted, the team also encountered multiple barriers in Year 2 and Year 3 as they attempted to provide technology access, including gaining the proper permission from parents, monitoring the types of websites students visited and monitoring their data usage, and ensuring that the families who needed access had it. The team also encountered the unanticipated development of a new video platform, MARi, that required training for teachers and updates to the interface to make it user friendly.
Additionally, the RMEP Project was unique in that the essence of the model was the development of shared responsibility between schools, families, and communities. In order for the partnership to be fully implemented, all of these constituencies needed to be active partners with buy-in to the model and their role within the model. This level of commitment would be a challenge for any initiative, and the complexities of nascent technology infrastructure, dispersed communities, and even unforeseen weather made this cooperative model even more complicated and difficult to install. Garnering buy-in from participants proved to be a challenge at each level. Despite positive feedback and reports from teachers on PD evaluations and surveys, the number of teachers who assigned videos and participated in aspects of the RMEP Project such as planning FMNs varied, with high participation often coming from
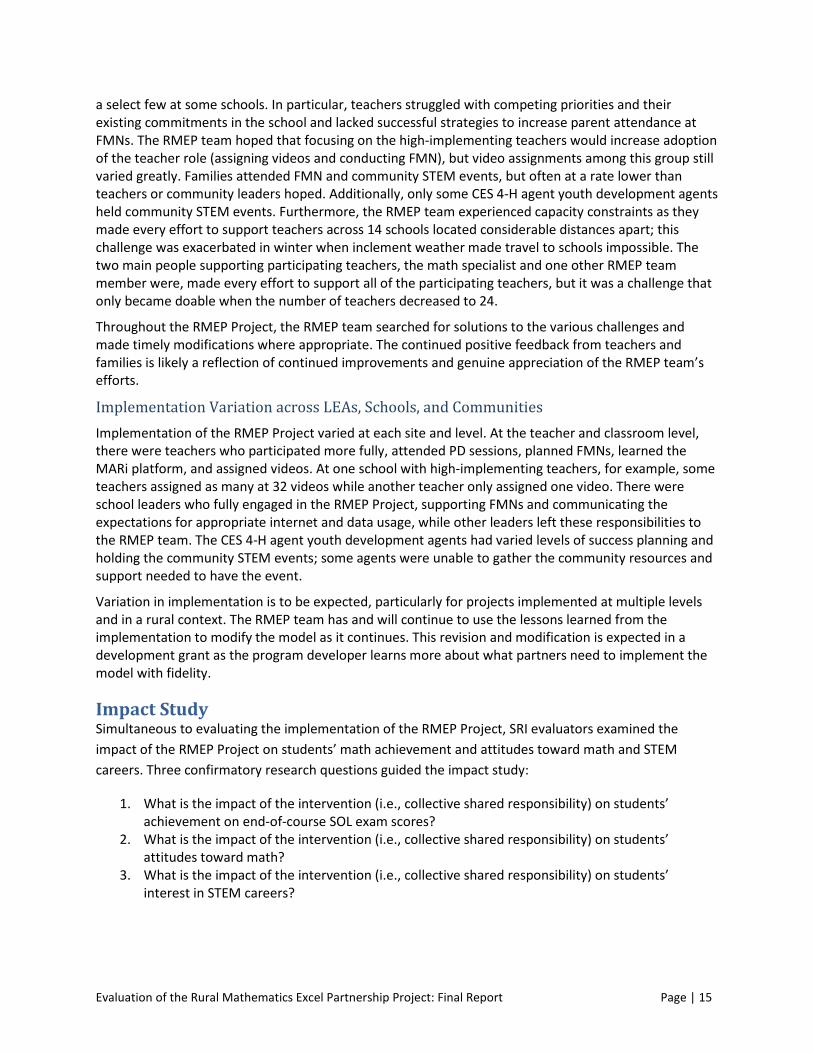
Evaluation of the Rural Mathematics Excel Partnership Project: Final Report Page | 15
a select few at some schools. In particular, teachers struggled with competing priorities and their existing commitments in the school and lacked successful strategies to increase parent attendance at FMNs. The RMEP team hoped that focusing on the high-implementing teachers would increase adoption of the teacher role (assigning videos and conducting FMN), but video assignments among this group still varied greatly. Families attended FMN and community STEM events, but often at a rate lower than teachers or community leaders hoped. Additionally, only some CES 4-H agent youth development agents held community STEM events. Furthermore, the RMEP team experienced capacity constraints as they made every effort to support teachers across 14 schools located considerable distances apart; this challenge was exacerbated in winter when inclement weather made travel to schools impossible. The two main people supporting participating teachers, the math specialist and one other RMEP team member were, made every effort to support all of the participating teachers, but it was a challenge that only became doable when the number of teachers decreased to 24.
Throughout the RMEP Project, the RMEP team searched for solutions to the various challenges and made timely modifications where appropriate. The continued positive feedback from teachers and families is likely a reflection of continued improvements and genuine appreciation of the RMEP team’s efforts.
Implementation Variation across LEAs, Schools, and Communities Implementation of the RMEP Project varied at each site and level. At the teacher and classroom level, there were teachers who participated more fully, attended PD sessions, planned FMNs, learned the MARi platform, and assigned videos. At one school with high-implementing teachers, for example, some teachers assigned as many at 32 videos while another teacher only assigned one video. There were school leaders who fully engaged in the RMEP Project, supporting FMNs and communicating the expectations for appropriate internet and data usage, while other leaders left these responsibilities to the RMEP team. The CES 4-H agent youth development agents had varied levels of success planning and holding the community STEM events; some agents were unable to gather the community resources and support needed to have the event.
Variation in implementation is to be expected, particularly for projects implemented at multiple levels and in a rural context. The RMEP team has and will continue to use the lessons learned from the implementation to modify the model as it continues. This revision and modification is expected in a development grant as the program developer learns more about what partners need to implement the model with fidelity.
Impact Study Simultaneous to evaluating the implementation of the RMEP Project, SRI evaluators examined the impact of the RMEP Project on students’ math achievement and attitudes toward math and STEM careers. Three confirmatory research questions guided the impact study:
1. What is the impact of the intervention (i.e., collective shared responsibility) on students’ achievement on end-of-course SOL exam scores?
2. What is the impact of the intervention (i.e., collective shared responsibility) on students’ attitudes toward math?
3. What is the impact of the intervention (i.e., collective shared responsibility) on students’ interest in STEM careers?

Evaluation of the Rural Mathematics Excel Partnership Project: Final Report Page | 16
Study Design Due to the delay in the full implementation of the RMEP Project’s activities, the evaluation team revised the design of the impact study in collaboration with VASS and consultation with the NEi3 TA team. The original design of the study was based on a 2-year implementation plan occurring in the 2013–14 and 2014–15 academic years. Considering that the implementation of the RMEP Project began in the 2014–15 school year and continued into the first semester of the 2015–16 school year, SRI proposed extending its evaluation activities through spring 2016. SRI submitted these changes to the NEi3 program analysis and reporting team and received a memo in November 2015 indicating that the proposed changes did not alter the existing rating of the proposed evaluation plan.
This study used two designs to measure impact. First, for the study of student achievement, SRI researchers used a quasi-experimental pre/post comparison group design, at the student level. They examined the impact of the intervention on students’ end-of-course (EOC) Standards of Learning (SOL) exam scores in treatment districts and compared that to the change in the SOL scores of students in comparison districts.
Second, for the study of student attitudes and STEM interest, SRI evaluators used a quasi-experimental pre/post design with no comparison group to examine the impact of the intervention on student attitudes toward math and interest in STEM careers. The researchers examined changes in the treatment group from before the intervention to the end of Year 3 in December 2015. The evaluators did not use the comparison group for this design because the students in comparison schools did not take the survey.
Sample As noted, the RMEP team recruited six rural LEAs in southern Virginia to participate in the intervention. These LEAs were representative of the rural Virginia areas that VASS identified as lacking a workforce qualified for advanced STEM courses and careers. The intervention was districtwide, and all schools in the LEA offering Algebra I, Geometry, and/or Algebra II were included in the treatment (Exhibit 9). Five of the six treatment LEAs had a single middle school and a single high school. One LEA had two middle schools and two high schools. The total number of schools in the treatment group was 14. The evaluators included all students who were enrolled in block-scheduled Algebra I, Geometry, or Algebra II classes in the first semester of the 2015–16 school year, regardless of grade level, in the analysis.
SRI researchers selected an additional six rural county school LEAs in southern Virginia for a matched comparison group, based on their similarity in terms of geography, demographics, and prior academic achievement. Five of these LEAs had a single middle school and a single high school, while one had two middle schools and two high schools. The total number of schools in the comparison group was 14. Again, the evaluators included all students who were enrolled in block-scheduled Algebra I, Geometry, or Algebra II classes in the first semester of the 2015–16 school year, regardless of grade level, in the analysis.
The treatment LEAs were chosen based on existing relationships that the RMEP Project leader had established as an educator and member of this rural area of southern Virginia (i.e., the districts constituted a convenience sample). For the matched comparison group, the SRI evaluators first looked to the 33 other LEAs in Virginia that were eligible for the Rural Low-Income Schools (RLIS) program.6
6 LEAs are eligible for the rural low-income program if (1) 20 percent or more of the children ages 5 through 17 years served by the LEA are from families with incomes below the poverty line and (2) all of the schools served by the LEA are designated with a rural locale code of 6, 7, or 8 (Source: http://www2.ed.gov/programs/reaprlisp/eligibility.html).

Evaluation of the Rural Mathematics Excel Partnership Project: Final Report Page | 17
Within this rural, low-income group, the evaluators targeted those that were similar to the participating LEAs in terms of geography, demographics, size, and prior achievement.
SRI researchers used a hybrid approach to identify the six comparison LEAs. In the first step of the hybrid approach, the researchers fit a logistic regression model that predicts exposure to the RMEP intervention. This model produced a propensity score for each LEA summarizing its pre-intervention covariates (poverty level, enrollment size, demographic composition, and prior math achievement) so evaluators could identify comparison districts with propensity scores similar to the RMEP LEAs.7 Each of these variables was included to produce equivalence between RMEP LEAs and the comparison LEAs. The RMEP LEAs were very similar to the other Rural Low Income LEAs even before matching (Exhibit 10). The only statistically significant differences were in the percent black and percent white. The model tended to favor enrollment size over demographics or achievement in selecting comparison districts. However, differences in enrollment size were not statistically significant.
Exhibit 9. Characteristics Used for Propensity Score Matching at the LEA Level
RMEP Participants (N = 6) All other Rural, Low-Income LEAs (N = 33)
Mean Standard Deviation Mean
Standard Deviation
2012–13 Percentage of children from families below poverty line a 25.3 4.2 24.3 3.3 Total Enrollment b 3637.8 2416.3 2675.9 1645.8 Percent Black b 42.9* 14.0 27.0* 25.1 Percent Hispanic b 4.8 3.4 4.8 5.3 Percent White b 49.3* 12.0 65.2* 26.6 Percent Male b 51.1 .6 51.6 1.1 Percent Free or Reduced-Price Lunch b 61.2 5.4 59.3 9.8 Percent English Language Learners b 2.1 2.1 2.4 3.5 Percent Individualized Educational Plan b 14.0 3.0 14.1 2.6 a 2012–13 school year from U.S. Department of Education Rural and Low-Income School Program (http://www2.ed.gov/programs/reaprlisp/eligibility.html). b 2010–11 school year from National Center for Education Statistics Common Core of Data, all grades (http://nces.ed.gov/ccd/index.asp). * p < .05
SRI researchers took an additional step in the matching process because of the small number of observations, the similarity between treatment and potential comparisons before matching, and the tendency of the model to favor variables that were not statistically significant. Therefore, the evaluators visually inspected the list of possible comparison LEAs and selected six based on their similarity to the treatment LEAs in terms of demographics, achievement, and geographic location. All but one of these LEAs had propensity scores at least as high as the treatment LEAs, and all offered a close match to the six RMEP LEAs in terms of size, racial composition, and prior math achievement, as shown in Exhibit 10. None of the differences between treatment and comparison LEAs was statistically significant after matching.
7 Two variables were included for prior math achievement: the average 2011 and 2012 Algebra I End of Course (EOC) scale scores. Both 2011 and 2012 were included as independent predictors because the test was changed between these 2 years to reflect changes in standards. While students took end-of-course exams in Algebra I, Algebra II, and Geometry, the same pattern was found for all three tests, so only Algebra I was used, thereby reducing the number of predictors. A smaller number of predictors was preferable because the model was already underpowered, with only 33 LEAs in the comparison pool.

Evaluation of the Rural Mathematics Excel Partnership Project: Final Report Page | 18
Exhibit 10. Demographics of Treatment and Comparison LEAs
Variable
RMEP Participants (N = 6) Charlotte, Cumberland,
Halifax, Henry, Martinsville, Prince Edward
Matched Comparisons (N = 6) Buckingham, Mecklenburg,
Nottoway, Lunenburg, Greensville, Brunswick
Mean Standard Deviation Mean
Standard Deviation
Total Enrollment Size 3637.8 2416.3 2601.7 1136.8 Percent Black 42.9 14.0 52.1 18.1 Percent White 49.3 12.0 41.1 15.4 Percent in Poverty 25.3 4.2 24.1 1.6 2011 Algebra I EOC Scale Score 469.0 16.1 461.9 12.6 2012 Algebra I EOC Scale Score 414.4 8.4 408.6 9.1
Within these 12 LEAs, the impact study used two different samples of students. For the impact of the intervention on students’ SOL scores, the evaluators examined all students who took an SOL exam in the focal courses in treatment and comparison schools in December 2015. These students were enrolled in block-scheduled eighth-grade math, Algebra I, Geometry, or Algebra II courses in fall 2015. Block-scheduled classes cover the full school year of material in one semester, and the December SOL tests all of this material. Although in the 2015–16 school year the intervention was targeted toward a subset of highly-implementing teachers, the Virginia student achievement data could not be linked to individual teachers. Therefore, this analysis does not examine only the students with high-implementing teachers, but rather includes all students in the study schools and focal courses during this semester. SRI researchers did not examine the SOL outcomes at the end of the 2014–15 school year because the implementation of the program was not sufficiently strong during that year.
For the impact of the intervention on students’ attitudes toward math and interest in STEM careers, the evaluators examined only those students who were in highly-implementing teachers’ classrooms.
Instruments Student achievement was measured using the following Virginia SOL assessments: eighth-grade math, Algebra I, Geometry, and Algebra II courses. These assessments were administered statewide. The evaluators standardized the scores to the mean and standard deviation of all students in the study schools. Therefore, the scores used in this analysis had a mean of zero and a standard deviation of one.
SRI researchers assessed student attitudes toward math and interest in STEM careers using students’ responses to survey items on these concepts. These items were Likert scaled and combined using a weighted average approach. Copies of the student surveys are included in Appendix A-12 and Appendix A-13. The properties of each scale were investigated using factor analysis to ensure that they functioned together as a scale. After this analysis, items were combined into a single variable by taking the average of the non-missing responses. The evaluators used average rather than a factor variable so that they could examine change between the pre-test and the post-test measure on an absolute, rather than a relative, scale. The survey items that were used for each variable are in Appendix A-4.

Evaluation of the Rural Mathematics Excel Partnership Project: Final Report Page | 19
Data and Methods SRI evaluators conducted analyses at the student level to investigate how the intervention affects student outcomes in the treatment and comparison LEAs. They posited regression models with (1) SOL EOC exam scores, (2) student attitudes toward math, and (3) student interest in STEM careers as outcome variables.
For the first research question, the evaluators used multi-level regression models with three levels: students, schools, and LEAs, as shown in Equation 1:
Equation 1: Three-level Model to Estimate Research Question 1 Level 1: Students
𝐴𝐴𝐴𝐴ℎ𝑖𝑖𝑖𝑖𝑖𝑖𝑖𝑖𝑖𝑖𝑖𝑖𝑖𝑖𝑡𝑡𝑖𝑖𝑖𝑖𝑖𝑖 = 𝛽𝛽0𝑖𝑖𝑖𝑖 + 𝛽𝛽1𝑖𝑖𝑖𝑖𝑃𝑃𝑃𝑃𝑖𝑖𝑃𝑃𝑃𝑃𝑃𝑃𝑃𝑃𝐿𝐿𝑖𝑖𝑖𝑖𝑖𝑖 + 𝛽𝛽2𝑖𝑖𝑖𝑖𝐷𝐷𝑖𝑖𝑖𝑖𝑃𝑃𝐷𝐷𝑃𝑃𝐷𝐷𝐷𝐷ℎ𝑖𝑖𝐴𝐴𝑠𝑠𝑖𝑖𝑖𝑖𝑖𝑖 + 𝑖𝑖𝑖𝑖𝑖𝑖𝑖𝑖
Level 2: Schools
𝛽𝛽0𝑖𝑖𝑖𝑖 = 𝛾𝛾00𝑖𝑖 + 𝑢𝑢𝑖𝑖𝑖𝑖
Level 3: District
𝛾𝛾00𝑖𝑖 = 𝛿𝛿000 + 𝛿𝛿100𝑇𝑇𝑃𝑃𝑖𝑖𝐷𝐷𝑡𝑡𝑖𝑖𝑖𝑖𝑖𝑖𝑡𝑡𝑖𝑖 + 𝛿𝛿200𝐷𝐷𝑖𝑖𝑖𝑖𝑃𝑃𝐷𝐷𝑃𝑃𝐷𝐷𝐷𝐷ℎ𝑖𝑖𝐴𝐴𝑠𝑠𝑖𝑖 + 𝑃𝑃𝑖𝑖
In this model, the outcome was the achievement of student i with school j in LEA k. Student prior SOL score and demographic variables (student race, IEP, limited English proficiency [LEP] status, gender, and eligibility for free or reduced-price lunch [FRPL] from the prior year) were included at level 1. The eijk term represents a student-specific error term. The school level included only an intercept and a school-level error term. The district or LEA level included an intercept and a district-level error term, as well as the treatment indicator and LEA demographics (percent African American, percent white, percent FRPL, percent passing the Algebra I SOL in 2012, and the percent passing the Algebra I SOL in 2013). The impact of the intervention on student SOL scores was estimated as the coefficient 𝛿𝛿100, on the treatment indicator.
For the second research question, SRI researchers estimated a multi-level regression model to examine how attitudes toward math change within a student between fall 2015 (before the intervention) and winter 2015 (after the intervention), as shown in Equation 2:
Equation 2: Two-level Model to Estimate Research Question 2 Level 1: Students
𝐴𝐴𝑡𝑡𝑡𝑡𝑖𝑖𝑡𝑡𝑢𝑢𝐴𝐴𝑖𝑖𝑠𝑠𝑖𝑖𝑖𝑖𝑖𝑖 = 𝛽𝛽0𝑖𝑖𝑖𝑖+ 𝛽𝛽1𝑖𝑖𝑖𝑖𝑇𝑇𝑃𝑃𝑖𝑖𝐷𝐷𝑡𝑡𝑖𝑖𝑖𝑖𝑖𝑖𝑡𝑡 + 𝛽𝛽2𝑖𝑖𝑖𝑖𝐸𝐸𝐸𝐸𝐷𝐷𝑃𝑃𝑠𝑠𝑢𝑢𝑃𝑃𝑖𝑖𝑖𝑖𝑖𝑖𝑖𝑖 + 𝑖𝑖𝑖𝑖𝑖𝑖𝑖𝑖
Level 2: Schools
𝛽𝛽0𝑖𝑖𝑖𝑖 = 𝛾𝛾00 + 𝛾𝛾1𝑖𝑖 + 𝑢𝑢𝑖𝑖
In this analysis, the outcome was the attitudes of student i with teacher j in school k. At the first level, this outcome was modeled as a function of an intercept, the treatment indicator, student’s level of exposure to the intervention, and a student-level error term. In this model, the evaluators adjusted for the length of time that the student received the intervention at the time of the survey completion, which allowed for the estimation of the treatment effect on students with the same levels of exposure.

Evaluation of the Rural Mathematics Excel Partnership Project: Final Report Page | 20
Level 2 included an intercept, a district control, and a school-level error term. This analysis did not have a comparison group. Therefore, the coefficient 𝛽𝛽1𝑖𝑖𝑖𝑖 estimated the impact of the intervention on student attitudes toward math. The third research question used the same form, with the odds of a student being interested in STEM careers as the outcome.
SRI researchers did not impute missing data. The evaluators estimated all effects on the analysis sample: those who are not missing data on pre- and post-test measures. Cases with missing data were dropped using listwise deletion.
Impact Study Findings In this section, the researchers report the findings from the 3-year impact study, framed by the guiding research questions.
Research Question 1: Impact of the Intervention on Student Achievement Baseline Equivalence. The impact study used a quasi-experimental design—schools, teachers, and students were not randomly assigned to the treatment and comparison conditions. Therefore, the evaluators needed to establish baseline equivalence between the groups before examining the relationship between the intervention and student achievement outcomes. In other words, SRI evaluators had to show that students in treatment and comparison schools were sufficiently similar before the intervention. To achieve baseline equivalence, the difference between treatment and comparison students before the intervention must be under 0.05 standard deviations, or under 0.25 standard deviations if prior achievement is included in the model. As shown in Exhibit 11, the researchers achieved baseline equivalence in the overall model and in the model using only Algebra I SOL scores when prior achievement was included in the model. Although students in comparison schools scored 0.16 standard deviations higher than students in treatment schools across all SOL exams, this difference was under the threshold of 0.25 standard deviations. However, the students in comparison schools scored more than 0.25 standard deviations higher than students in treatment schools on their prior SOLs for the Algebra II and Geometry outcomes. In other words, comparison students who were tested on the Algebra II SOL in December 2015 had substantially higher Geometry scores in the prior year than treatment students. Likewise, comparison students who were tested on the Geometry SOL in December 2015 had substantially higher Algebra I scores in the prior year than treatment students. The size of this difference could not be overcome by including prior achievement in the model. Therefore, SRI evaluators examined the relationship between the intervention and Algebra I SOL scores and the relationship between the intervention and all math SOL exams combined, but they did not examine the Algebra II or Geometry outcomes independently.

Evaluation of the Rural Mathematics Excel Partnership Project: Final Report Page | 21
Exhibit 11. Difference in SOL Scores of Treatment and Comparison Students Before the Intervention, in Standard Deviation Units
Treatment Comparison Difference All exams combined n = 1,793 -0.06 0.10 0.16
Algebra I SOL1
n = 728 -0.41 -0.54 -0.13
Geometry SOL n = 663 -0.01 0.31 0.32
Algebra II SOL n = 400 0.55 0.82 0.27
1 The test used for baseline equivalence varied by outcome and by student. For the Algebra I outcome, students’ baseline scores were most commonly on the eighth-grade math SOL or on the same exam in the prior year. For Geometry, the baseline scores were most commonly on the Algebra I exam, and for Algebra II, the baseline scores were most commonly in Geometry. NOTE: The scores shown here are standardized scores. The mean of all students in the sample is zero and the standard deviation is one. Therefore, a negative score indicates that the group scored below the average for the sample and a positive score indicates that the group scored above average for the sample. EXHIBIT READS: Treatment students scored 0.06 standard deviations below average for all students in study schools when all SOL exams are combined.
Outcome. As shown in Exhibit 12, the evaluators did not detect a statistically significant relationship between the intervention and students’ achievement on December SOL exams either overall or in Algebra I. Appendix A-5 displays the full model for each outcome.
Exhibit 12. Difference in SOL Scores of Treatment and Comparison Students After the Intervention, in Standard Deviation Units
N Difference Students Schools LEAs
All Exams Combined -0.09 1,742 19 12 Algebra I Only -0.19 727 19 12
Research Question 2 and 3: Impact of the Intervention on Students’ Attitudes toward Mathematics and Interest in STEM Careers Similar to the student achievement outcomes, the analysis did not indicate that the RMEP had an impact on student attitudes toward math or their interest in STEM careers as shown in Exhibits 13 and 14. The full models for each outcome are displayed in Appendix A-6 and A-7.
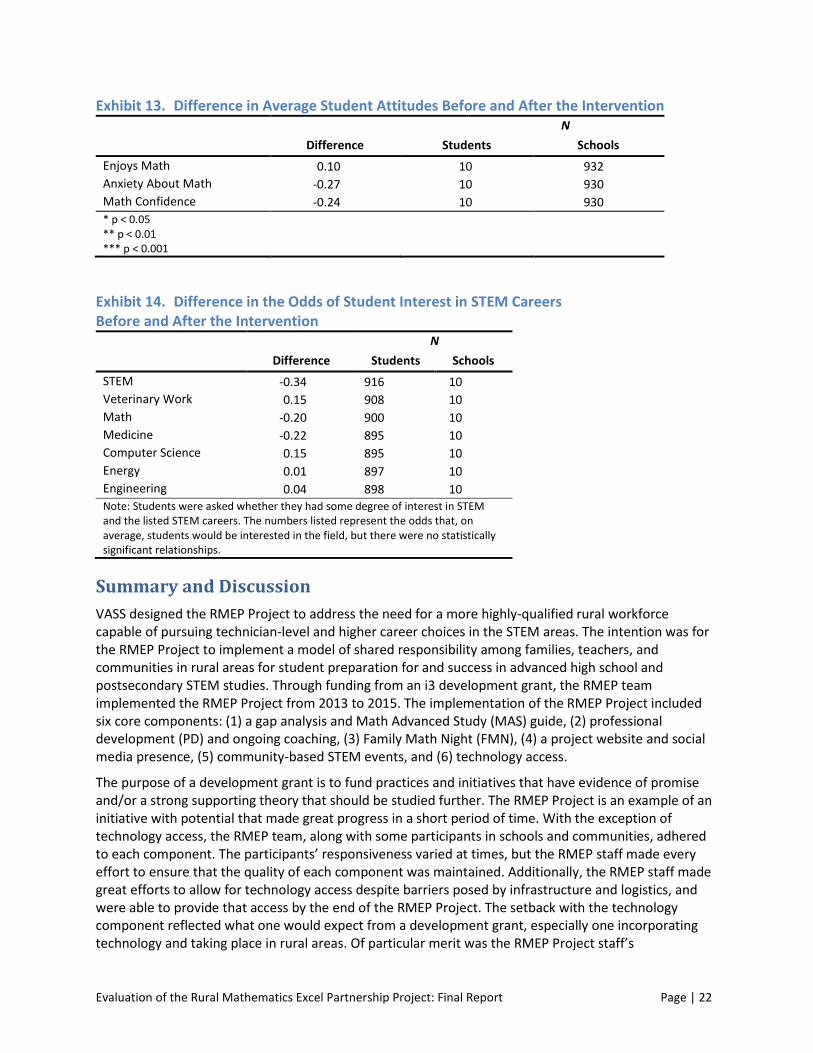
Evaluation of the Rural Mathematics Excel Partnership Project: Final Report Page | 22
Exhibit 13. Difference in Average Student Attitudes Before and After the Intervention N Difference Students Schools
Enjoys Math 0.10 10 932 Anxiety About Math -0.27 10 930 Math Confidence -0.24 10 930 * p < 0.05 ** p < 0.01 *** p < 0.001
Exhibit 14. Difference in the Odds of Student Interest in STEM Careers Before and After the Intervention
N Difference Students Schools
STEM -0.34 916 10 Veterinary Work 0.15 908 10 Math -0.20 900 10 Medicine -0.22 895 10 Computer Science 0.15 895 10 Energy 0.01 897 10 Engineering 0.04 898 10 Note: Students were asked whether they had some degree of interest in STEM and the listed STEM careers. The numbers listed represent the odds that, on average, students would be interested in the field, but there were no statistically significant relationships.
Summary and Discussion VASS designed the RMEP Project to address the need for a more highly-qualified rural workforce capable of pursuing technician-level and higher career choices in the STEM areas. The intention was for the RMEP Project to implement a model of shared responsibility among families, teachers, and communities in rural areas for student preparation for and success in advanced high school and postsecondary STEM studies. Through funding from an i3 development grant, the RMEP team implemented the RMEP Project from 2013 to 2015. The implementation of the RMEP Project included six core components: (1) a gap analysis and Math Advanced Study (MAS) guide, (2) professional development (PD) and ongoing coaching, (3) Family Math Night (FMN), (4) a project website and social media presence, (5) community-based STEM events, and (6) technology access.
The purpose of a development grant is to fund practices and initiatives that have evidence of promise and/or a strong supporting theory that should be studied further. The RMEP Project is an example of an initiative with potential that made great progress in a short period of time. With the exception of technology access, the RMEP team, along with some participants in schools and communities, adhered to each component. The participants’ responsiveness varied at times, but the RMEP staff made every effort to ensure that the quality of each component was maintained. Additionally, the RMEP staff made great efforts to allow for technology access despite barriers posed by infrastructure and logistics, and were able to provide that access by the end of the RMEP Project. The setback with the technology component reflected what one would expect from a development grant, especially one incorporating technology and taking place in rural areas. Of particular merit was the RMEP Project staff’s

Evaluation of the Rural Mathematics Excel Partnership Project: Final Report Page | 23
responsiveness to formative evaluation findings. SRI evaluators provided a series of technical memos following PD sessions, FMNs, and Community-based STEM events. Each memo included a set of recommendations to improve program implementation and, in each instance, the RMEP team made revisions to implementation based on these findings. By the end of the RMEP Project, the model of shared responsibility and how to implement it in authentic environments was understood with greater clarity.
The analysis of the relationship between the RMEP intervention and student math achievement, attitudes towards math, and interest in STEM did not yield statistically significant results. However, there are several reasons that the SRI evaluators may not have been able to detect an effect, even where one may have existed. First, the SOL exams were not well aligned with the intervention and thus not necessarily a strong measure of its effectiveness. In fact, one focus of the intervention was to fill in gaps of material not covered by the SOLs, but needed in the STEM workplace. Though one may expect to see an overall improvement in math achievement, the size of that effect may be small given the lack of alignment. Additionally, the evaluators were not able to narrow the achievement sample to only those students whose teachers (the high-implementing teachers) were implementing the intervention in the 2015–16 school year. Therefore, any effect may have been diluted by the inclusion of students who did not have access to the intervention because their teachers were not participating in the RMEP Project in fall 2015. The short time period covered by this analysis also may have masked potential impact on achievement and student attitudes, especially since the RMEP Project was not fully implemented in the classroom until fall 2015. One additional limitation is that the size of the sample may be inadequate to detect a very small effect for any of the outcomes. All of these factors may have limited the ability to detect the impact of the RMEP Project.
Though the RMEP Project faced challenges, the RMEP team was able to implement the majority of core components of the model with fidelity by the end of the evaluations. Participant responsiveness, one of the dimensions of fidelity, was not consistent across multiple components and hindered buy-in, though it was improving toward the end of the evaluation. It is possible that the model of shared responsibility model for supporting student excellence in math (i.e., innovation) has the potential to be a promising practice and is worthy of further efficacy testing. Unfortunately, the components of the model of shared responsibility were not fully implemented with fidelity until fall 2015, and this was an insufficient amount of time for the intervention to have a significant impact on the targeted outcomes. A longer intervention period may yield a different result. Nevertheless, the RMEP Project can serve as an illustrative example for other such initiatives, and suggests that similar projects should consider level of participant buy-in, anticipate and be able to troubleshoot technology access issues, and provide enough time as well as staff support for full implementation.

Evaluation of the Rural Mathematics Excel Partnership Project: Final Report Page | 24
References Horner, R., Blitz, C., & Ross, S. (2014). The importance of contextual fit when implementing evidence-
based interventions. ASPE Issue Brief, Office of the Assistant Secretary for Planning and Evaluation, Office of Human Services Policy, United States Department of Health and Human Services. Retrieved at http://aspe.hhs.gov/hsp/14/IWW/ib_Contextual.pdf
Joyce, B. & Showers, B. (1988). Student achievement through staff development. New York: Longman.
Lee, J. (2012). College for all: Gaps between desirable and actual p-12 math achievement trajectories for college readiness. Educational Researcher, 41(2), 43-55.
McEwan, P., & Loeb, S. (2010). Education reforms. In P. Levine & D. Zimmerman (Eds.), Targeting Investments in Children: Fighting Poverty When Resources are Limited. National Bureau of Economic Research (pp. 145-180).
Shaver, D., Wagner, M., Nagle, K. & Ryan, T. (2015). Improving implementation of programs and practices for children with disabilities. Lessons learned from the Model Demonstration Coordination Center. Menlo Park, CA: SRI International.

Evaluation of the Rural Mathematics Excel Partnership Project: Final Report A p p e n d i x P a g e | A-1
Appendix A.
Additional Tables and Resources
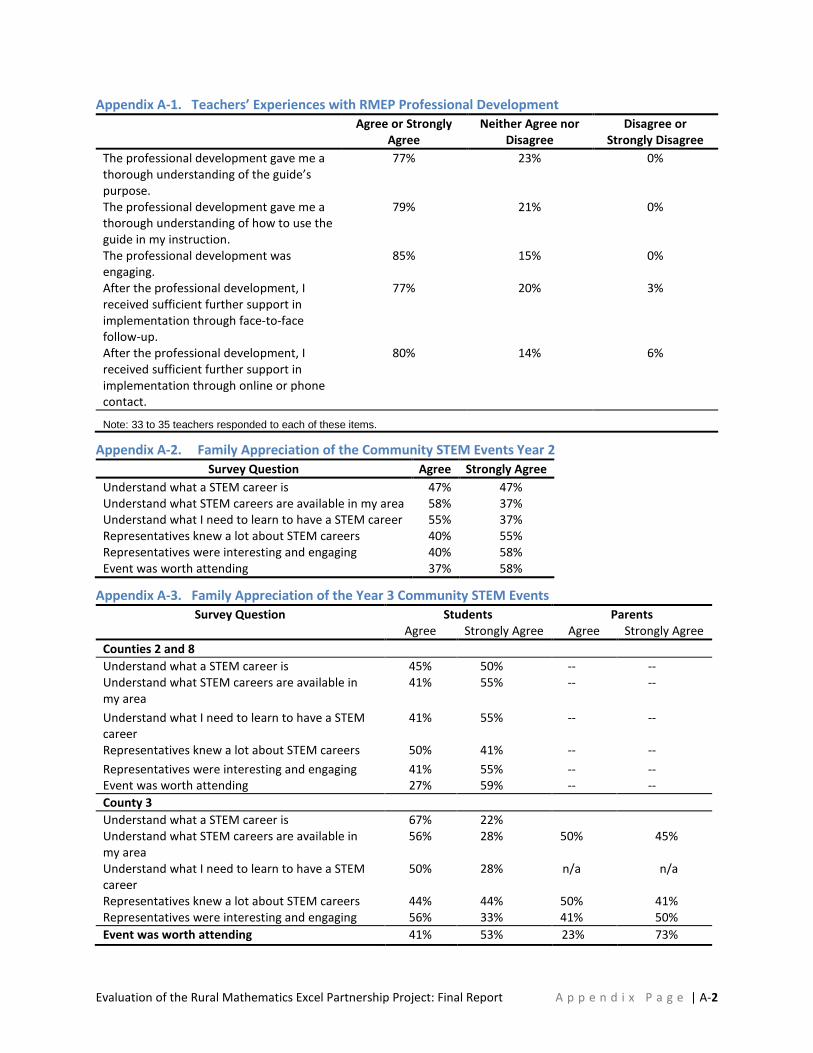
Evaluation of the Rural Mathematics Excel Partnership Project: Final Report A p p e n d i x P a g e | A-2
Appendix A-1. Teachers’ Experiences with RMEP Professional Development
Agree or Strongly
Agree Neither Agree nor
Disagree Disagree or
Strongly Disagree The professional development gave me a thorough understanding of the guide’s purpose.
77% 23% 0%
The professional development gave me a thorough understanding of how to use the guide in my instruction.
79% 21% 0%
The professional development was engaging.
85% 15% 0%
After the professional development, I received sufficient further support in implementation through face-to-face follow-up.
77% 20% 3%
After the professional development, I received sufficient further support in implementation through online or phone contact.
80% 14% 6%
Note: 33 to 35 teachers responded to each of these items.
Appendix A-2. Family Appreciation of the Community STEM Events Year 2 Survey Question Agree Strongly Agree
Understand what a STEM career is 47% 47% Understand what STEM careers are available in my area 58% 37% Understand what I need to learn to have a STEM career 55% 37% Representatives knew a lot about STEM careers 40% 55% Representatives were interesting and engaging 40% 58% Event was worth attending 37% 58%
Appendix A-3. Family Appreciation of the Year 3 Community STEM Events Survey Question Students Parents
Agree Strongly Agree Agree Strongly Agree Counties 2 and 8 Understand what a STEM career is 45% 50% -- -- Understand what STEM careers are available in my area
41% 55% -- --
Understand what I need to learn to have a STEM career
41% 55% -- --
Representatives knew a lot about STEM careers 50% 41% -- -- Representatives were interesting and engaging 41% 55% -- -- Event was worth attending 27% 59% -- -- County 3 Understand what a STEM career is 67% 22% Understand what STEM careers are available in my area
56% 28% 50% 45%
Understand what I need to learn to have a STEM career
50% 28% n/a n/a
Representatives knew a lot about STEM careers 44% 44% 50% 41% Representatives were interesting and engaging 56% 33% 41% 50% Event was worth attending 41% 53% 23% 73%

Evaluation of the Rural Mathematics Excel Partnership Project: Final Report A p p e n d i x P a g e | A-3
Appendix A-4. Survey Items Used for Each Math Attitude Enjoys Math Anxiety about Math Math Confidence
I enjoy learning math. I often worry that it will be difficult for me in math classes.
I often worry that it will be difficult for me in math classes.
Math is boring. I get tense when I have to do math homework.
I get tense when I have to do math homework.
I like to solve new problems in math.
I get nervous when doing math problems.
I get nervous when doing math problems.
I do math because I enjoy it. I feel helpless when doing a math problem.
I feel helpless when doing a math problem.
I am interested in the things I learn in math class.
I worry that I will get poor grades in math.
I worry that I will get poor grades in math.
I do not like math. I feel unsure of myself when doing math.
I feel unsure of myself when doing math.
Math is one of my best subjects. I am just not good at math. I look forward to my math class.
Appendix A-5. Relationship Between RMEP and Students’ SOL Scores in December 2015 All Exams Combined Algebra I
Treatment indicator -0.09 0.09 -0.19 0.11 Standardized math score 2014 0.43*** 0.02 0.50*** 0.04 Student demographics
Student female 0.10** 0.04 0.15** 0.06 Student grade level -0.25*** 0.02 -0.12*** 0.03 Student limited English 0.07 0.18 -0.03 0.21 Student race White 0.15*** 0.04 0.01 0.06 Student free or reduced-price lunch -0.08* 0.04 -0.16* 0.06
LEA demographics LEA % African-American 0.03* 0.01 0.03 0.01 LEA % White 0.06** 0.02 0.06** 0.02 LEA % FRPL 0.03* 0.01 0.05*** 0.01 LEA % passed Algebra SOL in 2012 0.01* 0.01 0.01 0.01 LEA % passed Algebra SOL in 2013 -0.01* 0.01 -0.03*** 0.01
Constant 0.07 0.06 0.40*** 0.08 Random Effects LEA <0.01 <0.01 0.09 0.06 School 0.13 0.03 <0.01 <0.01 Student 0.28 0.14 .60 0.16 N LEAs 12 12 Schools 19 19 Students 1,742 727 * p < 0.05 ** p < 0.01 *** p < 0.001

Evaluation of the Rural Mathematics Excel Partnership Project: Final Report A p p e n d i x P a g e | A-4
Appendix A-6. Impact of RMEP on Student Attitudes Towards Math Enjoys math Anxiety about Math Math Confidence Coefficient SE Coefficient SE Coefficient SE
Treatment 0.10 0.23 -0.27 0.21 -0.24 0.22 Exposure <-0.01 <-0.01 <-0.01 <-0.01 <-0.01 <-0.01 Constant 2.89*** 0.17 3.13*** 0.14 3.09*** 0.14 Random Effects Schools <0.01 <0.01 <0.01 <0.01 <0.01 <0.01 Students 0.94 0.21 0.91 0.02 0.92 0.02 N Schools 10 10 10 Students 932 930 930 * p < 0.05 ** p < 0.01 *** p < 0.001
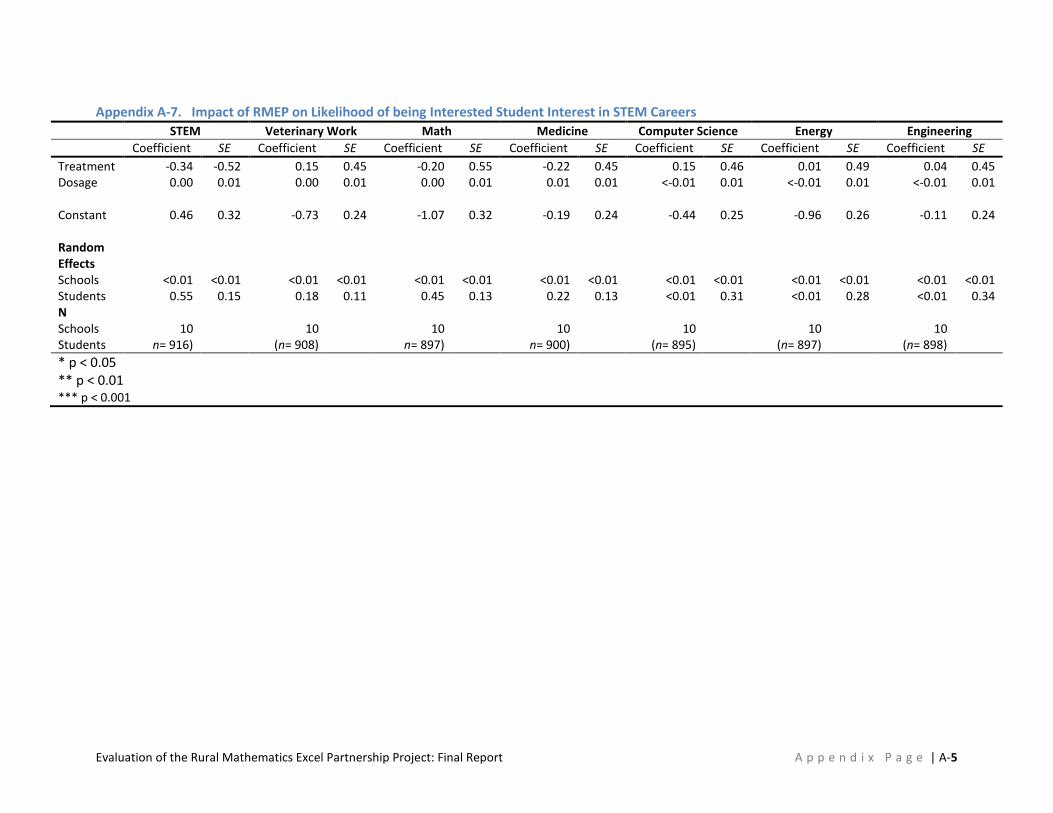
Evaluation of the Rural Mathematics Excel Partnership Project: Final Report A p p e n d i x P a g e | A-5
Appendix A-7. Impact of RMEP on Likelihood of being Interested Student Interest in STEM Careers STEM Veterinary Work Math Medicine Computer Science Energy Engineering Coefficient SE Coefficient SE Coefficient SE Coefficient SE Coefficient SE Coefficient SE Coefficient SE
Treatment -0.34 -0.52 0.15 0.45 -0.20 0.55 -0.22 0.45 0.15 0.46 0.01 0.49 0.04 0.45 Dosage 0.00 0.01 0.00 0.01 0.00 0.01 0.01 0.01 <-0.01 0.01 <-0.01 0.01 <-0.01 0.01 Constant 0.46 0.32 -0.73 0.24 -1.07 0.32 -0.19 0.24 -0.44 0.25 -0.96 0.26 -0.11 0.24 Random Effects
Schools <0.01 <0.01 <0.01 <0.01 <0.01 <0.01 <0.01 <0.01 <0.01 <0.01 <0.01 <0.01 <0.01 <0.01 Students 0.55 0.15 0.18 0.11 0.45 0.13 0.22 0.13 <0.01 0.31 <0.01 0.28 <0.01 0.34 N Schools 10 10 10 10 10 10 10 Students n= 916) (n= 908) n= 897) n= 900) (n= 895) (n= 897) (n= 898) * p < 0.05 ** p < 0.01 *** p < 0.001
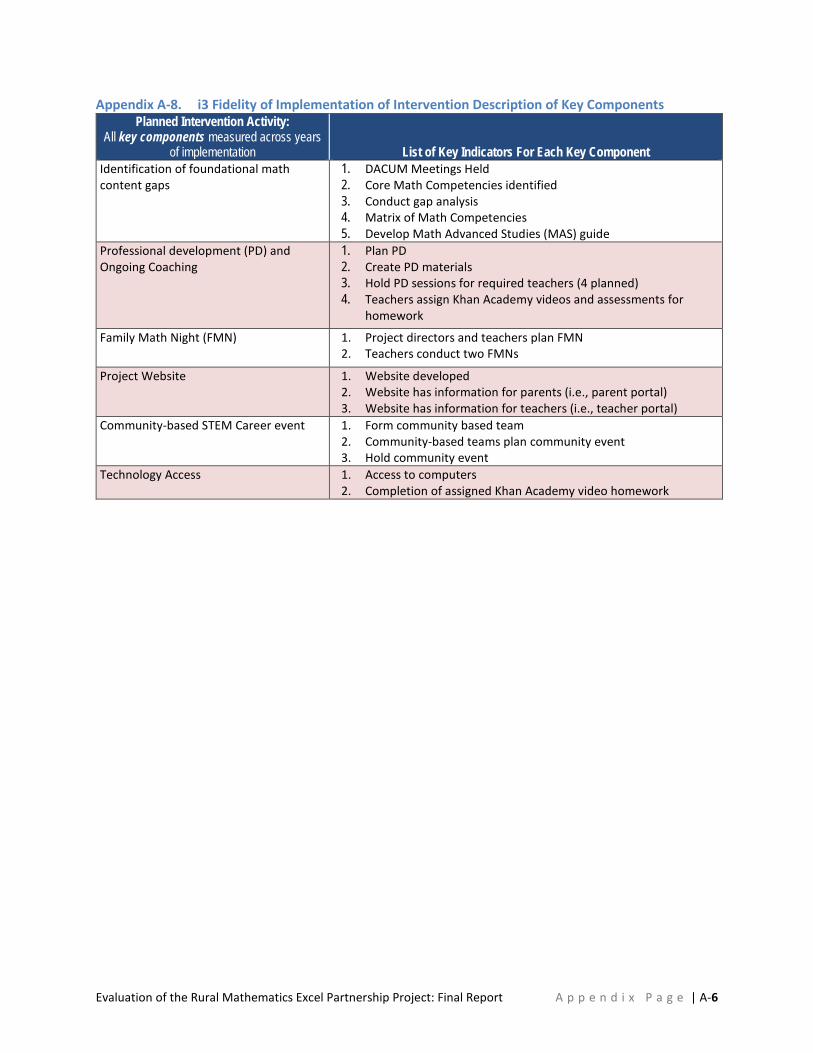
Evaluation of the Rural Mathematics Excel Partnership Project: Final Report A p p e n d i x P a g e | A-6
Appendix A-8. i3 Fidelity of Implementation of Intervention Description of Key Components Planned Intervention Activity:
All key components measured across years of implementation List of Key Indicators For Each Key Component
Identification of foundational math content gaps
1. DACUM Meetings Held 2. Core Math Competencies identified 3. Conduct gap analysis 4. Matrix of Math Competencies 5. Develop Math Advanced Studies (MAS) guide
Professional development (PD) and Ongoing Coaching
1. Plan PD 2. Create PD materials 3. Hold PD sessions for required teachers (4 planned) 4. Teachers assign Khan Academy videos and assessments for
homework
Family Math Night (FMN) 1. Project directors and teachers plan FMN 2. Teachers conduct two FMNs
Project Website 1. Website developed 2. Website has information for parents (i.e., parent portal) 3. Website has information for teachers (i.e., teacher portal)
Community-based STEM Career event 1. Form community based team 2. Community-based teams plan community event 3. Hold community event
Technology Access 1. Access to computers 2. Completion of assigned Khan Academy video homework

Evaluation of the Rural Mathematics Excel Partnership Project: Final Report A p p e n d i x P a g e | A-7
Appendix A-9. i3 Year 1 Fidelity of Implementation of Intervention Year 1 Findings from Evaluator Study of Implementation: IMPLEMENTATION YEAR 1 Enter calendar year: _2013___ (e.g., 2010-11; Sept. 2011-June 2012; Summer 2012)
Intervention Components:
Copy from list above
Implementation measure
(total number of
measurable indicators
representing each
component
Sample Size at the Sample Level
(# of schools, LEAs, etc)
Representativeness of sample:
Measured on All (A), Some (S), or None (N) of the
units representing the intervention
group in the impact analysesb
Component Level Threshold for Fidelity of Implementation for the Unit that is the Basis
for the Sample-Level
Evaluator’s Criteria for “Implemented with Fidelity” at Sample
Level Component Level Fidelity
Score for the Entire Sample
Implemented with Fidelity? (Yes, No, N/A)
Planned Intervention Activities [i.e., key components] Identification of foundational math content gaps
5 6 LEAs and 5 county Communities
1. (S) DACUM Meetings 0 = <1 meeting 1 =≥ 1 meeting
Minimum score of 3 out of 5
3 out of 5 (1= DACUM Meetings 1= Core Competencies 1= Gap Analysis 0= Matrix 0= MAS guide)
Yes
2. (S) Core Math Competencies 0 = not identified 1 = identified
3. (S) Gap Analysis 0 = <1 meeting 1 =≥ 1 meeting
4. (S) Matrix of Math Competencies 0 = not developed 1 = developed
5. (S) Develop MAS Guide 0 = MAS guide not produced 1 = MAS guide produced
Professional development (PD) and Ongoing Coaching
4 6 LEAs 1.(S)
Plan PD 0 = did not plan for PD 1 = plan PD
Minimum score of 3 out of 5
1 out of 5 (1= Planned for PD Session 0= materials not produced 0=No meetings held 0=No one attended PD
No
2.(S) Create PD Materials
0 = materials not produced 1= materials produced

Evaluation of the Rural Mathematics Excel Partnership Project: Final Report A p p e n d i x P a g e | A-8
3.(S) a) 0= < 2 meetings 1= ≥ 2 meetings
0=No videos assigned)
4.(S) 0= <50% of teachers assign Khan video and assessments as required by program developers 1=≥ 50% of teachers assign Khan video and assessments as required by program developers.
Family Math Night (FMN)
2 14 Schools 1.(S) 0 = <50% of required teachers plan Family Math night 1 = ≥ 50% of required teachers plan Family Math night
Score of 2
N/A
2.(S) 0 = Family math night did not occur 1 = one family math occurred
Project Website 3 6 LEAs 1.(S) 0 = Website is not established 1 = Website is established
Minimum score of 2 out of 3
0
No
2.(S) 0= No information for parents 1= Information for parents
3.(S) 0= No information for teachers 1= Information for teachers
Community-based STEM Career event
3 5 County Communities
1.(S) 0 = Community team not formed 1 = Community team formed
Score of 3 1 (1= Community team formed)
N/A
2.(S) 0 = Community event not planned 1 = Community event planned

Evaluation of the Rural Mathematics Excel Partnership Project: Final Report A p p e n d i x P a g e | A-9
3.(S) 0 = Community event not held 1 = Community event held in 4 of 5 communities
Technology Access 2 6 LEAs 1.(S) 0 = < 70% of students and parents have access to a computer at home 1 = ≥ 70% of students and parents have access to a computer at home
Score of 2 N/A
2.(S) 0=< 75% of students complete assigned Khan Academy video homework 1=> 75% of students complete assigned Khan Academy video homework
b All: If the intervention group in the impact analysis includes 10 schools and fidelity measurement includes these 10 schools, the evaluator would enter “A” indicating that All of the schools in the impact analysis are represented in the fidelity findings. Some: If the intervention group in the impact analysis includes teachers in grades K to 3 but fidelity is measured only for teachers in Kindergarten, the evaluator would enter “S” indicating that Some of the teachers in the impact analysis are represented in the fidelity findings. None: If the intervention group in the impact analysis includes grades 7 - 9 but fidelity is measured only for grades 5-6, the evaluator would enter “N” indicating that None of the grades in the impact analysis are represented in the fidelity findings.
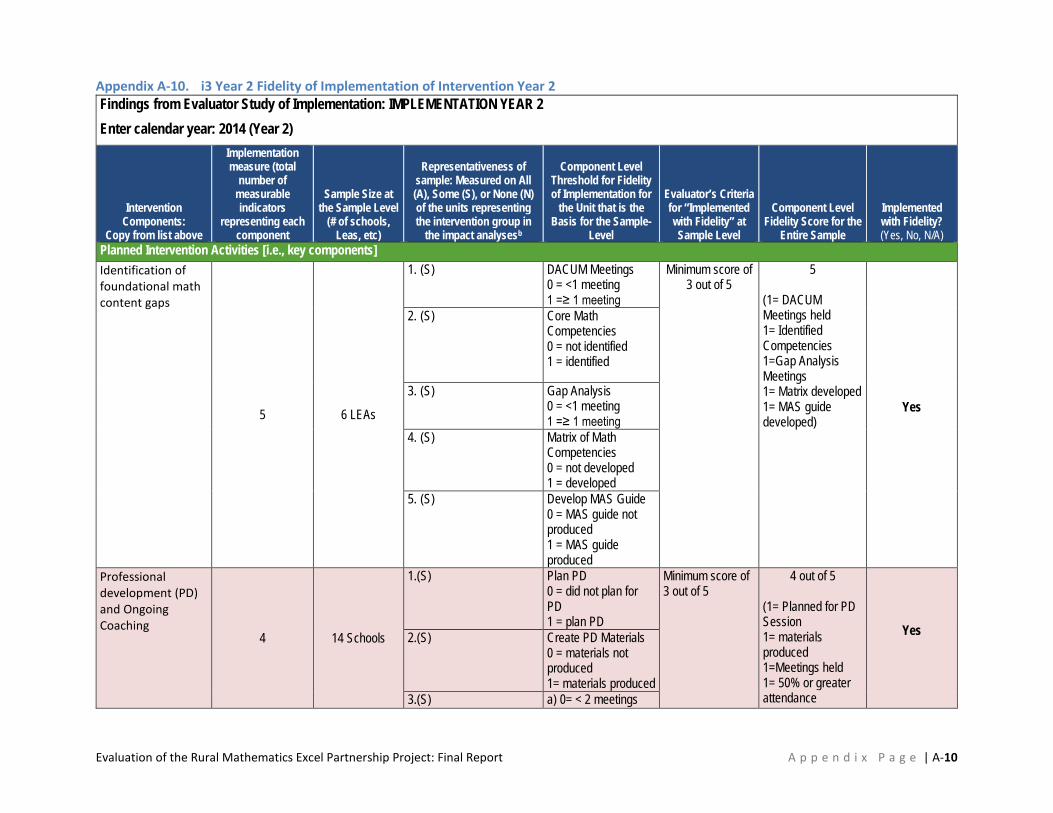
Evaluation of the Rural Mathematics Excel Partnership Project: Final Report A p p e n d i x P a g e | A-10
Appendix A-10. i3 Year 2 Fidelity of Implementation of Intervention Year 2 Findings from Evaluator Study of Implementation: IMPLEMENTATION YEAR 2 Enter calendar year: 2014 (Year 2)
Intervention Components:
Copy from list above
Implementation measure (total
number of measurable indicators
representing each component
Sample Size at the Sample Level
(# of schools, Leas, etc)
Representativeness of sample: Measured on All (A), Some (S), or None (N) of the units representing the intervention group in
the impact analysesb
Component Level Threshold for Fidelity of Implementation for
the Unit that is the Basis for the Sample-
Level
Evaluator’s Criteria for “Implemented with Fidelity” at Sample Level
Component Level Fidelity Score for the
Entire Sample
Implemented with Fidelity? (Yes, No, N/A)
Planned Intervention Activities [i.e., key components] Identification of foundational math content gaps
5
6 LEAs
1. (S) DACUM Meetings 0 = <1 meeting 1 =≥ 1 meeting
Minimum score of 3 out of 5
5 (1= DACUM Meetings held 1= Identified Competencies 1=Gap Analysis Meetings 1= Matrix developed 1= MAS guide developed)
Yes
2. (S) Core Math Competencies 0 = not identified 1 = identified
3. (S) Gap Analysis 0 = <1 meeting 1 =≥ 1 meeting
4. (S) Matrix of Math Competencies 0 = not developed 1 = developed
5. (S) Develop MAS Guide 0 = MAS guide not produced 1 = MAS guide produced
Professional development (PD) and Ongoing Coaching
4 14 Schools
1.(S)
Plan PD 0 = did not plan for PD 1 = plan PD
Minimum score of 3 out of 5
4 out of 5 (1= Planned for PD Session 1= materials produced 1=Meetings held 1= 50% or greater attendance
Yes 2.(S) Create PD Materials
0 = materials not produced 1= materials produced
3.(S) a) 0= < 2 meetings

Evaluation of the Rural Mathematics Excel Partnership Project: Final Report A p p e n d i x P a g e | A-11
1= ≥ 2 meetings 0= less than 50% attendance 1= 50% or great attendance
0= Less than 50% of teachers assigned videos
4.(S) 0= <50% of teachers assign Khan video and assessments as required by program developers 1=≥ 50% of teachers assign Khan video and assessments as required by program developers.
Family Math Night (FMN)
2 14 Schools
1.(S) 0 = <50% of required teachers plan Family Math night 1 = ≥ 50% of required teachers plan Family Math night
Minimum score of 2 out 3
2 (1= 50% or more teacher planned FMN; 1= one FMN held at each school)
Yes 2.(S) 0 = Family math night
did not occur 1 = one family math occurred at each school or more than one held at one or more schools 2 = 2 family math nights occurred at each school
Project Website
3 6 LEAs
1.(S) 0 = Website is not established 1 = Website is established
Minimum score of 2 out of 3
3 (1= Website established 1= Information for Parents
Yes 2.(S) 0= No information for
parents

Evaluation of the Rural Mathematics Excel Partnership Project: Final Report A p p e n d i x P a g e | A-12
1= Information for parents
1= Information for teachers
3.(S) 0= No information for teachers 1= Information for teachers
Community-based STEM Career event
3 5 County Communities
1.(S) 0 = Community team not formed 1 = Community team formed
Score of 3
1= Community team formed 1= Community event planned 1= Community event held
Yes
2.(S) 0 = Community event not planned for 3 out 5 communities 1 = Community event planned for 3 or more of the 5 communities
3.(S) 0 = Community event not held for 1 = Community event held for 3 or more of the 5 communities
Technology Access
2 6 LEAs
1.(S) 0 = < 70% of students and parents have access to a computer at home 1 = ≥ 70% of students and parents have access to a computer at home
Score of 2 0 (0= less than 70% of families have access 0= Less than 75% of students complete assigned videos)
No 3. (S) 0=< 75% of students complete assigned Khan Academy video homework 1=> 75% of students complete assigned Khan Academy video homework

Evaluation of the Rural Mathematics Excel Partnership Project: Final Report A p p e n d i x P a g e | A-13
Appendix A-11. Appendix A-10. i3 Year 3 Fidelity of Implementation of Intervention Matrix Findings from Evaluator Study of Implementation: IMPLEMENTATION YEAR 2 Enter calendar year: 2015 (Year 3)
Intervention Components:
Copy from list above
Implementation measure (total
number of measurable indicators
representing each component
Sample Size at the Sample Level
(# of schools, Leas, etc)
Representativeness of sample: Measured on All (A), Some (S), or None (N) of the units representing the intervention group in
the impact analysesb
Component Level Threshold for Fidelity of Implementation for
the Unit that is the Basis for the Sample-
Level
Evaluator’s Criteria for “Implemented with Fidelity” at Sample Level
Component Level Fidelity Score for the
Entire Sample
Implemented with Fidelity? (Yes, No, N/A)
Planned Intervention Activities [i.e., key components] Identification of foundational math content gaps
5
6 LEAs
6. (A) DACUM Meetings 0 = <1 meeting 1 =≥ 1 meeting
Minimum score of 3 out of 5
MAS guide revised
N/A
7. (A) Core Math Competencies 0 = not identified 1 = identified
8. (A) Gap Analysis 0 = <1 meeting
1 =≥ 1 meeting 9. (A) Matrix of Math
Competencies 0 = not developed 1 = developed
10. (A) Develop MAS Guide 0 = MAS guide not produced 1 = MAS guide produced
Professional development (PD) and Ongoing Coaching
4 6 LEAs
1.(S)
Plan PD 0 = did not plan for PD 1 = plan PD
Minimum score of 3 out of 5
4 out of 5 (1= Planned for PD Session 1= materials produced 1=Meetings held 1= 50% or greater attendance
Yes 2.(S) Create PD Materials
0 = materials not produced 1= materials produced
3.(S) a) 0= < 2 meetings
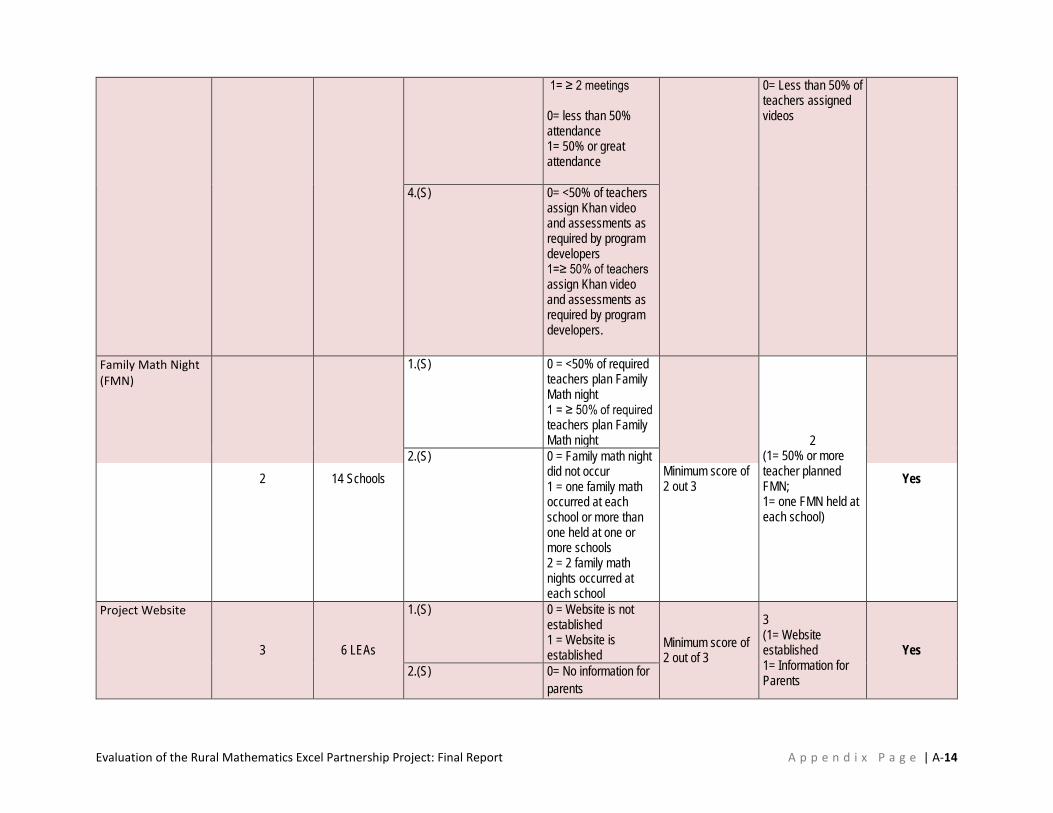
Evaluation of the Rural Mathematics Excel Partnership Project: Final Report A p p e n d i x P a g e | A-14
1= ≥ 2 meetings 0= less than 50% attendance 1= 50% or great attendance
0= Less than 50% of teachers assigned videos
4.(S) 0= <50% of teachers assign Khan video and assessments as required by program developers 1=≥ 50% of teachers assign Khan video and assessments as required by program developers.
Family Math Night (FMN)
2 14 Schools
1.(S) 0 = <50% of required teachers plan Family Math night 1 = ≥ 50% of required teachers plan Family Math night
Minimum score of 2 out 3
2 (1= 50% or more teacher planned FMN; 1= one FMN held at each school)
Yes 2.(S) 0 = Family math night
did not occur 1 = one family math occurred at each school or more than one held at one or more schools 2 = 2 family math nights occurred at each school
Project Website
3 6 LEAs
1.(S) 0 = Website is not established 1 = Website is established
Minimum score of 2 out of 3
3 (1= Website established 1= Information for Parents
Yes 2.(S) 0= No information for
parents

Evaluation of the Rural Mathematics Excel Partnership Project: Final Report A p p e n d i x P a g e | A-15
1= Information for parents
1= Information for teachers
3.(S) 0= No information for teachers 1= Information for teachers
Community-based STEM Career event
3 5 County Communities
1.(S) 0 = Community team not formed 1 = Community team formed
Score of 3
1= Community team formed 1= Community event planned 1= Community event held
Yes
2.(S) 0 = Community event not planned for 3 out 5 communities 1 = Community event planned for 3 or more of the 5 communities
3.(S) 0 = Community event not held for 1 = Community event held for 3 or more of the 5 communities
Technology Access
2 6 LEAs
1.(S) 0 = < 70% of students and parents have access to a computer at home 1 = ≥ 70% of students and parents have access to a computer at home
Score of 2 0 (0= less than 70% of families have access 0= Less than 75% of students complete assigned videos) No 4. (S) 0=< 75% of students
complete assigned Khan Academy video homework 1=> 75% of students complete assigned Khan Academy video homework
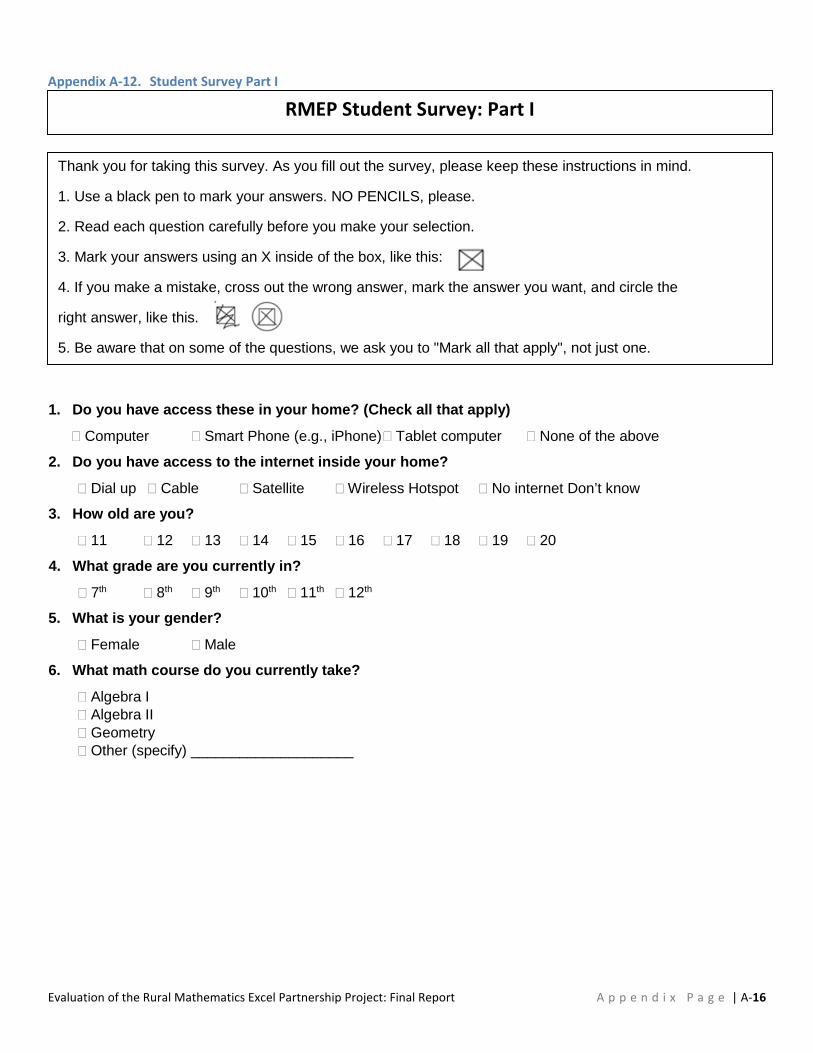
Evaluation of the Rural Mathematics Excel Partnership Project: Final Report A p p e n d i x P a g e | A-16
Appendix A-12. Student Survey Part I
1. Do you have access these in your home? (Check all that apply)
� Computer � Smart Phone (e.g., iPhone) � Tablet computer � None of the above
2. Do you have access to the internet inside your home?
� Dial up � Cable � Satellite � Wireless Hotspot � No internet Don’t know
3. How old are you?
� 11 � 12 � 13 � 14 � 15 � 16 � 17 � 18 � 19 � 20
4. What grade are you currently in?
� 7th � 8th � 9th � 10th � 11th � 12th
5. What is your gender?
� Female � Male
6. What math course do you currently take?
� Algebra I � Algebra II � Geometry � Other (specify) ____________________
RMEP Student Survey: Part I
Thank you for taking this survey. As you fill out the survey, please keep these instructions in mind.
1. Use a black pen to mark your answers. NO PENCILS, please.
2. Read each question carefully before you make your selection.
3. Mark your answers using an X inside of the box, like this:
4. If you make a mistake, cross out the wrong answer, mark the answer you want, and circle the
right answer, like this.
5. Be aware that on some of the questions, we ask you to "Mark all that apply", not just one.

Evaluation of the Rural Mathematics Excel Partnership Project: Final Report A p p e n d i x P a g e | A-17
7. We want to know how you feel about math and doing math. Read these statements and mark the box that shows how much you agree with each statement. (Mark (X) one box for each row.)
Strongly
Agree Agree
Neither Agree nor Disagree Disagree
Strongly Disagree
a. I enjoy learning math. b. Math is boring. c. I often worry that it will be difficult for me in math classes. d. I learn math quickly. e. In my math class, I understand even the most difficult
work.
f. I get tense when I have to do math homework. g. I’m certain I can learn the skills taught in math class this
year.
h. I like to solve new problems in math. i. I get nervous when doing math problems. j. I can do almost all of the work in math class if I don’t give
up.
k. I do math because I enjoy it. l. I feel helpless when doing a math problem. m. I am interested in the things I learn in math class. n. Even if math is hard, I can learn it. o. I worry that I will get poor grades in math. p. I do not like math. q. I feel unsure of myself when doing math. r. I get good grades in math. s. Math is one of my best subjects. t. Math does not scare me at all. u. I am just not good at math. v. I’m certain I can figure out how to do the most difficult
math work.
w. I can do even the hardest math if I try. x. I look forward to my math class.
8. Read these statements and mark the box that shows how much you have used the following for class work or homework for math class in the past year. (Mark (X) one box for each row.)
Never or Rarely Sometimes Often
a. Computers for academic drills and skills practice b. Online textbooks, worksheets, workbooks c. Computer games used for instructional purposes d. Screen-based multi-media (e.g. online videos)
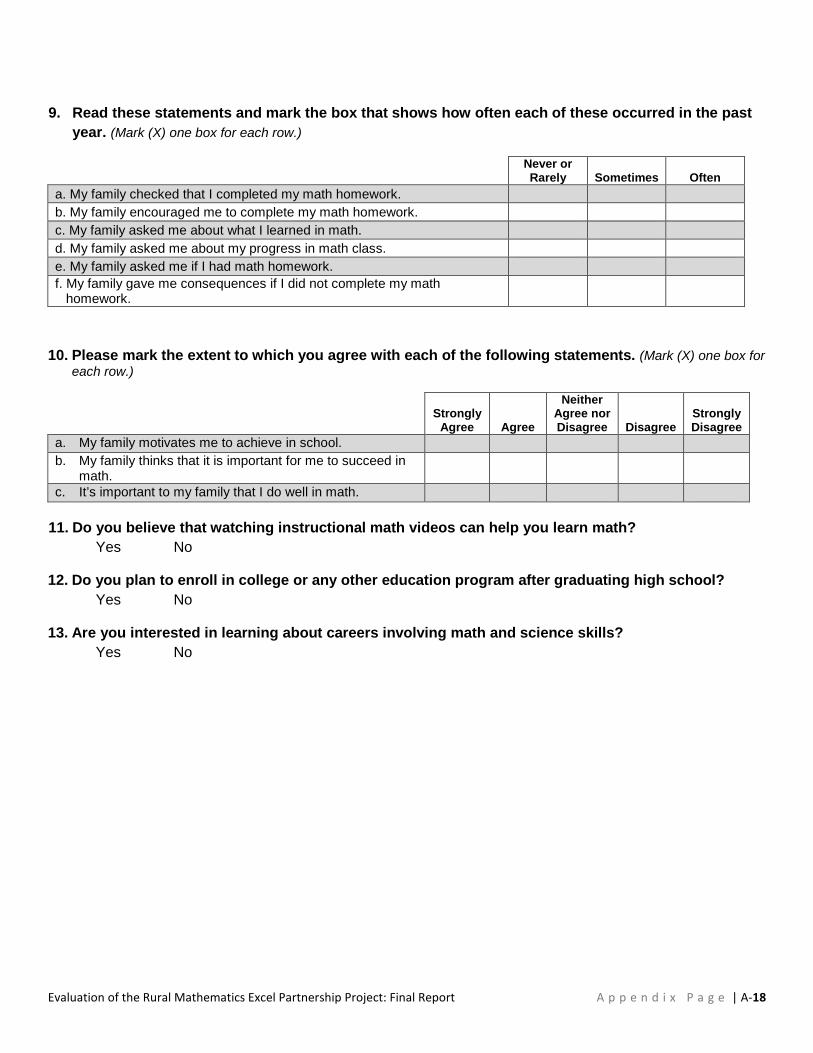
Evaluation of the Rural Mathematics Excel Partnership Project: Final Report A p p e n d i x P a g e | A-18
9. Read these statements and mark the box that shows how often each of these occurred in the past year. (Mark (X) one box for each row.)
Never or Rarely Sometimes Often
a. My family checked that I completed my math homework. b. My family encouraged me to complete my math homework. c. My family asked me about what I learned in math. d. My family asked me about my progress in math class. e. My family asked me if I had math homework. f. My family gave me consequences if I did not complete my math
homework.
10. Please mark the extent to which you agree with each of the following statements. (Mark (X) one box for each row.)
Strongly
Agree Agree
Neither Agree nor Disagree Disagree
Strongly Disagree
a. My family motivates me to achieve in school. b. My family thinks that it is important for me to succeed in
math.
c. It’s important to my family that I do well in math. 11. Do you believe that watching instructional math videos can help you learn math?
Yes No
12. Do you plan to enroll in college or any other education program after graduating high school? Yes No
13. Are you interested in learning about careers involving math and science skills? Yes No

Evaluation of the Rural Mathematics Excel Partnership Project: Final Report A p p e n d i x P a g e | A-19
14. Here are some careers that involve math and science. Please mark your interest in each of the
areas. (Mark (X) one box for each row.)
Very
Interested Interested Not so
interested Not at all interested
a. Veterinary Work. Jobs in veterinary work include veterinary assistant, veterinarian, livestock producer, and animal caretaker.
b. Mathematics. Jobs in mathematics include accountant, applied mathematician, economist, financial analyst, mathematician, statistician, market researcher, stock market analyst.
c. Medicine. Jobs in medicine include physician’s assistant, nurse, doctor, nutritionist, emergency medical technician, physical therapist, and dentist.
d. Computer Science. Jobs in computer science include computer support specialist, computer programmer, computer and network technician, gaming designer, computer software engineer, information technology specialist.
e. Energy. Jobs in energy include electrician, electrical engineer, heating, ventilation, and air conditioning (HVAC) technician, systems engineer, and alternative energy systems installer or technician.
f. Engineering. Jobs in engineering include civil, industrial, agricultural, or mechanical engineers, welder, auto mechanic, engineering technician and construction manager.
Thank you for completing this survey. Your responses will help to improve the RMEP project. Please put this survey in the envelope provided and give it to your math teacher.

Evaluation of the Rural Mathematics Excel Partnership Project: Final Report A p p e n d i x P a g e | A-20
Appendix A-13. Student Survey Part 2
15. Do you have access these in your home? (Check all that apply)
� Computer � Smart Phone (e.g., iPhone) � Tablet computer � None of the above
16. Do you have access to the internet inside your home?
� Dial up � Cable � Satellite � Wireless Hotspot � No internet � Don’t know
17. We want to know how you feel about math and doing math. Read these statements and mark the box that shows how much you agree with each statement. (Mark (X) one box for each row.)
Strongly
Agree Agree
Neither Agree nor Disagree Disagree
Strongly Disagree
a. I enjoy learning math. b. Math is boring. c. I often worry that it will be difficult for me in math classes. d. I learn math quickly. e. In my math class, I understand even the most difficult work. f. I get tense when I have to do math homework. g. I’m certain I can learn the skills taught in math class this year. h. I like to solve new problems in math. i. I get nervous when doing math problems. j. I can do almost all of the work in math class if I don’t give up. k. I do math because I enjoy it. l. I feel helpless when doing a math problem. m. I am interested in the things I learn in math class. n. Even if math is hard, I can learn it. o. I worry that I will get poor grades in math. p. I do not like math. q. I feel unsure of myself when doing math. r. I get good grades in math. s. Math is one of my best subjects. t. Math does not scare me at all. u. I am just not good at math. v. I’m certain I can figure out how to do the most difficult math
work.
w. I can do even the hardest math if I try. x. I look forward to my math class.
Student Survey: Part II

Evaluation of the Rural Mathematics Excel Partnership Project: Final Report A p p e n d i x P a g e | A-21
18. How often were you given math homework assignments that required you to watch an online video?
� More than once a week � More than once a month � A few times a year � Once � Never
19. How often did you complete the online video homework you were assigned? {Do not load if user selects “Never” in Q4}
� Always � Usually � Sometimes � Rarely � Never
20. If you did not complete math homework assignments that required you to watch an online video, what were the reasons? (You may mark more than one) {Do not load if user selects “Always” in Q5}
� I was too busy � The assignment was too difficult � I did not have internet access at my home � The videos would not load on my computer � The videos kept freezing � The Khan website crashed � I did not want to � Other (specify) _______________________

Evaluation of the Rural Mathematics Excel Partnership Project: Final Report A p p e n d i x P a g e | A-22
21. Read these statements and mark the box that shows how often each of these occurred in the past year. (Mark (X) one box for each row.)
Never or Rarely Sometimes Often
a. My parents or guardians checked that I completed my math homework. b. My parents or guardians encouraged me to complete my math
homework.
c. My parents or guardians asked me about what I learned in math. d. My parents or guardians asked me about my progress in math class. e. My parents or guardians asked me if I had math homework. f. My parents or guardians gave me consequences if I did not complete my
math homework.
22. When my math homework required that I watch an online video: (Mark (X) one box for each row.)
Never or Rarely Sometimes Often n/a
a. My parents were aware that I had this assignment.
b. My parents encouraged me to complete the homework assignment.
c. My parents checked if I had completed the homework assignment.
23. We want to know what you think about the math videos assigned for homework. Please answer
how much each of these following statements' are true based on your own experience. (Mark (X) one box for each row.)
Always
True Mostly True
Sometimes True
Not True
a. The online math videos are helpful to me. b. The online math videos are too hard to understand or follow. c. The online math videos don’t give me all the information I
need to solve the exercises.
24. We want to know how you feel about math since you started watching online instructional videos.
Read these statements and mark the box that shows how much you agree with each statement. (Mark (X) one box for each row.)
Strongly
Agree Agree
Neither Agree nor Disagree Disagree
Strongly Disagree
a. I like math more since I started watching the online videos.
b. I am better at doing math since I started watching the online videos.
c. I have more confidence in my ability to do math since I started watching the videos.
d. I get better grades in math than I did before watching the videos.
e. I am able to learn new things about math on my own without the help of my teacher by watching the videos.

Evaluation of the Rural Mathematics Excel Partnership Project: Final Report A p p e n d i x P a g e | A-23
25. Please mark the extent to which you agree with each of the following statements. (Mark (X) one box for each row.)
Strongly
Agree Agree
Neither Agree nor Disagree Disagree
Strongly Disagree
a. My family motivates me to achieve in school. b. My family thinks that it is important for me to
succeed in math.
c. It’s important to my family that I do well in math. 26. Do you plan to enroll in college or any other education program after graduating high school?
Yes No
27. Are you interested in learning about careers involving math and science skills? Yes No
28. In the past year, did you attend any community events relating to careers that involve math and science skills? Yes No
29. Please mark the extent to which you agree with each of the following statements. (Mark (X) one box for each row.) {Load only if the user selected “Yes” in Q13}
Strongly
Agree Agree
Neither Agree nor Disagree Disagree
Strongly Disagree
a. The event provided me with new information.
b. The event increased how much I value learning math.
c. At the event, I learned about jobs that I didn’t know about before.
d. After the event, I became more interested in careers that involve math.
e. The event showed me that my community can play a part in my future success.
30. Did you attend math night at your school this year? Yes No
31. Please mark the extent to which you agree with each of the following statements. (Mark (X) one box for each row.) {Load only if the user selected “Yes” in Q15}
Strongly
Agree Agree
Neither Agree nor Disagree Disagree
Strongly Disagree n/a
a. Math Night was informative. b. Math Night showed me that my parents or
guardians play an important part in my success in school.
c. The event increased how much I value learning math.
d. After the event, my parents or guardians showed a greater interest in me completing my math homework assignments.

Evaluation of the Rural Mathematics Excel Partnership Project: Final Report A p p e n d i x P a g e | A-24
32. Did a parent or guardian go to Math Night with you? {Load only if the user selected “Yes” in Q15} Yes No
33. What math course do you plan to take next year?
� Algebra I � Algebra II � Geometry � Statistics � Other (specify) ____________________
34. Will the course above be any of the following?
� Honors � Advanced � Advanced Placement (AP) � Dual college credit � International Baccalaureate (IB) � Other (specify) ____________________
35. Here are employment categories that involve math, science, engineering and/or technology, and lists of jobs connected to each subject area. As you read the list below, mark your interest in each of the areas. (Mark (X) one box for each row.)
Very
Interested Interested Not so
interested Not at all interested
a. Physics. Jobs in physics include aviation engineer, alternative energy technician, lab technician, physicist, and astronomer.
b. Veterinary Work. Jobs in veterinary work include veterinary assistant, veterinarian, livestock producer, and animal caretaker.
c. Mathematics. Jobs in mathematics include accountant, applied mathematician, economist, financial analyst, mathematician, statistician, market researcher, stock market analyst.
d. Medicine. Jobs in medicine include physician’s assistant, nurse, doctor, nutritionist, emergency medical technician, physical therapist, and dentist.
e. Computer Science. Jobs in computer science include computer support specialist, computer programmer, computer and network technician, gaming designer, computer software engineer, information technology specialist.
f. Energy. Jobs in energy include electrician, electrical engineer, heating, ventilation, and air conditioning (HVAC) technician, nuclear engineer, systems engineer, and alternative energy systems installer or technician.
g. Engineering. Jobs in engineering include civil, industrial, agricultural, or mechanical engineers, welder, auto -mechanic, engineering technician and construction manager.