evaluation report on vietnam’s investment in 5 years after wto accession nguyen dang binh, phd...
TRANSCRIPT

EVALUATION REPORT ONEVALUATION REPORT ONVIETNAM’S INVESTMENT IN 5 VIETNAM’S INVESTMENT IN 5
YEARS AFTER WTO ACCESSIONYEARS AFTER WTO ACCESSION
Nguyen Dang Binh, PhDNguyen Dang Binh, PhD
Hanoi, April 2013
1

MAIN CONTENTSMAIN CONTENTS
2
IIIMPLEMENTATION OF THE IMPLEMENTATION OF THE
INTEGRATION COMMITMENTS RELATED INTEGRATION COMMITMENTS RELATED
TO INVESMENTTO INVESMENT
IMPLEMENTATION OF THE IMPLEMENTATION OF THE
INTEGRATION COMMITMENTS RELATED INTEGRATION COMMITMENTS RELATED
TO INVESMENTTO INVESMENT
IIIIINVESTMENT SITUATION AND INVESTMENT SITUATION AND
RESULTS IN 5 YEARS AFTER WTO RESULTS IN 5 YEARS AFTER WTO
ACCESSIONACCESSION
IIIIII POLICY RECOMMENDATIONSPOLICY RECOMMENDATIONSPOLICY RECOMMENDATIONSPOLICY RECOMMENDATIONS

I. IMPLEMENTATION OF THE INTEGRATION I. IMPLEMENTATION OF THE INTEGRATION COMMITMENTS RELATED TO INVESMENTCOMMITMENTS RELATED TO INVESMENT
3
Investment regulations have been issued, amended and supplemented to match international commitments (before, during and after joining the WTO)
The commitments have led to the opening of service markets and non-discriminatory treatment for foreign investors
Vietnam has seriously implemented the integration commitments
Contributing to improving investment and business environment

SOMESOME ISSUES WHEN IMPLEMENTATION OF COMMITMENTS
4
Lack of specific and uniform guidance in a
certain area (conditional investment, opening
of service markets...)
Lack of treatment measures for projects
registrated with multiple targets, services
sectors/sub-sectors having different opening
commitments.
MFN Principles has not been fully
recognized

I. IMPLEMENTATION OF THE INTEGRATION I. IMPLEMENTATION OF THE INTEGRATION COMMITMENTS RELATED TO INVESMENTCOMMITMENTS RELATED TO INVESMENT
5
Impact channel of the integration commitments Impact channel of the integration commitments related to investmentrelated to investment
Commitments related to investment: - WTO - Multilaterl - Bilateral commitments
Promulgate, amend
regulations, policies and
measures
Investment By
economic sectors
By industries
Abroad
Context
Macro-
Economic Policies of the State

II. INVESTMENT SITUATION AND RESULTS IN II. INVESTMENT SITUATION AND RESULTS IN
5 YEARS AFTER WTO ACCESSION5 YEARS AFTER WTO ACCESSION
Total investment growth Total investment growth
14,3 12,7 13,5 13,0 13,7
27,0
7,811,4
7,8
-9,3-15
-10
-05
00
05
10
15
20
25
30
2002 2003 2004 2005 2006 2007 2008 2009 2010 2011
Trước WTO Sau WTO
13.4%/Year
13.4%/Year
8.3%/Year8.3%/Year
Before AfterAfter

TOTAL INVESTMENTTOTAL INVESTMENT
Total investment/GDP and GDP growthTotal investment/GDP and GDP growth
7,1 7,37,8
8,4 8,2 8,5
6,35,3
6,8
5,937,4 39,0 40,7 40,9 41,5
46,541,5 42,7
41,934,6
0
1
2
3
4
5
6
7
8
9
0
5
10
15
20
25
30
35
40
45
50
2002 2003 2004 2005 2006 2007 2008 2009 2010 2011
Tăng trưởng GDP (%) ĐT/GDP (%)
Trước WTO: 40,2/7,8 Sau WTO: 40,5/6,5
Before: 40.2/7.8After: 40.5/6.5
GDP growth I/GDP

INVESTMENT BY ECONOMIC SECTORSINVESTMENT BY ECONOMIC SECTORSInvestment GrowthInvestment Growth
(20,0)
0,0
20,0
40,0
60,0
80,0
100,0
2002 2003 2004 2005 2006 2007 2008 2009 2010 2011
Tổng vốn đầu tư toàn xã hội Kinh tế nhà nước
Kinh tế ngoài nhà nước Khu vực có vốn đầu tư nước ngoài
Trước WTO Sau WTO
8
16.8
10.92.8
Before AfterAfter

Investment structure Investment structure
Unit: %Unit: %
9
Năm State Non-State FDI
Before WTO
accesion
2001 59.8 22.6 17.6 2002 57.3 25.3 17.4 2003 52.9 31.1 16.0 2004 48.1 37.7 14.2 2005 47.1 38.0 14.9 2006 45.7 38.1 16.2
After WTO
accession
2007 37.2 38.5 24.3 2008 33.9 35.2 30.9 2009 40.6 33.9 25.6 2010 38.1 36.1 25.8 2011 38.9 35.2 25.8

FDIFDI
FDI 5 years before and after WTO accessionFDI 5 years before and after WTO accession
However, Realized / Registered ratio rose in 3 recent years: from 16% in 2008 => 43.3% in 2009 => 55.3% in 2010 => 70.4% in 2011.
10
Indicators Unit Before (1) After (2)
2:1 2002-2006 2007-2011
No. of projects Project 4,367 6,737 1.5 Registered Capital Mil.USD 29,581 151,685 5.1 Realized Capital Mil.USD 15,502 51,530 3.3 Realized / Registered
% 52.4 34.0

Annual FDI11
Indicators 2006 2007 2008 2009 2010 2011
Registered Capital (Mill, USD) 12,004 21,347 71,726 23,107 19,886 15,618
Growth rate 77.8 236.0 -67.8 -13.9 -21.5
Realized Capital (Mill, USD) 4,100 8,030 11,500 10,000 11,000 11,000
Growth rate 95.9 43.2 -13.0 10.0 0.0

FDIFDIFDIFDI
12
Fastest growth in 3 sectors
(16.8%/year > 02-06: 13.9%) Percentage: 15.6% -> 26.4% Contribute 18.6% GDP
(02-06: 15.5%) Contribute Export, Tax Create high technical jobs
Fastest growth in 3 sectors
(16.8%/year > 02-06: 13.9%) Percentage: 15.6% -> 26.4% Contribute 18.6% GDP
(02-06: 15.5%) Contribute Export, Tax Create high technical jobs
AchievementAchievement
“Virtual” projects FDI declined in 3 recent years FDI in difficult areas is low Much import, trade instead of production Use much land, energy, resources, cause pollution Transfer Pricing…
“Virtual” projects FDI declined in 3 recent years FDI in difficult areas is low Much import, trade instead of production Use much land, energy, resources, cause pollution Transfer Pricing…
ShortcomingsShortcomings

FDIFDIFDIFDI
REASONS OF SHORTCOMINGS
Legal documents are not synchronized
The preferential policies are spread and lack appeal;
yet encouraging production rather than trade.
The decentralization reveals the inadequacies
Inspection and supervision is limited
Objective causes: global economic recession...
13

NON-STATE INVESTMENTNON-STATE INVESTMENT
Development of private enterprisesDevelopment of private enterprises
14
Indicator Unit 2006 2007 2008 2009 2010 2011 2007-2011
New registered enterprises
1000 46.7 58.2 65.3 84.5 83.6 79.1 370.7
>2 times 99-06 (167)
Total capital
1000 bill.
dong 146.3 473.8 569.5 517.0 489.6 496.0 2,545.9

NON-STATE INVESTMENTNON-STATE INVESTMENT
Growth and percentage in total investmentGrowth and percentage in total investment
15
Year
Growth (1994 price)
Percentage (current price)
Before WTO
accession
2002-06 20.1 35.1 2002 20.2 25.3 2006 16.0 38.1
After WTO
accession
2007 26.9 38.5 2008 -3.5 35.2 2009 3.9 33.9
2010 38.5 36.1 2011 -4.8 35.2 2007-11 10.9 35.6
NON-STATE INVESTMENTNON-STATE INVESTMENT
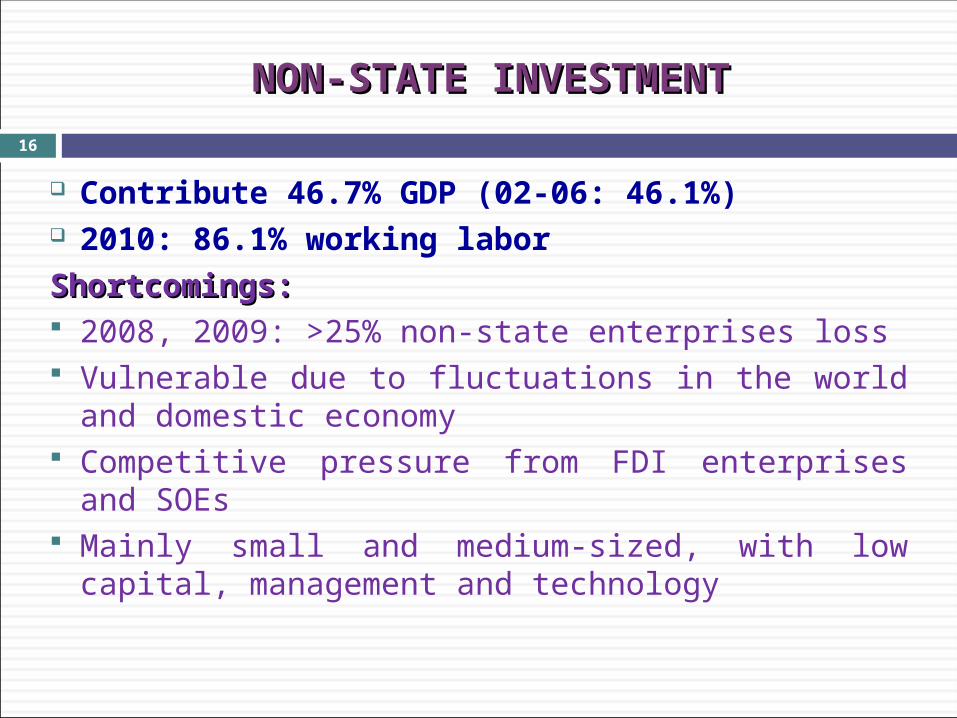
Contribute 46.7% GDP (02-06: 46.1%) 2010: 86.1% working labor
Shortcomings:Shortcomings: 2008, 2009: >25% non-state enterprises loss Vulnerable due to fluctuations in the world and
domestic economy Competitive pressure from FDI enterprises and SOEs Mainly small and medium-sized, with low capital,
management and technology
16

STATE INVESTMENTSTATE INVESTMENT17
Year
Growth (1994 Price)
Percentage in total investment (%)
Before WTO accession
2002-06 10.3 49.2 2002 12.0 57.3 2006 9.9 45.7
After WTO accession
2007 4.2 37.2 2008 -2.5 33.9 2009 34.6 40.6
2010 -3.0 38.1 2011 -13.5 38.9 2007-11 2.8 37.9

STATE INVESTMENTSTATE INVESTMENT
Important contribution to the development of socio-economic infrastructure, social security and social welfare
However, remains some shortcomings: Investment effectiveness of some projects is low Loss and wasting, slow tempo, spread, beyond the
ability to balance Many SOEs have low business results, confused in
switching (external sector investment, financial risk...)
=> Investment restructuring, emphasis on public investment
18

FDI BY INDUSTRIESFDI BY INDUSTRIESDue to opening service markets, FDI in some service sectors rose sharply after WTO accession: Wholesale and retail Accommodation and catering services Transport, storage Real estate business (In first 2 years) Health and social assistance Arts, entertainment and recreation ...
Service percentage:
30.7% (88-06) => 46.9% (07-11)
INVESTMENT BY INDUSTRIESINVESTMENT BY INDUSTRIES
19
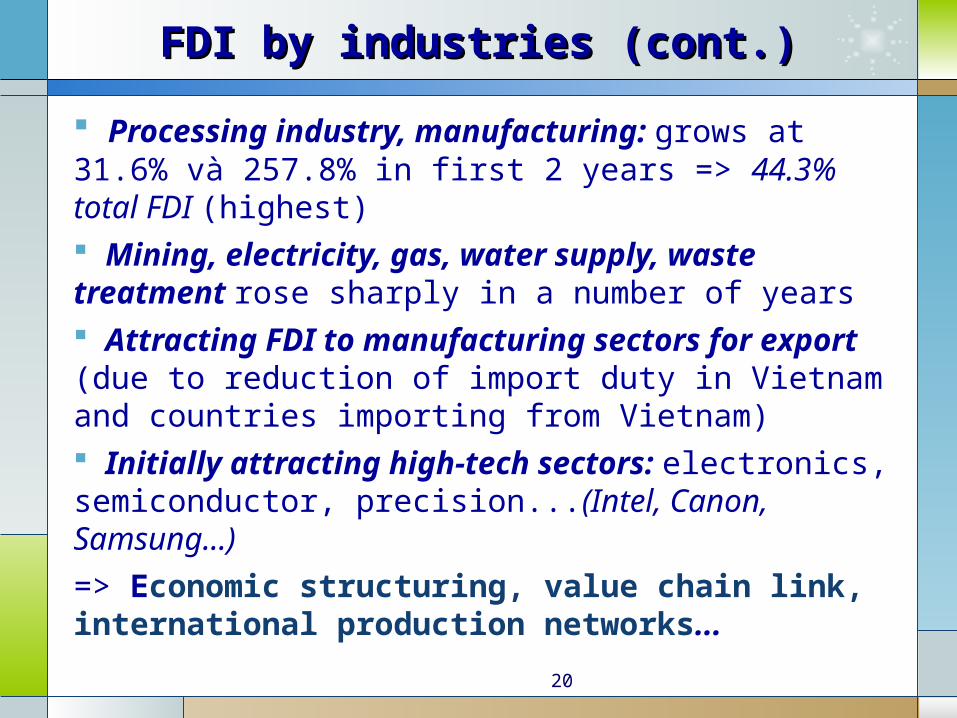
Processing industry, manufacturing: grows at 31.6% và 257.8% in first 2 years => 44.3% total FDI (highest) Mining, electricity, gas, water supply, waste treatment rose sharply in a number of years Attracting FDI to manufacturing sectors for export (due to reduction of import duty in Vietnam and countries importing from Vietnam) Initially attracting high-tech sectors: electronics, semiconductor, precision...(Intel, Canon, Samsung...)
=> Economic structuring, value chain link, international production networks...
FDI by industries (cont.)FDI by industries (cont.)
20

Shortcomings and undesirable effects:Shortcomings and undesirable effects: Not strongly attract capital in desired areas such as high technology, agriculture (88-06: 6.4% -> 07-11: 0.5%), science and technology, education and training, infrastructure. A number of fast-growing areas but cause negative consequences such as real estate, mining, low-tech fields, forestry...<=> Much exploited land, natural resources, minerals, energy, environmental pollution, affecting social security and national security. Spillover effect to Vietnam’s industries is low.
FDI by industries (cont.)FDI by industries (cont.)
21

Cause of shortcomings:Cause of shortcomings:
Policy is not enough incentive to attract FDI into desired industries
Planning, information and forecasts are also drawbacks to some extent
Implementation: coordination, decentralization, monitoring
Lack of necessary conditions: high quality labour, infrastructure, supporting industries, ...
Due to the world economy: The adjustment on the orientation and structure of FDI
FDI by industries (cont.)FDI by industries (cont.)
22

FDI change has a certain impact on the total investment by industries: The fast-growing fields: Real estate, finance, banking and insurance, processing industry and manufacturing... Services increased by 8.5%/year, while the agriculture 4.4%/year => mainly by FDI and non-agriculture sector Investment structure shift slowly: Services 50.9 -> 51.6%, industry and construction 41.2 -> 42.2%, agriculture: 7.9 -> 6.2% Structure is outdated, inefficient => low development quality, unsustainability
Total investment by industriesTotal investment by industries
23

INVESTMENT ABROAD474 DN and registered capital of $ 12.8 bill., 3.8 times
and 16.6 times of 5 years before joining the WTORealized capital: $2.9/11.4 bill. valid (25,4%)By industries:
(1) Mining (2) Electriction, gas, water, air (3) Agriculture (4) Arts and Entertainment (5) Information and communication (6) processing industry, manufacturing ....
Investment in 57 countries and territories WTO accession has certain impact on investment
abroad Need to better monitor and manage, improve
efficiency24

III. POLICY RECOMMENDATIONSIII. POLICY RECOMMENDATIONS
1. Orientation on development investment1. Orientation on development investment Innovating implementation, restructuring investment Ensure rational, efficient, focal point Renew growth model, develop all potentials, strengths,
improve competitiveness Ensure sustainable development
(Urgent requirement when perform WTO commitments under the roadmap)
Reduce state investment, increase other investment Improve the quality and efficiency of FDI Ensure effective investment abroad
25
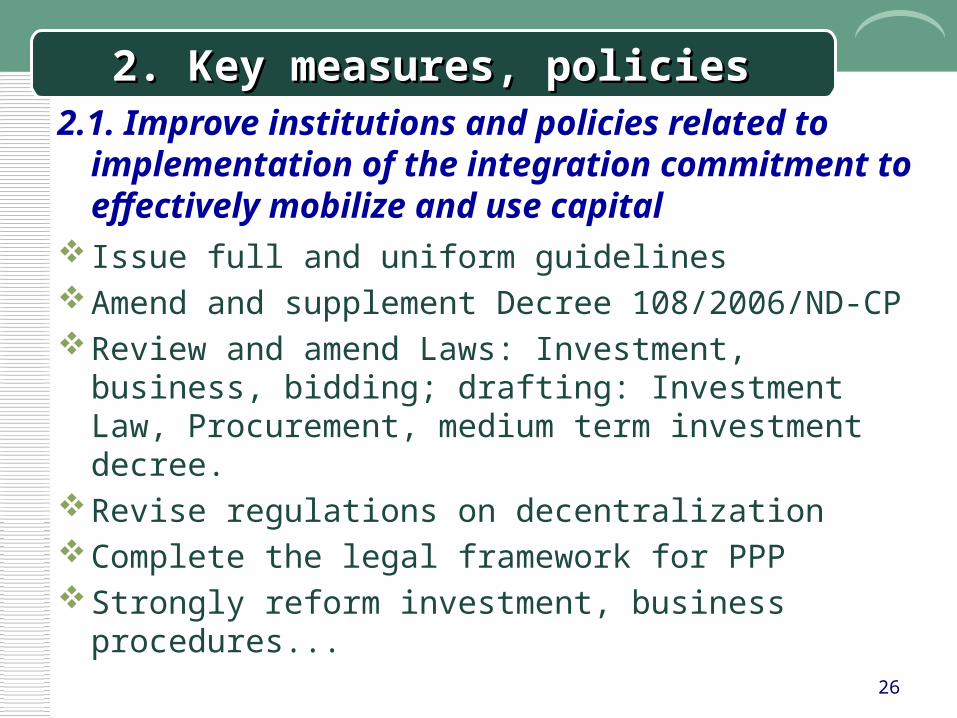
2. 2. Key measures, policiesKey measures, policies2.1. Improve institutions and policies related to
implementation of the integration commitment to effectively mobilize and use capital
Issue full and uniform guidelines Amend and supplement Decree 108/2006/ND-CPReview and amend Laws: Investment, business,
bidding; drafting: Investment Law, Procurement, medium term investment decree.
Revise regulations on decentralizationComplete the legal framework for PPPStrongly reform investment, business procedures...
26

2. 2. Key measures, policiesKey measures, policies
2.2. Improve the quality of planning, information and forecasts
Issue synchronically legal documents of plan,
planning,
Identify, publish lists of recommended and limit
investment sectors; list of FDI attracting projects
Strengthen information, forecasting and
macroeconomic warning
27

2. 2. Key measures, policiesKey measures, policies
2.3. Strengthen coordination, implementation and monitoring of investment
Develop mechanisms to strengthen coordination between ministries, localities of investment
Improve the quality of project appraisement, decision or certificating investment
Strengthen investment promotion, promote disbursement.
Publicity and transparency in investment, bidding; dialogue, exposure to investors, businesses
Enhance investment inspection, monitoring, management and supervision of the people.
28

2. 2. Key measures, policiesKey measures, policies
2.4. Develop factors promoting and improving investment effectiveness
Ensure macroeconomic stability
Improve fiscal policy (tax, fee, etc.), credit, land, foreign exchange policy...
Appropriate policy support
Develop supporting industry
Develop labor resources
Improve infrastructure
Intensify international cooperation.29

3030