evaporation in vineyards dennis baldocchi and youngryel ryu dept environmental science, policy and...
TRANSCRIPT
Evaporation in Vineyards
Dennis Baldocchi and Youngryel RyuDept Environmental Science, Policy and Management
University of California, Berkeley
November 30, 2010Fruition Sciences Symposium, St. Helena, CA
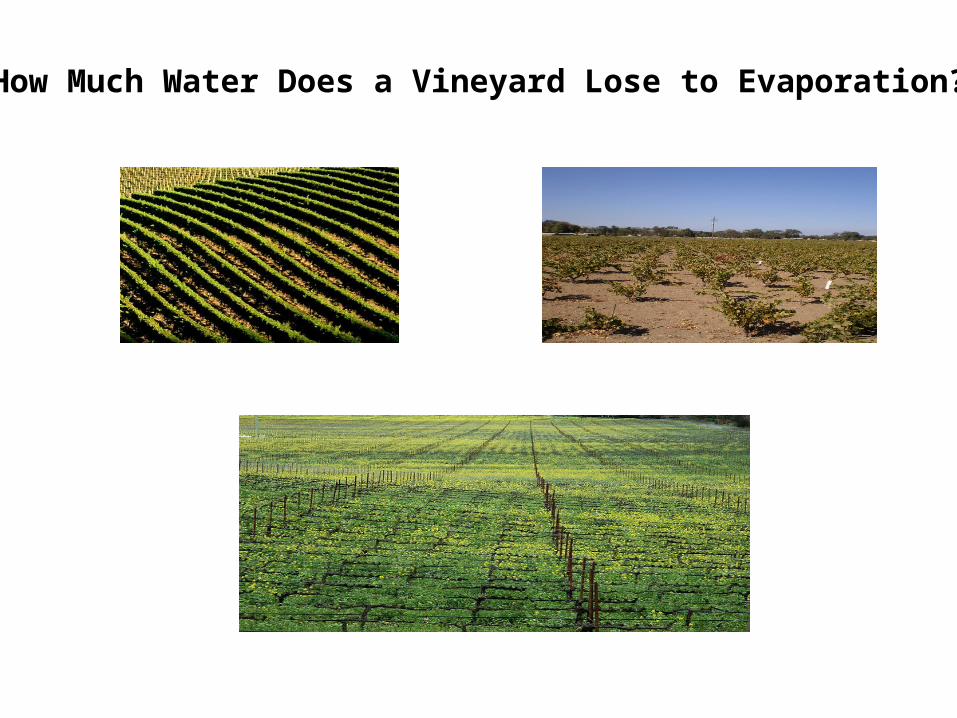
How Much Water Does a Vineyard Lose to Evaporation?

First Grand Challenges to Vintners and Viticulturalists- Regarding Water Balance of the Vineyards
• Know How Much Water the Vineyard Uses over the Year and During the Growing Season– Give it too much water costs $$$$$ in
terms of irrigating– Give it too little water may cost $$$$ in
terms of reduced yield and grape quality– Give it Optimal Levels of Water will Earn
you $$$$ in terms of producing top quality Grapes and Wine

• Know how to Evaluate Water Use across the Region as a function of:– Climate– Topography– Soil Type– Viticultural Practice, e.g. Varietal,
Planting Density and Age• Water Use of a Vineyard can be
Measured with Micrometeorological Methods
• Water Use of an Appelation can be Modeled by combining Micrometeorological Theory and Remote Sensing
Second Grand Challenges to Vintners and Viticulturalists Regarding Water Balance of the Vineyards

Third Grand, and Ultimate, Challenge• What are these Optimal Levels of Water Use
and How Do We Find Them?• ‘Know Thy Site’
– Simplest and Cheapest• Regular measurements of soil gravimetric
content– Requires scale, oven, shovel and much
replication and sampling
– Easy with Moderate Cost• Regular Measurements of Pre-Dawn Water
Potential– Measures the moisture the Roots See– Invest in ‘Pressure Bomb’, few $K– Requires much sampling and replication
– Most Expensive and Sophisticated• Regular Measurements or Simulations
with Micrometeorological Techniques– Gives you continuous and direct evaporation
measurements at the field scale
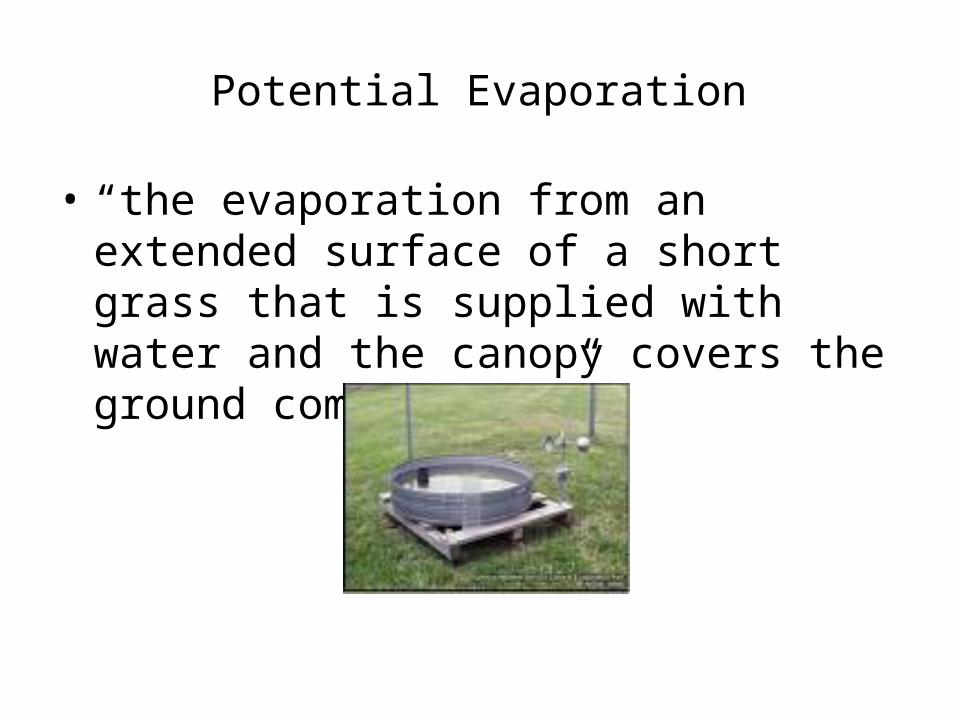
Potential Evaporation
• “the evaporation from an extended surface of a short grass that is supplied with water and the canopy covers the ground completely.”

Potential Evaporation in California Wine Regions is Large:4-5 mm/day (0.15-0.2 inch/day)
Annual Grassland, 2004
Day
0 50 100 150 200 250 300 350
E (
MJ
m-2
d-1
)
0
2
4
6
8
10
12
14
Actual LEPotential LE
Potential and Actual Evaporation are Decoupled in Semi-Arid System

The Margin for Error is Tight for Providing Optimal Water to the VineyardET = f(varietal, topography, planting density, soil type, climate, trellising)
?
?
?
E/
Eeq
Enough or Too Much Water
Too
Little
Wat
er
Volume of Water/Volume SoilFrac
tion
of P
oten
tial E
vapo
Tran
spira
tion,
ETa
ctua
l/ET
ref

Baldocchi et al., 2004 AgForMet
soil water potential (MPa)
-5 -4 -3 -2 -1 0
E/ E
eq
0.0
0.2
0.4
0.6
0.8
1.0
predawn water potentialsoil water potential
soil water potential (MPa)
-3.0 -2.5 -2.0 -1.5 -1.0 -0.5 0.0
E/ E
eq
0.00
0.25
0.50
0.75
1.00
1.25
oak savanna
annual grassland
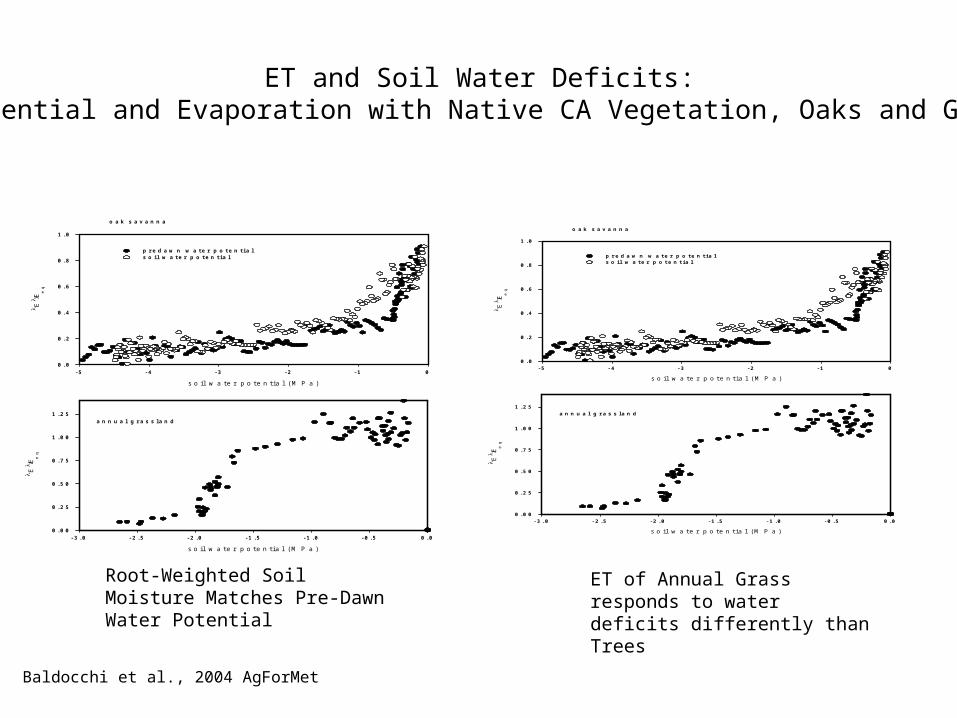
ET and Soil Water Deficits:Water Potential and Evaporation with Native CA Vegetation, Oaks and Grasslands
Root-Weighted Soil Moisture Matches Pre-Dawn Water Potential

Atmosphericradiativetransfer
Canopy photosynthesis,Evaporation, Radiative transfer
Soil evaporation
Beam PAR NIR
Diffuse PAR NIR
Albdeo->Nitrogen -> Vcmax, Jmax
LAI, Clumping-> canopy radiative transfer
dePury & Farquhar two leaf Photosynthesis model
Rnet
Surface conductance
Penman-Monteithevaporation model
Radiation at understory
Soil evaporation
shade sunlit
BESS, Breathing-Earth Science Simulator
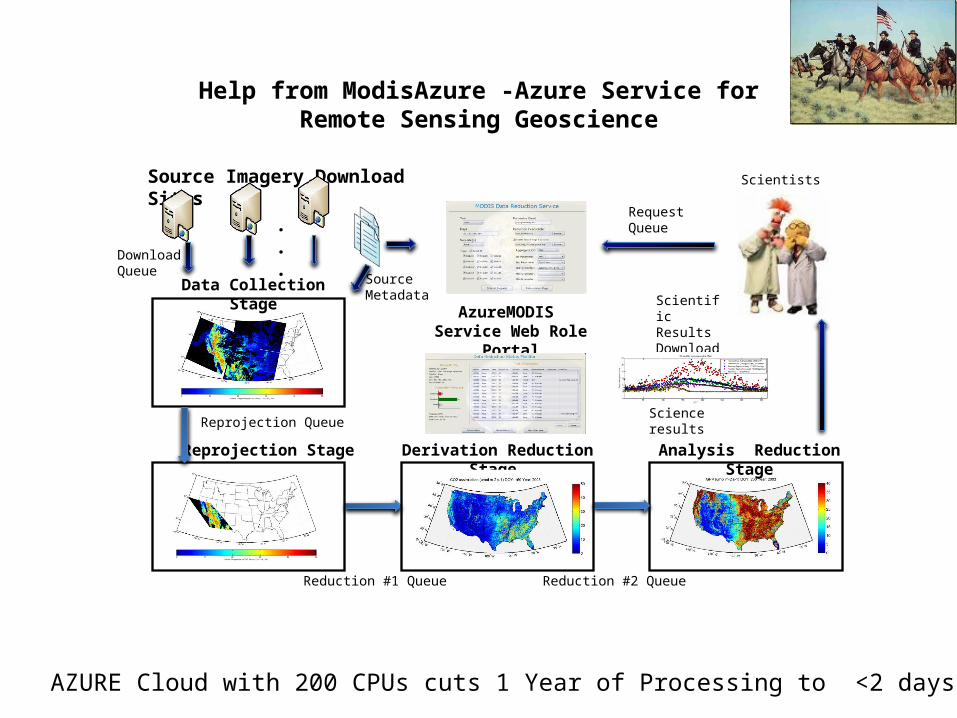
Help from ModisAzure -Azure Service for Remote Sensing Geoscience
Scientific Results Download
Reduction #1 Queue
Source Metadata
AzureMODIS Service Web Role Portal
Request Queue
Analysis Reduction Stage
Data Collection Stage
Source Imagery Download Sites
. .
.
Reprojection Queue
Derivation Reduction Stage Reprojection Stage
Reduction #2 Queue
DownloadQueue
Scientists
Science results
AZURE Cloud with 200 CPUs cuts 1 Year of Processing to <2 days

Napa County Wine Districts

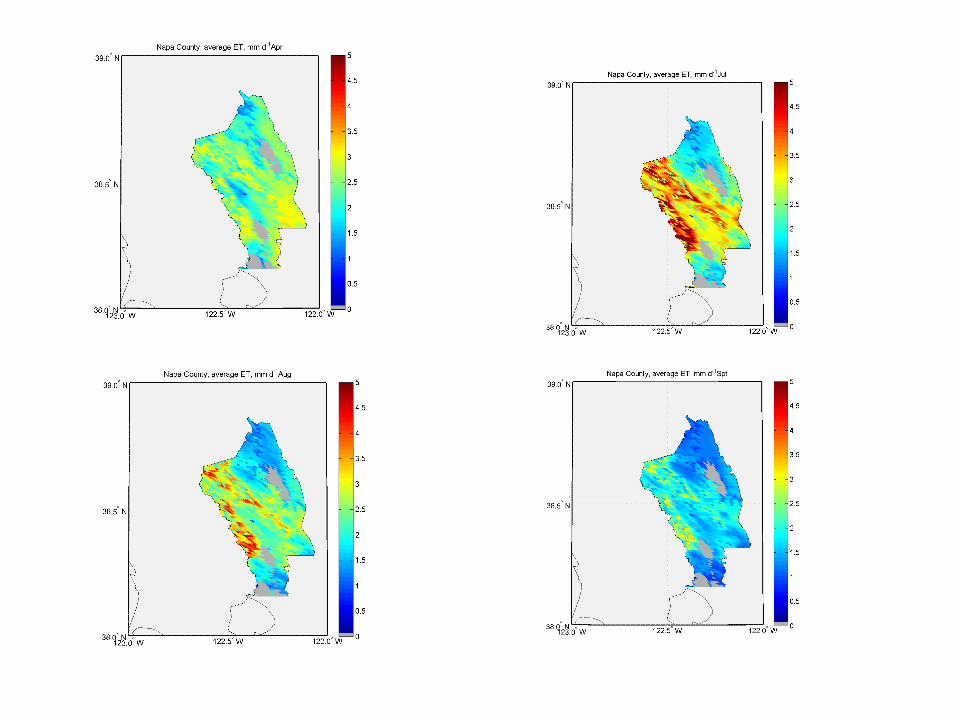
Annual Evapotranspiration, Napa County

Leaf Area Grand Growth Start
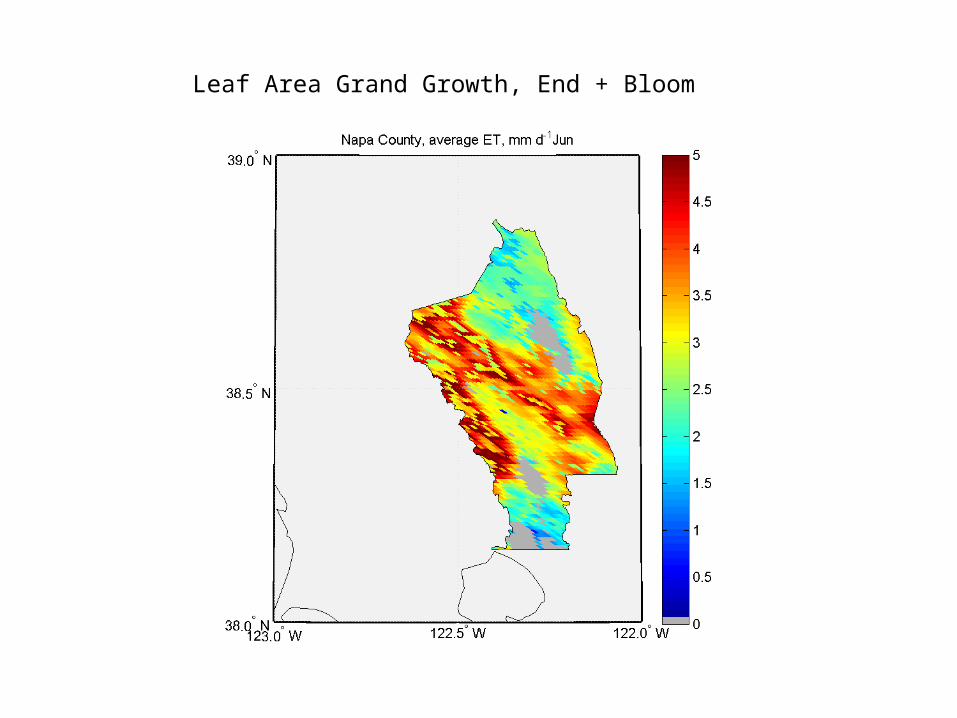
Leaf Area Grand Growth, End + Bloom

Pre_Veraison Stage

Post Veraison Summer Water Deficits

Case Study 1, Sonoma County

Compare Carneros, Valley of the Moon, Dry Creek, Russian River,
Alexander and Knights Valleys
ET ~ 20 to 30 inches per year

Seasonal Trends in Sonoma County ET
Carneros Greatest in April; Least during the Summer

Conclusions
•Actual EvapoTranspiration is Very Sensitive to Changes in Soil Moisture and Climate, so a Scientific Approach is Warranted to Manage Water Application Best.
•Mechanistic Theories and Satellite Information are Producing Maps of ET at 1 km scale across the Wine Growing Region of California
•New ET Maps can be used for Planning Vineyard Siting, Varietal Selection, Irrigation Management, Vineyard Design


Effects of Leaf Area and Photosynthetic Capacity on Normalized Evaporation:
Well-Watered Conditions
Vcmax*LAI
0 20 40 60 80 100 120 140 160 180 200
QE/Q
E,e
q
0.6
0.7
0.8
0.9
1.0
1.1
1.2
1.3
Canveg Model, Baldocchi and Meyers, 1998 AgForMet
Priestley-Taylor= 1.26

A (mol m-2 s -1)
0 1 2 3 4 5 6 7 8
gs
(mm
ol
m-2
s-1
)
0.00
0.02
0.04
0.06
0.08
0.10
0.12
0.14
0.16
0.18
0.20
oak, varying lightCa: 360 ppmTa: 25 C
Stomatal Conductance Scales with Photosynthesis
Wilson et al. 2001, Tree PhysiologySchulze et al 1994. Annual Rev Ecology
Na (g m-2)
0.0 0.5 1.0 1.5 2.0 2.5 3.0
Vcm
ax ( m
ol m
-2 s
-1)
0
20
40
60
80
Photosynthetic Capacity Scales with Nitrogen
after Schulze et al (1994)
leaf nitrogen (mg g- 1̀)
5 10 15 20 25 30 35 40
ma
xim
um
sto
ma
tal
co
nd
uc
tan
ce
(m
m s
-1)
0
2
4
6
8
10
12
14
Stomatal Conductance scales with Nitrogen
Stomatal Conductance Scales with N, via Photosynthesis

MOD04
MOD05
MOD06
MOD07
aerosol
Precipitable water
cloud
Temperature, ozone
MCD43 albedo
MOD11 Skin temperatureAtm
ospheric radiative transfer
Net radiation
MOD15 LAI
POLDER Foliage clumping
Canopy radiativetransfer
Challenge for a Computationally-Challenged Biometeorology Lab:Extracting Data Drivers from Global Remote Sensing to Run the Model
Youngryel was lonely with 1 PC

Residual Energy Balance
• Net Radiometer, NR-Lite: $1600• Soil Heat flux, Hukseflux: $500• Sonic anemometer: RM Young, 81000VRE:
$3200• Data logger: Campbell CR-1000: $1500

• as far as topicThis 2010 vintage has been really puzzling for all vineyard managers and winemakers in the sense that phenological stages were reached either later than usual or in some cases, never (some varietals had berries that never turned red).Everyone "feels" that it is climate related, without really understanding what parameters of the climate are driving those changes. I think that using ET as a way to characterize climate variations is a first step in that direction. Thus, it would be ideal if a cross vintage comparison could be shown so that people understand to which extend 2010 was different from 2009 and 2008 for instance.
Based on your suggestions, here is what I think would be interesting:1. From simple to fancy evaporation estimates measurement methods (it would be best if you could keep it very simple, without complex equations if possible !)2. Effect of evaporation on soil water balance3. Surface renewal and eddy covariance : I would not spend too much time on those for fear of losing the attention; but I think it is good to mention that this is the newest and most promising method with one "punch slide".4. Relationship between normalized Evaporation and soil moisture : this is the central piece! This would be really useful to illustrate how/why different years have different effects on soil moisture. In that part a multi- year comparison would be really relevant (if available).5. Spatial variations of normalized Evaporation : Great! I would highlight within a small geographical area (like Napa valley and Sonoma valley) what is the magnitude of the differences to be expected within a year.6. I would conclude - if possible- with a comparison of the effect that different years vs. different locations within Napa can have on evaporative demand...I think this should be a really interesting way to compare the effect of vintage vs. terroir on plant.
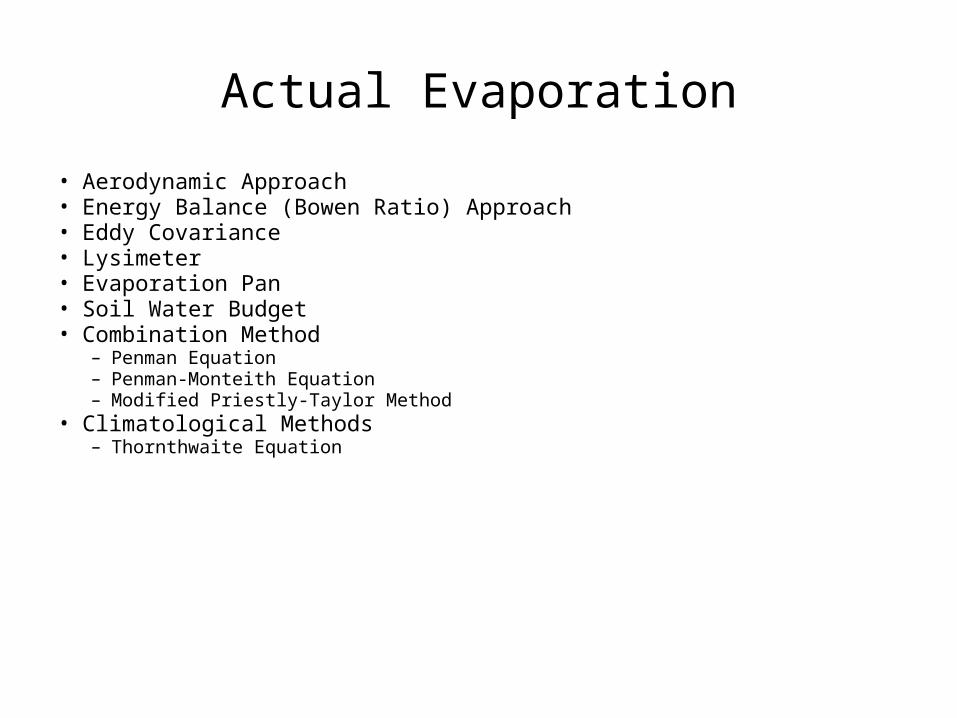
Actual Evaporation
• Aerodynamic Approach• Energy Balance (Bowen Ratio) Approach• Eddy Covariance• Lysimeter• Evaporation Pan• Soil Water Budget• Combination Method
– Penman Equation– Penman-Monteith Equation– Modified Priestly-Taylor Method
• Climatological Methods– Thornthwaite Equation

H
E
1nR G
E
2 1 2 1
2 12 1
( ) ( )
( )( )
v
a
pM
M
C T T T T
e ee e
P
Bowen Ratio Method, measured with temperature and humidity gradients

ESPM 228 Adv Topic Micromet & Biomet
KR G
Cz P
ez
n
a p
( )
R H E Gn
Energy Balance Method
Rn, net radiation flux density, W m-2
H, sensible heat flux densitylE, latent heat flux densityG, soil heat flux densityCp, specific heat of air
http://pages.unibas.ch/geo/mcr/Projects/EBEX/img_profile/profile02.jpg
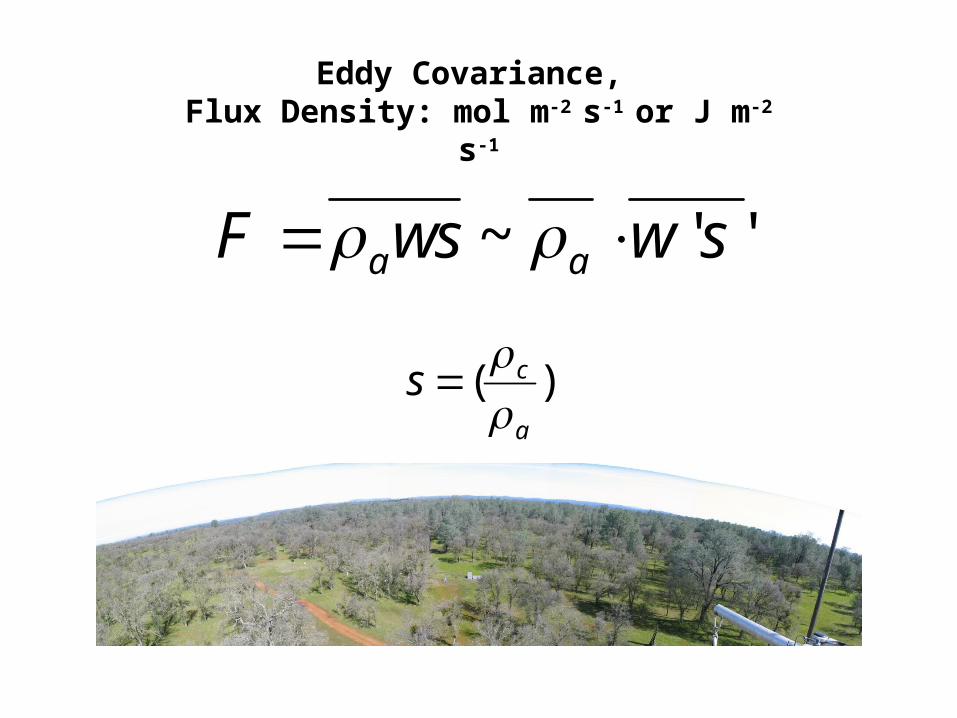
~ ' 'a aF ws w s
s c
a
( )
Eddy Covariance, Flux Density: mol m-2 s-1 or J m-2 s-1

Time
Tem
per
atu
re
a
l
s
ESPM 228 Adv Topic Micromet & Biomet
Surface Renewal
H Ca
l szp c
Paw U et al., 1989

y = 1.00x
R2 = 0.92
-200
0
200
400
600
-100 0 100 200 300 400 500
H SR (W m-2)
H
(W m
-2)
ESPM 228 Adv Topic Micromet & Biomet
Validation at Vaira Ranch
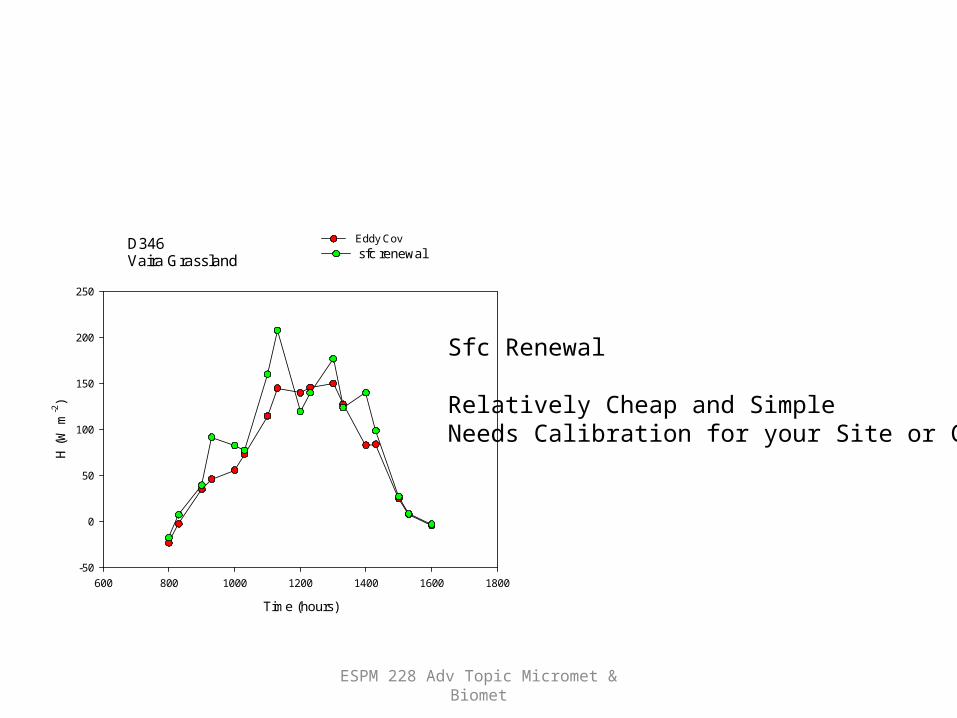
D346Vaira Grassland
Time (hours)
600 800 1000 1200 1400 1600 1800
H (
W m
-2)
-50
0
50
100
150
200
250
Eddy Cov
sfc renewal
ESPM 228 Adv Topic Micromet & Biomet
Sfc Renewal
Relatively Cheap and SimpleNeeds Calibration for your Site or Class
soil water potential (MPa)
-5 -4 -3 -2 -1 0
E/ E
eq
0.0
0.2
0.4
0.6
0.8
1.0
predawn water potentialsoil water potential
soil water potential (MPa)
-3.0 -2.5 -2.0 -1.5 -1.0 -0.5 0.0
E/ E
eq
0.00
0.25
0.50
0.75
1.00
1.25
oak savanna
annual grassland
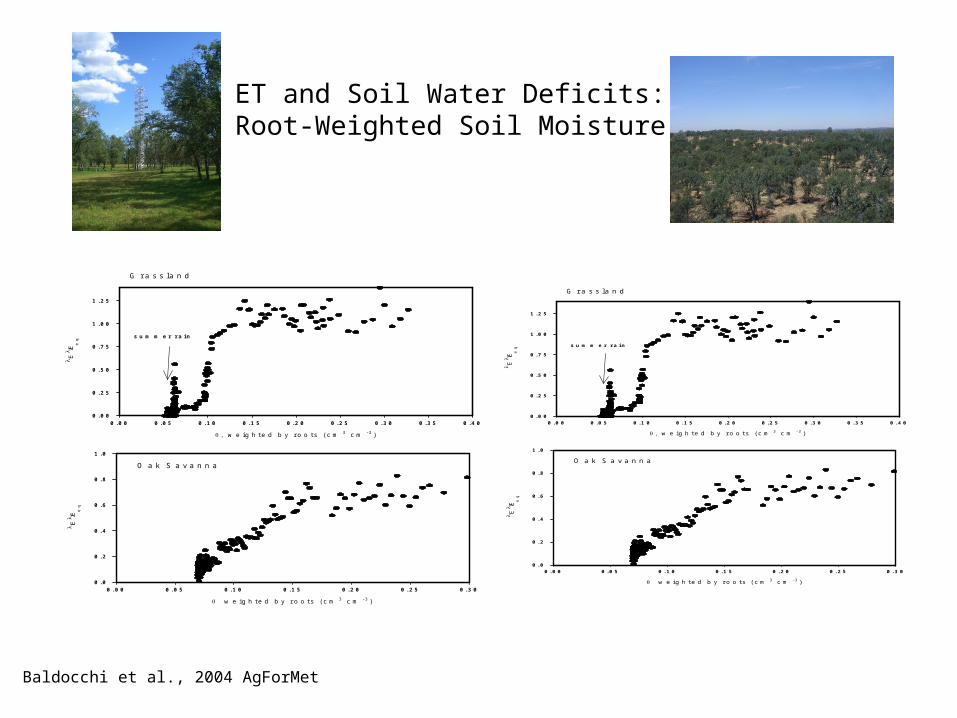
Baldocchi et al., 2004 AgForMet
soil water potential (MPa)
-5 -4 -3 -2 -1 0
E/ E
eq
0.0
0.2
0.4
0.6
0.8
1.0
predawn water potentialsoil water potential
soil water potential (MPa)
-3.0 -2.5 -2.0 -1.5 -1.0 -0.5 0.0
E/ E
eq
0.00
0.25
0.50
0.75
1.00
1.25
oak savanna
annual grassland
ET and Soil Water Deficits:Water Potential and Evaporation with Native CA Vegetation, Oaks and Grasslands
Root-Weighted Soil Moisture Matches Pre-Dawn Water Potential
ET of Annual Grass responds to water deficits differently than Trees
Grassland
weighted by roots (cm3 cm-3)
0.00 0.05 0.10 0.15 0.20 0.25 0.30 0.35 0.40
E/ E
eq
0.00
0.25
0.50
0.75
1.00
1.25
summer rain
Oak Savanna
weighted by roots(cm3 cm-3)
0.00 0.05 0.10 0.15 0.20 0.25 0.30
E/ E
eq
0.0
0.2
0.4
0.6
0.8
1.0
ET and Soil Water Deficits:Root-Weighted Soil Moisture
Baldocchi et al., 2004 AgForMet
Grassland
weighted by roots (cm3 cm-3)
0.00 0.05 0.10 0.15 0.20 0.25 0.30 0.35 0.40
E/ E
eq
0.00
0.25
0.50
0.75
1.00
1.25
summer rain
Oak Savanna
weighted by roots(cm3 cm-3)
0.00 0.05 0.10 0.15 0.20 0.25 0.30
E/ E
eq
0.0
0.2
0.4
0.6
0.8
1.0
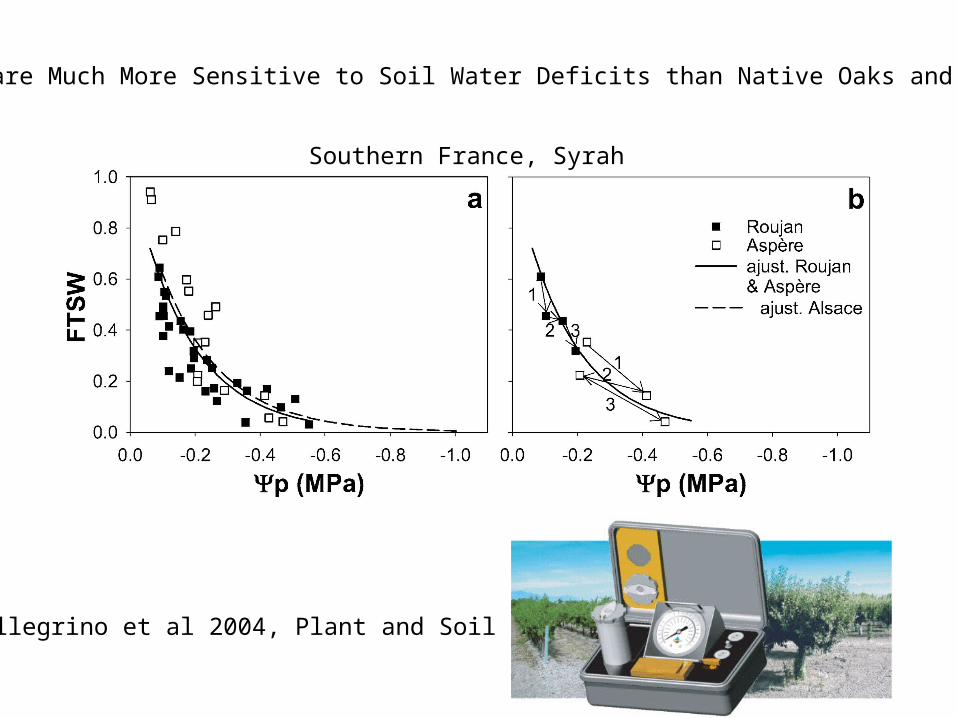
Pellegrino et al 2004, Plant and Soil
Southern France, Syrah
Grapes are Much More Sensitive to Soil Water Deficits than Native Oaks and Grasses

Williams et al. 2003 Irrigation Sci
ET Thompson Seedless, Fresno