every student. every classroom. every day. healthy kids, healthy oakland healthy kids, healthy...
TRANSCRIPT
every student. every classroom. every day.
Healthy Kids, Healthy Healthy Kids, Healthy OaklandOakland Task Force &
Opportunity Mapping Update
Jean WingResearch, Assessment & Data
January 28, 2011
2
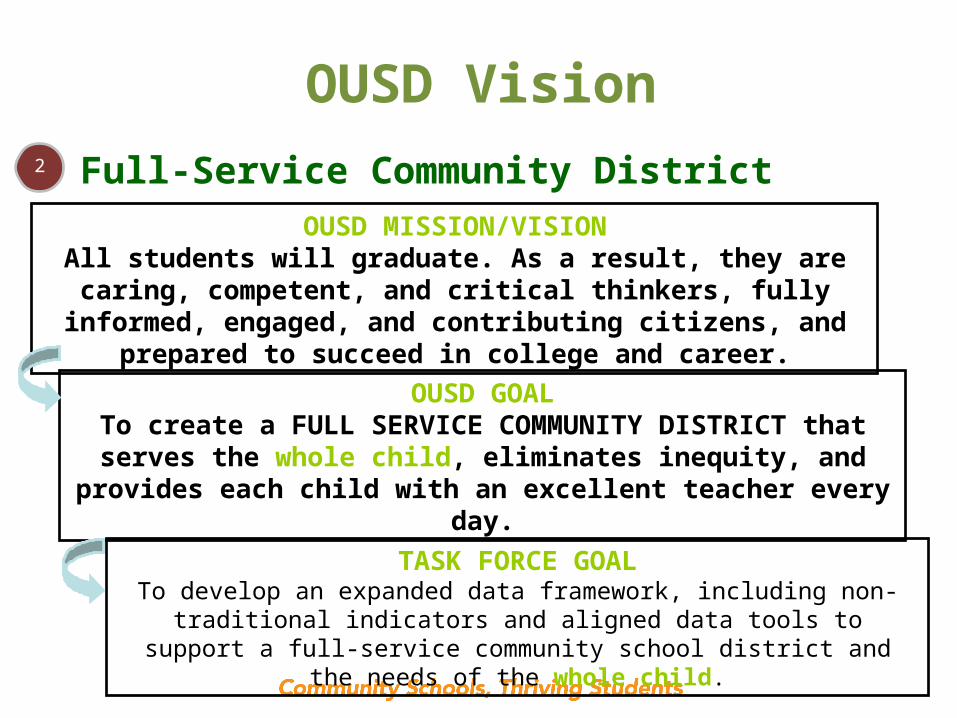
TASK FORCE GOALTo develop an expanded data framework, including non-traditional
indicators and aligned data tools to support a full-service community school district and the needs of the whole child.
OUSD MISSION/VISIONAll students will graduate. As a result, they are caring,
competent, and critical thinkers, fully informed, engaged, and contributing citizens, and prepared to
succeed in college and career.
OUSD GOALTo create a FULL SERVICE COMMUNITY DISTRICT that
serves the whole child, eliminates inequity, and provides each child with an excellent teacher every
day.
OUSD Vision
Full-Service Community District
3
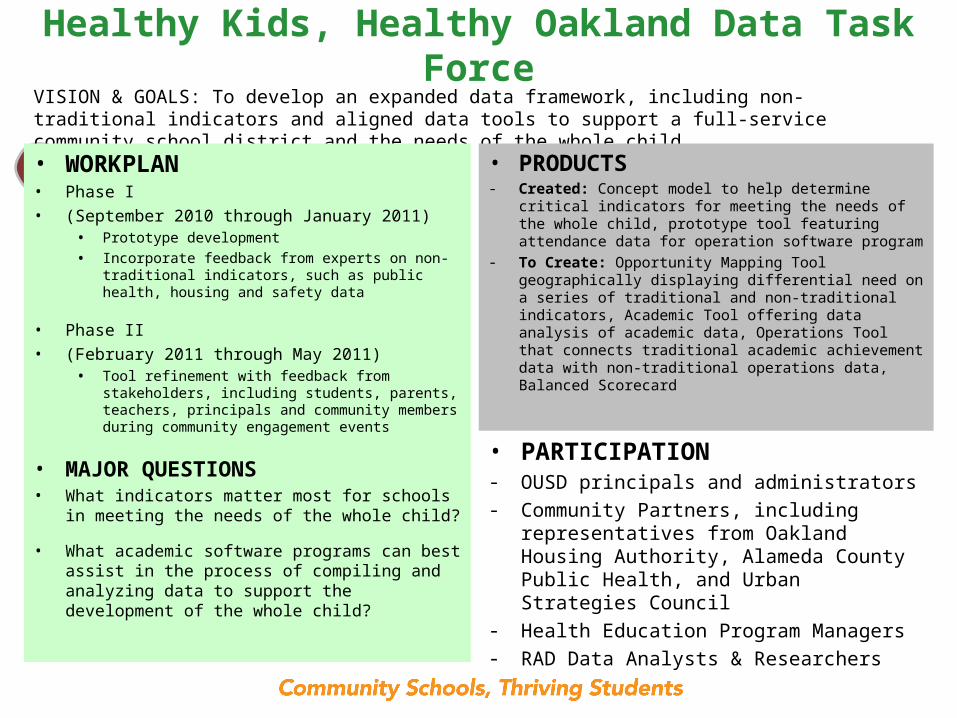
VISION & GOALS: To develop an expanded data framework, including non-traditional indicators and aligned data tools to support a full-service community school district and the needs of the whole child.
Healthy Kids, Healthy Oakland Data Task Force
• WORKPLAN• Phase I • (September 2010 through January 2011)
• Prototype development• Incorporate feedback from experts on non-
traditional indicators, such as public health, housing and safety data
• Phase II • (February 2011 through May 2011)
• Tool refinement with feedback from stakeholders, including students, parents, teachers, principals and community members during community engagement events
• MAJOR QUESTIONS• What indicators matter most for schools in
meeting the needs of the whole child?
• What academic software programs can best assist in the process of compiling and analyzing data to support the development of the whole child?
• PRODUCTS - Created: Concept model to help determine
critical indicators for meeting the needs of the whole child, prototype tool featuring attendance data for operation software program
- To Create: Opportunity Mapping Tool geographically displaying differential need on a series of traditional and non-traditional indicators, Academic Tool offering data analysis of academic data, Operations Tool that connects traditional academic achievement data with non-traditional operations data, Balanced Scorecard
• PARTICIPATION- OUSD principals and administrators- Community Partners, including
representatives from Oakland Housing Authority, Alameda County Public Health, and Urban Strategies Council
- Health Education Program Managers- RAD Data Analysts & Researchers
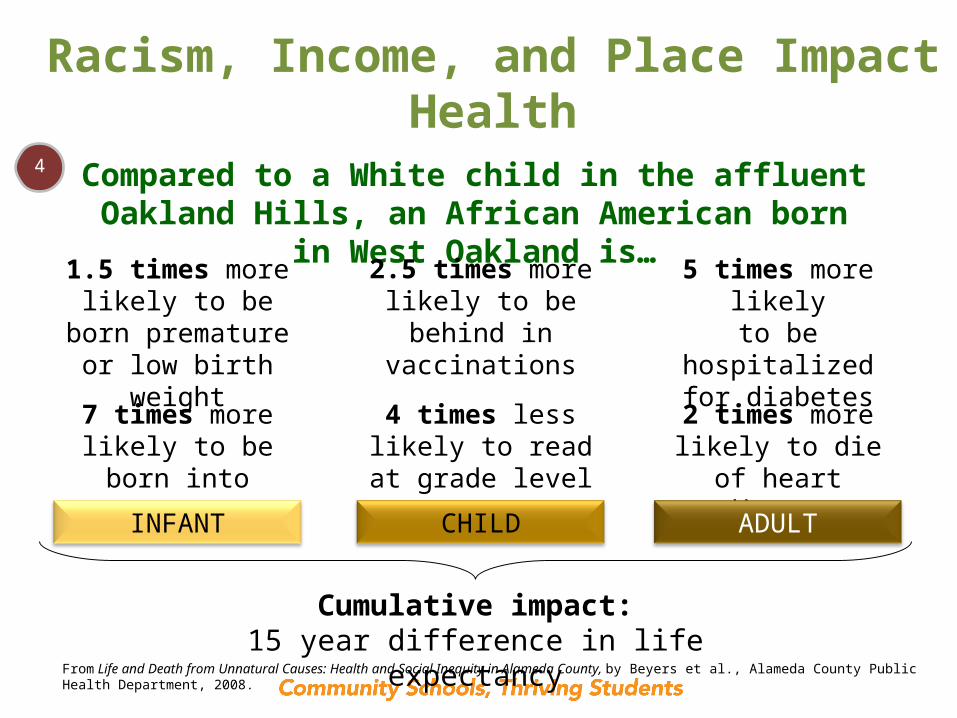
4 Compared to a White child in the affluent Oakland Hills, an African American born in
West Oakland is…1.5 times more likely to be born premature or low
birth weight
7 times more likely to be born
into poverty
2.5 times more likely to be behind
in vaccinations
4 times less likely to read at
grade level
5 times more likelyto be
hospitalized for diabetes
2 times more likely to die of heart disease
INFANT CHILD ADULT
Cumulative impact:15 year difference in life expectancy
Racism, Income, and Place Impact Health
From Life and Death from Unnatural Causes: Health and Social Inequity in Alameda County, by Beyers et al., Alameda County Public Health Department, 2008.
5
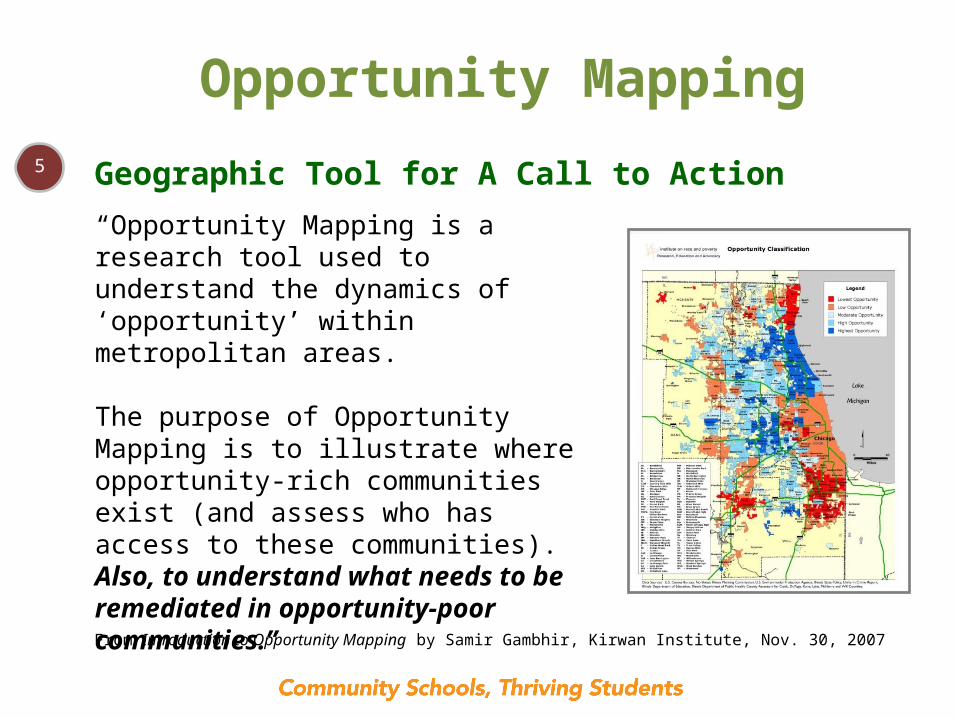
Opportunity Mapping
Geographic Tool for A Call to Action
“Opportunity Mapping is a research tool used to understand the dynamics of ‘opportunity’ within metropolitan areas.
The purpose of Opportunity Mapping is to illustrate where opportunity-rich communities exist (and assess who has access to these communities). Also, to understand what needs to be remediated in opportunity-poor communities.”
From Introduction to Opportunity Mapping by Samir Gambhir, Kirwan Institute, Nov. 30, 2007
6
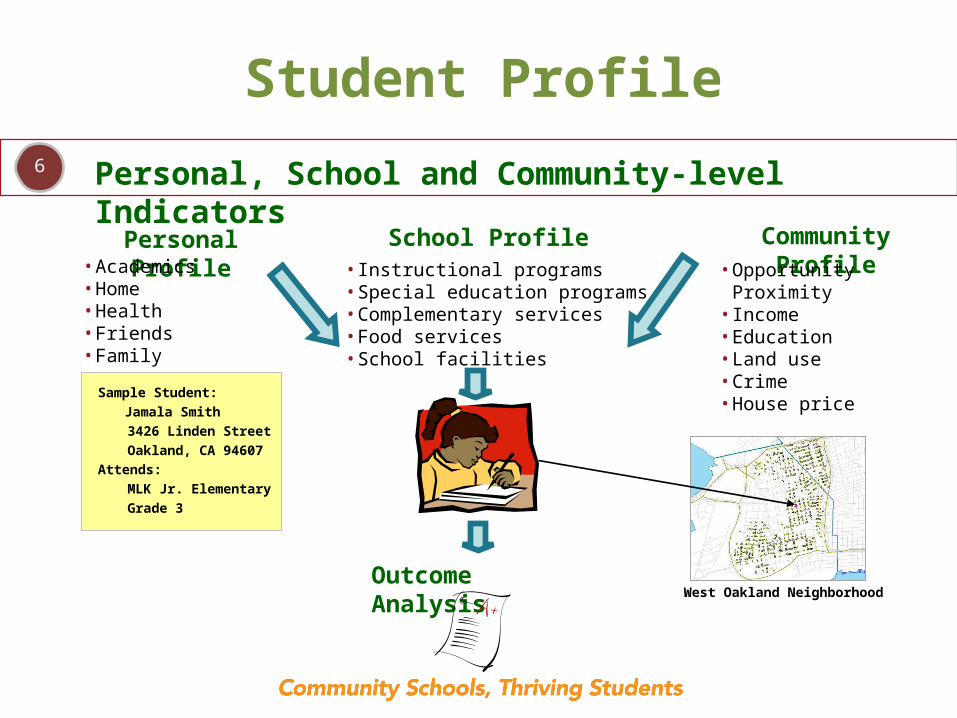
Student Profile
Personal Profile School Profile Community Profile• Academics
• Home• Health• Friends• Family
Sample Student:Jamala Smith3426 Linden StreetOakland, CA 94607
Attends:MLK Jr. ElementaryGrade 3
Outcome Analysis
• Instructional programs• Special education programs• Complementary services• Food services• School facilities
• Opportunity Proximity
• Income• Education• Land use• Crime• House price
West Oakland Neighborhood
Personal, School and Community-level Indicators
7
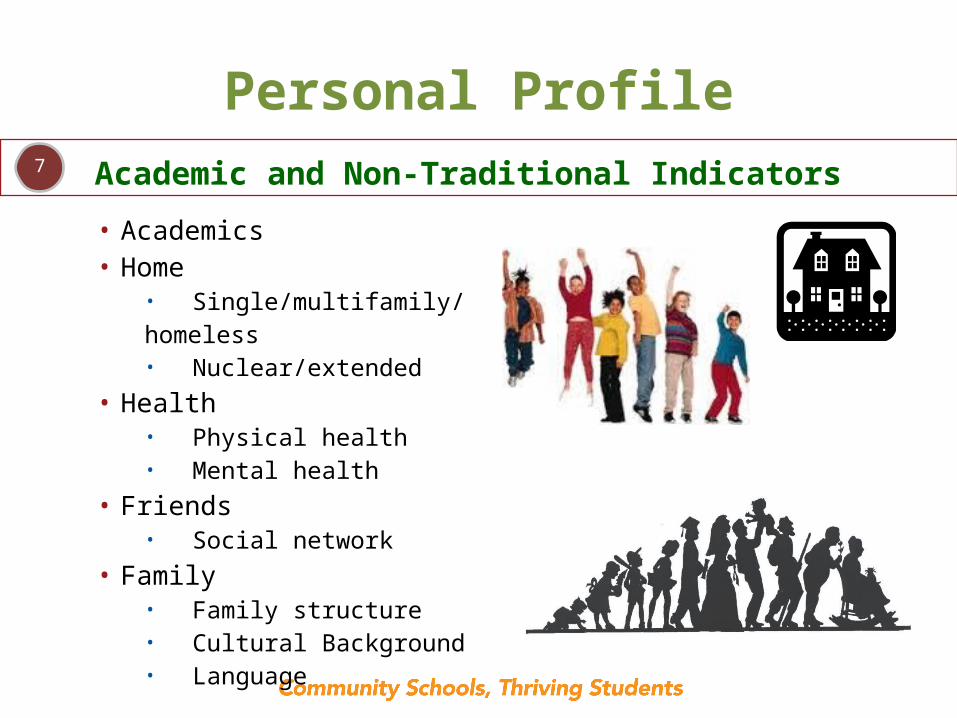
Personal Profile
• Academics• Home
• Single/multifamily/homeless• Nuclear/extended
• Health• Physical health• Mental health
• Friends• Social network
• Family• Family structure• Cultural Background• Language
Academic and Non-Traditional Indicators
8
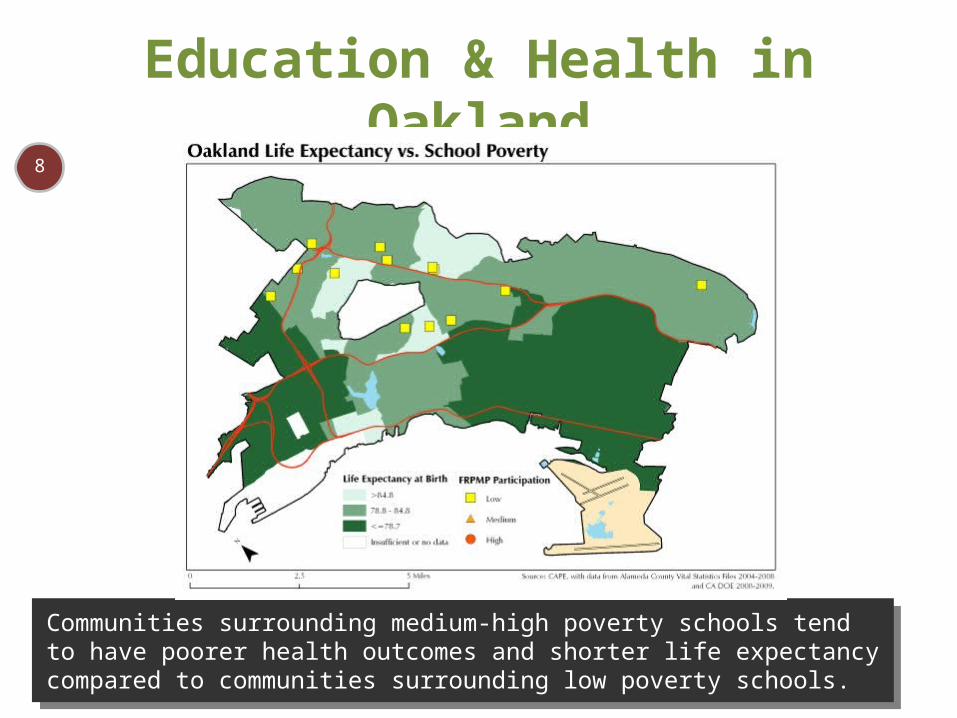
Education & Health in Oakland
Communities surrounding medium-high poverty schools tend to have poorer health outcomes and shorter life expectancy compared to communities surrounding low poverty schools.
Communities surrounding medium-high poverty schools tend to have poorer health outcomes and shorter life expectancy compared to communities surrounding low poverty schools.

9
Education & Health in Oakland
Communities surrounding medium-high poverty schools tend to have poorer health outcomes and shorter life expectancy compared to communities surrounding low poverty schools.
Communities surrounding medium-high poverty schools tend to have poorer health outcomes and shorter life expectancy compared to communities surrounding low poverty schools.

10
Education & Health in Oakland
Communities surrounding medium-high poverty schools tend to have poorer health outcomes and shorter life expectancy compared to communities surrounding low poverty schools.
Communities surrounding medium-high poverty schools tend to have poorer health outcomes and shorter life expectancy compared to communities surrounding low poverty schools.