evidence-based acc/aha guidelines for cardiovascular risk ...€¦ · evidence-based acc/aha...
TRANSCRIPT

Nathan D. Wong, PhD, FACC, FAHA Professor and Director Heart Disease Prevention Program Division of Cardiology, University of CA, Irvine Immediate Past President, American Society for Preventive Cardiology (ASPC) Chair, AHA Prevention Science Committee
Evidence-Based ACC/AHA
Guidelines for Cardiovascular Risk
Assessment

Faculty Disclosure Information
Nathan D. Wong, PhD
Research support through University of
California, Irvine from Amgen, Bristol Myers-
Squibb, Gilead, and Regeneron,
Consultant / Advisory Board for Amgen, Re-
Engineering Healthcare

Outline
• Review the role and limitations of global risk
assessment
• Review the latest evidence recommendations
for the assessment of screening tests for
atherosclerosis in CVD risk assessment
• Review the evidence and recommendations for
subclinical disease evaluation / imaging in CVD
risk assessment

Framingham Heart Study: Kannel et al., 1961

Why Use Risk Scores?
1) Framingham director Dr. William Kannel had noted risk
functions provide an “economic and efficient method of
identifying persons at high cardiovascular risk who need
preventive treatment,,,” (AJC 1976)
2) The ACC Bethesda Conf. noted intensity of treatment
should match a person’s risk (Califf RM, JACC 1996).
3) A physician’s estimate is only accurate 24% of the time
(Pignone et al, BMC health Serv Res 2003).
4) Routine use of global risk scores leads to greater use of
guideline-based therapy and modest improvements in
intermediate outcomes with no harm identified (Sheridan
et al. BMC Health Serv Res 2008).

Recommendation to begin with a global risk
assessment using the Pooled Cohort Equations to
estimate 10-year ASCVD Risk
(other risk assessment algorithms include the
European SCORE, PROCAM, or Framingham scores)

What are the Pooled Cohort Equations and
how do they differ from the Framingham Risk
Scores used before?
1) The new equations now predict 10-year risk of
both CHD and stroke (ASCVD) together rather
than just CHD which was the focus of the 2001
ATP III Framingham Risk Score recommended.
2) They predict nonfatal MI, CHD death, or nonfatal
or fatal stroke ONLY and do not include other
CVD (PCI, CABG, unstable angina requiring
hospitalization, PAD, etc.). Risk will be up to 2X
higher for total CVD.

How well do the new risk scores predict
future CHD risk and how should they be
used?
1) The new equations are more precise in
incorporating 4 cohorts: Framingham (original and
offspring), ARIC, CARDIA, and CHS, but are limited to the
risk factors common to these studies.
2) They have been validated in several cohorts; in
very healthy cohorts including persons on statin therapy
there may be some overprediction of risk
3) They should be used as a starting point to help
identify those most likely to benefit from a statin; other
tests may help refine the treatment decision if uncertain
4) They should be an impetus for a “risk discussion”
between the clinician and patient, BUT not a prescription
for a statin or other therapy

Recommendations for Assessment of 10-
Year Risk of a First Hard ASCVD Event
The race- and sex-specific Pooled Cohort
Equations* to predict 10-year risk of a first
hard ASCVD event should be used in non-
Hispanic African Americans and non-
Hispanic whites, 40 to 79 years of age.
I IIa IIb III
I IIa IIb III Use of the sex-specific Pooled Cohort
Equations for non-Hispanic whites may be
considered for estimation of risk in patients
from populations other than African
Americans and non-Hispanic whites. *Derived from the ARIC study, CHS, CARDIA study, Framingham original and
offspring cohorts.

Recommendations for Long-Term
Risk Assessment
It is reasonable to assess traditional ASCVD risk
factors‡ every 4 to 6 years in adults 20 to 79 years
of age who are free from ASCVD and to estimate
10-year ASCVD risk every 4 to 6 years in adults 40
to 79 years of age who are free from ASCVD.
I IIa IIb III
I IIa IIb III Assessment of 30-year or lifetime ASCVD risk
on the basis of traditional risk factors‡ may be
considered in adults 20 to 59 years of age who
are free from ASCVD and who are not at high
short-term risk. ‡Age, sex, total cholesterol, high-density lipoprotein cholesterol, systolic BP,
use of antihypertensive therapy, diabetes, and current smoking.

2013 Prevention Guidelines ASCVD Risk Estimator
Available at www.cardiosouce.com or www.clincalc.com

Risk Factor Units Value
Acceptable
range of
values
Optimal
values
Sex M or F F M or F
Age years 55 20-79
Race AA or WH AA AA or WH
Total Cholesterol mg/dL 210 130-320 170
HDL-Cholesterol mg/dL 56 20-100 50
Systolic BP mm Hg 145 90-200 110
Treatment for High BP Y or N Y Y or N N
Diabetes Y or N N Y or N N
Smoker Y or N N Y or N N
ASCVD Risk Calculator: Pooled Cohort Equations (cont.)

ASCVD Risk Calculator: 55 Year Old African-American and White Women
7.7
1.83.6
1.40
1
2
3
4
5
6
7
8
9
10
Your 10-YearASCVD Risk (%)
Optimal (%) Your 10-YearASCVD Risk (%)
Optimal (%)
10
-Ye
ar
AS
CV
D R
isk
(%
)
African American
Women
White
Women

SCORE 10-
Year Fatal CVD
Risk
Algorithm:
High Risk
Countries
<1% low
1-<5% moderate
5-<10% high
>=10% very high

SCORE 10-Year
CVD Risk
Algorithm: Low
Risk Countries
<1% low
1-<5% moderate
5-<10% high
>=10% very high

Illustration
of the Risk
Age
Concept
From the
European
SCORE
Algorithms

The Detection Gap in CHD
“Despite many available risk assessment
approaches, a substantial gap remains in
the detection of asymptomatic individuals
who ultimately develop CHD”
“The Framingham and European risk
scores… emphasize the classic CHD risk
factors…. is only moderately accurate for
the prediction of short- and long-term risk of
manifesting a major coronary artery
event…” Pasternak and Abrams et al. 34th Bethesda conf. JACC 2003; 41: 1855-1917

Criteria required for a good screening test
• Provides an accurate determination of the
likelihood that an asymptomatic person has the
condition (accuracy)
• Reproducible results (reliability)
• Detect individuals where early intervention is
likely to have a beneficial impact
• Should provide incremental value to risk
predicted by office-based risk assessment
Redberg and Vogel et al., 34th Bethesda Conf. JACC 2003; 41: 1855-1917


ACC/AHA 2013 CVD Risk Assessment
Guidelines: Critical Question #1
• CQ1: “What is the evidence with regard to
reclassification or contribution to risk assessment
when the following are considered in addition to the
variables that are in the traditional risk scores?”
• High-sensitivity C-reactive protein
• Apolipoprotein B
• Glomerular filtration rate
• Microalbuminuria
• Family history
• Cardiorespiratory fitness
• Ankle-brachial index
• Carotid intima-media thickness
• Coronary artery calcium score

Recommendations for Use of Newer Risk Markers
After Quantitative Risk Assessment
If, after quantitative risk assessment, a risk-
based treatment decision is uncertain,
assessment of ≥1 of the following—family
history, hs-CRP, CAC score, or ABI—may be
considered to inform treatment decision
making.†
Routine measurement of carotid intima-
media thickness is not recommended in
clinical practice for risk assessment for a
first ASCVD event.†
I IIa IIb III
†Based on new evidence reviewed during ACC/AHA update of
evidence.
I IIa IIb III
No Benefit


ESC European CVD Prevention 2012 Guidelines:
Recommendations Regarding Imaging Methods

Carotid B-Mode Ultrasonography
• Measurement of intimal medial thickness
• Non-invasive, inexpensive, no radiation
• Well-established as an indicator of cardiovascular risk
from epidemiologic studies
• Published clinical trials on utility of carotid IMT as
measure of atherosclerosis and effects of therapy
• Accuracy of assessments depends on experience of those
interpreting scans
• ACCF/AHA 2010 and ESC 2012 Guideline: CIMT
measurement may be reasonable for CV risk
assessment in asymptomatic adults at intermediate
risk (Class IIa-B)
• ***However, the 2013 ACC/AHA guideline does not
recommend is measurement for risk assessment.

Date of download: 1/9/2014 Copyright © 2014 American Medical
Association. All rights reserved.
Common Carotid Intima-Media Thickness Measurements in
Cardiovascular Risk Prediction:
A Meta-analysis: 14 cohorts, 45,828 subjects, 11 year follow-up
JAMA. 2012;308(8):796-803. doi:10.1001/jama.2012.9630
A, Individuals without and with events classified according
to their 10-year absolute risk to develop a myocardial
infarction or stroke predicted with the Framingham Risk
Score variables or classified according to their 10-year
absolute risk to develop a first-time myocardial infarction
or stroke predicted with the Framingham Risk Score and a
common carotid intima-media thickness (CIMT)
measurement. B, Observed Kaplan-Meier absolute risk
estimates for all individuals (with and without events). The
observed risk in reclassified individuals is significantly
different from the observed risk of the individuals in the
gray cells.

CIMT w/w/o Plaque and CHD Incidence: ARIC Study (Nambi et al., JACC 2010)

23% of 13,145 eligible subjects were reclassified by adding CIMT and plaque information over traditional risk factors
Improvement in Net Reclassification of
Subjects by CIMT and plaque over risk
factors (Nambi et al., JACC 2010)

Ankle-brachial blood pressure (ABI) – Simple noninvasive test to confirm lower extremity peripheral
arterial disease (PAD)
– Uses Doppler probe to measure SBP in brachial, posterial
tibial, and dorsalis pedis arteries
• The higher of the SBP measures taken in each arm is the
denominator for the ABI calculation for each leg.
• The higher of the two pressures in each ankle (from
posterior tibial and dorsalis pedis arteries) forms the
numerator for the left and right ABI, respectively.
– ABI <0.9 in either leg is diagnostic of PAD
– Test most useful in those over 50 who have other risk factors
– ACCF/AHA 2010 Guideline: Measurement reasonable for CV
risk assessment in asymptomatic adults at intermediate risk
(IIa-B); ALSO recommended by 2013 ACC/AHA Guideline
(Iib-B)

ABI and Total Mortalty (ABI Collaboration, JAMA 2008)

Reclassification of Risk Category from ABI (ABI Collaboration, JAMA 2008)
19% of men and 38% of women would be reclassified in
their risk category from addition of ABI.

Coronary Calcium and Atherosclerosis: Pathology Evidence
• Coronary calcium invariably
indicates the presence of
atherosclerosis, but
atherosclerotic lesions do not
always contain calcium (1-3).
• Calcium deposition may occur
early in life, as early as the
second decade, and in lesions
that are not advanced (4-5).
• Correlates with plaque burden;
highly sensitive for angiographic
disease
1) Wexler et al., Circ 1996; 94: 1175-92, 2) Blankenhorn and Stern, Am J Roentgenol 1959;
81: 772-7, 3) Blankenhorn and Stern, Am J Med Sci 1961; 42: 1-49, 4) Stary, Eur Heart J
1990; 11(suppl E): 3-19, 5) Stary, Arteriosclerosis 1989; 9 (suppl I): 19-32.

Cumulative Incidence of Any Coronary Event: MESA Study (Detrano et al., NEJM 2008)

Risk Factor-Adjusted Hazard Ratios by Coronary Calcium Score: MESA Study (Detrano et al., NEJM 2008)

Area Under Curve for Risk Factors Alone and Risk Factors Plus CAC by Ethnic Group: MESA Study (Detrano et al., NEJM 2008)
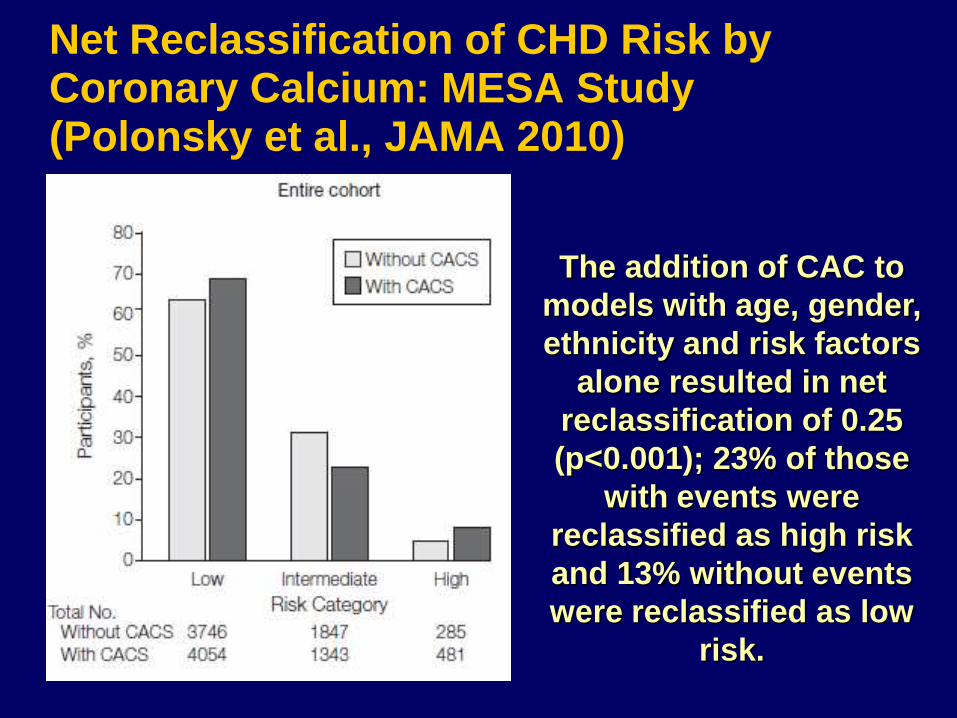
Net Reclassification of CHD Risk by Coronary Calcium: MESA Study (Polonsky et al., JAMA 2010)
The addition of CAC to
models with age, gender,
ethnicity and risk factors
alone resulted in net
reclassification of 0.25
(p<0.001); 23% of those
with events were
reclassified as high risk
and 13% without events
were reclassified as low
risk.

What is the value of CAC =0? Warranty against CVD events for >=5 Years
Study Type Population
(n)
CAC=0 (%) FU
(Years)
Number of
events (%)
Meta-Analysis * 71,595 29,312
(41%)
4.3 154 (0.47%)
CVD events
Retrospective** 44,052 19,898
(45%)
5.6 104 (0.52%)
Deaths
Prospective*** 6,809 3,414 (50%) 4.1 17 (0.52%)
CHD events
*Sarwar A, Shaw LJ, Shapiro MD, Blankstein R, Hoffman U, Brady TJ, Cury R, Budoff MJ,
Blumenthal RS, Nasir K. JACC Imaging 2009
** Blaha M, Budoff MJ, Shaw LJ, Khosa F, Rumberger JA, Berman D, Callister T, Raggi P,
Blumenthal RS, Nasir K. JACC Imaging 2009
*** Budoff M, McClelland R, Nasir K, Greenland P, Kronmal RA, Kondos G, Shea S,
Lima JAC, Blumenthal RS. Am Heart J 2009

Annual CHD Event Rates (in %) by Calcium Score Events by
CAC Categories in Subjects with DM, MetS, or Neither Disease
(Malik and Wong et al., Diabetes Care 2011)
Coronary Heart Disease
Coronary Artery Calcium Score
ACCF/AHA 2010 Guideline: CAC Scoring for CV risk assessment in
asymptomatic adults aged 40 and over with diabetes (Class IIa-B)
01-99
100-399400+
Neither MetS/DM
MetS
DM
0.4
1.5 1.9
4
0.20.8
2.1
3.5
0.1 0.41.3
2.2
00.5
11.5
22.5
33.5
4
Annual
CHD
Event
Rate

ACC/AHA 2013 Guideline: IIb-B
“..Assessing CAC is likely to be the most useful of the
current approaches to improving risk assessment among
individuals found to be at intermediate risk after formal
risk assessment”
2010 ACC/AHA Greenland et al. Risk Assessment

In 703 men and women aged 28-84 who received scanning for coronary
calcium by EBCT, calcium score remained independently
associated with:
new aspirin usage
new cholesterol medication
consulting with a physician
losing weight
decreasing dietary fat
…but also increased worry
…..potentially important risk-reducing behaviors may be reinforced by the knowledge of a positive coronary artery scan, independent of preexisting coronary risk factor status.
Wong ND et al, Am J Cardiol. 1996 Dec 1;78(11):1220-3.
Does coronary artery screening by electron
beam computed tomography
motivate potentially beneficial lifestyle behaviors?

Impact of Coronary Artery Calcium Scanning on Coronary Risk Factors and Downstream Testing (Rozanski A et al. JACC 2011)
• We compared the clinical impact of conventional
risk factor modification to that associated with the
addition of coronary artery calcium (CAC)
scanning.
• 2,137 volunteers underwent CAC scanning or did
not undergo CAC scanning before risk factor
counseling.
• Primary end point was 4-year change in coronary
artery disease risk factors and Framingham Risk
Score; also examined medical resource utilization

Eisner Study Results
– Compared with the no-scan group, the scan group
showed improvement in systolic blood pressure (p
= 0.02) and LDL-C (p = 0.04), and waist circum in
those with increased abdominal girth (p = 0.01).
– Increase in Framingham Risk Score (FRS) in the
no-scan group, but no change in the scan group
(0.7 ± 5.1 vs. 0.002 ± 4.9, p = 0.003).
– Within the scan group, increasing baseline CAC
score was associated with an improvement in risk
factors and FRS (p<0.01).
– Downstream medical testing and costs in the scan
group were similar to the no-scan group.

Radiation dose
• “dose [EBT dose 0.7 mSv, MDCT dose 1.5
mSv]”
– AHA Scientific Statement Circulation
2005
• CAC Dose = 1 mSv (Gerber AHA Scient
Statement on Ionizing Radiation 2009)
– Similar to Mammogram
– Similar to long distance air flight
– 1/3 annual background radiation

Can Screening for Atherosclerosis Identify Those Most
Likely to Benefit from Lipid-Lowering Therapy?

Intermediate Risk
MESA Subjects
(n=1330)
C-statistics:
FRS alone 0.623
FRS+CAC 0.784 (p<0.001)
FRS+CIMT 0.652 (p=0.01)
FRS+FMD 0.639 (p=0.06)
FRS+CRP 0.640 (p=0.03)
FRS+FamHx 0.675
(p=0.001)
FRS+ABI 0.650 (p=0.01)
Yeboah J et al, JAMA 2012
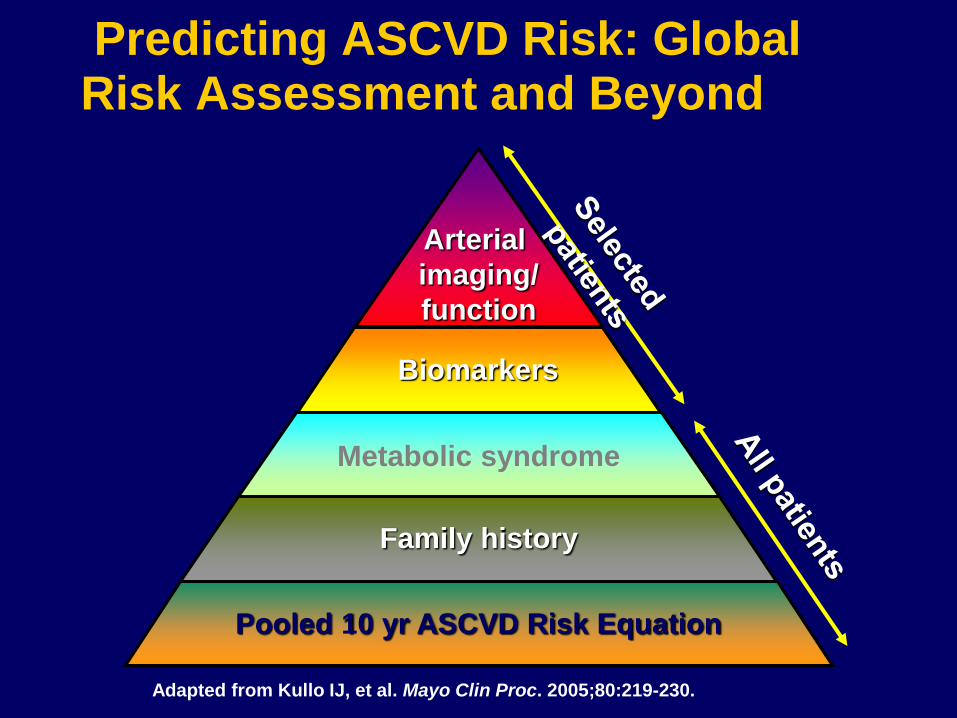
Predicting ASCVD Risk: Global Risk Assessment and Beyond
Adapted from Kullo IJ, et al. Mayo Clin Proc. 2005;80:219-230.
Arterial
imaging/
function
Metabolic syndrome
Biomarkers
Pooled 10 yr ASCVD Risk Equation
Family history

Summary
• Global risk assessment is the foundation for CVD risk
evaluation in asymptomatic individuals.
• Screening tests for subclinical atherosclerosis can be
recommended for further refinement of CVD risk prediction
over global risk assessment.
• Guidelines suggest intermediate risk subjects may be
suitable for such screening to identify those needing more
aggressive risk factor intervention.
• New 2013 ACC/AHA guidelines recommend assessment of
family history, hs-CRP, CAC, or ABI when the treatment
decision based on global risk scoring is uncertain
• However, it is not known whether screening for subclinical
atherosclerosis will ultimately lead to long-term clinical
benefit and save lives.

www.aspconline.org
www.fusion-
conferences.com
Thank You!