2013 aha/acc guideline on lifestyle management to reduce cardiovascular risk endorsed by the...
TRANSCRIPT
2013 AHA/ACC Guideline on Lifestyle Management to
Reduce Cardiovascular Risk
Endorsed by the American Association of Cardiovascular and Pulmonary Rehabilitation, American Pharmacists Association, American Society for Nutrition, American Society for Preventive Cardiology, American Society of Hypertension, Association of Black Cardiologists, National Lipid Association, Preventive Cardiovascular Nurses Association, and WomenHeart: The National Coalition for Women with Heart Disease
© American College of Cardiology Foundation and American Heart Association, Inc.

CitationThis slide set is adapted from the 2013 AHA/ACC Guideline on Lifestyle Management to Reduce Cardiovascular Risk. E-Published on November 12, 2013, available at:
http://content.onlinejacc.org/article.aspx?doi=10.1016/j.jacc.2013.11.003 and
http://circ.ahajournals.org/lookup/doi/10.1161/01.cir.0000437740.48606.d1
The full-text guidelines are also available on the following Web sites:ACC (www.cardiosource.org) and AHA (my.americanheart.org)
*Ex-Officio Members
AHA/ACC Lifestyle Guideline Work GroupRobert H. Eckel, MD, FAHA, Co-Chair
John M. Jakicic, PhD, Co-Chair
Jamy D. Ard, MDJanet M. de Jesus, MS, RD*Nancy Houston Miller, RN, BSN, FAHAVan S. Hubbard, MD, PhD*I-Min Lee, MD, ScDAlice H. Lichenstein, DSc, FAHACatherine M. Loria, PhD, FAHA*
Barbara E. Millen, DrPH, RD, FADACathy A. Nonas, MS, RDFrank M. Sacks, MD, FAHASidney C. Smith, Jr, MD, FACC, FAHALaura P. Svetkey, MD, MHSThomas W. Wadden, PhDSusan Z. Yanovski, MD*
Acknowledgements Methodology MembersKarima A. Kendall, PhDLaura C. Morgan, MA
Michael G. Trisolini, PhD, MBAGeorge VelascoJanusz Wnek, PhD
National Heart, Lung, and Blood InstituteKathryn Y. McMurry, MS
Glen Bennett, M.P.H.Denise Simons-Morton, MD, PhD
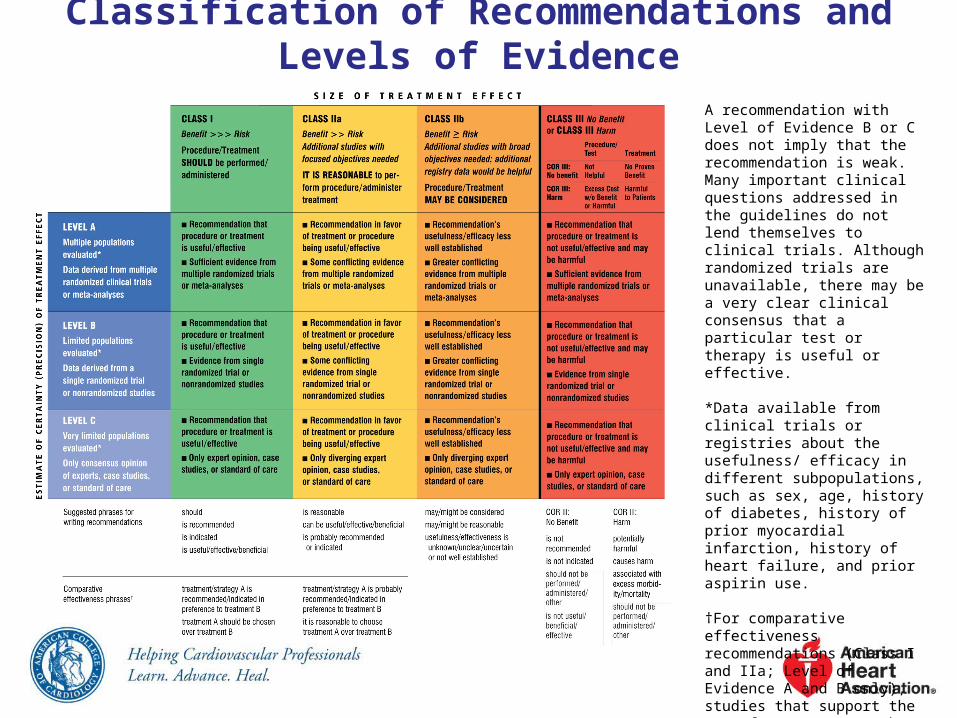
Classification of Recommendations and Levels of Evidence
A recommendation with Level of Evidence B or C does not imply that the recommendation is weak. Many important clinical questions addressed in the guidelines do not lend themselves to clinical trials. Although randomized trials are unavailable, there may be a very clear clinical consensus that a particular test or therapy is useful or effective. *Data available from clinical trials or registries about the usefulness/ efficacy in different subpopulations, such as sex, age, history of diabetes, history of prior myocardial infarction, history of heart failure, and prior aspirin use.
†For comparative effectiveness recommendations (Class I and IIa; Level of Evidence A and B only), studies that support the use of comparator verbs should involve direct comparisons of the treatments or strategies being evaluated.

NHLBI Grading the Strength of Recommendation
Grade Strength of Recommendation
AStrong recommendation: There is high certainty based on evidence that the net benefit is substantial.
BModerate recommendation: There is moderate certainty based on evidence that the net benefit is moderate to substantial, or there is high certainty that the net benefit is moderate.
CWeak recommendation: There is at least moderate certainty based on evidence that there is a small net benefit.
DRecommendation against: There is at least moderate certainty based on evidence that it has no net benefit or that risks/harms outweigh benefits.
E
Expert opinion (“There is insufficient evidence or evidence is unclear or conflicting, but this is what the Panel recommends.”)
Net benefit is unclear. Balance of benefits and harms cannot be determined because of no evidence, insufficient evidence, unclear evidence, or conflicting evidence, but the Panel thought it was important to provide clinical guidance and make a recommendation. Further research is recommended in this area.
N
No recommendation for or against (“There is insufficient evidence or evidence is unclear or conflicting.”) Net benefit is unclear. Balance of benefits and harms cannot be determined because of no evidence, insufficient evidence, unclear evidence, or conflicting evidence, and the Panel thought no recommendation should be made. Further research is recommended in this area.

Quality Rating the Strength of EvidenceQuality Rating Type of Evidence
High
• Well-designed, well-executed RCTs that adequately represent populations to which the results are applied and directly assess effects on health outcomes. • Met-analyses of such studies.Highly certain about the estimate of effect. Further research is unlikely to change the Panel’s confidence in the estimate of effect.
Moderate
• RCTs with minor limitations affecting confidence in, or applicability of, the results.• Well-designed, well-executed nonrandomized controlled studies and well-designed, well-executed observational studies.• Meta-analyses of such studies.Moderately certain about the estimate of effect. Further research may have an impact on the Panel’s confidence in the estimate of effect and may change the estimate.
Low
• RCTs with major limitations.• Nonrandomized controlled studies and observational studies with major limitations affecting confidence in, or applicability of, the results.• Uncontrolled clinical observations without an appropriate comparison group (e.g., case series, case reports).• Physiological studies in humans. • Meta-analyses of such studies.Low certainty about the estimate of effect. Further research is likely to have an impact on the Panel’s confidence in the estimate of effect and is likely to change the estimate.
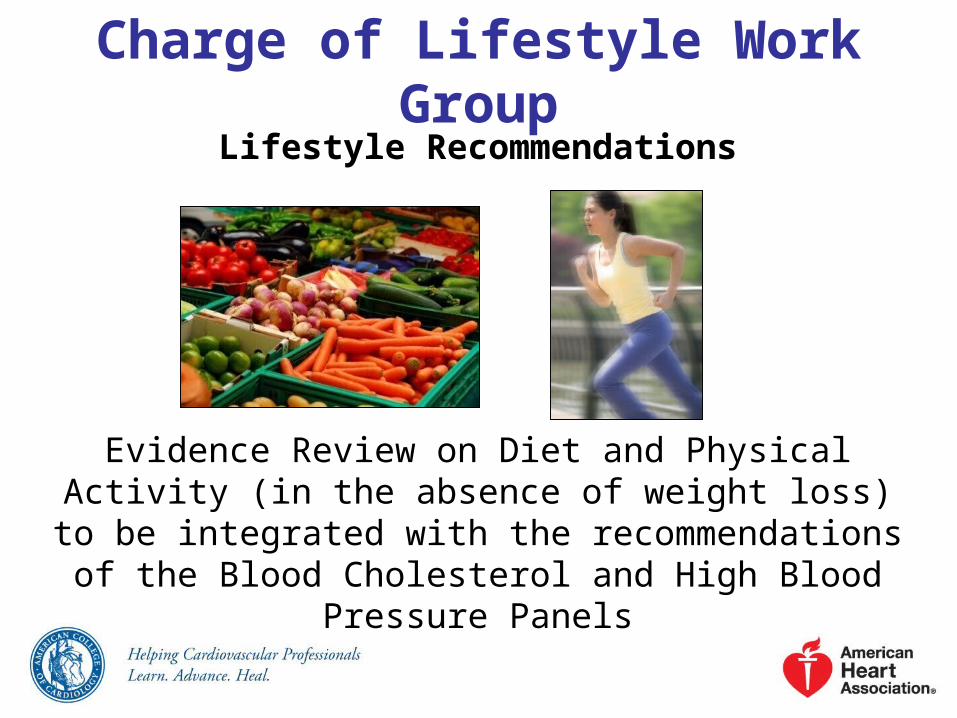
Charge of Lifestyle Work Group
Lifestyle Recommendations
Evidence Review on Diet and Physical Activity (in the absence of weight loss) to be integrated with the
recommendations of the Blood Cholesterol and High Blood Pressure Panels

Lifestyle Workgroup Critical Questions
CQ1
Among adults*, what is the effect of dietary patterns and/or macronutrient composition on CVD risk factors, when compared to no treatment or to other types of interventions?
CQ2
Among adults, what is the effect of dietary intake of sodium and potassium on CVD risk factors and outcomes, when compared with no treatment or with other types of interventions?
CQ3
Among adults, what is the effect of physical activity on blood pressure and lipids when compared with no treatment, or with other types of interventions?
*Those ≥18 years of age and <80 years of age.
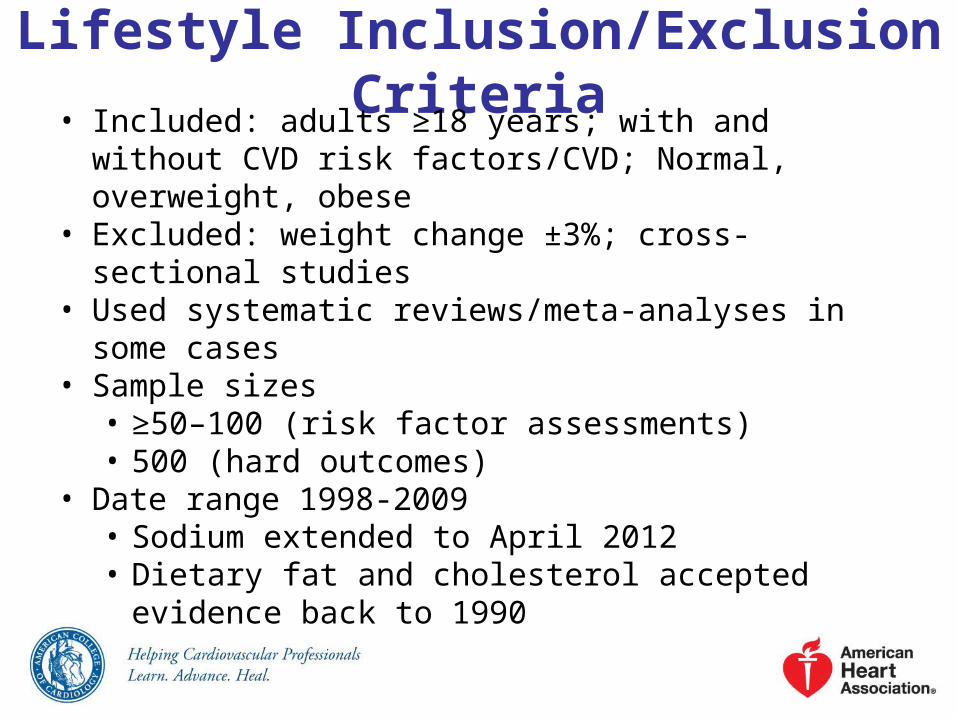
Lifestyle Inclusion/Exclusion Criteria
• Included: adults ≥18 years; with and without CVD risk factors/CVD; Normal, overweight, obese
• Excluded: weight change ±3%; cross-sectional studies• Used systematic reviews/meta-analyses in some
cases• Sample sizes
• ≥50–100 (risk factor assessments) • 500 (hard outcomes)
• Date range 1998-2009• Sodium extended to April 2012• Dietary fat and cholesterol accepted evidence back
to 1990

ScreenedSample
Size Sufficient
Eligible Reviewed
CQ1 6,086 3,768 1,237 28
CQ2 1,382 749 271 46
CQ3 867 N/A 184 26
Article Selection Process
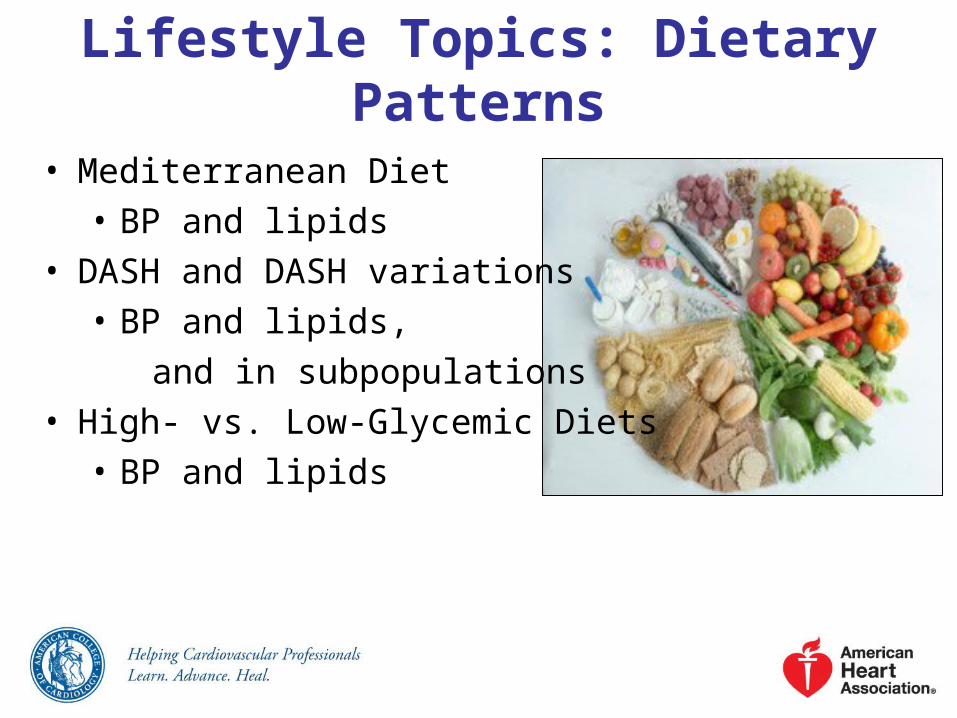
Lifestyle Topics: Dietary Patterns
• Mediterranean Diet
• BP and lipids
• DASH and DASH variations
• BP and lipids,
and in subpopulations
• High- vs. Low-Glycemic Diets
• BP and lipids

Mediterranean-Style Dietary Pattern Evidence Yield
• 3 RCTs conducted in free-living populations and 1 prospective cohort study that met criteria for inclusion on strategies for CVD risk factor reduction using the Mediterranean-style dietary pattern.
Mediterranean-Style Dietary Pattern Description
• There is no uniform definition of the Mediterranean-style dietary pattern diet in the randomized trials and cohort studies examined.
• The most common features in these studies were diets that were: • high in fruits (particularly fresh) and vegetables
(emphasizing root and green varieties)• high in whole grains (cereals, breads, rice, or pasta)• fatty fish (rich in omega–3 fatty acids) • low in red meat (and emphasizing lean meats);
substituted lower-fat or fat-free dairy products for higher-fat dairy foods

Mediterranean-Style Dietary Pattern Description (cont.)•used oils (olive or canola), nuts (walnuts, almonds, or hazelnuts), or margarines blended with rapeseed or flaxseed oils in lieu of butter and other fats
• The Mediterranean-style dietary patterns examined tended to be: • moderate in total fat (32%–35% of total calories)• relatively low in saturated fat (9%–10% of total
calories)• high in fiber (27–37g/day)• high in PUFA•particularly omega–3s

Mediterranean Diet and BP• Counseling to eat a Mediterranean-style dietary pattern
compared to minimal advice to consume a low-fat dietary pattern, in free-living middle-aged or older adults (with type 2 diabetes mellitus or at least 3 CVD risk factors):
BP by 6–7/2–3 mm Hg• In an observational study of healthy younger adults,
adherence to a Mediterranean-style dietary pattern was associated with:
BP 2–3/1–2 mm Hg
Strength of Evidence: Low

Mediterranean Diet and Lipids
Counseling to eat a Mediterranean-style dietary pattern compared with minimal or no dietary advice, in free-living middle-aged or older adults (with or without CVD or at high risk for CVD) resulted in no consistent effect on plasma LDL-C, HDL-C, and TG; in part because of substantial differences and limitations in the studies.
Strength of Evidence: Low

DASH: Dietary Approaches to Stop Hypertension
• 2 RCTs (6 citations) evaluating the DASH pattern met eligibility criteria.
• DASH dietary pattern description:• high in vegetables, fruits, and low-fat dairy
products• high in whole grains, poultry, fish, and nuts• low in sweets, sugar-sweetened beverages, and
red meats• low in saturated fat, total fat, and cholesterol• high in potassium, magnesium, calcium• rich in protein and fiber

DASH and BP
When all food was supplied to adults with BP 120–159/80–95 mm Hg and both body weight and sodium intake were kept stable, the DASH dietary pattern, compared with a typical American diet of the 1990s:
BP 5–6/3 mm Hg
Strength of Evidence: High

DASH and LipidsWhen food was supplied to adults with a total cholesterol
level <260 mg/dL and LDL-C level <160 mg/dL and body weight was kept stable, the DASH dietary pattern, compared with a typical American diet of the 1990s:
LDL-C by 11 mg/dL
HDL-C by 4 mg/dL
• no effect on TG
Strength of Evidence: High

DASH Subpopulations and BPWhen all food was supplied to adults with BP 120–159/80–95 mm Hg and body weight was kept stable, the DASH dietary pattern, compared with the typical American diet of the 1990s, BP in:
• women and men• African-American and non–African-American adults • older and younger adults• hypertensive and nonhypertensive adults
Strength of Evidence: High

DASH Subpopulations, BP, and Lipids
In patients who would benefit from in BP and lipids, the DASH dietary pattern, when compared with the typical American diet of the 1990s, BP and LDL-C similarly in:
• women and men• African-Americans and non–African-American adults • older and younger adults• hypertensive and nonhypertensive adults
Strength of Evidence: High
DASH Subpopulations, Lipids
When all food was supplied to adults with a total cholesterol level <260 mg/dL, LDL-C level <160 mg/dL, and body weight was kept stable, the DASH dietary pattern, as compared to a typical American diet of the 1990s, LDL-C and HDL-C similarly in subgroups: African-American and non–African-American adults, and hypertensive and nonhypertensive adults.
Strength of Evidence: Low

DASH Variations (OMNIHeart Trial)
• 1 RCT met eligibility criteria for DASH eating pattern variations
• In OmniHeart, 2 variations of the DASH dietary pattern were compared to DASH:
• 1 which replaced 10% of total daily energy from carbohydrates with protein
• the other which replaced the same amount of carbohydrates with unsaturated fat

DASH Variation EvidenceBP•In adults with BP of 120–159/80–95 mm Hg, modifying the DASH dietary pattern by replacing 10% of calories from carbohydrates with the same amount of either protein or unsaturated fat (8% MUFA and 2% PUFA) lowered systolic BP by 1 mm Hg compared to the DASH dietary pattern. •Among adults with BP 140–159/90–95 mm Hg, these replacements lowered systolic BP by 3 mm Hg relative to DASH. Strength of Evidence: Moderate

DASH Variation Evidence (cont.)
Lipids
•In adults with average baseline LDL-C 130 mg/dL, HDL-C 50 mg/dL, and TG 100 mg/dL, modifying the DASH dietary pattern by replacing 10% of calories from carbohydrates with 10% of calories from protein
LDL-C by 3 mg/dL HDL-C by 1 mg/dL TG by 16 mg/dL compared to the
DASH dietary pattern

DASH Variation Evidence (cont.)
• Replacing 10% of calories from carbohydrates with 10% of calories from unsaturated fat (8% MUFA and 2% PUFA)
LDL-C similarly
HDL-C by 1 mg/dL
TG by 10 mg/dL compared to the DASH
dietary pattern
Strength of Evidence: Moderate
Glycemic Index/Load Dietary Approaches
• 3 RCTs evaluating glycemic index met eligibility criteria.
• There is insufficient evidence to determine whether low-glycemic diets vs. high-glycemic diets affect lipids or BP for adults without diabetes mellitus.
• The evidence for this relationship in adults with diabetes mellitus was not reviewed.
Lifestyle Topics: Dietary Fat and Cholesterol
• Saturated Fat - Lipids
• Replacement of SFA with carbohydrates, MUFA, or PUFA - Lipids
• Replacement of carbohydrates with MUFA or PUFA - Lipids
• Replacement of trans fatty acids with carbohydrates, MUFA, or PUFA, SFA - Lipids
• Dietary Cholesterol - Lipids

Dietary Fat and Cholesterol
• 3 trials evaluating saturated, trans fat, and dietary cholesterol.
• In addition a search was conducted for meta-analyses and systematic reviews from 1990 to 2009.
• 4 systematic reviews and meta-analyses met inclusion criteria.
Saturated FatFood supplied to adults in a dietary pattern that achieved a macronutrient composition of 5%–6% saturated fat, 26%–27% total fat, 15%–18% protein, and 55%–59% carbohydrates compared to the control diet (14%–15% saturated fat, 34%–38% total fat, 13%–15% protein, and 48%–51% carbohydrates):
LDL-C 11–13 mg/dL in 2 studies LDL-C 11% in another study.
Strength of Evidence: High
Note: Saturated fat was not an isolated change.

Saturated Fat (cont.)• In controlled feeding trials among adults, for every 1% of
energy from SF) that is replaced by 1% of energy from carbohydrates, MUFA, or PUFA:• LDL-C is lowered by an estimated 1.2, 1.3, and 1.8
mg/dL, respectively• HDL-C is lowered by an estimated 0.4, 1.2, and 0.2
mg/dL, respectively • For every 1% of energy from SFA that is replaced by 1%
of energy from: • Carbohydrates and MUFA
• TG are raised by an estimated 1.9 and 0.2 mg/dL, respectively.
• PUFA• TG are lowered by an estimated 0.4 mg/dL.
Strength of Evidence: Moderate
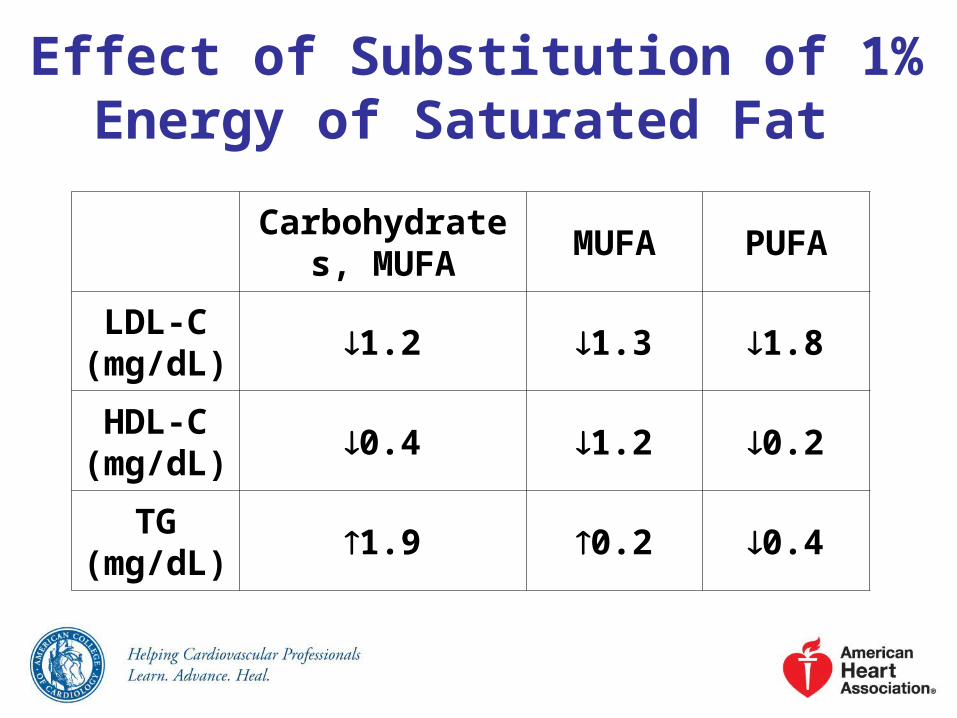
Effect of Substitution of 1% Energy of Saturated Fat
Carbohydrates, MUFA
MUFA PUFA
LDL-C (mg/dL)
1.2 1.3 1.8
HDL-C (mg/dL)
0.4 1.2 0.2
TG (mg/dL)
1.9 0.2 0.4

Substitution of Fatty Acids for Carbohydrates
• In controlled feeding trials among adults, for every 1% of energy from carbohydrates that is replaced by 1% of energy from: • MUFA
• LDL-C is lowered by 0.3 mg/dL, HDL-C is raised by 0.3 mg/dL, and TG are lowered by 1.7 mg/dL
• PUFA• LDL-C is lowered by 0.7 mg/dL, HDL-C is raised
by 0.2 mg/dL, and TG are lowered by 2.3 mg/dL
Strength of Evidence: Moderate

Trans FatIn controlled feeding trials among adults, for every 1% of energy from trans MUFA replaced with 1% of energy from:
• MUFA or PUFA LDL-C by 1.5 and 2.0 mg/dL, respectively.
• SFA, MUFA, or PUFA HDL-C by 0.5, 0.4 and 0.5 mg/dL, respectively.
• MUFA or PUFA TG by 1.2 and 1.3 mg/dL.
Strength of Evidence: Moderate
Trans Fat (cont.)
In controlled feeding trials among adults, the replacement of 1% energy as trans MUFA with carbohydrates decreased LDL-C cholesterol levels by 1.5 mg/dL, and had no effect on HDL-C cholesterol and TG levels.
Strength of Evidence: Moderate

Dietary Cholesterol
There is insufficient evidence to determine whether lowering dietary cholesterol reduces LDL-C.
Lifestyle Topics: Sodium• BP:
• Sodium Reduction - BP• Sodium Levels/ - BP and
subpopulations• Sodium Reduction + DASH - BP• Sodium/ Other Minerals - BP
• CVD Outcomes:• Sodium Reduction - CVD events• Sodium Intake - Stroke, CVD Risk• Sodium Intake - HF

Sodium and BP: Overall Results
In adults aged 25–80 years with BP 120–159/80–95 mm Hg, reducing sodium intake lowers BP.
Strength of Evidence: High
Different Levels of Sodium Intake
In adults aged 25–75 years with BP 120–159/80–95 mm Hg, relative to approximately 3,300 mg/day sodium intake that achieved a mean 24-hour urinary sodium excretion of approximately 2,400 mg/day:
BP by 2/1 mm Hg Sodium intake that achieved a mean 24-hour urinary sodium excretion of approximately 1,500 mg/day BP by 7/3 mm Hg
Strength of Evidence: Moderate
Different Levels of Sodium Intake (cont.)
In adults aged 30–80 with or without hypertension, counseling to sodium intake by an average of 1,150 mg per day:
BP by 3–4/1–2 mm Hg
Strength of Evidence: Moderate

Sodium and BP in Subpopulations
In adults with prehypertension or hypertension, reducing sodium intake lowers BP in women and men; African-American and non–African-American adults; and older and younger adults.
Strength of Evidence: High

Reducing sodium intake lowers BP in adults with either prehypertension or hypertension when eating either the typical American diet or the DASH dietary pattern. The effect is greater in those with hypertension.
Strength of Evidence: High
Sodium and BP in Subpopulations (cont.)
Sodium and Dietary Pattern Changes
In adults aged 25–80 with BP 120–159/80–95 mm Hg, the combination of sodium intake + eating the DASH dietary pattern lowers BP more than sodium intake alone. Strength of Evidence: Moderate
There is insufficient evidence from RCTs to determine whether sodium intake + changing dietary intake of any other single mineral (for example, increasing potassium, calcium, or magnesium) BP more than sodium intake alone.
Sodium and CHD/CVD Outcomes
A in sodium intake of ~1,000 mg/day CVD events by ~30%.
Strength of Evidence: Low
Higher dietary sodium intake is associated with a greater risk of fatal and nonfatal stroke and CVD.
Strength of Evidence: Low
There is insufficient evidence to determine the association between sodium intake and the development of CHF.
There is insufficient evidence to assess the effect of dietary sodium intake on CVD outcomes in patients with existing CHF.
Sodium and CHD/CVD Outcomes (cont.)
Lifestyle Topics: Potassium
• Potassium intake – BP
• Potassium intake – Stroke Risk
• Potassium intake – CHD/ CHF/ CVD mortality
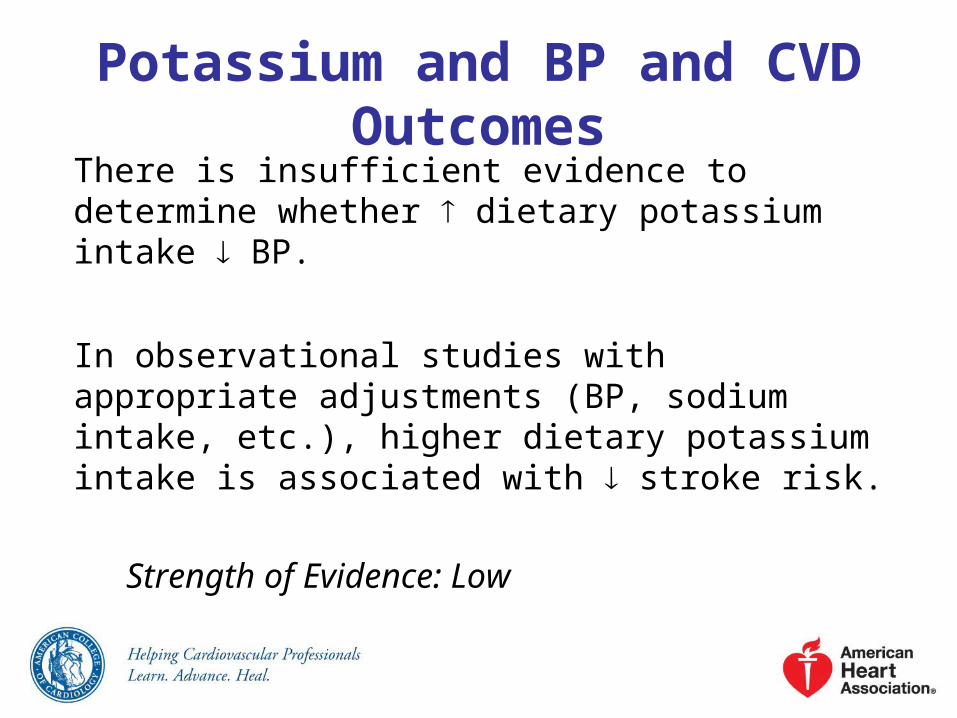
Potassium and BP and CVD Outcomes
There is insufficient evidence to determine whether dietary potassium intake BP.
In observational studies with appropriate adjustments (BP, sodium intake, etc.), higher dietary potassium intake is associated with stroke risk.
Strength of Evidence: Low

Potassium and BP and CVD Outcomes (cont.)
There is insufficient evidence to determine whether there is an association between dietary potassium intake and CHD, CHF, and CVD mortality.

Physical Activity Guidelines
• The 2008 Physical Activity Guidelines Advisory Committee Report was used as the starting point for evidence review.
• Additionally, a systematic search identified 8 meta-analyses from 2001 onwards and 5 systematic reviews rated fair to good that addressed this question and were included as the evidence base.
Physical Activity
• Aerobic exercise – Lipids
• Resistance training – Lipids
• Aerobic exercise – BP
• Resistance training – BP

Effect of Physical Activity on Lipids
Among adults, aerobic physical activity, as compared to control interventions:
• LDL-C 3.0-6.0 mg/dL on average
• non–HDL-C 6.0 mg/dL on average
• has no consistent effect on HDL-C or TG
Strength of Evidence: Moderate
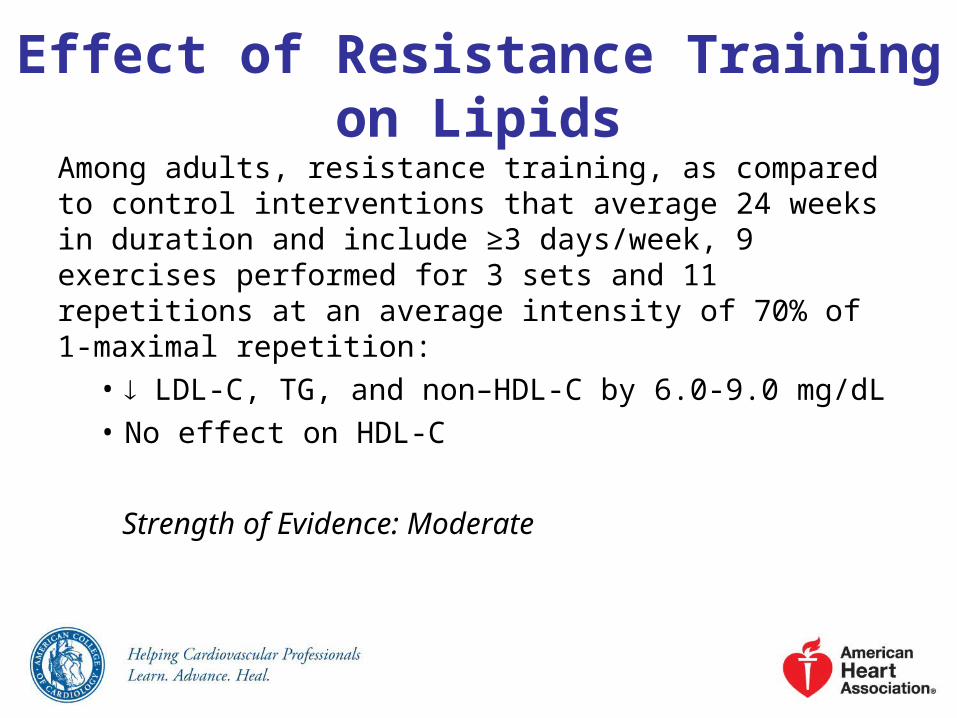
Effect of Resistance Training on Lipids
Among adults, resistance training, as compared to control interventions that average 24 weeks in duration and include ≥3 days/week, 9 exercises performed for 3 sets and 11 repetitions at an average intensity of 70% of 1-maximal repetition:
• LDL-C, TG, and non–HDL-C by 6.0-9.0 mg/dL
• No effect on HDL-C
Strength of Evidence: Moderate

Now the Evidence-Based Guidelines

What’s New in Lifestyle?
• Recommendations based on in-depth systematic reviews. Previous reports used different methods and structure. More depth, less breadth.
• More emphasis on dietary patterns• More data provided to support
• saturated and trans fat restriction• dietary salt restriction
• Evidence to support dietary cholesterol restriction in those who could benefit from LDL-C is inadequate.
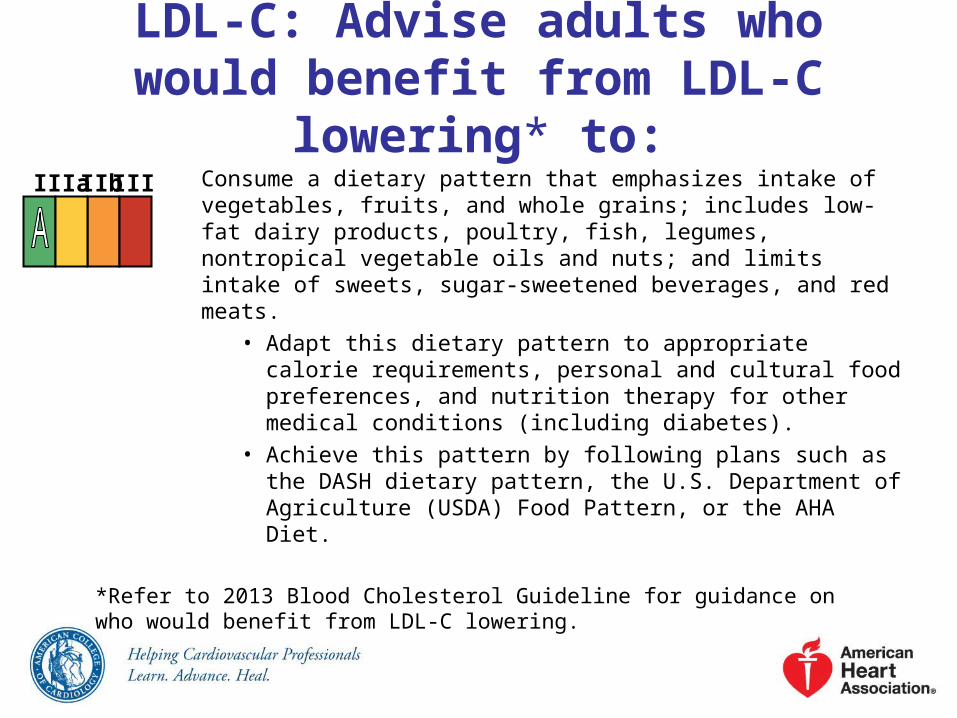
Consume a dietary pattern that emphasizes intake of vegetables, fruits, and whole grains; includes low-fat dairy products, poultry, fish, legumes, nontropical vegetable oils and nuts; and limits intake of sweets, sugar-sweetened beverages, and red meats.
• Adapt this dietary pattern to appropriate calorie requirements, personal and cultural food preferences, and nutrition therapy for other medical conditions (including diabetes).
• Achieve this pattern by following plans such as the DASH dietary pattern, the U.S. Department of Agriculture (USDA) Food Pattern, or the AHA Diet.
LDL-C: Advise adults who would benefit from LDL-C
lowering* to:I IIa IIb III
*Refer to 2013 Blood Cholesterol Guideline for guidance on who would benefit from LDL-C lowering.
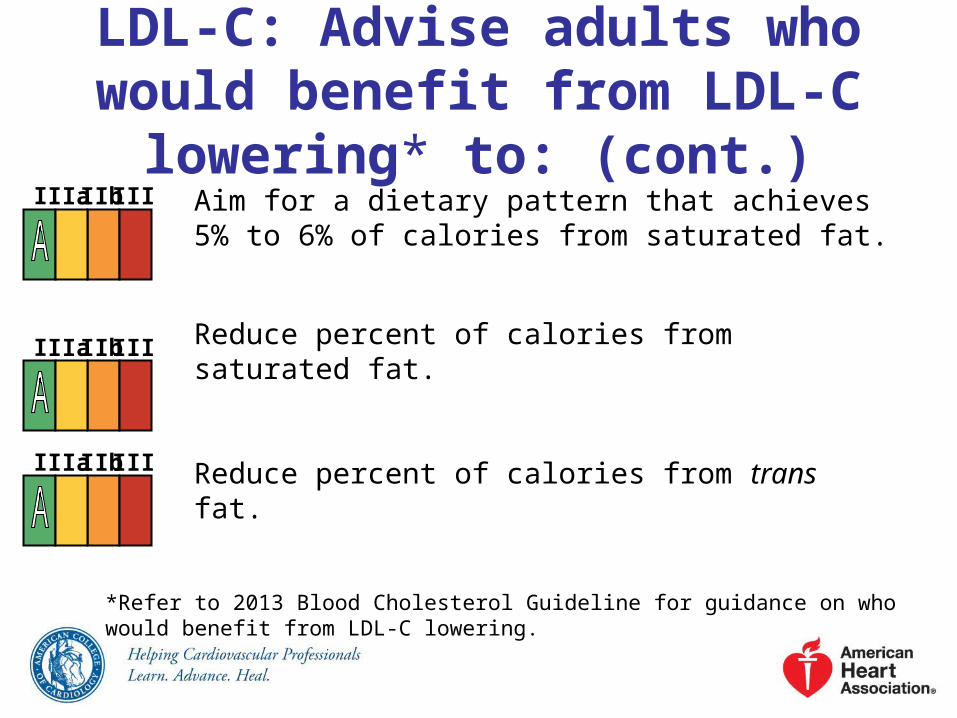
Aim for a dietary pattern that achieves 5% to 6% of calories from saturated fat.
Reduce percent of calories from saturated fat.
Reduce percent of calories from trans fat.
LDL-C: Advise adults who would benefit from LDL-C
lowering* to: (cont.)I IIa IIb III
I IIa IIb III
*Refer to 2013 Blood Cholesterol Guideline for guidance on who would benefit from LDL-C lowering.
I IIa IIb III

BP: Advise adults who would benefit from BP
lowering to:Consume a dietary pattern that emphasizes intake of vegetables, fruits, and whole grains; includes low-fat dairy products, poultry, fish, legumes, nontropical vegetable oils and nuts; and limits intake of sweets, sugar-sweetened beverages, and red meats.•Adapt this dietary pattern to appropriate calorie requirements, personal and cultural food preferences, and nutrition therapy for other medical conditions (including diabetes mellitus). •Achieve this pattern by following plans such as the DASH dietary pattern, the U.S. Department of Agriculture (USDA) Food Pattern, or the AHA Diet.
I IIa IIb III
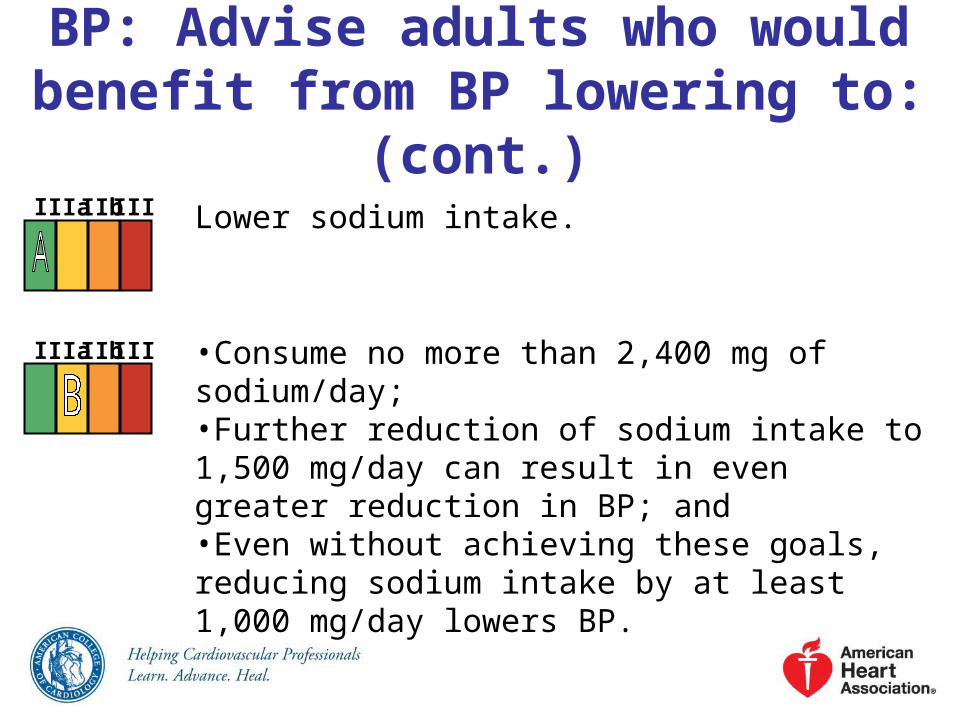
Lower sodium intake.
•Consume no more than 2,400 mg of sodium/day;•Further reduction of sodium intake to 1,500 mg/day can result in even greater reduction in BP; and•Even without achieving these goals, reducing sodium intake by at least 1,000 mg/day lowers BP.
BP: Advise adults who would benefit from BP lowering to:
(cont.)I IIa IIb III
I IIa IIb III

Combine the DASH dietary pattern with lower sodium intake.
BP: Advise adults who would benefit from BP lowering to:
(cont.)
I IIa IIb III

Lipids:In general, advise adults to engage in aerobic physical activity to reduce LDL-C and non–HDL-C: 3 to 4 sessions a week, lasting on average 40 minutes per session, and involving moderate- to vigorous-intensity physical activity.
BP:In general, advise adults to engage in aerobic physical activity to lower BP: 3 to 4 sessions a week, lasting on average 40 minutes per session, and involving moderate- to vigorous-intensity physical activity.
Physical ActivityI IIa IIb III
I IIa IIb III

Heart-Healthy Nutrition and Physical Activity Behaviors for
All• Consume a dietary pattern that emphasizes intake of
vegetables, fruits, and whole grains; includes low-fat dairy products, poultry, fish, legumes, nontropical vegetable oils and nuts; and limits intake of sodium, sweets, sugar-sweetened beverages, and red meats.• Adapt this dietary pattern to appropriate calorie
requirements, personal and cultural food preferences, and nutrition therapy for other medical conditions, e.g., diabetes mellitus.

Heart-Healthy Nutrition and Physical Activity Behaviors for
All (cont.)• Adapt this dietary pattern to appropriate calorie
requirements, personal and cultural food preferences, and nutrition therapy for other medical conditions, e.g., diabetes mellitus.
• Adults should do 2 hours and 30 minutes a week of moderate-intensity, or 1 hour and 15 minutes (75 minutes) a week of vigorous-intensity aerobic physical activity, or an equivalent combination of moderate- and vigorous-intensity aerobic physical activity. Aerobic activity should be performed in episodes of at least 10 minutes, preferably spread throughout the week.

Heart-Healthy Nutrition and Physical Activity Behaviors for
All (cont.)• Achieving and maintaining a healthy weight. Refer to
the 2013 Guideline for the Management of Overweight and Obesity in Adults for recommendations on weight loss and maintenance.