evidence from pma2020 survey for modern contraceptive use
TRANSCRIPT

Page 1/22
Quality of Family Planning Care as Enabling Factorfor Modern Contraceptive Use in Indonesia:Evidence from PMA2020 SurveyNurjaeni Nurjaeni
Mahidol University https://orcid.org/0000-0001-8755-3457Yothin Sawangdee ( [email protected] )
University of MahidolUmaporn Pattaravanich
Mahidol UniversityCharamporn Holumyong
Mahidol UniversityAphichat Chamratrithirong
Mahidol University
Research
Keywords: quality, contraception, family planning, multilevel analysis, Indonesia
Posted Date: May 19th, 2021
DOI: https://doi.org/10.21203/rs.3.rs-516964/v1
License: This work is licensed under a Creative Commons Attribution 4.0 International License. Read Full License

Page 2/22
AbstractBackground
The utilization of modern family planning methods is a key pointer that mirrors universal access toreproductive health cares. Ful�lling unmet needs for modern contraceptives may decrease the level ofmaternal mortality by almost a third. This research employed the 2016 PMA2020 survey to assessmultilevel variables related to modern family planning method use among women of reproductive age inIndonesia.
Method
Data from interviews of female and Service Delivery Point (SDP) of the 2016 Performance Monitoring andAccountability 2020 (PMA2020) survey were linked to generate a merged dataset comprising women’sindividual, cluster and SDP factors (N=10,210). Multilevel analysis was done to assess the in�uence ofcontextual factors including a summary index of SDP quality FP care on woman’s modern familyplanning practice. Adjusted odds ratios and 95% CIs were analysed and interpreted.
Results
Modern contraceptive prevalence among women of childbearing age was 42.3% in 2016. There was aconsiderable variation in the likelihood of modern method use across the 372 clusters/EAs. Age,education, marital status, parity, residency, region, woman’s FP decision autonomy, cluster’s average idealnumber of children, percentage of females dissatis�ed with FP, and percent of females visited by CHVswere signi�cant factors for modern FP use after adjusting for multilevel characteristics. Quality of FP carewas revealed to be a signi�cant enabling factor for modern contraceptive use in Indonesia.
Conclusions
Modern contraceptive prevalence among females aged 15-49 years was relatively low in 2016. The�ndings indicate that an advancement in modern method use can be gained by improving quality offamily planning care. Likewise, an enhancement in women’s FP decision autonomy and their level ofeducation, decline in women’s ideal number of children and diminution of the dissatisfaction with familyplanning are all major concerns to be addressed. Family planning policies must tackle adverse culturalnorms and inequities in quality of family planning care and women’s education that would producewelfares to women, children, and communities.
BackgroundModern contraceptive utilization is a key pointer that mirrors universal access to reproductive health cares(1-3). Furthermore, the contraceptive prevalence rate (CPR) among women of reproductive ages isindicator 3.7.1 in the 3rd Sustainable Development Goals (SDGs) (4, 5). Raising modern family planning
Page 3/22
(FP) use is essential for accomplishing three of the SDG indicators, i.e. decreasing maternal deaths,enhancing child health, and lessening HIV/AIDS (6-9).
Indonesia has thrived major success in FP programs in last half centuries (10, 11). Nonetheless, moderncontraceptive use in Indonesia has been an issue in last decade (12-14). Building and sustainingapproaches of advancing the prevalent utilization of modern methods in Indonesia is a tough task for FPprogram planners and managers (12-14).
Furthermore, more than 10% of women of reproductive age in Indonesia have unmet needs for familyplanning (FP), mainly for modern contraceptives (15). Ful�lling unmet needs for modern contraceptivesmay decrease the level of maternal mortality up to one third (16, 17). Woman’s characteristics includinghighest attended education and decisional autonomy are related to modern method usage (18-24). It ispropositioned that some social contexts, including the cultural norms at the society wherein women live,could in�uence women’s decision-making process in modern FP utilization as well (25, 26).
Even though drivers and barriers of modern FP practice in Indonesia have been examined in prior research,to authors’ knowledge, no prior research have utilised nation-wide representative data and multilevelanalysis to assess the net in�uence of social and family planning service factors on modern methodutilization. This research employed nation-wide representative datasets from the 2016 PerformanceMonitoring and Accountability 2020 (PMA2020) Indonesia survey to assess the net effect of cluster andservice delivery point (SDP) characteristics on women’s likelihood to practice modern family planningmethods. Social contexts were analysed at the cluster/community level, as were done in prior research(27, 28).
MethodsData
Data used in this study were obtained from the 2016 PMA2020 Indonesia survey: This project wasperformed in 2016 in paralel with other international survey project of PMA2020 in other 10 countries, i.e.Ghana, Kenya, Uganda, Democratic Republic of Kongo, Ethiopia, Burkina Faso, Niger, Nigeria, Côte D’Ivoire,and India (29). The 2016 PMA2020 Indonesia survey consists of women in reproductive age data from anational sample included 12,107 households, 10,565 females and 995 service delivery points (SDPs) in372 clusters or enumeration areas (EAs) (30).
In this study, authors extracted family planning data from the female and SDP datasets across all 372randomly chosen enumeration areas/clusters (N=10,210 women). Authors then generated cluster orenumeration area (EA) data by agregating women’s individual data for the purpose of multilevel analysis.Moreover, records from female and nearest SDP were merged using closest Global Positioning Systempoints and ‘EA ID’ as the key variable to link both female and SDP datasets.
Variable Measurements

Page 4/22
Outcome
Modern method usage was de�ned based on female records whether she or her spouse was currentlyusing a modern contraception, such as injectables, pills, implants, intra-uterine device (IUD), male orfemale sterilization, or condoms (female or male) at the time of interview. This dichotomous outcomevariable was coded as 1 for “currently using a modern contraception” and 0 for “currently not using amodern contraception”.
Level 1 explanatory variables
Independent factors added into level 1 of multilevel analysis comprised women’s age (�ve years intervalage groups), educational background (no school or primary school, junior or senior high school, andcollege/university), marital status (never married, married or living with spouse, and widow/divorced/separated), number of living children (0 child, 1 child, 2 children, 3 children, and 4 or more children), socio-economic status (lowest, low, middle, high, or highest), health insurance (no health insurance, non-freenational health insurance, free national or district health insurance, and other health insurance), andfamily planning decision-making autonomy (low and high).
Level 2 explanatory variables
Cluster/EAcharacteristics
Cluster/EA characteristics inserted into level 2 of the multilevel analysis consisted residency (urban orrural) and region (Sumatera, Java and Bali, Nusa Tenggara, Kalimantan, Sulawesi, and Maluku andPapua). Other cluster/EA characteristics was generated by agregating individual data of women living inthe same cluster/EA. Cluster/EA factors were developed for two aspects, i.e. ‘cultural norms’ and ‘demandgenerating effort’, that were commonly considered in literatures as part of the ”social determinants” ofmodern family planning practice.
The ‘cultural norms’ aspect was constructed by 2 variables:
1. Percentage of cluster (EA) members who dissatis�ed with FP.
A woman was classi�ed as having dissatisfaction with FP if she cited her reason for not using a moderncontraceptive was because of opposed by personal/spouse/religious view, or health concerns or fear ofside effects.
2. Average ideal number of children of women in childbearing age who were living in the same cluster/EA.
Furthermore, the ‘demand generating effort’ aspect was as follows:
The percentage of cluster/EA members visited by village health worker or community health volunteer(CHV) who discussed FP in the past one year.

Page 5/22
SDPcharacteristics
SDP characteristics included in the level 2 of multilevel analysis were SDP classi�cation (clinic or healthcenter, delivery post or health post, private midwife or doctor, hospital, and others) and SDP quality of FPcare (QoC). The variable of SDP quality FP care (QoC) was a synthesized index obtained from categoricalPCA (principal component analysis). This composite variable was built using SPSS 20 by synthesizingfourteen quality components of family planning care as follows:
1. Available trained staff(s): whether trained staff(s) was available when SDP served contraceptive careto clients.
2. Days SDP offering contraceptive services: number of days in a week SDP provide contraceptive care.
3. Available access to water and electricity: whether SDP staff(s) had available access to water andelectricity.
4. FP service charge: whether SDP charged clients for FP service.
5. Method choice: how many modern contraceptives offered by SDP.
�. FP method stock-out: Did SDP experience FP method stock-out in past 3 months.
7. FP kits and tools: number of available FP kits and tools in the family planning examination room.
�. FP Examination room: were contraception kept from rodents, water, and sun, and was there any dirtsin FP examination room.
9. SDP supervision: has SDP been supervised in past 6 months.
10. SDP supporting CHVs: did SDP train or supply contraceptives to community health volunteers(CHVs).
11. Visual and auditory privacy: did SDP maintain auditory and visual privacy in FP examination room.
12. Evaluation of clients’ feedbaks: did SDP evaluated clients’ feedbacks.
13. Family planning service provision for adolescents: did SDP counsel//prescribe/offer contraceptivesfor adolescents.
14. Post-abortion care: did SDP provide post-abortion care.
Moreover, factor weights (composite quality scores) were then normalized and each SDP was attachedwith a quality index. This composite index of quality FP care was classi�ed by its tertiles, denoting low,medium, or high quality family planning care.
Statistical analysis
This research performed multilevel analysis using STATA 14 by two-level mixed effect logistic regressionmodel which was able to:
Assessed the independent in�uences of cluster/EA and SDP factors on women’s odds of usingmodern methods, and
Addressed the cluster effects due to multistage cluster sampling design of PMA2020 survey.

Page 6/22
This research studied a binary dependent variable of modern FP practice. Authors performed these modelbuilding approaches to gain an unbias mixed effect model which predicts the odds of women ofreproductive age in Indonesia to utilise modern FP supplies:
First phase: A ‘null model’ without any independent variables was analysed to verify whether therewas a signi�cant variation across clusters/EAs regarding the odds of modern method usage. Thisempty model con�rmed whether there was any signi�cant random effect on multilevel model, bycheking whether the variance of multilevel model intercept was signi�cant or not.
Second phase: A full or comprehensive model with all explanatory variables (level 1 and level 2) wasthen built to assess the independent in�uence of cluster/EA and SDP factors, and to investigatewhether there was any signi�cant cross-level interaction between explanatory variables at both level.
ResultsModern contraceptive prevalence
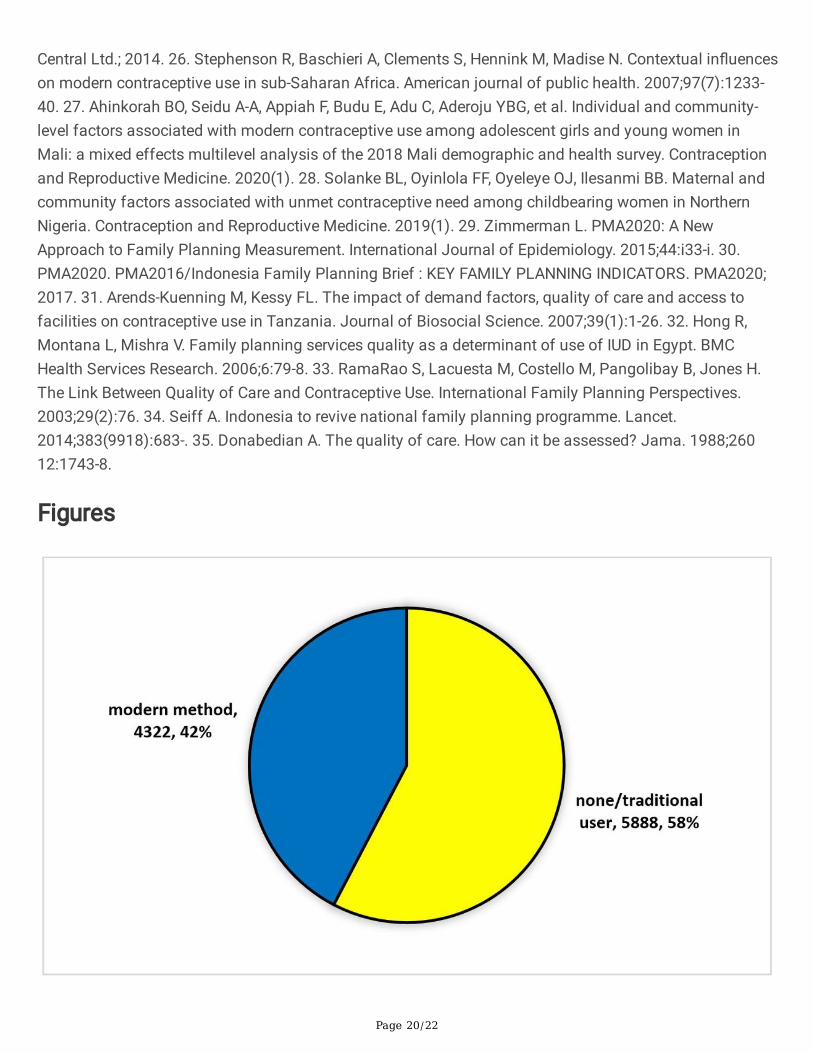
Figure 1 and 2 display the modern contraceptive prevalence in 2016. The percentage of women ofreproductive age using modern FP supplies in Indonesia was 42.33% and around 57.7% werecontraceptive non-users and traditional method users (Figure 1). Figure 2 depicts that among modern FPusers, around 53.33% were injectable method users, 20.99% were contraceptive pill users, 9.32% wereusing implants, 7.77% were using IUD, 6.15% were female sterilization users, 2.31% were condom users,and about 0.12% females reported that their spouse had been sterilized.
Female individual characteristics in 2016 PMA2020 Indonesia survey
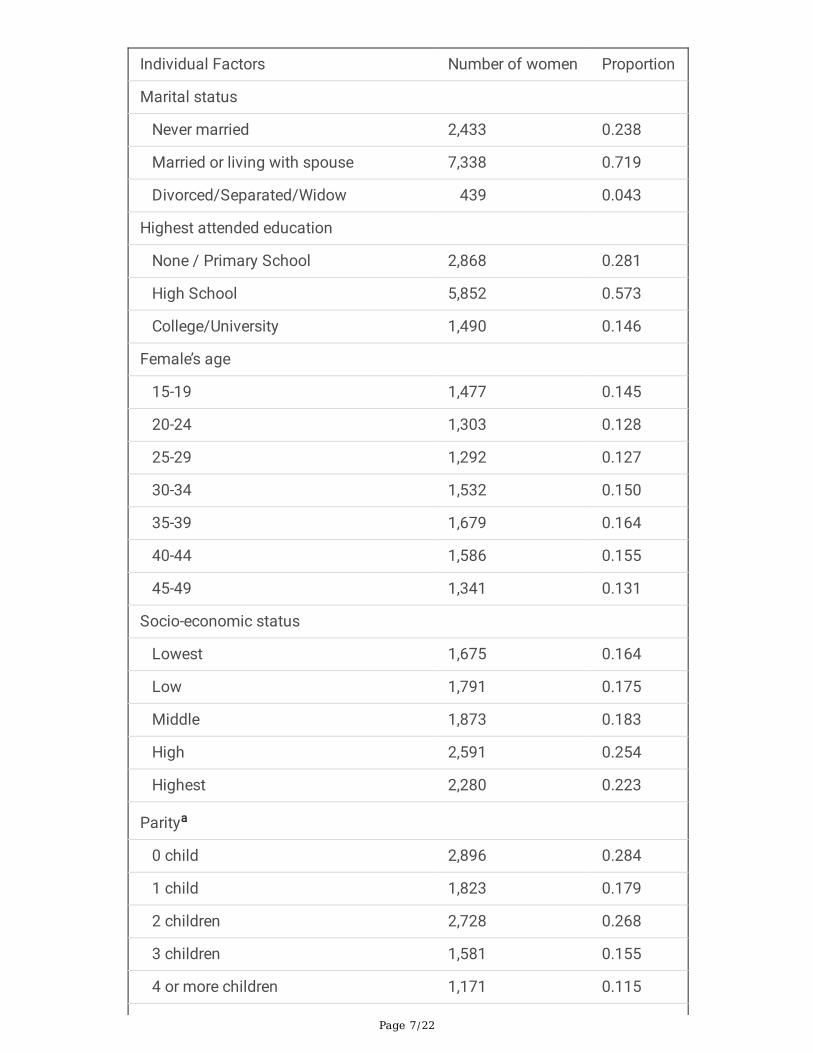
Table 1 exhibits the characteristics of women of reproductive age in this study. Approximately 14.47%were aged 15-19 years, and more than one-quarter were aged over 40 years. Around 57.32% had attendedhigh school and only 14.59% had attended academy/university. The percentage of females had 2 childrenwas 26.75% and about 28.39% had no parity. Regarding marital status, roughly 71.87% of women ofreproductive age were married or living with a spouse. Nearly 59.01% of women had a higher decisionalautonomy in family planning and about 25.38% had a high socio-economic status, but more than 39% ofwomen had no health insurance (see Table 1).
Clusters/EAs characteristics in 2016 PMA2020 Indonesia survey
Table 2 portrays the factual characteristics of the 372 clusters/EAs in the 2016 PMA2020 Indonesiasurvey. The cluster/EA average ideal number of children was 2.7 (SD 0.48). The mean proportion ofwomen dissatis�ed with modern contraception in cluster/EA was 15.05% (SD 12.02%). The meanproportion of females in cluster/EA had been visited by CHV about Family Planning was 9.49% (SD12.59%). Regarding residency, approximately 55.22% of women lived in urban settings and majority ofwomen (48.72%) were living in Java-Bali region (see Table 2).
Table 1. Descriptive analysis of individual variables
Page 7/22
Individual Factors Number of women Proportion
Marital status
Never married 2,433 0.238
Married or living with spouse 7,338 0.719
Divorced/Separated/Widow 439 0.043
Highest attended education
None / Primary School 2,868 0.281
High School 5,852 0.573
College/University 1,490 0.146
Female’s age
15-19 1,477 0.145
20-24 1,303 0.128
25-29 1,292 0.127
30-34 1,532 0.150
35-39 1,679 0.164
40-44 1,586 0.155
45-49 1,341 0.131
Socio-economic status
Lowest 1,675 0.164
Low 1,791 0.175
Middle 1,873 0.183
High 2,591 0.254
Highest 2,280 0.223
Paritya
0 child 2,896 0.284
1 child 1,823 0.179
2 children 2,728 0.268
3 children 1,581 0.155
4 or more children 1,171 0.115

Page 8/22
Health insurance
No health insurance 4,004 0.392
Free National/District Health Insurance 2,165 0.212
Non-free National Health Insurance 1,975 0.193
Other health insurance 2,066 0.202
FP Decision-making Autonomyb
Low (Decided by other/s) 4,061 0.410
High (Decided by oneself) 5,846 0.590
a 11 missing values.
b 303 missing values.
Table 2. Descriptive analysis of cluster/EA and SDP variables

Page 9/22
Contextual Factors Number of women Proportion
Region
Sumatera 1,870 0.183
Java and Bali 4,974 0.487
Nusa Tenggara 386 0.038
Kalimantan 489 0.048
Sulawesi 2,271 0.222
Maluku and Papua 220 0.021
Residency
Rural 4,572 0.448
Urban 5,638 0.552
Proportion of females visited by CHV discussed FP in past 1 year 9.49 (mean) 12.59 (SD)
Percent of females dissatis�ed with FP 15.05 (mean) 12.52 (SD)
Cluster/EA average ideal number of children 2.66 (mean) 0.48 (SD)
Quality of Care (QoC) c
Low 2,733 0.284
Medium 5,636 0.586
High 1,243 0.129
SDP classi�cation
Hospital 249 0.024
Clinic/health center 5,924 0.580
Delivery/health post 1,923 0.188
Private Midwife/Doctor 1,539 0.151
Other types 575 0.056
c 598 missing values.
Synthesized Index for Quality of Care (QoC)

Page 10/22
Table 3 disloses the result of categorical principal component analysis which found one singlecomponent that explaining the major variation in fourteen quality elements among 992 SDPs. The singlecomponent had acceptable eigenvalue and Cronbach’s alpha (5.248 and 0.872 respectively). Support forCHVs and clients’ visual and auditory privacy had the highest loadings (0.958 and 0.957 respectively).Post-abortion care (0.964), access to water and electricity (0.838), and number of FP methods offered bySDP (0.792) were also greatly loaded. Oppositely, FP service charge, number of days SDP served FP care,and FP service provision for adolescent were the lowest loading factors (-0.247, -0.170, and -0.085 inrespective order). The quality scores then were normalized as shown in Figure 3.
Table 3: Synthesized index of quality FP care of the nearest SDPs (n=992)
Factors Component Loadings
1. Available trained FP staff(s) 0.667
2. Number of FP kits and tools in examination room 0.190
3. Available access to water and electricity 0.838
4. FP examination room condition 0.628
5. Number of days in a week SDP served FP service -0.170
6. Number of methods offered by SDP 0.792
7. FP service charge -0.247
8. FP method stock out in past 3 months 0.317
9. SDP supervision in past 6 months 0.169
10. SDP supports for CHVs 0.958
11. Clients’ opinions evaluation 0.229
12. Client’s con�dentiality in the examination room 0.957
13. Provision of post abortion care 0.964
14. Provision of FP service for adolescents -0.085
Eigenvalue 5.248
Cronbach's alpha 0.872
Multilevel Mixed-effect Logistic Regression Model
The multilevel analysis results presented in Table 4 signi�es which individual, cluster/EA, and SDP factorshad substantial in�uences on the odds of modern method utilization. Of the fourteen level 1 and level 2variables, eleven had indicated a statistical relationship with modern family planning practice, i.e. female’sage, high school education, number of living children, marital status, FP decision-making autonomy, free

Page 11/22
health insurance, residency and region, community average ideal number of children, proportion of clustermembers dissatis�ed with family planning, proportion of cluster members visited by CHV, and SDP qualityof FP care (see Table 4). Nevertheless, there were 2 variables which had no signi�cant relation to moderncontraceptive use, i.e. socio-economic status and SDP classi�cation.
Table 4 depicts the multilevel analysis �ndings which predict the women’s odds to utilise modern FPmethods. It is evident that the relation between SDP quality of care and woman’s contraceptives usagewas a positive association, where the odds of modern FP practice was greater among females livingclosest to SDP having high quality care (AOR=1.42, 95% CI: 1.11-1.82). Contrastly, residing in communitywith a higher average ideal number of children or a higher proportion of women dissatis�ed with FP weresigni�cantly related to a lower odds of utilising a modern method (AOR=0.58, 95% CI: 0.49-0.68 andAOR=0.96, 95% CI: 0.96-0.97 respectively). Even so, a higher percentage of females visited by communityhealth volunteer was statistically related to a higher likelihood of modern method use (AOR=1.01, 95% CI:1.00-1.01).
Table 4: Findings from the null model and the full model of multilevel mixed-effect logistic regression formodern FP method use among Indonesian females aged 15 to 49 years
Variables NULL
MODEL
FULL MODEL
AORd (95% CI)

Page 12/22
Marital status
Never married 1
Married or living with spouse 55.08 (21.07 – 143.95)***
Divorced/Separated/Widow 1.17 (0.40 – 3.41)
Highest attended education
None / Primary School 1
High School 1.13 (0.98 – 1.30)*
College/University 0.95 (0.76 – 1.19)
Female’s age
15-19 1
20-24 0.96 (0.55 - 1.64)
25-29 0.46 (0.27 - 0.79)***
30-34 0.32 (0.18 – 0.54)***
35-39 0.27 (0.16 – 0.47)***
40-44 0.20 (0.11 – 0.34)***
45-49 0.09 (0.05 – 0.15)***
Socio-economic status
Lowest 1
Low 1.09 (0.89 – 1.33)
Middle 0.99 (0.81 – 1.22)
High 1.03 (0.84 – 1.28)
Highest 1.03 (0.82 – 1.30)
Parity
0 child 1
1 child 30.05 (17.88 - 50.49)***
2 children 80.87 (47.54 – 137.58)***
3 children 115.63 (67.16 – 199.09)***
4 or more children 99.54 (57.15 – 173.39)***
Health insurance

Page 13/22
No health insurance 1
Free National/District Health Insurance 1.15 (0.98 – 1.35)*
Non-free National Health Insurance 1.08 (0.91 – 1.28)
Other health insurance 1.11 (0.95 – 1.31)
FP Decision-making Autonomy
Low (Decided by other/s) 1
High (Decided by oneself) 2.86 (2.49 – 3.29)***
d Adjusted to other covariates in the model.
1: Reference category; AOR: adjusted odds ratio; CI: Con�dence Interval.
* α = 0.10; ** α = 0.05; *** α = 0.01.
Table 4: Findings from the null model and the full model of multilevel mixed-effect logistic regression formodern FP method use among Indonesian females aged 15 to 49 years (continued)
Characteristics NULL MODEL FULL MODEL
AOR d (95% CI)

Page 14/22
Region
Sumatera 1
Java and Bali 1.30 (1.06 –1.60)**
Nusa Tenggara 0.67 (0.45 –1.00)*
Kalimantan 1.39 (0.96 –2.01)*
Sulawesi 0.68 (0.53 –0.87)***
Maluku and Papua 1.12 (0.64 –1.95)
Residency
Rural 1
Urban 0.71 (0.60 –0.84)***
Proportion of women visited by CHV discussed aboutFP in past 1 year
1.01 (1.00 –1.01)**
Percent of females dissatis�ed with FP 0.96 (0.96 –0.97)***
Cluster average ideal number of children 0.58 (0.49 –0.68)***
Quality of Care (QoC)
Low 1
Medium 1.03 (0.87 –1.21)
High 1.42 (1.11 –1.82)***
SDP classi�cation
Hospital 1
Clinic/health center 1.05 (0.64 –1.74)
Delivery/health post 1.30 (0.77 –2.19)
Private Midwife/Doctor 1.22 (0.72 –2.06)
Other types 1.40 (0.78 –

Page 15/22
yp (2.52)
Random Effect
random Intercept 0.49 (0.40-0.61)***
0.10 0.05 –0.19***
random Slope of woman’s autonomy 0.27 0.15 –0.48***
Lr test X2=505.8,P<0.001 X2=42.50 P<0.001
Wald Chi-Square X2=1277.2 P<0.001
Model Fitness
AIC 13,411 7725
BIC 13,425 8010
Mean VIF 1.34
d Adjusted to other covariates in the model.
1: Reference category; AOR: adjusted odds ratio; CI: Con�dence Interval.
* α = 0.10; ** α = 0.05; *** α = 0.01.
VIF = Variance In�ation Factors.
AIC = Akaike information criterion.
BIC = Bayesian information criterion.
Moreover, Table 4 shows signi�cant difference in women’s odds of using modern method between highand low woman’s FP autonomy (AOR=2.86, 95% CI: 2.49-3.29). In addition, women attended high shoolhad greater odds in modern contraceptive use than those with none/primary school (AOR=1.13, 95% CI:0.98-1.30). Similarly, compared to women with no health insurance, women having a free national/districthealth insurance had a higher likelihood of using modern contraceptives (AOR=1.15, 95% CI: 0.98-1.35).
Table 4 also reveals that the variance for intercept of the null model was signi�cant (σ=0.49; 95% CI: 0.40 -0.61; p<0.001) validating that the multilevel model intercepts was signi�cantly random. In addition, thevariance for the slope of variable FP decision-making autonomy in the full model was also signi�cant(σ=0.27; 95% CI:0.15-0.48; p<0.001), it means that the relation between women’s FP decision-makingautonomy and modern contraceptive use varied across 372 cluster/EAs. Overall, the modern contraceptiveuse model resulted from multilevel logistic regression analysis had evidently random intercepts andrandom slopes for variable of FP decisional autonomy, indicating that the modern contraceptive usemodel signi�cantly differed among all clusters/EAs.

Page 16/22
DiscussionThe research �ndings revealed that the odds of women of childbearing age using modern contraceptiongreatly varied across the 372 cluster/EAs. This study identi�ed substantial relationship between quality offamily planning care and modern contraceptive use. Particularly, SDP quality of care had a positiveassociation with women’s family planning practice, females lived closest to an SDP providing high qualityof care had higher odds of using modern methods. This pattern are consistent with study �ndings fromother research (31-33).
Our �ndings also found that the cluster average ideal number of children and percentage of clustermembers dissatis�ed with FP in�uenced the likelihood of individual woman to use a modern FP method.More or less, it indicates that social beliefs may impede the demand for family planning. It also re�ectsthat cultural and traditional norms play an important role in modern contraceptive prevalence. Priorresearch suggested that prevailing community values may in�uence woman’s decision in family planningpractice at the individual level (25-28).
It was exciting to acknowledge that women living in rural areas had a higher likelihood in moderncontraceptive use. It may be rationalised by the national FP programs in Indonesia targeting rural women(34). Therefore, it can be viewed as an achievement of national government intervention initiativesimplemented at rural areas.
STRENGTHS AND LIMITATIONS
This study used the latest PMA2020 Indonesia survey datasets which were gathered between October2016 and January 2017, thus the research �ndings are still relevant to be considered for current policyanalysis. Moreover, the measurement and variables employed in this study are equivalent and compatiblewith those commonly used in global research. In addition, the multilevel analysis let us to identify the neteffect for multidimensional variable of quality family planning care, and to earn better estimates byaddressing cluster effects from multistage cluster sampling design.
Though, this study has several limitations. Firstly, the 2016 PMA2020 Indonesia survey data are cross-sectional, hence, study results should be interpreted with caution due to inability to infer a causal-impactrelation. Also, analysing secondary data constricted authors to include unavailable factors that mayin�uence modern method use, such as client’s satisfaction which is part of Donabedian quality framework(35). It is possible that female respondents were using or not using modern contraception due to othervariables not available in the datasets. Thus, it may affect the signi�cance of variance for the intercept ofmultilevel model, adjusted for other covariates in the study.
ConclusionsIn summary, the modern contraceptive prevalence in Indonesia was relatively low in 2016. The odds ofwomen of reproductive age using modern family planning methods statistically differed across 372
Page 17/22
clusters/EAs. The �ndings indicate that an advancement in modern method use can be gained byimproving quality of family planning care. Likewise, an enhancement in women’s FP decision autonomyand their level of education, decline in women’s ideal number of children and diminution of thedissatisfaction with family planning are all major concerns to be addressed. Family planning policiesmust tackle adverse cultural norms and inequities in quality of FP care and women’s education that wouldproduce welfares to women, children, and communities.
AbbreviationsSDG : Sustainable development Goals;
QoC : Quality of Family Planning Care;
AOR : Adjusted Odd Ratio;
CI : Con�dence Interval;
AIC : Akaike information criterion;
BIC : Bayesian information criterion;
VIF : Variance In�ation Factors;
PMA : Performance, Monitoring and Accountability;
FP : Family Planning;
EA : Enumeration Area;
SDP : Service Delivery Point;
GPS : Global Positioning System;
CHV : Community Health Volunteer;
DeclarationsAcknowledgements
We are grateful to Center of Reproductive Health, Gajah Mada University for making the datasets availablefor this research.
Authors’ contributions
YS, UP, CH, and AC help NN conceptualized and designed the research; NN were responsible for dataanalysis, interpretation, and drafting the manuscript; YS, UP, CH, and AC was responsible for critical

Page 18/22
revision of the manuscript. All authors read and approved the �nal draft.
Funding
The research was funded by the Indonesian National Population and Family Planning Board (NPFPB).However, NPFPB played no role in this research.
Availability of data and materials
To access the data used in this study, administrative permissions were required and obtained from TheCenter of Reproductive Health, University of Gajah Mada:
O�ce: C24 Mahoni Road, Jogjakarta, Indonesia, Postcode 55281
Email: [email protected]
Ethics approval and consent to participate
As the study entailed secondary analysis of existing data containing no personal identifying
information, an exemption from ethical review requirements was granted by the the Institutional EthicalReview Board, Mahidol University, Thailand. Consent to participate was not an issue for the same reason.
Consent for publiation
Not applicable.
Competing interest
The authors have no con�ict of interest to conduct this research.
Author details
1 Institute of Population and Social Research, University of Mahidol, Thailand
2 Indonesian National Population and Family Planning Board
References1. United Nations Population Fund UNFPA. Universal Access to Reproductive Health: Progress andChallenges. UN Population Fund, U.N.F.P.A.; 2016. 2. United Nations Population Fund UNFPA. Howuniversal is access to reproductive health? A review of evidence. New York; 2010. 3. United NationsPopulation Fund UNFPA. Universal Access to Reproductive Health Services: An Un�nished Business.Jakarta: UNFPA; 2012. Available from: https://indonesia.unfpa.org/sites/default/�les/pub-pdf/Booklet_Universal_Access_to_Reproductive_Health.pdf. 4. United Nations UN. Transforming ourWorld: the 2030 Agenda for Sustainable Development. eSocialSciences; 2015. 5. United Nations UN. The

Page 19/22
Sustainable Development Goals Report 2020. United Nation; 2020. 6. International Planned ParenthoodFederation IPPF. Sustainable Development Goals and Family Planning 2020. London: IPPF; 2016. 7.Osotimehin B. Family planning as a critical component of sustainable global development. Global HealthAction. 2015;8(1):29978. 8. Starbird E, Norton M, Marcus R. Investing in Family Planning: Key to Achievingthe Sustainable Development Goals. Global Health: Science and Practice. 2016;4(2):191-210. 9. UnitedNations UN. Family Planning and the 2030 Agenda for Sustainable Development (Data Booklet): UN;2019. 10. Holzner B. Two Is Enough. Family Planning in Indonesia under the New Order 1968-1998.SOJOURN: Journal of Social Issues in Southeast Asia. 2005;20(1):100-4. 11. Salim E, Adioetomo SM,Ari�n EN, Nizam, Pratama A. Population Dynamics and Sustainable Development. UNFPA Indonesia.Jakarta: UNFPA; 2015. 12. Government of Indonesia GoI. Family Planning 2020 commitment: Governmentof Indonesia2017 May 5th, 2021. Available from:https://www.familyplanning2020.org/sites/default/�les/Govt_Indonesia_FP2020_Commitment_2017.pdf.13. Government of Indonesia GoI. Family Planning 2020 commitment update: Government ofIndonesia2020 May 5th, 2021. Available from:https://www.familyplanning2020.org/sites/default/�les/Indonesia_Questionnaire_2020.pdf. 14. WorldHealth Organization WHO. State of health inequality: Indonesia. Geneva: World Health Organization; 2017.Available from: https://cdn.who.int/media/docs/default-source/gho-documents/12-dec-�nal-�nal-17220-state-of-health-inequality-in-indonesia-for-web.pdf?sfvrsn=54ae73ea_2. 15. Aryanty RI, Widyantoro N.Sexual and Reproductive Health Services in Indonesia: An Analysis of Equality, Quality andAccountability2019. Available from: https://dawnnet.org/wp-content/uploads/2021/01/Sexual-and-Reproductive-Health-Services-in-Indonesia-An-Analysis-of-Equality-Quality-and-Accountability_Discussion-paper16.pdf. 16. Ahmed S, Li Q, Liu L, Tsui AO. Maternal deaths averted by contraceptive use: an analysisof 172 countries. Lancet. 2012;380(9837):111-25. 17. Utomo B, Sucahya PK, Romadlona NA, RobertsonAS, Aryanty RI, Magnani RJ. The impact of family planning on maternal mortality in Indonesia: whatfuture contribution can be expected? Population Health Metrics. 2021;19(1):2. 18. Mahmud A, Ekoriano M,Titisari A, Wijayanti U, Sitorus M, Rahmadhony A. Determinants Of Modern Contraceptives Use InIndonesia: A Spatial Analysis. Systematic Reviews in Pharmacy. 2021;12:769-77. 19. Nurdin H, Masni,Russeng SS. Determinants contraceptive use after labor in Parepare (comparison between health andhealth Cempae Lompoe). Enfermeria Clinica. 2020;30(Supplement 4):298-302. 20. Magnani RJ, NuryanaD, Hutchinson P, Aryanty RI, Besral, Utomo B. Determinants of and trends in contraceptive method choiceIndonesia. In: Faculty of Public Health UoI, editor. Studies in Family Planning2020. 21. Kistiana S, GayatriM, Sari D. Determinants of Modern Contraceptive Use among Young Married Women (Age 15-24) inIndonesia. Global journal of health science. 2020;12:37-48. 22. Gafar A, Suza DE, Efendi F, Has EMMa,Pramono AP, Susanti IA. Determinants of contraceptive use among married women in Indonesia.F1000Research. 2020;9:193-. 23. Suantari D, Besral. Determinants of Intrauterine Device Use in Indonesia:Analysis of the Indonesia Demographic and Health Survey for 2002-2012. Journal of International Dental& Medical Research. 2019;12(1):344-7. 24. Gayatri M, Utomo B. Contraceptive method use in Indonesia:Trends and Determinants between 2007, 2012 and 2017. Indian Journal of Public Health Research &Development. 2019;10(12):1818-23. 25. Ngome E, Odimegwu C. The social context of adolescent women’suse of modern contraceptives in Zimbabwe: a multilevel analysis. United Kingdom, Europe: BioMed
Page 20/22
Central Ltd.; 2014. 26. Stephenson R, Baschieri A, Clements S, Hennink M, Madise N. Contextual in�uenceson modern contraceptive use in sub-Saharan Africa. American journal of public health. 2007;97(7):1233-40. 27. Ahinkorah BO, Seidu A-A, Appiah F, Budu E, Adu C, Aderoju YBG, et al. Individual and community-level factors associated with modern contraceptive use among adolescent girls and young women inMali: a mixed effects multilevel analysis of the 2018 Mali demographic and health survey. Contraceptionand Reproductive Medicine. 2020(1). 28. Solanke BL, Oyinlola FF, Oyeleye OJ, Ilesanmi BB. Maternal andcommunity factors associated with unmet contraceptive need among childbearing women in NorthernNigeria. Contraception and Reproductive Medicine. 2019(1). 29. Zimmerman L. PMA2020: A NewApproach to Family Planning Measurement. International Journal of Epidemiology. 2015;44:i33-i. 30.PMA2020. PMA2016/Indonesia Family Planning Brief : KEY FAMILY PLANNING INDICATORS. PMA2020;2017. 31. Arends-Kuenning M, Kessy FL. The impact of demand factors, quality of care and access tofacilities on contraceptive use in Tanzania. Journal of Biosocial Science. 2007;39(1):1-26. 32. Hong R,Montana L, Mishra V. Family planning services quality as a determinant of use of IUD in Egypt. BMCHealth Services Research. 2006;6:79-8. 33. RamaRao S, Lacuesta M, Costello M, Pangolibay B, Jones H.The Link Between Quality of Care and Contraceptive Use. International Family Planning Perspectives.2003;29(2):76. 34. Seiff A. Indonesia to revive national family planning programme. Lancet.2014;383(9918):683-. 35. Donabedian A. The quality of care. How can it be assessed? Jama. 1988;26012:1743-8.
Figures

Page 21/22
Figure 1
Contraceptive use in 2016 PMA2020 Indonesia survey.
Figure 2
Modern contraceptive prevalence in 2016 PMA2020 Indonesia survey
Figure 3

Page 22/22
Normalized Scores for Quality of Care (QoC) index
Supplementary Files
This is a list of supplementary �les associated with this preprint. Click to download.
CATEGORICALPCAANALYSISFORQUALITYOFCARE.pdf
QualityofcareandmoderncontraceptiveuseinIndonesia.smcl