evidence of cellular senescence during the development of...
TRANSCRIPT

1
Evidence of cellular senescence during the development of estrogen-induced pituitary tumors. 1
Sabatino, Maria Eugenia1; Petiti, Juan Pablo
1; Sosa, Liliana del Valle
1; Pérez, Pablo Anibal
1; 2
Gutiérrez, Silvina1; Leimgruber, Carolina
1; Latini, Alexandra
2; Torres, Alicia Inés
1; De Paul, Ana 3
Lucía1*
. 4
1Centro de Microscopía Electrónica, Instituto de Investigaciones en Ciencias de la Salud (INICSA-5
CONICET), Facultad de Ciencias Médicas, Universidad Nacional de Córdoba, Argentina. 6
2Laboratorio de Bioenergética y Estrés Oxidativo, Departamento de Bioquímica, Centro de 7
Ciencias Biológicas, Universidad Federal de Santa Catarina, Florianópolis, Brasil. 8
Abbreviated title: Cellular senescence in pituitary tumors. 9
Key terms: Pituitary, Estrogen, Immunohistochemistry, Tumor, Pathogenesis. 10
Word count: 7.841, Numbers of figures: 10 11
*Corresponding Author and person whom reprint request should be addressed: 12
Dr. Ana Lucía De Paul. 13
E-mail: [email protected] 14
Centro de Microscopía Electrónica, Instituto de Investigaciones en Ciencias de la Salud (INICSA-15
CONICET), Facultad de Ciencias Médicas, Universidad Nacional de Córdoba. 16
Av. Enrique Barros y Enfermera Gordillo, Ciudad Universitaria, 5000 Córdoba, Argentina. 17
Tel/fax: +54-351-4333021 18
19
Page 1 of 50 Accepted Preprint first posted on 19 March 2015 as Manuscript ERC-14-0333
Copyright © 2015 by the Society for Endocrinology.

2
ABSTRACT 20
Although pituitary adenomas represent 25% of intracranial tumors, they are usually benign, with the 21
mechanisms by which these tumors usually avoid an invasive profile and metastatic growth 22
development still remaining unclear. In this context, cellular senescence might constitute a plausible 23
explanation for the benign nature of pituitary adenomas. In the present study, we investigated the 24
emergence of cellular senescence as a growth control mechanism during the progression of 25
estrogen-induced pituitary tumors. The quantification of Ki67-immunopositive cells in pituitaries 26
from estrogenized male rats after 10, 20, 40 and 60 days revealed that the mitogenic potential rate 27
was not sustained for the whole period analyzed and successively decreased after 10 days of 28
estrogen exposition. In addition, the expression of cellular senescence features, such as the 29
progressive rise in the enzymatic SA-b-galactosidase activity, IL6, IL1b and TGFb expression was 30
observed throughout pituitary tumor development. Furthermore, tumoral pituitary cells also 31
displayed nuclear pATM expression, indicating activated DNA damage signaling, with a significant 32
increase in p21 expression also being detected. The associations among DNA damage signaling 33
activation, SA-b-galactosidase expression and p21 may provide a reliable combination of 34
senescence-associated markers for in vivo pituitary senescence detection. These results suggest a 35
role for this cellular process in the regulation of pituitary cell growth. Thus, cellular senescence 36
should be conceived as a contributing component to the benign nature of pituitary adenomas, 37
thereby influencing the capability of the pituitary gland to avoid unregulated cell proliferation. 38
39
Page 2 of 50

3
ABBREVIATION LIST: 40
DDR: DNA damage response 41
pATM: Phosphorylated Ataxia telangiectasia mutated 42
SA-b-gal: Senescence associated-beta-galactosidase 43
SASP: Senescence associated secretory phenotype 44
IL6: Interleukine 6 45
IL1b: Interleukine 1 beta 46
TGFb1: Transforming growth factor beta 1 47
RAS: Rat sarcoma 48
ERK1-2: extracellular signal-regulated protein kinase 1-2 49
COX 4: Cytochrome c oxidase 50
NFkB: Nuclear Factor kappa B 51
MFN1: Mitofusin 1 52
DRP1: Dynamin-related protein 1 53
TUNEL: Terminal deoxynucleotidyl transferase dUTP nick end labeling 54
BSA: Bovine serum albumin 55
ECLIA: electrochemiluminescence immunoassay 56
PBS: Phosphate buffered saline 57
Page 3 of 50

4
DTT: Dithiothreitol 58
EDTA: Ethylenediaminetetraacetic acid 59
EGTA: ethylene glycol tetraacetic acid 60
PMSF: phenylmethylsulfonyl fluoride 61
PRL: prolactin 62
E10: estradiol benzoate treatment for 10 day 63
E20: estradiol benzoate treatment for 20 day 64
E40: estradiol benzoate treatment for 40 day 65
E60: estradiol benzoate treatment for 60 day 66
67
Page 4 of 50

5
INTRODUCTION 68
The pituitary gland is a principal controller of endocrine homeostasis. Through the release 69
of specific hormones synthesized by five highly differentiated cells, this gland responds to central 70
and peripheral signals. In spite of presenting low mitogenic and apoptotic rates, the gland exhibits 71
dynamic and plastic fluctuations in reaction to exogenous and endogenous stimuli in order to 72
constantly adapt the hormone and metabolic responses to changing environments (Levy 2002). 73
Nevertheless, several alterations in cell growth can lead to pituitary hyperplasia and high levels of 74
hormone production, frequently related to adenoma formation (Asa and Ezzat 2009). 75
Pituitary adenomas represent 25% of intracranial tumors, with their prevalence rising with 76
age, and both sexes being similarly affected (Asa and Ezzat 2009). However, despite their relatively 77
common incidence, pituitary tumors are usually benign (Maiza and Caron 2009). The mechanisms 78
by which these tumors may rarely acquire invasive profile and metastastic growth are unclear, even 79
when oncogenic pathways are triggered or tumor suppressor pathways are inactivated. These 80
particularities of pituitary adenomas have led to the hypothesis that there may be an additional 81
process that acts as a protective anti-proliferative mechanism. 82
Cellular senescence can be interpreted as a spontaneous initial barrier in tumorigenesis, 83
because senescent cells are abundant within pre-malignant lesions whereas they rarely appear in 84
malignant tumors (Collado, et al. 2005). In this way, senescence renders an impediment against 85
oncogenic stimulation and prevents cellular transformation (Collado and Serrano 2010). In vitro 86
studies have revealed that certain oncogenic signaling, depending on the context, can paradoxically 87
provoke growth arrest along with a cellular senescent phenotype (Michaloglou, et al. 2005). 88
Moreover, emergent evidence has described in vivo premature cellular senescence in the early 89
stages of tumor growth, suggesting that this process could act as a potent anti-tumor protective 90
mechanism that must be overcome for tumor progression (Braig, et al. 2005; Collado et al. 2005). 91
Page 5 of 50

6
Senescence is considered to be a stress response characterized by permanent cell cycle 92
arrest, which can be triggered by different factors including DNA damage, oxidative stress, 93
telomere dysfunction, aberrant proliferative signals of oncogenes and the inactivation of tumor 94
suppressor genes (Campisi and d'Adda di Fagagna 2007). Consistent with cellular arrest, the 95
senescence phenotype is accompanied by the up-regulation of different cell-cycle regulators such as 96
the CDK inhibitors p16INK4A
, p15INK4B
, p21CIP1
, among others (Holst, et al. 2003; Roninson 2002). 97
Since several senescence-inducing stimuli provoke epigenomic disruption or genomic damage, 98
many senescent cells harbor a persistent DNA damage response (DDR) signaling, such as the 99
activation of the kinase ataxia telangiectasia mutated (ATM) (Di Micco, et al. 2006) and the 100
involvement of p53 activation (Rodier, et al. 2007). In addition, senescent cells show higher levels 101
of detectable senescence associated b-galactosidase (SA-b-gal) (Dimri, et al. 1995; Lee, et al. 2006), 102
which can also include compromised mitochondrial dynamics and metabolism (Moiseeva, et al. 103
2009), with unbalanced mitochondrial fusion and fission processes (Lee, et al. 2007). In fact, 104
senescent cells undergo extensive gene expression changes that emulate the inflammatory response, 105
thereby developing a complex senescence-associated secretory phenotype (SASP), in vitro and in 106
vivo, associated with the activation of NFkB or C/EBP-B (Coppe, et al. 2008). SASP proteins 107
include a wide range of growth factors, proteases, chemokines and cytokines including IL6, IL1, 108
TGFb, IL8, among others which participate in senescence intercellular signaling, and interact at, or 109
in the immediate vicinity, of the plasma membrane (Coppe et al. 2008; Kuilman, et al. 2008; Young 110
and Narita 2009). 111
Cellular senescence may constitute a plausible explanation for the benign nature of pituitary 112
adenomas through the existence of an intrinsic predisposition of pituitary cells to limit uncontrolled 113
proliferation through this cellular program. Some recent studies on pituitary tumorigenesis in 114
transgenic mice (Chesnokova, et al. 2008; Chesnokova, et al. 2007) and SA-b-gal in human 115
pituitary tumor (Alexandraki, et al. 2012; Chesnokova, et al. 2011) have suggested that cellular 116
senescence could be a significant mediator of growth cessation in these tumors. However, it still 117
Page 6 of 50

7
remains uncertain whether this cellular response takes place in the absence of direct genetic 118
manipulation or during the development of pituitary proliferative injuries, indicating a possible 119
physiological role for cellular senescence in the modulation of pituitary cell growth. 120
Appropriate in vivo models are required to achieve a better understanding of senescence 121
during the development of tumors. In the present study, we used a previously developed pituitary 122
tumor experimental model, which consists of long-term estrogen administration in rats, and leads to 123
the formation of prolactin secretory tumors presenting hyperplasia/hypertrophy, greater vascularity 124
and the disruption of the reticulin network (Mukdsi, et al. 2006; Palmeri, et al. 2009). Considering 125
that it has been postulated that estrogen-induced proliferative lesions could increase the ability of 126
cells to generate prime tumorigenic changes (Melmed 2003), our experimental conditions may 127
represent an accurate in vivo model for studying the outcome of pituitary senescence. In this 128
context, the aim of the present study was to investigate the emergence of cellular senescence as a 129
growth control mechanism during the progression of estrogen-induced pituitary tumors. 130
EXPERIMENTAL PROCEDURE 131
Animals and experimental models 132
Three-month-old Wistar strain male rats were maintained at controlled temperature (21±3°C) and 133
lighting conditions (14h light/10h dark), with free access to commercial laboratory chow and tap 134
water. Taking into account that exogenous estrogen excess induces pituitary tumors (Asa and Ezzat 135
2002; Mukdsi, et al. 2004), intact animals were treated with estradiol benzoate (Sigma Aldrich, St. 136
Louis, MO, USA) for 10, 20, 40 and 60 days (E10, E20, E40 and E60). Estrogen was implanted 137
subcutaneously in slow-releasing silastic brand capsules (Dow Corning, Medical grade, Midland, 138
MI, USA) filled with 10mg of estrogen crystals and sealed with silastic cement. The control group 139
was implanted with empty capsules. Rats were decapitated within 10 seconds after being removed 140
from their cage, thus avoiding any stress or external stimuli. Fresh pituitary glands were 141
Page 7 of 50

8
photographed in situ and weighed immediately after collection. Animals were kept in accordance 142
with the Guide for the Care and Use of Laboratory Animals, published by the United States 143
National Institutes of Health (1996), and the experiments were approved by the Institutional Animal 144
Care Committee of the School of Medicine, National University of Córdoba. 145
Circulating estrogen levels 146
Estrogen serum levels were measured by an electrochemiluminescence immunoassay (ECLIA) 147
from Roche Diagnostics GmBH, Mannheim, Germany, using the commercial Elecsys System 2010 148
(Elecsys Corporation, Lenexa, KS). For statistical purposes, the serum analyzed was obtained from 149
6 rats for each experimental group. 150
Pituitary cell dissociation 151
The protocol for pituitary cell dissociation has been previously described (De Paul, et al. 1997). 152
Briefly, rat pituitary glands were placed in minimal essential medium, and then minced and digested 153
with 0.4% w/v trypsin at constant slow agitation at 37°C. The cell suspension was gently dispersed 154
using flame-rounded Pasteur pipettes. Cell viability, tested with Trypan blue exclusion, was always 155
better than 90%. Cell dispersions were transferred to 1.5 ml Eppendorf tubes and centrifuged for 156
5min at 400 x g. 157
Cell culture 158
The rat somatolactotroph pituitary adenoma GH3B6 cell line was cultured in HAM-F12 medium 159
(Sigma; St Louis, USA) supplemented with 5% v/v fetal calf serum and 12% v/v horse serum 160
(Invitrogen; Carlsbad, USA), as previously described (Petiti, et al. 2010). After 3 days of culture 161
and 70% of confluence in order to recreate estrogenic doses administration at E40-E60, cells were 162
exposed to 17b estradiol (4 nM; Sigma; St. Louis, USA) or vehicle for 120 h and then submitted to 163
the cytochemical detection of senescence associated b-galactosidase staining. 164
Page 8 of 50

9
Cell Cycle Analysis 165
Dispersed pituitary cells from control and estrogenized animals were fixed in 70% v/v ice-cold 166
ethanol by gentle vortexing. After centrifugation (400 x g for 5 min), pellets were washed with 167
citrate-phosphate buffer pH7.8. Finally, cells were incubated with RNAse (Ribonuclease A 0,7mM; 168
Sigma Aldrich; St Louis, USA) at 37°C for 30 min, and stained with Propidium iodide (75 uM; 169
Sigma; St Louis, USA) for 1h. The fluorescence intensity was analyzed by flow cytometry using a 170
BD FACS Canto II, and cell cycle analysis of the DNA content was performed using ModFit LT 171
Program (Verity Software, Verity Software House, Topsham, ME, USA). For statistical purposes, 172
cellular dispersions from 9 animals of each experimental group were analyzed. 173
Cytochemical detection of SA-b-galactosidase staining 174
Senescence associated b-galactosidase (SA-b-gal) positive cells were detected by using a b-gal 175
staining kit (Senescence Cell Staining kit, Sigma-Aldrich), one of the most extended staining 176
methods for cellular senescence mentioned in the bibliography (Dimri et al. 1995; Lee et al. 2006). 177
Briefly, pituitary cryosections (8um thickness) were fixed in a mixture containing 2% v/v 178
formaldehyde and 0.2% v/v glutaraldehyde in PBS for 7 min. After washing, the staining solution 179
was added according to the manufacturer’s instructions and cryosections were incubated in a 37°C 180
warm room for 20 h. Pituitary sections were mounted and examined under light microscope and 181
photographed at 100X, with only senescent cells staining in blue at pH 6.0. In order to determine 182
the senescent cells index, dispersed pituitary cells from control and estrogenized animals, as well as 183
control and estrogen-stimulated tumoral GH3B6 cells, were subjected to the same SA-b-gal staining 184
procedure and counted in a Neubauer chamber. Rat kidney was used as positive control and the 185
same reaction, but omitting the substrate, served as negative controls. For statistical purposes, 186
randomly chosen visual fields photographed at 400X and 2,000 cells were counted for each cell 187
dispersion for all experimental groups in triplicate. 188
Page 9 of 50

10
Also, with the purpose of determining the double localization of SA-b-gal/Ki67 and SA-b-gal/ 189
prolactin (PRL) into the pituitary parenchyma, after performing the cytochemical detection of SA-190
b-gal staining, the same pituitary cryosections were processed by immunocytochemistry with 191
monoclonal anti-Ki67 antibody (1:50; BD Pharmingen™, Oxford, UK) or rabbit polyclonal anti-192
PRL (1:4,000; NIH Hormone Program, Bethesda, MD, USA, USA), as referred to the next section. 193
Immunocytochemistry 194
Paraffin-embedded pituitary glands were processed by immunocytochemistry for pATM, p53 and 195
Ki67. Sections (3 um thickness) were treated with 3% v ⁄ v hydrogen peroxide in methanol for 30 196
min to inhibit endogenous peroxidase, followed by an antigen retrieval method using a hot antigen 197
unmasking solution (0.01M citrate buffer; pH6.0). Then, sections were incubated for 30 min in 10% 198
v/v normal serum (Sigma Aldrich, St. Louis, MO, USA) to block nonspecific binding, which was 199
followed by overnight incubation with anti-Ki67 (1:50), rabbit polyclonal anti-p53 (1:200, Santa 200
Cruz, CA, USA), or mouse monoclonal anti-pATM (1:750; Abcam, Cambridge, UK) at 4°C in a 201
humidifier chamber. The sections were then incubated with biotinylated secondary antibodies and 202
ABC complex, with staining carried out using 3,3’-diaminobenzidine tetrahydrochloride as a 203
cromogen, according to the manufacturer’s instructions (Sigma Aldrich, St. Louis, MO, USA). 204
Diaminobenzidine (DAB; Sigma) was utilized as the chromogenic substrate for 10 min at RT, and 205
the sections were rinsed in running water, with hematoxylin being used as the counterstain (Sigma 206
Aldrich). Controls were performed by applying the same protocol, but omitting primary antibodies. 207
Slides from three animals of each experimental condition were photographed in randomly chosen 208
fields at 400X, with more than 2,000 immunoreactive cells being examined. The Ki67, p53 and 209
pATM labeling indexes were determined using NIH Image J software (National Institutes of Health, 210
Bethesda, MD), and the number of positively stained nuclei was recorded along with the total 211
nuclei. 212
Page 10 of 50

11
Also, to assess PRL/p21, PRL/Ki67, PRL/p53 and PRL/pATM co-localization, additional sets of 213
slides from different experimental conditions were processed for confocal laser scanning 214
microscopy. Paraffin-embedded pituitary sections were processed as mentioned before but 215
including 1 h in 70% v/v ethanol supplemented with 0.25% v/v NH3, while rehydrating the 216
deparaffinized sections in graded alcohol in order to reduce autofluorescence (Baschong, et al. 217
2001). Then, pituitary sections were incubated with anti-PRL (1:4,000) with anti-Ki67 (1:50), anti-218
pATM (1:750), anti-p21 (1:50; Santa Cruz, CA, USA) or p53 (1:300) for 1 hour. These slices were 219
washed, and further incubated with an Alexa 647 anti-rabbit or Alexa 594 anti-mouse secondary 220
antibodies (1:1,000; Invitrogen; Carlsbad, USA) for 1 hour. Images were then obtained using an 221
inverted confocal laser scanning microscope FluoView FV 1000 (Olympus; Tokyo, Japan) and 222
were collected with a 60X objective. The analysis of confocal microscopy images was carried out 223
using FV10-ASW 1.6 Viewer software. 224
Ultrastructural immunogold labeling 225
The subcellular localization of p21 and pATM in pituitaries was determined by a immuno-electron-226
microscopy post-embedding protocol as previously reported (Sabatino, et al. 2013). In brief, 227
pituitary glands were embedded in LR-White (London Resin Corporation, Berkshire, UK), and thin 228
sections were incubated overnight on a drop of anti-p21 or anti-pATM antiserum, which was 229
diluted 1:100. Immunoreactive sites were labeled with anti-mouse secondary antibody conjugated to 230
15 nm colloidal gold particles (1:30; Electron Microscopy Sciences; Hatfield, USA). Then, to 231
validate the specificity of the immunostaining, negative controls were performed, and the primary 232
antibodies were replaced with either 1% w/v BSA in PBS or diluted preimmune serum followed by 233
the corresponding secondary antibody. Finally, sections were stained with an aqueous uranyl acetate 234
saturate solution, and examined in a Zeiss LEO 906-E electron microscope and photographed with a 235
Megaview III camera. 236
Page 11 of 50

12
Also, the effect of estrogen as an inducer of pituitary tumor development was documented in 237
semithin sections from epoxy resin-embedded glands by high-resolution light microcopy. With this 238
aim, pituitaries from control and E60 were fixed in a mixture of 4% v/v formaldehyde and 2% v/v 239
glutaraldehyde in 0.1 M cacodylate buffer for 2 h and then treated with 1% OsO4 before being 240
stained in block with 1% v/v uranyl acetate, as previously described (De Paul, et al. 2009). After 241
dehydration with a series of graded cold acetones, glands were embedded in Araldite. Semithin 242
sections (200nm) were cut using a JEOL ultramicrotome with a diamond knife, stained with 243
Toluidine Blue and examined using a Zeiss Axiostar Plus light microscope (Oberkochen, 244
Germany). 245
Subcellular fractionation 246
The nuclear and cytoplasmic extracts from control and estrogen-treated rat pituitary glands were 247
prepared according to the method of Sugawara and co-workers (Sugawara, et al. 1993) with 248
modifications (Mukdsi et al. 2004). Briefly, three pituitaries per experimental group (from a total of 249
3 independent experiments) were minced and homogenized at 4°C with a teflon glass Potter 250
Elvehjem tissue grinder in 2ml 0.3M sucrose, 1mM EDTA, 1mM PMSF and 10mM Hepes/KOH 251
(pH7.5). The homogenate was centrifuged at 1,000 x g for 10 min, and the supernatant was 252
aliquoted and stored at -20ºC until required for cytoplasmic protein quantifications. The pellet, 253
containing the nuclear fraction was resuspended in 2ml solution of 0.3M sucrose, 1mM CaCl2, 254
10mM Tris HCl (pH7.5), 1mM DTT and protease inhibitors. Then, 75ul of 10% v/v Igepal CA-630 255
were added, and the solution was incubated at 4°C for 10 min and centrifuged at 250 x g for 5 min. 256
After washing the pellet once with the same buffer, it was resuspended in 2vol 20mM Hepes (pH 257
7.8), 0.6M KCl, 0.02mM ZnCl2, 0.2mM EGTA, 0.5mM DTT and protease inhibitors, and incubated 258
at 4°C for 30 min. The suspension was centrifuged at 20,000 x g at 4°C for 30 min, and aliquots 259
were stored frozen until being used in western blot assays. 260
Western Blotting analysis 261
Page 12 of 50
13
The total protein concentration was measured using a Bio-Rad kit (Bio-Rad Protein Assay, Bio-262
Rad; Hercules, USA) and subcellular fractions were run in 12% v/v acrylamide gel. To estimate the 263
corresponding molecular weights, the Full Range Rainbow molecular weight marker was used 264
(Amersham, Buckinghamshire, England). The membranes were incubated overnight at 4°C with the 265
corresponding primary antibody: rabbit polyclonal anti-MFN1(1:750), rabbit polyclonal anti-266
DRP1(1:500), rabbit polyclonal anti-RAS (1:200), rabbit polyclonal anti TGFb1 (1: 300), mouse 267
monoclonal anti-IL6 (1:200), mouse monoclonal anti-p21 (1:200), rabbit polyclonal anti-p53 268
(1:200), rabbit anti-total ERK1/2 (1:300) (Santa Cruz, CA, USA), rabbit polyclonal anti-NFkB 269
(1:1,000), rabbit polyclonal anti-IL1b (1:300) (Abcam, Cambridge, UK), rabbit polyclonal anti-270
COX 4 (1:100), rabbit polyclonal anti-pERK1/2 (1:700) (Cell Signaling Technology, Inc.; Boston, 271
USA), mouse monoclonal anti-b-actin (1:1,000) or rabbit polyclonal anti-HDAC1 (1: 500; Sigma 272
Aldrich, USA). After washing, blots were incubated with a peroxidase conjugated (HRP) goat anti-273
rabbit (1:2,500) or goat anti-mouse (1:2,500) diluted in blocking buffer, rinsed in PBS/0.1% v/v 274
Tween 20, and revealed with an Enhanced Chemiluminescence detection system (ECL, Amersham 275
Biosciences, Buckinghamshire, UK). Emitted light was captured on Hyperfilm (Amersham 276
Pharmacia Biotech, Buckinghamshire, UK), and the b-actin, COX 4 and HDAC1 expressions were 277
used as loading controls. 278
Detection of apoptosis by DNA nick-end labeling 279
Nick-end labeling was detected using the TUNEL technique, as previously reported (Palmeri et al. 280
2009). Pituitary sections fixed on glass slides were processed as stated in the manufacturer's 281
protocol (in situ Cell Death Detection kit. Roche, Mannheim, Germany). As positive control, the 282
reaction was carried out on DNAse recombinant I (6,500 U/ml, Invitrogen) treated sections to 283
induce DNA strand breaks prior to the labeling procedure. Slides were observed using a Zeiss 284
Axiostar plus microscope at 400X. 285
Statistical analysis 286
Page 13 of 50

14
The statistical analysis was carried out using an analysis of variance with Fisher’s post-test (InfoStat 287
version 2004; Grupo InfoStat, Facultad de Ciencias Agropecuarias, Universidad Nacional de 288
Córdoba, Argentina). In order to analyze the binomial proportion data resulting from counting the 289
data of the cytochemichal reactions, a generalized linear mixed modeling procedure of InfoStat 290
software was utilized with a model that included the fixed effect of treatment (with the logit link 291
function being the default for binomial proportion data). The results were given as the means ± 292
SEM, and the data were obtained from three replicates measured for three independent experiments. 293
The significance levels were chosen at P< 0.05. 294
RESULTS 295
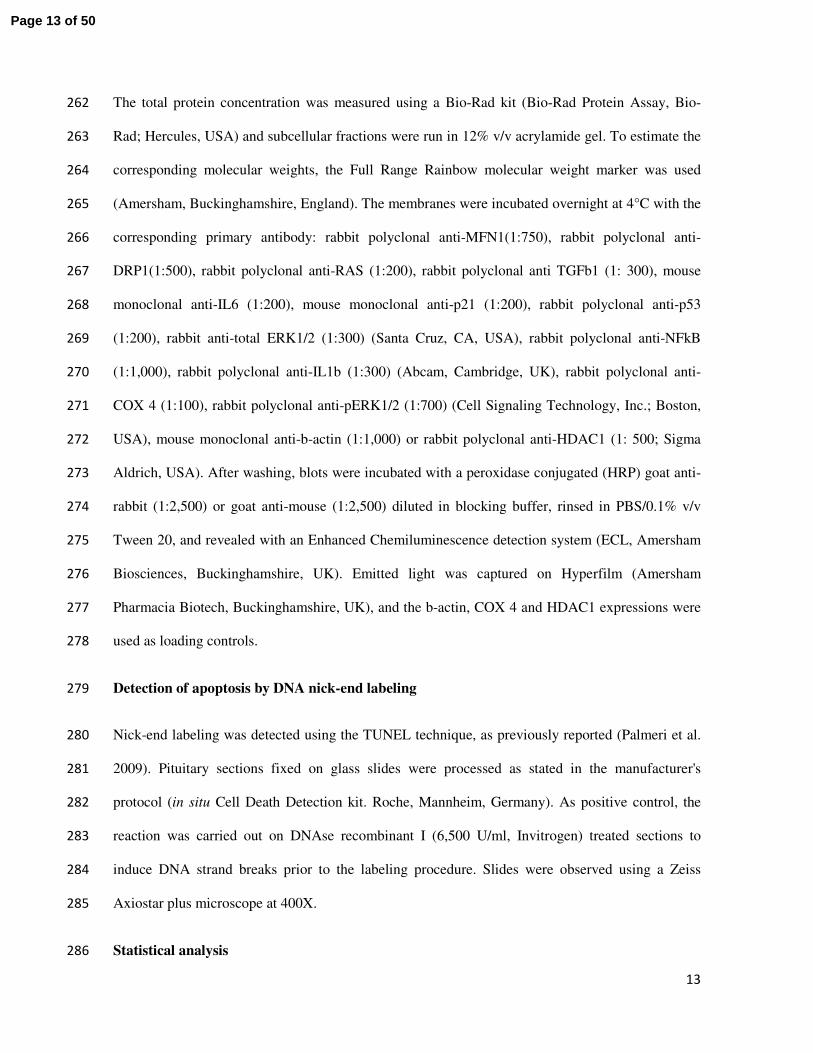
Estrogen treatment induced pituitary tumor development 296
For the purpose of evaluating the cellular senescence during the progression of the experimental 297
pituitary tumors, proliferative lesions were induced in Wistar male rats as previously reported 298
(Mukdsi et al. 2006; Sabatino et al. 2013). For all the periods analyzed: E10, E20, E40, and E60, the 299
mean values of the serum estradiol levels were above 3.7 nM (4.00±0.18 nM in E40), representing 300
100 times more than those achieved in control rats (0.18±0.01 nM). The effect of prolonged 301
estrogen administration on pituitary mass expansion was examined and a significant and 302
progressive increase was observed, with the highest values being obtained at E60 (Figure 1A). This 303
was also corroborated by the macroscopic observation in sellae, which revealed a notable size 304
growth compared to normal pituitaries (Figure 1B). The increase in the pituitary weight was also 305
accompanied by vascular channel enlargement (Figure 1C) with noticeable cellular hypertrophy 306
being observed by high-resolution light microcopy (Figure 1D). 307
Next, we analyzed the time-course changes during the pituitary tumor development by determining 308
the Ki67 labeling index. The quantification of Ki67-immunopositive cells revealed a significant 309
increase in cell proliferation for all time periods analyzed compared to controls, with a peak reached 310
Page 14 of 50

15
of approximately 8-fold higher at E10. In spite of the noteworthy pituitary proliferative response, 311
the estrogen-induced mitogenic potential rate was not sustained for the whole period analyzed and 312
successively decreased after the E10 condition. Interestingly at E60, the proliferative rate exhibited 313
a progressive reduction compared to that attained at E10, with minimal changes observed from E40, 314
which might indicate a plateau phase, although this index still continued to be higher, reaching 315
three-fold higher than the control values (Figure 2A-B). 316
RAS deregulated oncogenic signaling induces cellular senescence (Braig et al. 2005; Collado et al. 317
2005; Chen, et al. 2005; Michaloglou et al. 2005). Thus, to determine the contribution of 318
RAS/ERK1-2 signaling during the estrogen-induced pituitary tumor development, their expression 319
levels were analyzed by western blotting. As shown in Figure 2C, RAS signaling was progressively 320
suppressed, with its expression being less evident at E40-E60 than at baseline conditions of normal 321
pituitaries. When the pERK1/2 protein was analyzed, a similar pattern expression was observed for 322
its phosphorylated form during the development of experimental pituitary tumors. 323
Finally, to examine if this decrease in cell proliferation could be due to apoptosis, we also 324
determined the biochemical features of this type of cell death in pituitary cells by the TUNEL 325
method. As shown in Figure 3, for all experimental groups, the signs of apoptotic nuclei were 326
practically absent with no significant changes in the number of TUNEL-positive cells being 327
detected, thus suggesting that the modifications observed in the growth rate could not have been 328
associated with apoptosis. 329
Tumoral pituitary cells acquired features of the cellular senescence phenotype 330
To try to determine whether cellular senescence takes place during estrogen-induced pituitary tumor 331
development, we turned our attention to the detection of SA-b-gal, and as shown in Figure 4A a 332
progressive rise in the enzymatic activity was observed. In order to perform a morphometric 333
analysis of these modifications, the SA-b-gal reaction was also developed on dispersed pituitary 334
cells. The SA-b-gal-positive cell index revealed a baseline expression at around 7% of the total 335
Page 15 of 50

16
pituitary cells, whereas in pituitary tumors a significantly higher number of SA-b-gal positive cells 336
was observed, with values ranging from almost 3-fold in the earliest days of the proliferative injury 337
and rising over time until a 5-fold increase was recorded at E60 (Figure 4C). 338
Since it has been previously described that cellular senescence might be overcome in order to 339
develop unregulated cell proliferation (Campisi 2005; Collado and Serrano 2010), we next 340
evaluated SA-b-gal reactivity in the established GH3B6 pituitary tumor cell line under baseline 341
conditions as well as after sustained estrogen stimulation. As expected, positive cells were scarce, 342
hardly exceeding 1-2%, a value far below those obtained in tumoral pituitaries (Figure 4B-C). 343
Hence, during estrogen-induced pituitary tumor development, a cellular senescence process might 344
be emerging, while GH3B6 pituitary tumoral cells rarely become senescent. 345
Furthermore, we determined the SA-b-gal-reactivity and Ki67 staining in the same cryosection for 346
each experimental condition. As shown in Figure 5 for all examined conditions, the cellular 347
senescence response was noticeably profuse regarding cell proliferation. By analyzing the joint 348
progression of both biomarkers during the tumoral development, we found that, toward E40 and 349
E60, it was possible to discriminate pituitary parenchyma differential areas in which Ki67 positive 350
cells were predominant and adjacent zones bore a higher proportion of cells exhibiting the SA-b-gal 351
stain. 352
To investigate the senescence associated secretory phenotype (SASP) and NFkB expression 353
involvement (Freund, et al. 2010; Kuilman et al. 2008), next we evaluated IL6, IL1b, TGFb1 and 354
NFkB protein expression levels in pituitary extracts by western blotting. As shown in Figure 6A, a 355
remarkable increase in IL6 expression levels toward E40 and E60 was detected. In agreement with 356
this result, we also showed increases in IL1b and TGFb1 protein expression levels from E20 to E60 357
(Figure 6A). These responses were also accompanied by a rise in both the cytoplasmic and nuclear 358
NFkB expression, indicating the latter’s activation in the context of an experimental pituitary tumor 359
(Figure 6B). These data suggest that under the present experimental context, inflammatory network 360
activation was triggered for this context together with cellular senescence response. 361
Page 16 of 50

17
In order to further characterize the senescence phenotype achieved by tumoral pituitaries, we were 362
also interested in determining whether the mitochondrial dynamics has been compromised, since it 363
was previously reported that mitochondrial dysfunction may facilitate cellular senescence 364
emergence (Moiseeva et al. 2009). Thus, by western blotting, the expression of mitofusin 1 (MFN1) 365
and dynamin-related protein 1 (DRP1) were assessed as indicators of fusion and fission processes, 366
respectively. As shown in Figure 6C, both proteins were affected during the development of 367
experimental pituitary tumors, while MFN1 protein expression was progressively up-regulated; the 368
DRP1 expression was notably decreased during in vivo pituitary tumor development. 369
Activated DNA damage signaling, p21 accumulation and an abnormal cell cycle profile are 370
displayed in experimental pituitary tumors. 371
The pattern of expression of several key cycle regulators involved in the senescence pathways was 372
examined. Considering that the DNA damage response (DDR) plays an essential role in the 373
senescence pathways (Di Micco et al. 2006), we aimed to find out if SA-b-gal expression was 374
accompanied by DDR activation. 375
By immunocytochemistry, a significant increase in the number of pituitary cells displaying nuclear 376
pATM expression was detected in experimental pituitary tumors, reflecting the activation of DNA 377
damage signaling. The pATM signal showed a sustained increase from E10 to E60, with a 378
significant peak of nuclear pATM positive cells of around 30% at E40 (Figure 7A-B). The pATM 379
subcellular localization was corroborated by electron microscopy immunogold labeling, which 380
revealed both nuclear and cytoplasmic immunoreactivity in tumoral pituitaries taking place at E40 381
(Figure 7C). 382
The p53 protein, one of the major regulators of cell cycle progression in response to DNA damage 383
or arrest of DNA synthesis, is considered to be an ATM target (Pluquet and Hainaut 2001). Using 384
immunocytochemistry, an increase in p53 expression was detected for E10 and E20, whereas for 385
E40 this signal was no longer observed (Figure 8A). Considering that the p53 function is related to 386
Page 17 of 50

18
its intracellular localization, we also analyzed p53 subcellular expression by western blotting from 387
nuclear and cytoplasmic pituitary extracts. An important increase in p53 signaling was 388
immunodetected from E20 in the cytosolic compartment of pituitary cells, while a decrease in p53 389
nuclear fraction levels starting at E20 was also observed (Figure 8B). Therefore, we next evaluated 390
the expression of the CDK inhibitor p21 protein, a transcriptional target for p53 which is involved 391
in cell cycle responses to DNA damage (Besson, et al. 2008). By Western blotting analysis, an 392
increase in the nuclear p21 was observed, starting from E20 and strengthened over time from 40 to 393
60 days of tumor development (Figure 9A). The subcellular localization of p21 analyzed by 394
electron microscopy immunogold labeling for E40 pituitary glands revealed a streaking 395
immunoreactivity in the nuclear and cytoplasmic compartments of pituitary cells (Figure 9B), a 396
result that might be related to with the lower pituitary cell proliferation detected at E40 (Figure 2A-397
B). Moreover, p21 cytoplasmic accumulation was also observed for E20 and E40. However, an 398
additional evaluation performed on GH3B6 tumoral pituitary cells showed that these cells did not 399
express p21 (Figure 9C), which could be associated to the low SA-b-gal reactivity observed in this 400
cell type (Figure 4B-C). 401
Alterations in the pituitary cell cycle profile were analyzed by FACS, and in order to try to 402
discriminate between the cycling population and S-phase arrest, the S-phase was compared with the 403
G2/M population, with the result being expressed as a ratio. As shown in Figure 9D, a significant 404
increase in the S-phase / G2/M ratio was detected for E40 compared to the control ratio 405
(57.63±14.87 vs 12.59±10.86 respectively; p<0.05). These results together with the DDR activation 406
and p21 up-regulation, reinforce the possibility of a delay occurring in the cell cycle progression, 407
which became more evident toward 40 days of tumor progression. 408
Senescence markers are not restricted to PRL-cells 409
As most pituitary tumors induced by estrogen in experimental animals are PRL-secreting tumors 410
(De Nicola, et al. 1978; Mukdsi et al. 2004; Sadoul, et al. 1992; Wiklund, et al. 1981), we attempted 411
Page 18 of 50

19
to determine if lactotroph specific cell lineage was involved in the pituitary senescent response. The 412
co-localization between PRL/Ki67, PRL/p21, PRL/p53, PRL/pATM and PRL/Sa-b-gal proteins was 413
carried out by dual immunolabeling for different experimental conditions. As shown in Figure 10, 414
for all the combination of markers analyzed it was possible to detect double-stained cells, indicative 415
of lactotrophs which might possibly be senescent as shown by SA-b-gal, DNA damage response 416
activation by pATM, or p21 accumulation indicating cellular arrest. However along with double-417
stained cells, it was also possible to observe single-stained cells, representative of either non-418
senescent lactotrophs or non-lactotroph cells undergoing senescence. Therefore, none of the marker 419
expressions examined exclusively co-localized with PRL-positive cells, suggesting that the 420
senescence phenomena may not be restricted to lactotroph populations. 421
DISCUSSION 422
In the present study, we have demonstrated clear evidence of pituitary senescence taking place 423
during in vivo estrogen-induced pituitary tumor development. The cell proliferation reduction and 424
expression of cellular senescence features such as SA-b-gal and IL6 expression, as well as DNA 425
damage signaling activation and p21 expression, indicate a role for senescence in the regulation of 426
pituitary cell growth. 427
The particularities of benign pituitary tumors have led to the appearance of senescence being 428
considered, which has been proposed as an intrinsic barrier for tumor development that emerges at 429
the early stages of neoplastic growth (Prieur and Peeper 2008). This pituitary cellular response 430
might be beneficial for organisms, since it allows proliferation to be arrested while maintaining its 431
physiological functions (Adams 2009), and therefore, hormones may continue to be secreted (Mooi 432
2009). 433
The tumor suppression role of cellular senescence has been convincingly established in vitro 434
(Bringold and Serrano 2000; Campisi 2001; Mooi and Peeper 2006), but further evidence is still 435
needed to demonstrate the relationship between in vivo senescence and proliferation control 436
Page 19 of 50

20
(Collado and Serrano 2010; Mooi and Peeper 2006). Under this context, benign pituitary 437
microadenomas are faithful models of in vivo senescence (Chesnokova and Melmed 2010; Mooi 438
2009). Previous studies have already reported that murine pituitary adenomas with altered PTTG 439
and Rb expression trigger cellular senescence (Chesnokova et al. 2008; Chesnokova et al. 2007). 440
These authors also correlated the high levels of growth hormone (GH) with the senescence-441
associated markers in adenoma, and suggested that cellular senescence is activated in a lineage-442
specific fashion (Chesnokova, et al. 2013; Chesnokova et al. 2008; Chesnokova et al. 2011). 443
However, to date, no attempt has been made to analyze the emergence of cellular senescence with 444
pituitary tumor progression in the absence of genetic manipulation or specific senescence-inducing 445
stimuli. Here, we have demonstrated that both senescence markers and DNA damage signaling 446
were expressed during the development of estrogen-induced pituitary tumors. This present in vivo 447
approach allows us to suggest a role of cellular senescence as a pituitary intrinsic response to 448
chronic cellular over-activation. 449
Although the pituitary cells of adult rats are characterized by low proliferation rates (0.7-0.8%) 450
(McNicol and Carbajo-Perez 1999), we have observed a strong stimulation of cell proliferation 451
accompanied by hypertrophy and vascular network development after the start of estrogen 452
treatment, with all of these parameters contributing to the significant mass increase revealed by 453
assessing the wet pituitary weight data. Despite the proliferation index still presenting significantly 454
higher values at E60 than those detected in controls, the initial increase in cell proliferation lost 455
potency at advanced end-points, indicating a plateau phase in the cell proliferation rate until the end 456
of stimulation, as shown by Ki67 immunoreactivity. Consequently, this biphasic pattern might be 457
distinct from the exponential proliferation typically associated with aggressive tumoral progression 458
(Hanahan and Weinberg 2000).. 459
Furthermore, GH3B6 represents an equivalent for estrogen-induced pituitary tumor cells, but as an 460
established and autonomous pituitary tumoral stage, showing a basal proliferation rate of around 25-461
30% of total cells (Giles, et al. 2010; Petiti, et al. 2015), while normal pituitary cells showed 1% of 462
Page 20 of 50

21
proliferation, with the replication index of estrogen-induced pituitary tumoral cells reaching a 463
maximum of 8%. The use of this tumoral cell line permitted us to analyze the presence of cellular 464
senescence in a cell population, which might represent a clone in the heterotypic tumor complexity 465
that has acquired growth signaling autonomy and may possibly have lost the ability to respond to 466
some cellular arrest signals. 467
Although intrinsic tumoral suppression has been classically associated with apoptosis induction 468
(Lowe, et al. 2004), we either detected very few apoptosis events throughout the adenoma 469
development, in agreement with previous findings (Palmeri et al. 2009; Spady, et al. 1999). Earlier 470
reports have demonstrated that estrogen administration enhances cell survival in the anterior 471
pituitary gland by inhibiting apoptosis (Spady et al. 1999). Therefore, an apoptotic block manifested 472
during an estrogen-induced tumor development may support pituitary senescence being a 473
cytological stress response (Marcotte, et al. 2004). In this way, senescence might be a more 474
appropriate mechanism for pituitary tumor suppression, taking into account that the pituitary gland 475
is critical for the homeostatic function, but which exhibits a regenerative capacity (Chesnokova et 476
al. 2013). 477
It is known that multiple processes might take place in the gland during tumor development. In fact, 478
it is the balance between proliferation with death or senescence that determines the growth rate of a 479
particular tumor (Lowe et al. 2004). The determination of double SA-b-gal-/Ki67positive cells 480
allowed us to confirm the idea that senescence is an important outcome in estrogen-induced 481
pituitary tumors, as it was observed to be profuse regarding cell proliferation. In addition, the non-482
overlapped distribution of Ki67 and SA-b-gal positive cells observed at E60 supported the 483
hypothesis of heterotypic cell populations that coexist during tumor development. Hence, it is 484
possible to associate this coexistence of different kinds of responses to the fact that five cell-types 485
constitute the pituitary cell population. Thus, specific diverse cell-type trophic pathways may be 486
activated in reaction to long term estrogen treatment. 487
Page 21 of 50

22
Considering that the senescent cell phenotype still lacks specific markers, in the present study 488
several senescence-associated features were evaluated in order to investigate this cellular 489
mechanism. The strong association between the SASP pattern and the other senescence biomarkers 490
(p21, pATM and Sa-b-gal) led us to connect these increased cytokine expressions with emerging 491
pituitary senescence during estrogen-induced pituitary tumors. A putative role for IL6 in pituitary 492
senescence induction has been previously suggested (Fuertes, et al. 2010), with TGFb1 and IL1b 493
also having a known impact on pituitary tissue homeostasis (Haedo, et al. 2009). We recently 494
demonstrated somatolactotroph GH3B6 tumoral cells exhibiting a refractory behavior to the TGFb1 495
inhibitory effects on cell cycle progression, as a consequence of the crosstalk with proliferative 496
pathways that counterbalances the TGFb1 signal (Petiti et al. 2015). Considering the specific 497
activities implied in the secretion of each cytokine, while IL6 is considered to be a critical controller 498
of the SASP and seems to have a more significant role in autocrine senescence (Kuilman et al. 499
2008), the TGFb1 and IL-1 as SASP factors are able to trigger senescence by paracrine actions 500
(Hubackova, et al. 2012). 501
In this regard, it is known that the proteins encoded by NFkB target genes contribute in multiple 502
ways to the biological effects of NFkB, which include inflammation response, apoptosis, mitogenic 503
activity, implications in the evolution of neoplastic injuries, cellular senescence and DNA repair 504
(Hayden and Ghosh 2004; Pikarsky and Ben-Neriah 2006). Furthermore, NFkB operates as a 505
molecular switch that conveys signals from an intricate signaling network, thereby regulating 506
essential processes through the gene transcription regulation. 507
Regarding the focus of our study, NFkB cooperates through feedback regulation within the 508
senescence process, since it can trigger SASP in response to persistent DNA damage signaling 509
(Freund et al. 2010). Therefore, we focused on NFkB activity as an accompaniment of the SASP 510
activation evidence, rather than the association with growth regulation pathways in which NFkB 511
activity may also surely participate (Freund et al. 2010). In this context, several reports have 512
implied that SASP induction is an NFkB-dependent mechanism (Acosta, et al. 2008; Chien, et al. 513
Page 22 of 50

23
2011; Salminen, et al. 2012), suggesting that the SASP is caused primarily by genotoxic stress 514
rather than by proliferative arrest per se (Freund et al. 2010). From our data, the notable increase in 515
SASP component expression with NFkB activation suggests that the inflammatory network was 516
triggered during pituitary tumor development. Under the present experimental context, the 517
expression of these cytokines collectively reinforces the role of SASP in ensuring an efficient 518
growth arrest, as was also proposed by others (Acosta et al. 2008; Kuilman et al. 2008; Wajapeyee, 519
et al. 2008; Yang, et al. 2006). 520
The mitochondrial metabolism is also compromised during cellular senescence, since DNA damage 521
can be powered by oxidative stress triggering premature senescence (Moiseeva et al. 2009). In our 522
study, we detected a decreased DRP1 together with increased MFN1 expression, suggestive of a 523
misbalance between mitochondrial fission toward fusion processes in favor of an enlargement of the 524
organelle. Therefore, the alteration of the mitochondrial dynamics equilibrium toward the 525
prevalence of fusion processes might indicate an adaptation of the functionality of this organelle 526
during pituitary tumor development, occurring together with cellular senescence. Regarding this, an 527
ineffective mitochondrial fission triggering cellular senescence has been previously described (Lee 528
et al. 2007). 529
In view of the fact that our experimental conditions did not include cytotoxic drugs, irradiation 530
stimuli or other stimuli strongly associated with DNA damage or senescence induction, the 531
manifestation of senescence signs during the development of the pituitary tumor constitutes a 532
noteworthy finding of our study. Nevertheless, it cannot be ignored that a multiplicity of molecular 533
pathways could be involved in the development of estrogen-induced pituitary tumors (Sarkar 2006). 534
Regarding this, we analyzed RAS/ERK pathway activation due to the fact that abnormally high 535
mitogenic signals such as estrogen-induced RAS activation (Weigel 1996) might function as a 536
prolonged cellular over-activation capable of inducing cellular senescence (Serrano and Blasco 537
2001). However, this key core element is part of a complex signaling network with many 538
interactions (McKay and Morrison 2007), and there have been extensive attempts to clarify its 539
Page 23 of 50

24
contribution in the promotion of cell growth, with it being the fine regulation of these pathways 540
which determines cell cycle arrest or malignant transformation (Roberts and Der 2007; Serrano, et 541
al. 1997). Moreover, although there are some studies showing increases in RAS/ERK activity in 542
pituitary tumors (Cai, et al. 1994; Dworakowska, et al. 2009; Karga, et al. 1992), its role in these 543
tumors is far from being fully deciphered (Cakir and Grossman 2009). In our study, RAS/p-ERK 544
signaling was progressively suppressed thereafter, with its expression being less evident at E40-E60 545
than at baseline conditions. These results imply that RAS/ERK effects were therefore -to a major 546
extent- impaired, and that there might exist a regulation mechanism which could attenuate the 547
abnormal mitogenic signals. Supporting this notion, Courtois-Cox and co-workers (2006) have 548
shown that the suppression of RAS is sufficient to induce cellular senescence, and that this event, 549
on its own, can activate the known downstream mediators of the senescence response through a 550
variety of mechanisms. 551
The detection of pATM expression demonstrated in our study suggests the possibility of DNA 552
damage during experimental tumoral development, since ATM has been reported to be one of the 553
first proteins that responds to DDR (Di Micco et al. 2006). Therefore, the combination of a very 554
high mitogenic signaling, the possibility of chromatin disorder and a blockage of apoptosis might 555
favor the emergence of cellular senescence as an alternative to control pituitary growth 556
(Chesnokova and Melmed 2010; Di Micco et al. 2006). 557
As senescence pathway involves cell cycle machinery committed to cellular arrest (Kuilman, et al. 558
2010), we evaluated pituitary cellular arrest through the analysis of the p53 and p21 restriction-559
point cell cycle proteins and the cell cycle profile. 560
It is known that p53 integrates complex signaling networks, increasing lifespan through genome 561
maintenance and triggering various cell fate decisions (Rodier et al. 2007). At the early stages of 562
pituitary tumor development, we observed an increase in p53 expression levels, with its intracellular 563
localization being principally detected in the cytoplasm compartment. Furthermore, since it has 564
been described that estrogen induces p53 inactivation through intracellular redistribution towards 565
Page 24 of 50

25
the cytosol (Molinari, et al. 2000), our findings could be interpreted as a p53 stabilization 566
mechanism, as previously suggested (Liu, et al. 2006). Despite having found DDR activation, the 567
cytoplasmic p53 retention might indicate its incapability to exert its canonical functions, thereby 568
triggering a response that either repairs DNA damage or else removes the affected cell from the 569
replicative pool. This indirect evidence may explain the great accumulation of pATM signaling, 570
thus in turn favoring the increase in the senescence signs observed at E40. 571
Although in most cells p53 is crucial for a senescence response following DNA damage (Di 572
Leonardo, et al. 1994), in others it is only required to induce senescence growth arrest and not 573
necessary for the maintenance of senescence, which subsequently becomes irreversible and p53 574
independent (Beausejour, et al. 2003). Thus, cellular senescence might not appear to entail a 575
consistent sustained rise in p53 protein levels (Itahana, et al. 2001). Under our experimental 576
conditions, it is possible that nuclear p53 initiated both senescence growth arrest and some of the 577
functional aspects of the senescent phenotype by inducing p21. These p21 levels can then be 578
sustained, at least for several weeks, by a p53-independent mechanism (Itahana et al. 2001). 579
CDK inhibitor p21 expression, strongly related to cellular senescence pathways, elicits cell cycle 580
arrest (Roninson 2002). Pituitary growth control by p21 has already been described, indicating its 581
key role in senescence pathways, while it was undetectable in pituitary carcinomas (Chesnokova et 582
al. 2007). Here, the up-regulation of nuclear p21 protein expression in close relationship with the 583
highest levels of SA-b-gal reactivity, suggests that cell cycle restraint might take place during the 584
development of pituitary tumors. Moreover, in our study, the lack of SA-b-gal and p21 protein 585
expression reactivity in GH3B6 pituitary cells indicates the incapability of these cells to trigger a 586
self-limiting senescence arrest at the tumoral stage acquired in GH3B6 cells. In fact, Chesnokova 587
and coworkers (2008) have already reported that p21 expression underlies decreased pituitary tumor 588
development, and that this CDK inhibitor was undetectable in tested human pituitary carcinomas. 589
Thus, under the present experimental conditions, p21 might constitute another significant mediator 590
in constraining pituitary growth in tumor development. In addition, it has been reported that this 591
Page 25 of 50

26
CDK inhibitor can function under either p53-dependent or independent conditions (Gartel and 592
Tyner 1999). Considering that in our study no association between the increase in p21 levels with a 593
p53 expression pattern was seen, p21 might therefore be induced in a p53-independent fashion. In 594
agreement with this, p53-independent effects of p21 have also been reported in relation to cell cycle 595
arrest of senescent cells (Noda, et al. 1994). Furthermore, some studies have presented evidence of 596
induction of the CDK inhibitor p21 in response to activation of the cytokines IL6 and TGFb signal 597
transduction pathways (Bellido, et al. 1998; Florenes, et al. 1999; Zeng and el-Deiry 1996). Thus, 598
SASP induction in experimental pituitary tumors may be responsible for senescence cell growth 599
arrest through p21 induction. Concerning the increase of cytoplasmic p21 observed, this data could 600
be interpreted as the outcome of the increased p21 synthesis or a degradation taking place in the 601
cytoplasm. Nonetheless, it may also be linked to apoptosis delay or inhibition due to pleitropic 602
context-dependant p21 functions (Arai, et al. 2006). 603
The CDK inhibitor p21 is also responsible for inhibiting ongoing DNA synthesis, thus allowing 604
time for DNA repair (Luo, et al. 1995), and also playing a role in the G2 phase transition (Besson et 605
al. 2008). The significant decrease in the G2/M cell proportion observed at E40, concomitant with 606
an increase in p21 expression and DDR activation, may indicate a p21-mediated blockage of 607
ongoing DNA synthesis, which was involved, at least in part, in the declining cell progression from 608
the S phase to G2/M. Considering that S-phase checkpoint activation in response to DNA damage 609
has been previously reported (Knudsen, et al. 2000; Ogryzko, et al. 1997; Pedeux, et al. 1998), our 610
results suggest a possible delay taking place in the cell cycle progression mediated by p21, 611
provoked by the occurrence of high DDR signaling. 612
Considering that prolactinomas are the most frequently occurring neoplasms in humans and in 613
laboratory animals (Ciccarelli, et al. 2005), we found that, during estrogen-induced pituitary tumor 614
growth, the expression of all the senescence markers used was not confined to the lactotroph 615
population. The direct assumption of the involvement of PRL-cells in pituitary senescence may be 616
premature for several reasons. Firstly, alpha and beta estrogen receptors are also present in 617
Page 26 of 50

27
folliculostellate (Mitchner, et al. 1998), somatotroph, thyrotroph and gonadotroph cells (Gonzalez, 618
et al. 2008; Nishihara, et al. 2000). Also, compelling reports by Nolan & Levy (2009) in Wistar 619
male rats have shown that approximately two-thirds of anterior pituitary cell divisions after estrogen 620
treatment occur in non-prolactin-positive cells, with only one-thirds of the mitotic figures 621
corresponding to lactotroph cells. 622
PRL-cells might represent a phenotype less sensitive to growth inhibition programs. Indeed, other 623
reports have suggested that the senescence contribution to benign pituitary tumor development 624
might be cell-type specific rather than universal. In agreement, Chesnokova et al (2008) have 625
described senescence taking place predominantly in GH-secreting, and to a lesser extent in PRL-626
secreting. Additionally, Alexandraki et al (2012) showed that SA-b-gal is over-expressed only in 627
non-functional pituitary adenomas and GH-secreting tumors, with these adenomas, in the context of 628
senescence, behaving differently compared to ACTH- and PRL-secreting adenomas. Finally, as the 629
great majority of pituitary carcinomas are derived from these latter types of adenoma, we might 630
speculate that the lack or bypass of senescence in lactotrophs may permit the occasional 631
prolactinoma to develop into a carcinoma. Here, we have provided evidence for the involvement of 632
senescence from the early proliferative response of the pituitary gland to estrogen and also we have 633
demonstrated that the changes observed were not associated exclusively with PRL-cells. 634
In summary, in the present study, we have demonstrated clear evidence of the emergence of 635
pituitary senescence in the development of tumoral pituitary injuries induced by estrogen. The 636
association between DDR activation, SA-b-gal expression and p21 involvement constitutes a 637
reliable combination of senescence-associated markers for in vivo pituitary senescence detection. 638
Moreover, the participation of cellular senescence should be conceived as a contributing component 639
behind the strikingly benign intrinsic nature of pituitary adenomas, thereby influencing the 640
capability of the pituitary gland to avoid unregulated cell proliferation. Understanding this 641
mechanism might provide significant insights into cancer control networks and lead to new 642
therapeutic strategies. The future recognition of the intracellular targets involved in the responses to 643
Page 27 of 50

28
anti-mitogenic signals would also help to interpret the abnormalities responsible for their 644
dysfunction in tumorigenesis. 645
646
Disclosure Statement: The authors have nothing to disclose. 647
FUNDING 648
This work was supported by the Fondo Nacional de Ciencia y Tecnología (FONCYT), Consejo 649
Nacional de Investigaciones Científicas y Técnicas (CONICET) and Secretaría de Ciencia y 650
Tecnología de la Universidad Nacional de Córdoba (SECyT-UNC). M.E.S. and P.A.P. are doctoral 651
fellows at the Consejo Nacional de Investigaciones Científicas y Técnicas. L.d.V.S.and C.L are 652
postdoctoral fellows at Consejo Nacional de Investigaciones Científicas y Técnicas. J.P.P, S.G., and 653
A.I.T. are established researchers at the Centro de Microscopía Electrónica, Instituto de 654
Investigaciones en Ciencias de la Salud, Consejo Nacional de Investigaciones Científicas y 655
Técnicas (INICSA-CONICET), Facultad de Ciencias Médicas, Universidad Nacional de Córdoba. 656
A.L. is established researcher at the Conselho Nacional de Desenvolvimento Científico e 657
Tecnológico (CNPq), Laboratorio de Bioenergética y Estrés Oxidativo, Departamento de 658
Bioquímica, Centro de Ciencias Biológicas, Universidad Federal de Santa Catarina, Brasil. 659
ACKNOWLEDGEMENTS 660
The authors wish to thank Ms. Elena Pereyra and Ms. Lucía Artino for their excellent technical 661
assistance. We would also like to thank native speaker Dr. Paul Hobson for revising the English of 662
the manuscript. 663
This work was supported by Consejo Nacional de Investigaciones Científicas y Técnicas 664
(CONICET), Fondos para la Investigación Científica y Tecnológica (FONCyT - ANPCyT) and 665
Page 28 of 50

29
Secretaría de Ciencia y Tecnología de la Universidad Nacional de Córdoba (SECyT-UNC). 666
667
668
Page 29 of 50

30
REFERENCES 669
Acosta JC, O'Loghlen A, Banito A, Guijarro MV, Augert A, Raguz S, Fumagalli M, Da Costa M, Brown 670
C, Popov N, et al. 2008 Chemokine signaling via the CXCR2 receptor reinforces senescence. Cell 671
133 1006-1018. 672
Adams PD 2009 Healing and hurting: molecular mechanisms, functions, and pathologies of cellular 673
senescence. Mol Cell 36 2-14. 674
Alexandraki KI, Munayem Khan M, Chahal HS, Dalantaeva NS, Trivellin G, Berney DM, Caron P, 675
Popovic V, Pfeifer M, Jordan S, et al. 2012 Oncogene-induced senescence in pituitary adenomas 676
and carcinomas. Hormones (Athens) 11 297-307. 677
Arai D, Nomura N, Fukuchi K & Gomi K 2006 Cytoplasmic Localization of Cyclin Kinase Inhibitor p21 678
Delays the Progression of Apoptosis. CANCER GENOMICS & PROTEOMICS 3 10. 679
Asa SL & Ezzat S 2002 The pathogenesis of pituitary tumours. Nat Rev Cancer 2 836-849. 680
Asa SL & Ezzat S 2009 The pathogenesis of pituitary tumors. Annu Rev Pathol 4 97-126. 681
Baschong W, Suetterlin R & Laeng RH 2001 Control of autofluorescence of archival formaldehyde-682
fixed, paraffin-embedded tissue in confocal laser scanning microscopy (CLSM). J Histochem 683
Cytochem 49 1565-1572. 684
Beausejour CM, Krtolica A, Galimi F, Narita M, Lowe SW, Yaswen P & Campisi J 2003 Reversal of 685
human cellular senescence: roles of the p53 and p16 pathways. EMBO J 22 4212-4222. 686
Bellido T, O'Brien CA, Roberson PK & Manolagas SC 1998 Transcriptional activation of the 687
p21(WAF1,CIP1,SDI1) gene by interleukin-6 type cytokines. A prerequisite for their pro-688
differentiating and anti-apoptotic effects on human osteoblastic cells. J Biol Chem 273 21137-689
21144. 690
Besson A, Dowdy SF & Roberts JM 2008 CDK inhibitors: cell cycle regulators and beyond. Dev Cell 691
14 159-169. 692
Braig M, Lee S, Loddenkemper C, Rudolph C, Peters AH, Schlegelberger B, Stein H, Dorken B, 693
Jenuwein T & Schmitt CA 2005 Oncogene-induced senescence as an initial barrier in lymphoma 694
development. Nature 436 660-665. 695
Bringold F & Serrano M 2000 Tumor suppressors and oncogenes in cellular senescence. Exp 696
Gerontol 35 317-329. 697
Cai WY, Alexander JM, Hedley-Whyte ET, Scheithauer BW, Jameson JL, Zervas NT & Klibanski A 698
1994 ras mutations in human prolactinomas and pituitary carcinomas. J Clin Endocrinol Metab 78 699
89-93. 700
Cakir M & Grossman AB 2009 Targeting MAPK (Ras/ERK) and PI3K/Akt pathways in pituitary 701
tumorigenesis. Expert Opin Ther Targets 13 1121-1134. 702
Campisi J 2001 Cellular senescence as a tumor-suppressor mechanism. Trends Cell Biol 11 S27-31. 703
Campisi J 2005 Suppressing cancer: the importance of being senescent. Science 309 886-887. 704
Campisi J & d'Adda di Fagagna F 2007 Cellular senescence: when bad things happen to good cells. 705
Nat Rev Mol Cell Biol 8 729-740. 706
Ciccarelli A, Daly AF & Beckers A 2005 The epidemiology of prolactinomas. Pituitary 8 3-6. 707
Collado M, Gil J, Efeyan A, Guerra C, Schuhmacher AJ, Barradas M, Benguria A, Zaballos A, Flores 708
JM, Barbacid M, et al. 2005 Tumour biology: senescence in premalignant tumours. Nature 436 709
642. 710
Collado M & Serrano M 2010 Senescence in tumours: evidence from mice and humans. Nat Rev 711
Cancer 10 51-57. 712
Page 30 of 50

31
Coppe JP, Patil CK, Rodier F, Sun Y, Munoz DP, Goldstein J, Nelson PS, Desprez PY & Campisi J 2008 713
Senescence-associated secretory phenotypes reveal cell-nonautonomous functions of oncogenic 714
RAS and the p53 tumor suppressor. PLoS Biol 6 2853-2868. 715
Courtois-Cox S, Genther Williams SM, Reczek EE, Johnson BW, McGillicuddy LT, Johannessen CM, 716
Hollstein PE, MacCollin M & Cichowski K 2006 A negative feedback signaling network underlies 717
oncogene-induced senescence. Cancer Cell 10 459-472. 718
Chen Z, Trotman LC, Shaffer D, Lin HK, Dotan ZA, Niki M, Koutcher JA, Scher HI, Ludwig T, Gerald 719
W, et al. 2005 Crucial role of p53-dependent cellular senescence in suppression of Pten-deficient 720
tumorigenesis. Nature 436 725-730. 721
Chesnokova V & Melmed S 2010 Pituitary senescence: The evolving role of Pttg. Mol Cell 722
Endocrinol. 723
Chesnokova V, Zhou C, Ben-Shlomo A, Zonis S, Tani Y, Ren SG & Melmed S 2013 Growth hormone 724
is a cellular senescence target in pituitary and nonpituitary cells. Proc Natl Acad Sci U S A 110 725
E3331-3339. 726
Chesnokova V, Zonis S, Kovacs K, Ben-Shlomo A, Wawrowsky K, Bannykh S & Melmed S 2008 727
p21(Cip1) restrains pituitary tumor growth. Proc Natl Acad Sci U S A 105 17498-17503. 728
Chesnokova V, Zonis S, Rubinek T, Yu R, Ben-Shlomo A, Kovacs K, Wawrowsky K & Melmed S 2007 729
Senescence mediates pituitary hypoplasia and restrains pituitary tumor growth. Cancer Res 67 730
10564-10572. 731
Chesnokova V, Zonis S, Zhou C, Ben-Shlomo A, Wawrowsky K, Toledano Y, Tong Y, Kovacs K, 732
Scheithauer B & Melmed S 2011 Lineage-specific restraint of pituitary gonadotroph cell adenoma 733
growth. PLoS One 6 e17924. 734
Chien Y, Scuoppo C, Wang X, Fang X, Balgley B, Bolden JE, Premsrirut P, Luo W, Chicas A, Lee CS, et 735
al. 2011 Control of the senescence-associated secretory phenotype by NF-kappaB promotes 736
senescence and enhances chemosensitivity. Genes Dev 25 2125-2136. 737
De Nicola AF, von Lawzewitsch I, Kaplan SE & Libertun C 1978 Biochemical and ultrastructural 738
studies on estrogen-induced pituitary tumors in F344 rats. J Natl Cancer Inst 61 753-763. 739
De Paul A, Pons P, Aoki A & Torres A 1997 Different behavior of lactotroph cell subpopulations in 740
response to angiotensin II and thyrotrophin-releasing hormone. Cell Mol Neurobiol 17 245-258. 741
De Paul AL, Attademo AM, Caron RW, Soaje M, Torres AI, Jahn GA & Celis ME 2009 Neuropeptide 742
glutamic-isoleucine (NEI) specifically stimulates the secretory activity of gonadotrophs in primary 743
cultures of female rat pituitary cells. Peptides 30 2081-2087. 744
Di Leonardo A, Linke SP, Clarkin K & Wahl GM 1994 DNA damage triggers a prolonged p53-745
dependent G1 arrest and long-term induction of Cip1 in normal human fibroblasts. Genes Dev 8 746
2540-2551. 747
Di Micco R, Fumagalli M, Cicalese A, Piccinin S, Gasparini P, Luise C, Schurra C, Garre M, Giovanni 748
Nuciforo P, Bensimon A, et al. 2006 Oncogene-induced senescence is a DNA damage response 749
triggered by DNA hyper-replication. Nature 444 638-642. 750
Dimri GP, Lee X, Basile G, Acosta M, Scott G, Roskelley C, Medrano EE, Linskens M, Rubelj I, 751
Pereira-Smith O, et al. 1995 A biomarker that identifies senescent human cells in culture and in 752
aging skin in vivo. Proc Natl Acad Sci U S A 92 9363-9367. 753
Dworakowska D, Wlodek E, Leontiou CA, Igreja S, Cakir M, Teng M, Prodromou N, Goth MI, 754
Grozinsky-Glasberg S, Gueorguiev M, et al. 2009 Activation of RAF/MEK/ERK and PI3K/AKT/mTOR 755
pathways in pituitary adenomas and their effects on downstream effectors. Endocr Relat Cancer 756
16 1329-1338. 757
Florenes VA, Lu C, Bhattacharya N, Rak J, Sheehan C, Slingerland JM & Kerbel RS 1999 Interleukin-6 758
dependent induction of the cyclin dependent kinase inhibitor p21WAF1/CIP1 is lost during 759
progression of human malignant melanoma. Oncogene 18 1023-1032. 760
Page 31 of 50

32
Freund A, Orjalo AV, Desprez PY & Campisi J 2010 Inflammatory networks during cellular 761
senescence: causes and consequences. Trends Mol Med 16 238-246. 762
Fuertes M, Gerez J, Haedo M, Giacomini D, Paez-Pereda M, Labeur M, Stalla GK & Arzt E 2010 763
Cytokines and genes in pituitary tumorigenesis: RSUME role in cell biology. Front Horm Res 38 1-6. 764
Gartel AL & Tyner AL 1999 Transcriptional regulation of the p21((WAF1/CIP1)) gene. Exp Cell Res 765
246 280-289. 766
Giles A, Madec F, Friedrichsen S, Featherstone K, Chambers T, Harper CV, Resch J, Brabant G & 767
Davis JR 2010 Wnt signaling in estrogen-induced lactotroph proliferation. J Cell Sci 124 540-547. 768
Gonzalez M, Reyes R, Damas C, Alonso R & Bello AR 2008 Oestrogen receptor alpha and beta in 769
female rat pituitary cells: an immunochemical study. Gen Comp Endocrinol 155 857-868. 770
Haedo MR, Gerez J, Fuertes M, Giacomini D, Paez-Pereda M, Labeur M, Renner U, Stalla GK & Arzt 771
E 2009 Regulation of pituitary function by cytokines. Horm Res 72 266-274. 772
Hanahan D & Weinberg RA 2000 The hallmarks of cancer. Cell 100 57-70. 773
Hayden MS & Ghosh S 2004 Signaling to NF-kappaB. Genes Dev 18 2195-2224. 774
Holst CR, Nuovo GJ, Esteller M, Chew K, Baylin SB, Herman JG & Tlsty TD 2003 Methylation of 775
p16(INK4a) promoters occurs in vivo in histologically normal human mammary epithelia. Cancer 776
Res 63 1596-1601. 777
Hubackova S, Krejcikova K, Bartek J & Hodny Z 2012 IL1- and TGFbeta-Nox4 signaling, oxidative 778
stress and DNA damage response are shared features of replicative, oncogene-induced, and drug-779
induced paracrine 'bystander senescence'. Aging (Albany NY) 4 932-951. 780
Itahana K, Dimri G & Campisi J 2001 Regulation of cellular senescence by p53. Eur J Biochem 268 781
2784-2791. 782
Karga HJ, Alexander JM, Hedley-Whyte ET, Klibanski A & Jameson JL 1992 Ras mutations in human 783
pituitary tumors. J Clin Endocrinol Metab 74 914-919. 784
Knudsen KE, Booth D, Naderi S, Sever-Chroneos Z, Fribourg AF, Hunton IC, Feramisco JR, Wang JY 785
& Knudsen ES 2000 RB-dependent S-phase response to DNA damage. Mol Cell Biol 20 7751-7763. 786
Kuilman T, Michaloglou C, Mooi WJ & Peeper DS 2010 The essence of senescence. Genes Dev 24 787
2463-2479. 788
Kuilman T, Michaloglou C, Vredeveld LC, Douma S, van Doorn R, Desmet CJ, Aarden LA, Mooi WJ & 789
Peeper DS 2008 Oncogene-induced senescence relayed by an interleukin-dependent inflammatory 790
network. Cell 133 1019-1031. 791
Lee BY, Han JA, Im JS, Morrone A, Johung K, Goodwin EC, Kleijer WJ, DiMaio D & Hwang ES 2006 792
Senescence-associated beta-galactosidase is lysosomal beta-galactosidase. Aging Cell 5 187-195. 793
Lee S, Jeong SY, Lim WC, Kim S, Park YY, Sun X, Youle RJ & Cho H 2007 Mitochondrial fission and 794
fusion mediators, hFis1 and OPA1, modulate cellular senescence. J Biol Chem 282 22977-22983. 795
Levy A 2002 Physiological implications of pituitary trophic activity. J Endocrinol 174 147-155. 796
Liu W, Konduri SD, Bansal S, Nayak BK, Rajasekaran SA, Karuppayil SM, Rajasekaran AK & Das GM 797
2006 Estrogen receptor-alpha binds p53 tumor suppressor protein directly and represses its 798
function. J Biol Chem 281 9837-9840. 799
Lowe SW, Cepero E & Evan G 2004 Intrinsic tumour suppression. Nature 432 307-315. 800
Luo Y, Hurwitz J & Massague J 1995 Cell-cycle inhibition by independent CDK and PCNA binding 801
domains in p21Cip1. Nature 375 159-161. 802
Maiza JC & Caron P 2009 [Pituitary carcinomas and aggressive adenomas: an overview and new 803
therapeutic options]. Ann Endocrinol (Paris) 70 Suppl 1 S12-19. 804
Marcotte R, Lacelle C & Wang E 2004 Senescent fibroblasts resist apoptosis by downregulating 805
caspase-3. Mech Ageing Dev 125 777-783. 806
McKay MM & Morrison DK 2007 Integrating signals from RTKs to ERK/MAPK. Oncogene 26 3113-807
3121. 808
Page 32 of 50

33
McNicol AM & Carbajo-Perez E 1999 Aspects of anterior pituitary growth, with special reference to 809
corticotrophs. Pituitary 1 257-268. 810
Melmed S 2003 Mechanisms for pituitary tumorigenesis: the plastic pituitary. J Clin Invest 112 811
1603-1618. 812
Michaloglou C, Vredeveld LC, Soengas MS, Denoyelle C, Kuilman T, van der Horst CM, Majoor DM, 813
Shay JW, Mooi WJ & Peeper DS 2005 BRAFE600-associated senescence-like cell cycle arrest of 814
human naevi. Nature 436 720-724. 815
Mitchner NA, Garlick C & Ben-Jonathan N 1998 Cellular distribution and gene regulation of 816
estrogen receptors alpha and beta in the rat pituitary gland. Endocrinology 139 3976-3983. 817
Moiseeva O, Bourdeau V, Roux A, Deschenes-Simard X & Ferbeyre G 2009 Mitochondrial 818
dysfunction contributes to oncogene-induced senescence. Mol Cell Biol 29 4495-4507. 819
Molinari AM, Bontempo P, Schiavone EM, Tortora V, Verdicchio MA, Napolitano M, Nola E, 820
Moncharmont B, Medici N, Nigro V, et al. 2000 Estradiol induces functional inactivation of p53 by 821
intracellular redistribution. Cancer Res 60 2594-2597. 822
Mooi WJ 2009 Oncogene-induced cellular senescence: causal factor in the growth arrest of 823
pituitary microadenomas? Horm Res 71 Suppl 2 78-81. 824
Mooi WJ & Peeper DS 2006 Oncogene-induced cell senescence--halting on the road to cancer. N 825
Engl J Med 355 1037-1046. 826
Mukdsi JH, De Paul AL, Munoz S, Aoki A & Torres AI 2004 Immunolocalization of Pit-1 in 827
gonadotroph nuclei is indicative of the transdifferentiation of gonadotroph to lactotroph cells in 828
prolactinomas induced by estrogen. Histochem Cell Biol 121 453-462. 829
Mukdsi JH, De Paul AL, Petiti JP, Gutierrez S, Aoki A & Torres AI 2006 Pattern of FGF-2 isoform 830
expression correlated with its biological action in experimental prolactinomas. Acta Neuropathol 831
112 491-501. 832
Nishihara E, Nagayama Y, Inoue S, Hiroi H, Muramatsu M, Yamashita S & Koji T 2000 Ontogenetic 833
changes in the expression of estrogen receptor alpha and beta in rat pituitary gland detected by 834
immunohistochemistry. Endocrinology 141 615-620. 835
Noda A, Ning Y, Venable SF, Pereira-Smith OM & Smith JR 1994 Cloning of senescent cell-derived 836
inhibitors of DNA synthesis using an expression screen. Exp Cell Res 211 90-98. 837
Nolan LA & Levy A 2009 The trophic effects of oestrogen on male rat anterior pituitary lactotrophs. 838
J Neuroendocrinol. 839
Ogryzko VV, Wong P & Howard BH 1997 WAF1 retards S-phase progression primarily by inhibition 840
of cyclin-dependent kinases. Mol Cell Biol 17 4877-4882. 841
Palmeri CM, Petiti JP, Sosa Ldel V, Gutierrez S, De Paul AL, Mukdsi JH & Torres AI 2009 842
Bromocriptine induces parapoptosis as the main type of cell death responsible for experimental 843
pituitary tumor shrinkage. Toxicol Appl Pharmacol 240 55-65. 844
Pedeux R, Al-Irani N, Marteau C, Pellicier F, Branche R, Ozturk M, Franchi J & Dore JF 1998 845
Thymidine dinucleotides induce S phase cell cycle arrest in addition to increased melanogenesis in 846
human melanocytes. J Invest Dermatol 111 472-477. 847
Petiti JP, Gutierrez S, De Paul AL, Andreoli V, Palmeri CM, Sosa Ldel V, Bocco JL & Torres AI 2010 848
GH3B6 pituitary tumor cell proliferation is mediated by PKCalpha and PKCepsilon via ERK 1/2-849
dependent pathway. Cell Physiol Biochem 26 135-146. 850
Petiti JP, Sosa Ldel V, Sabatino ME, Vaca AM, Gutierrez S, De Paul AL & Torres AI 2015 Involvement 851
of MEK/ERK1/2 and PI3K/Akt pathways in the refractory behavior of GH3B6 pituitary tumor cells 852
to the inhibitory effect of TGFbeta1. Endocrinology 156 534-547. 853
Pikarsky E & Ben-Neriah Y 2006 NF-kappaB inhibition: a double-edged sword in cancer? Eur J 854
Cancer 42 779-784. 855
Page 33 of 50

34
Pluquet O & Hainaut P 2001 Genotoxic and non-genotoxic pathways of p53 induction. Cancer Lett 856
174 1-15. 857
Prieur A & Peeper DS 2008 Cellular senescence in vivo: a barrier to tumorigenesis. Curr Opin Cell 858
Biol 20 150-155. 859
Roberts PJ & Der CJ 2007 Targeting the Raf-MEK-ERK mitogen-activated protein kinase cascade for 860
the treatment of cancer. Oncogene 26 3291-3310. 861
Rodier F, Campisi J & Bhaumik D 2007 Two faces of p53: aging and tumor suppression. Nucleic 862
Acids Res 35 7475-7484. 863
Roninson IB 2002 Oncogenic functions of tumour suppressor p21(Waf1/Cip1/Sdi1): association 864
with cell senescence and tumour-promoting activities of stromal fibroblasts. Cancer Lett 179 1-14. 865
Sabatino ME, Sosa Ldel V, Petiti JP, Mukdsi JH, Mascanfroni ID, Pellizas CG, Gutierrez S, Torres AI & 866
De Paul AL 2013 Functional Toll-like receptor 4 expressed in lactotrophs mediates LPS-induced 867
proliferation in experimental pituitary hyperplasia. Exp Cell Res 319 3020-3034. 868
Sadoul JL, Thyss A & Freychet P 1992 Invasive mixed growth hormone/prolactin secreting pituitary 869
tumour: complete shrinking by octreotide and bromocriptine, and lack of tumour growth relapse 870
20 months after octreotide withdrawal. Acta Endocrinol (Copenh) 126 179-183. 871
Salminen A, Kauppinen A & Kaarniranta K 2012 Emerging role of NF-kappaB signaling in the 872
induction of senescence-associated secretory phenotype (SASP). Cell Signal 24 835-845. 873
Sarkar DK 2006 Genesis of prolactinomas: studies using estrogen-treated animals. Front Horm Res 874
35 32-49. 875
Serrano M & Blasco MA 2001 Putting the stress on senescence. Curr Opin Cell Biol 13 748-753. 876
Serrano M, Lin AW, McCurrach ME, Beach D & Lowe SW 1997 Oncogenic ras provokes premature 877
cell senescence associated with accumulation of p53 and p16INK4a. Cell 88 593-602. 878
Spady TJ, McComb RD & Shull JD 1999 Estrogen action in the regulation of cell proliferation, cell 879
survival, and tumorigenesis in the rat anterior pituitary gland. Endocrine 11 217-233. 880
Sugawara A, Yen PM, Darling DS & Chin WW 1993 Characterization and tissue expression of 881
multiple triiodothyronine receptor-auxiliary proteins and their relationship to the retinoid X-882
receptors. Endocrinology 133 965-971. 883
Wajapeyee N, Serra RW, Zhu X, Mahalingam M & Green MR 2008 Oncogenic BRAF induces 884
senescence and apoptosis through pathways mediated by the secreted protein IGFBP7. Cell 132 885
363-374. 886
Weigel NL 1996 Steroid hormone receptors and their regulation by phosphorylation. Biochem J 887
319 ( Pt 3) 657-667. 888
Wiklund J, Wertz N & Gorski J 1981 A comparison of estrogen effects on uterine and pituitary 889
growth and prolactin synthesis in F344 and Holtzman rats. Endocrinology 109 1700-1707. 890
Yang G, Rosen DG, Zhang Z, Bast RC, Jr., Mills GB, Colacino JA, Mercado-Uribe I & Liu J 2006 The 891
chemokine growth-regulated oncogene 1 (Gro-1) links RAS signaling to the senescence of stromal 892
fibroblasts and ovarian tumorigenesis. Proc Natl Acad Sci U S A 103 16472-16477. 893
Young AR & Narita M 2009 SASP reflects senescence. EMBO Rep 10 228-230. 894
Zeng YX & el-Deiry WS 1996 Regulation of p21WAF1/CIP1 expression by p53-independent 895
pathways. Oncogene 12 1557-1564. 896
897
898
Page 34 of 50

LEGENDS OF FIGURES
Figure 1. Rat pituitary expansion after estrogen administration.
A) Pituitary weight (mg) from control (basal) and estrogen-treated rats (n=12/group). Results are
expressed as means ± SEM; Fisher test (p<0.05 * vs. Basal; means with different letters are
statistically different). B) Photographs of representative in sellae pituitary glands derived from male
rats submitted to different periods of tumor development. The pituitary gland sizes are depicted by a
square. C) Paraffin-embedded adenohypophysis sections from control and estrogen-induced tumoral
pituitaries (E40). The parenchyma is surrounded by a network of vascular channels (*), with a marked
development in models of sustained stimulation with estradiol benzoate, mainly starting from 40 days
of hormone treatment. Staining: H/E. Bar: 10um. D) Micrographs of semithin sections (200nm) of
Araldite-embedded pituitary gland from control and E60 stained with Toluidine blue. The sustained
estrogen exposition provoked a streaking hypertrophy of endocrine cells and hormonal release, as
revealed by the lower Toluidine blue staining in the cytoplasms in E60 compared to control cells
(arrow). Bar: 10um.
Figure 2. Ki67 immunolabeling in the estrogen-induced pituitary tumors.
A) Immunocytochemical detection of Ki67 in sections of pituitaries from control and estrogenized
rats. A remarkable increase in Ki67 reactivity (brown signal) was seen at the beginning of the
proliferative injures. Representative fields of anterior pituitary sections from a representative
experiment from a total of three independent experiments with similar results are shown. (Bar=20um).
B) The Ki67 positive nuclei staining is expressed as a percentage of the total nuclei counted. Data are
expressed as means ± SEM using the Fisher test (p<0.05 * vs. Basal; means with different letters are
statistically different). C) RAS/pERK protein expression during the development of experimental
pituitary tumors. Analysis of RAS and phospho-ERK 1/2 (total fraction) from control and tumoral
pituitary cells by western blotting revealed a RAS/p-ERK gradual suppression during pituitary tumor
development. The b-actin and total ERK1/2 protein expression confirmed equal loading occurring in
Page 35 of 50

all lanes. Data are from a representative experiment from a total of three independent experiments
with similar results.
Figure 3. TUNEL assay on normal and experimental pituitary tumors.
No significant detection of biochemical features of apoptosis (brown signal) was detected in
histological samples from each experimental condition. Positive control: pituitary gland section
treated with DNAase I. Data from a representative experiment for a total of three independent
experiments with similar results from each experimental group (Bar=100um).
Figure 4. Senescence features are expressed during pituitary tumor development.
A) Cryosections from normal and tumoral pituitaries showing increases in SA-b-gal reactivity during
pituitary tumor development, and GH3B6 cells presenting a low detection of SA-b-gal. The SA-b-gal
enzymatic activity is dyed in blue. Positive control: rat kidney; Negative control: rat kidney omitting
the substrate. Results of a representative experiment are shown (Bar=100um). B) SA-b-gal reaction in
E2-stimulated GH3B6 cells. Cells were cultured with a sustained E2 exposition (120h; 4nM). C) The
number of SA-b-gal-positive cells stained in blue was evaluated and related to the total number of
pituitary cells counted for each experimental group. Also, SA-b-gal index from control and estrogen-
induced GH3B6 pituitary tumoral cell line was determined. Data were statistically analyzed by the
Fisher test, and the results are expressed as means ± SEM (*p<0.05 vs. Control).
Figure 5. SA-b-gal and Ki67 staining in cryosections from normal and tumoral pituitaries.
For all examined conditions, proliferating cells (white rectangle) did not show any SA-b-gal
expression. Results of a representative experiment are shown (Bar=20um).
Figure 6. Senescence features are expressed during pituitary tumor development.
Western blotting expression of IL6; IL1b; TGFb1 (A); NFkB (cytoplasmic and nuclear fractions) (B)
and DRP1; MFN1 (total extracts) (C) and from control and tumoral pituitary glands revealed signs
associated with inflammatory network activation and mitochondrial fusion. The b-actin, COX 4 and
Page 36 of 50

HDAC1 protein expressions were used as loading controls. Data are from a representative experiment
from a total of three independent experiments with similar results.
Figure 7. DNA damage in estrogen-induced pituitary tumors.
A) DNA damage signaling labeled by intranuclear accumulation for pATM immunoreactivity (brown
signal) in normal and tumoral pituitaries. Representative sections from normal and estrogen-treated
anterior pituitary glands are shown (Bar=20um). B) The pATM positive nuclei as a proportion of the
total nuclei in pituitary sections are shown and results are expressed as means ± SEM; Fisher test
(p<0.05 * vs. Basal; means with different letters are statistically different). C) Electron micrograph of
pituitary cells from E40 expressing pATM label by using secondary antibody conjugated with 15 nm
gold particles. Black arrows indicate p-ATM signaling accumulated in the cell compartments. N:
nucleus, g: hormone granules, m: mitochondrion (Bar=2um).
Figure 8. p53 expression during pituitary tumor development.
A) p53 immunoreactivity (brown signal) in normal and tumoral pituitary sections. An increase in p53
detection is observed at E10 and E20. Representative fields of anterior pituitary sections are also
shown (Bar=20um). B) The p53 expression showed a cytoplasmic redistribution during the tumor
development as revealed by Western Blotting in fractionated pituitary extracts. b-actin and HDAC1
expression were used as loading controls. Representative images of three independent experiments are
presented.
Figure 9. The expression of CDK inhibitor p21 was increased in tumoral pituitary glands.
A) The analysis of the p21 protein expression levels by Western Blotting revealed an increase in its
expression in both nuclear and cytosolic extracts during tumor development. B) The ultrastructural
localization of p21 was examined in Control (basal) and E40 pituitary glands by electron microscopy
immunogold labeling. Black arrows indicate p21 signaling mainly expressed at the nuclear cell
compartment. N: nucleus, n: nucleolus; RER: rough endoplasmic reticulum (Bar=2um). C) Total
extract of established GH3B6 tumoral cells did not express p21. The b-actin and HDAC1 expression
Page 37 of 50

were used as loading controls. Representative images of three independent experiments are shown. D)
S-phase / G2/M ratio analysis during experimental pituitary tumor development. The DNA content
was determined by flow cytometry in order to evaluate modifications in the pituitary cell cycle profile
of normal and tumoral pituitary cells. A notable increase in the S-phase / G2/M ratio is observed for
E40, when compared to control ratio. The means ± SEM of the percentages of cells at different cell
cycle stages are presented Fisher test (p<0.05 * vs. Basal).
Figure 10. KI67, pATM, p21, p53 and SA-b-gal expression in lactotroph cells.
Confocal laser scanning microscopy of pituitary paraffin-embedded sections from control, E10 and
E40 glands co-stained for PRL (green) with KI67, pATM, p21 or p53 (red). Single-stained
lactotrophs, single-stained non PRL cells (arrowheads) and double-stained lactotrophs (arrows) are
seen. Also, immunolabeling for PRL (brown) and histoenzimology for SA-b-gal (blue) were
performed on the same cryosection. Data are from a representative experiment from a total of three
independent experiments with similar results. (Bar=20um).
Page 38 of 50
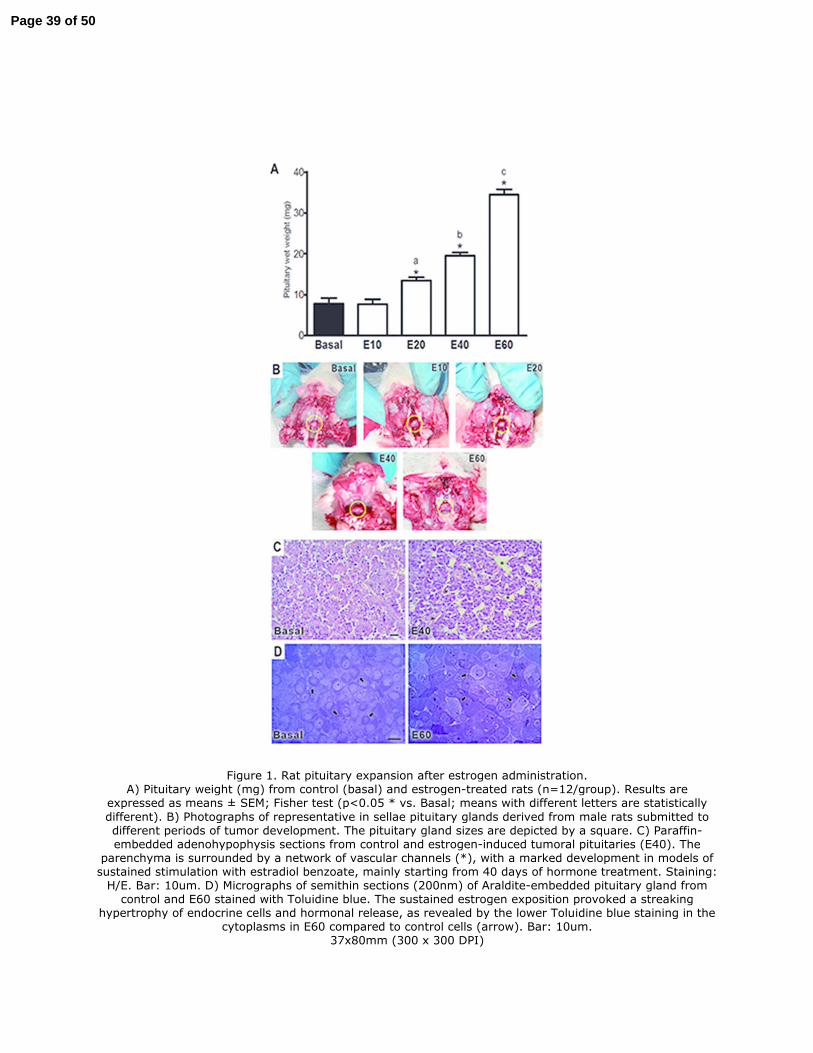
Figure 1. Rat pituitary expansion after estrogen administration. A) Pituitary weight (mg) from control (basal) and estrogen-treated rats (n=12/group). Results are
expressed as means ± SEM; Fisher test (p<0.05 * vs. Basal; means with different letters are statistically
different). B) Photographs of representative in sellae pituitary glands derived from male rats submitted to different periods of tumor development. The pituitary gland sizes are depicted by a square. C) Paraffin-embedded adenohypophysis sections from control and estrogen-induced tumoral pituitaries (E40). The
parenchyma is surrounded by a network of vascular channels (*), with a marked development in models of sustained stimulation with estradiol benzoate, mainly starting from 40 days of hormone treatment. Staining: H/E. Bar: 10um. D) Micrographs of semithin sections (200nm) of Araldite-embedded pituitary gland from control and E60 stained with Toluidine blue. The sustained estrogen exposition provoked a streaking
hypertrophy of endocrine cells and hormonal release, as revealed by the lower Toluidine blue staining in the cytoplasms in E60 compared to control cells (arrow). Bar: 10um.
37x80mm (300 x 300 DPI)
Page 39 of 50

Page 40 of 50

Figure 2. Ki67 immunolabeling in the estrogen-induced pituitary tumors. A) Immunocytochemical detection of Ki67 in sections of pituitaries from control and estrogenized rats. A
remarkable increase in Ki67 reactivity (brown signal) was seen at the beginning of the proliferative injures.
Representative fields of anterior pituitary sections from a representative experiment from a total of three independent experiments with similar results are shown. (Bar=20um). B) The Ki67 positive nuclei staining is expressed as a percentage of the total nuclei counted. Data are expressed as means ± SEM using the Fisher
test (p<0.05 * vs. Basal; means with different letters are statistically different). C) RAS/pERK protein expression during the development of experimental pituitary tumors. Analysis of RAS and phospho-ERK 1/2 (total fraction) from control and tumoral pituitary cells by western blotting revealed a RAS/p-ERK gradual
suppression during pituitary tumor development. The b-actin and total ERK1/2 protein expression confirmed equal loading occurring in all lanes. Data are from a representative experiment from a total of three
independent experiments with similar results. 46x70mm (300 x 300 DPI)
Page 41 of 50

Page 42 of 50

Figure 3. TUNEL assay on normal and experimental pituitary tumors. No significant detection of biochemical features of apoptosis (brown signal) was detected in histological
samples from each experimental condition. Positive control: pituitary gland section treated with DNAase I. Data from a representative experiment for a total of three independent experiments with similar results
from each experimental group (Bar=100um). 78x39mm (300 x 300 DPI)
Page 43 of 50
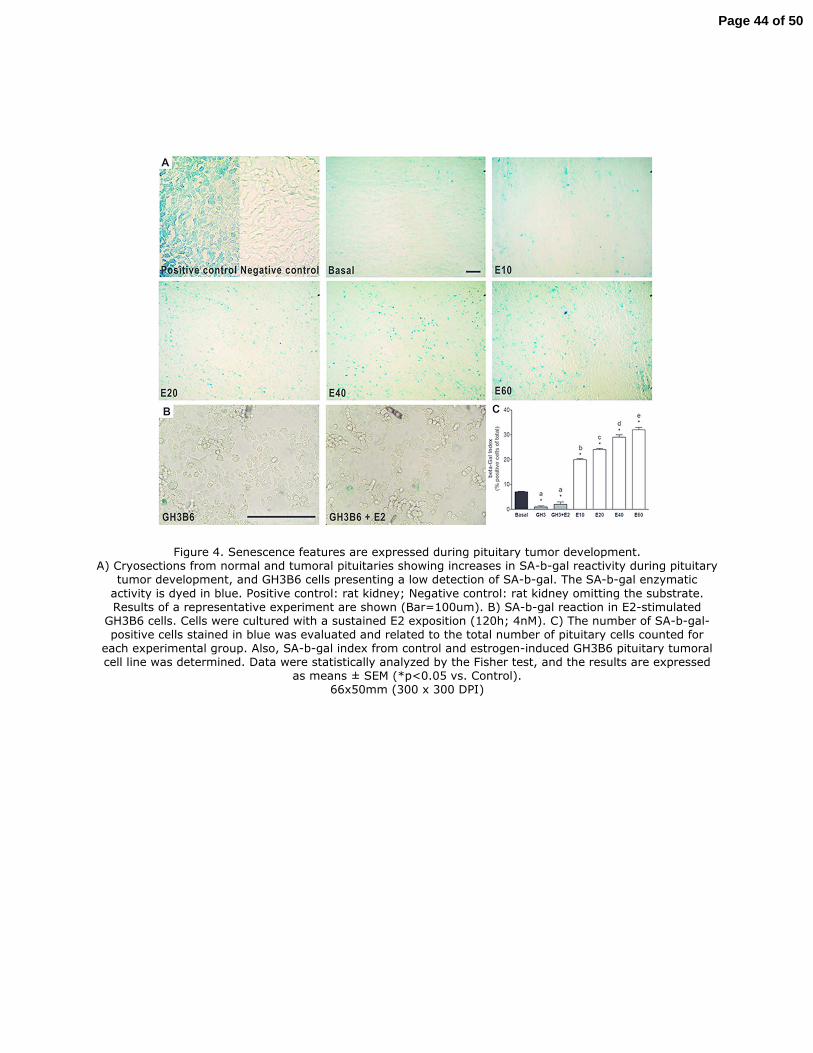
Figure 4. Senescence features are expressed during pituitary tumor development. A) Cryosections from normal and tumoral pituitaries showing increases in SA-b-gal reactivity during pituitary
tumor development, and GH3B6 cells presenting a low detection of SA-b-gal. The SA-b-gal enzymatic
activity is dyed in blue. Positive control: rat kidney; Negative control: rat kidney omitting the substrate. Results of a representative experiment are shown (Bar=100um). B) SA-b-gal reaction in E2-stimulated
GH3B6 cells. Cells were cultured with a sustained E2 exposition (120h; 4nM). C) The number of SA-b-gal-positive cells stained in blue was evaluated and related to the total number of pituitary cells counted for
each experimental group. Also, SA-b-gal index from control and estrogen-induced GH3B6 pituitary tumoral cell line was determined. Data were statistically analyzed by the Fisher test, and the results are expressed
as means ± SEM (*p<0.05 vs. Control). 66x50mm (300 x 300 DPI)
Page 44 of 50
Figure 5. SA-b-gal and Ki67 staining in cryosections from normal and tumoral pituitaries. For all examined conditions, proliferating cells (white rectangle) did not show any SA-b-gal expression.
Results of a representative experiment are shown (Bar=20um).
96x60mm (300 x 300 DPI)
Page 45 of 50

Figure 6. Senescence features are expressed during pituitary tumor development. Western blotting expression of IL6; IL1b; TGFb1 (A); NFkB (cytoplasmic and nuclear fractions) (B) and DRP1; MFN1 (total extracts) (C) and from control and tumoral pituitary glands revealed signs associated with inflammatory network activation and mitochondrial fusion. The b-actin, COX 4 and HDAC1 protein
expressions were used as loading controls. Data are from a representative experiment from a total of three independent experiments with similar results.
39x21mm (300 x 300 DPI)
Page 46 of 50

Figure 7. DNA damage in estrogen-induced pituitary tumors. A) DNA damage signaling labeled by intranuclear accumulation for pATM immunoreactivity (brown signal) in normal and tumoral pituitaries. Representative sections from normal and estrogen-treated anterior pituitary
glands are shown (Bar=20um). B) The pATM positive nuclei as a proportion of the total nuclei in pituitary sections are shown and results are expressed as means ± SEM; Fisher test (p<0.05 * vs. Basal; means with different letters are statistically different). C) Electron micrograph of pituitary cells from E40 expressing
pATM label by using secondary antibody conjugated with 15 nm gold particles. Black arrows indicate p-ATM signaling accumulated in the cell compartments. N: nucleus, g: hormone granules, m: mitochondrion
(Bar=2um). 57x50mm (300 x 300 DPI)
Page 47 of 50

Figure 8. p53 expression during pituitary tumor development. A) p53 immunoreactivity (brown signal) in normal and tumoral pituitary sections. An increase in p53
detection is observed at E10 and E20. Representative fields of anterior pituitary sections are also shown (Bar=20um). B) The p53 expression showed a cytoplasmic redistribution during the tumor development as revealed by Western Blotting in fractionated pituitary extracts. b-actin and HDAC1 expression were used as
loading controls. Representative images of three independent experiments are presented. 78x39mm (300 x 300 DPI)
Page 48 of 50

Figure 9. The expression of CDK inhibitor p21 was increased in tumoral pituitary glands. A) The analysis of the p21 protein expression levels by Western Blotting revealed an increase in its expression in both nuclear and cytosolic extracts during tumor development. B) The ultrastructural localization of p21 was examined in Control (basal) and E40 pituitary glands by electron microscopy
immunogold labeling. Black arrows indicate p21 signaling mainly expressed at the nuclear cell compartment. N: nucleus, n: nucleolus; RER: rough endoplasmic reticulum (Bar=2um). C) Total extract of established
GH3B6 tumoral cells did not express p21. The b-actin and HDAC1 expression were used as loading controls. Representative images of three independent experiments are shown. D) S-phase / G2/M ratio analysis
during experimental pituitary tumor development. The DNA content was determined by flow cytometry in order to evaluate modifications in the pituitary cell cycle profile of normal and tumoral pituitary cells. A notable increase in the S-phase / G2/M ratio is observed for E40, when compared to control ratio. The
means ± SEM of the percentages of cells at different cell cycle stages are presented Fisher test (p<0.05 * vs. Basal).
39x17mm (300 x 300 DPI)
Page 49 of 50

Figure 10. KI67, pATM, p21, p53 and SA-b-gal expression in lactotroph cells. Confocal laser scanning microscopy of pituitary paraffin-embedded sections from control, E10 and E40 glands co-stained for PRL (green) with KI67, pATM, p21 or p53 (red). Single-stained lactotrophs, single-
stained non PRL cells (arrowheads) and double-stained lactotrophs (arrows) are seen. Also, immunolabeling for PRL (brown) and histoenzimology for SA-b-gal (blue) were performed on the same cryosection. Data are
from a representative experiment from a total of three independent experiments with similar results. (Bar=20um).
84x119mm (300 x 300 DPI)
Page 50 of 50