evidenced-based assessment of cycle traffic in glasgow · 2015. 6. 2. · strava metro data...
TRANSCRIPT

Evidenced-Based
Assessment of Cycle
Traffic in Glasgow
Presentation by Bob Downie
on behalf of GoBike!

Evidence-Based Assessment of
Cycle Traffic in Glasgow
• What datasets are available?
– Glasgow Cycling (GCC Cycling App, data not available to GoBike!)
• (100 – 500 installs on Android, iPhone installs unknown)
– Roadside surveys data.glasgow.gov.uk/
• City Centre Cordon (2009-2013)
– Strava Metro Data
• Available to GCC
• Available to GoBike!
• What do they tell us about preferred cycle routes?
• How can we use these data to inform future cycle facility placement?

Road Side Cycle Survey:
City Centre Cordon 2009-2013
• Conducted annually on 2 consecutive days over a 14 hour period
• Results show comparative number of riders. For example, in 2013 site 26 had roughly 20x the cycle traffic of site 9
Site 9
Site 26
Strava Metro- An Introduction
• Strava Metro is a global database of routes travelled by cyclists compiled by Strava.com
http://www.strava.com/
– To quote Strava themselves “Strava Metro is a data service providing “ground truth” on where people
ride and run.”
• It is compiled from a smartphone app that cyclists carry. By linking to GPS and other data
location services riders can track their rides, share their routes and gain other insights into
their cycling history
• Strava anonymise and aggregate these data to provide mapping and statistical data on cycle
usage which is the product they term Strava Metro
• Strava have made the 2014 data available to GoBike! and it is understood that GCC are in
receipt of both the 2013 and 2014 data

Who Uses Strava in Greater Glasgow Area?
2014 numbers
Male Count 9508 Female Count 1334
Male Count Under 25 558 Female Count Under 25 84
Male Count 25 - 34 1963 Female Count 25 - 34 349
Male Count 35 - 44 2677 Female Count 35 - 44 324
Male Count 45 - 54 1954 Female Count 45 - 54 174
Male Count 55 - 64 386 Female Count 55 - 64 32
Male Count 65 - 74 58 Female Count 65 - 74 1
Male Count 75 - 84 6 Female Count 75 - 84 0
Male Count 85 - 94 1 Female Count 85 - 94 0
Male Count No Bday 1902 Female Count No Bday 370
11,466 unique users in Greater Glasgow Men and women mostly in the age range 25-54 Male : Female ratio 7:1

Strava Metro Data Provision and Display
• Strava Metro data are provided to
users as a GIS file and linked
database
• The database assigns statistics on
cycle usage to sections of road and
includes both overall summaries and
breakdowns of usage by time of day
• Using the GIS file and the database it
is possible to make heat-maps where
the width of the coloured line varies in
proportion to the value investigated
(wider lines = higher usage)

Total Number of Strava Cycle Journeys in 2014

Morning Commute 06:00am-10:00am
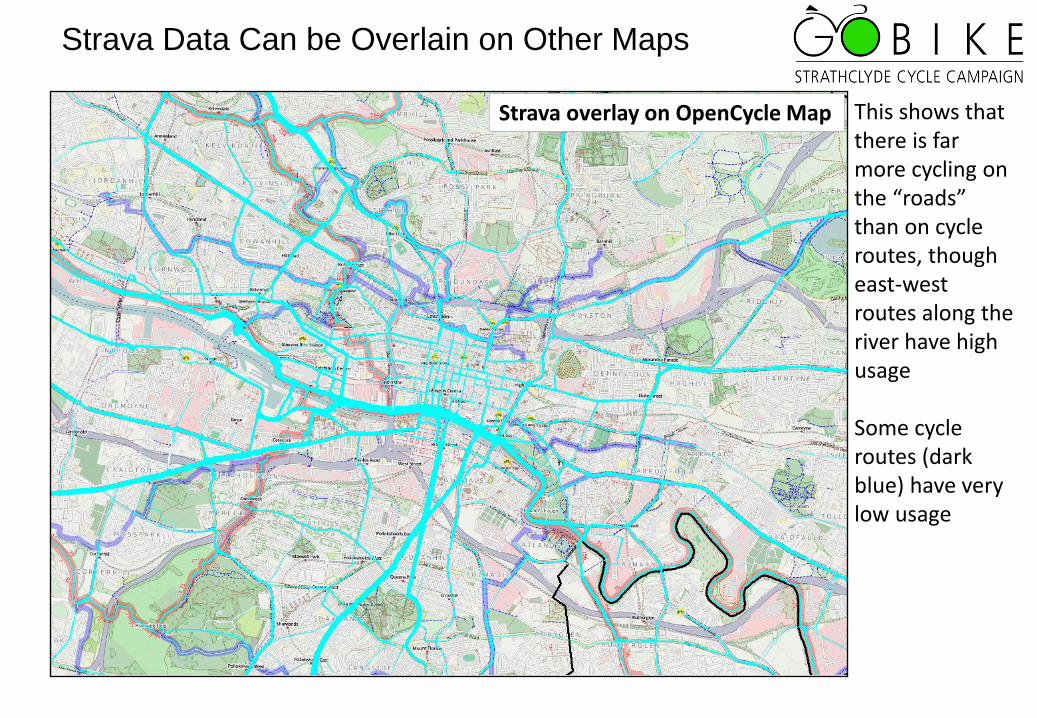
Strava Data Can be Overlain on Other Maps
This shows that there is far more cycling on the “roads” than on cycle routes, though east-west routes along the river have high usage Some cycle routes (dark blue) have very low usage
Strava overlay on OpenCycle Map

Do Strava Data Truly Indicate Relative Road Usage?- YES!
y = 12.525x R² = 0.8312
0
2000
4000
6000
8000
10000
12000
14000
0 200 400 600 800 1000
Stra
va T
AC
TCN
T 2
01
4
Surveyed number of cycle journeys in and out of city 2013
Strava TACTCNT= Total number of bike trips recorded in 2014 by Strava on the section of street regardless of direction of travel
Strong positive correlation shown by cross-plot of the 2013 Cordon Survey with Strava TACTCNT
Site 1
Site 1
Site 26
Site 26
Site 27
Site 27
Site 30
Site 30

Which Glasgow Roads Have the Highest Cycle Usage? (TACTCNT = Total number of bike trips recorded in 2014 by Strava on the section of street
regardless of direction of travel)
Broomielaw
Paisley Road West
Pollokshaws Road
Maryhill Road
London Road
TACTCNT >10,000 TACTCNT >8,000
TACTCNT >6,000 TACTCNT >4,000
Cumbernauld Road
Kirkintilloch Road
Shieldhall Road
Clarkston Road
Byres Road Queen
Margret Drive

At TACTCNT >3,000 the Preferred Radial Nature
of Cycle Travel Within Glasgow is Clear
These radial routes are the “desire lines”

Conclusions
• Strava Metro data, validated against the GCC Cordon Surveys, provide a numeric ranking of
the relative usage of roads and cycle routes by Glasgow cyclists
• Observations are manifold but include
– A few cycle facilities are well-used, but many are little used or under-used. Why?
– There is significant travel between Glasgow and the suburbs outside the city boundary
– The busiest routes for cycling in the city are by-and-large the main radial roads, with Pollokshaws
Road, Maryhill Road and Paisley Road West having the highest cycle usage. These radial routes are
the “desire lines” that people preferentially wish to use
• How can we use these data to inform future cycle facility placement?
– GoBike! Would like to see cycle facility placement in Glasgow guided by evidence from sources such
as Strava, roadside surveys and the Glasgow Cycling app
– GoBike! take the view that the radial “desire lines” should be prioritised for installation/improvement of
cycle facilities. Improvements on the busiest routes, Pollokshaws Road, Maryhill Road and Paisley
Road West, would encourage the greatest number of additional cyclists onto the roads
– Cyclist’s travel preferences should be taken into account before new cycle facilities are planned
(Strava shows that cyclists prefer to travel in direct routes to their destinations)