evolution of resilience in protein interactomes across the ...jure/pubs/treeoflife-pnas19.pdf · we...
TRANSCRIPT

EVO
LUTI
ON
Evolution of resilience in protein interactomes acrossthe tree of lifeMarinka Zitnika, Rok Sosica, Marcus W. Feldmanb,1, and Jure Leskoveca,c,1
aDepartment of Computer Science, Stanford University, Stanford, CA 94305; bDepartment of Biology, Stanford University, Stanford, CA 94305; and cChanZuckerberg Biohub, San Francisco, CA 94158
Contributed by Marcus W. Feldman, December 18, 2018 (sent for review October 19, 2018; reviewed by Edoardo Airoldi and Aviv Bergman)
Phenotype robustness to environmental fluctuations is a commonbiological phenomenon. Although most phenotypes involve mul-tiple proteins that interact with each other, the basic principles ofhow such interactome networks respond to environmental unpre-dictability and change during evolution are largely unknown.Here we study interactomes of 1,840 species across the tree oflife involving a total of 8,762,166 protein–protein interactions.Our study focuses on the resilience of interactomes to networkfailures and finds that interactomes become more resilient duringevolution, meaning that interactomes become more robust to net-work failures over time. In bacteria, we find that a more resilientinteractome is in turn associated with the greater ability of theorganism to survive in a more complex, variable, and competi-tive environment. We find that at the protein family level proteinsexhibit a coordinated rewiring of interactions over time and thata resilient interactome arises through gradual change of the net-work topology. Our findings have implications for understandingmolecular network structure in the context of both evolution andenvironment.
protein–protein interaction networks | molecular evolution | ecology |network resilience | network rewiring
The enormous diversity of life shows a fundamental ability oforganisms to adapt their phenotypes to changing environ-
ments (1). Most phenotypes are the result of an interplay of manymolecular components that interact with each other and the envi-ronment (2–5). The study of life’s diversity has a long history andextensive phylogenetic studies have demonstrated evolution atthe DNA sequence level (6–8). While studies based on sequencedata alone have demonstrated evolution of genomes, mecha-nistic insights into how evolution shapes interactions betweenproteins in an organism remain elusive (9, 10).
DNA sequence information has been used to associate geneswith their functions (11), determine properties of ancestral life(12, 13), and understand how the environment affects genomes(14). Despite these advances in understanding DNA sequenceevolution, little is known about basic principles that governthe evolution of interactions between proteins. In particular,evolution of DNA and amino acid sequences could lead to per-vasive rewiring of protein–protein interactions and create ordestroy the ability of the interactions to perform their biologicalfunctions.
The importance of protein–protein interactions has spurredexperimental efforts to map all interactions between proteinsin a particular organism, its interactome, namely the com-plex network of protein–protein interactions in that organ-ism. A large number of high-throughput experiments havereported high-quality interactomes in a number of organisms(15–19). Because interactomes underlie all living organisms,it is critical to understand how these networks change dur-ing evolution (20, 21) and elucidate key principles of theirstructure.
Here, we use protein interactions measured by these large-scale interactome mapping experiments and study the evolu-tionary dynamics of the interactomes across the tree of life.Our protein interaction dataset contains a total of 8,762,166
physical interactions between 1,450,633 proteins from 1,840species, encompassing all current protein interaction infor-mation at a cross-species scale (SI Appendix, section S1 andTable S4). We group these interactions by species and repre-sent each species with a separate interactome network, in whichnodes indicate a species’ proteins and edges indicate exper-imentally documented physical interactions, including directbiophysical protein–protein interactions, regulatory protein–DNA interactions, metabolic pathway interactions, and kinase–substrate interactions measured in that species. We integrateinto the dataset (22) the evolutionary history of species pro-vided by the tree of life constructed from small subunit ribosomalRNA gene sequence information (12) (SI Appendix, sectionS2). Using network science, we study the network organiza-tion of each interactome, in particular its resilience to net-work failures, a critical factor determining the function of theinteractome (23–26). We identify the relationship between theresilience of an interactome and evolution and use this resilienceto uncover relationships with natural environments in whichorganisms live. Although the interactomes are incomplete andbiased toward much-studied proteins and model species (SIAppendix, section S1 and Fig. S7), our analyses give resultsthat are consistent across taxonomic groups, that are not sen-sitive to network data quality or network size change (SIAppendix, section S8 and Fig. S8), and indicate that our conclu-sions will still hold when more protein interaction data becomeavailable.
Significance
The interactome network of protein–protein interactions cap-tures the structure of molecular machinery that underliesorganismal complexity. The resilience to network failures isa critical property of the interactome as the breakdown ofinteractions may lead to cell death or disease. By study-ing interactomes from 1,840 species across the tree of life,we find that evolution leads to more resilient interactomes,providing evidence for a longstanding hypothesis that inter-actomes evolve favoring robustness against network failures.We find that a highly resilient interactome has a beneficialimpact on the organism’s survival in complex, variable, andcompetitive habitats. Our findings reveal how interactomeschange through evolution and how these changes affect theirresponse to environmental unpredictability.
Author contributions: M.Z., M.W.F., and J.L. designed research; M.Z., R.S., and J.L. per-formed research; M.Z., R.S., M.W.F., and J.L. analyzed data; and M.Z., R.S., M.W.F., andJ.L. wrote the paper.y
Reviewers: E.A., Harvard University; and A.B., Albert Einstein College Of Medicine. y
The authors declare no conflict of interest.y
This open access article is distributed under Creative Commons Attribution-NonCommercial-NoDerivatives License 4.0 (CC BY-NC-ND).y1 To whom correspondence may be addressed. Email: [email protected] or [email protected]
This article contains supporting information online at www.pnas.org/lookup/suppl/doi:10.1073/pnas.1818013116/-/DCSupplemental.y
www.pnas.org/cgi/doi/10.1073/pnas.1818013116 PNAS Latest Articles | 1 of 8

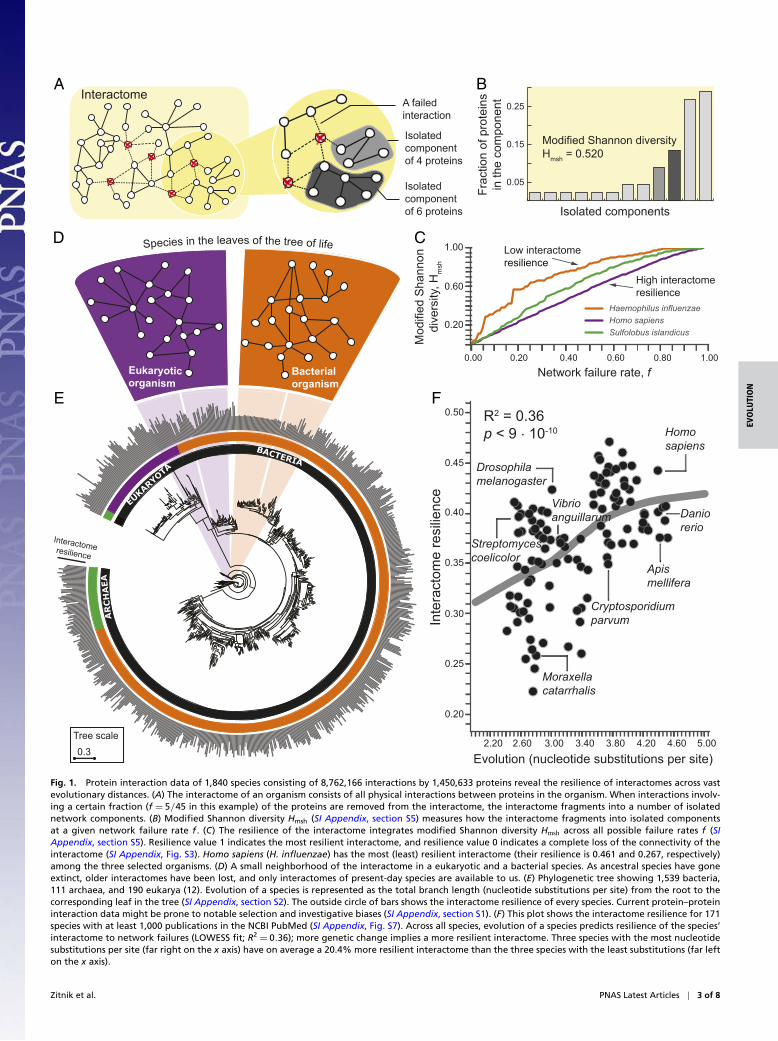
ResultsModeling Resilience of the Interactome. Natural selection hasinfluenced many features of living organisms, both at the levelof individual genes (27) and at the level of whole organisms (13).To determine how natural selection influences the structure ofinteractomes, we study the resilience of interactomes to networkfailures (23, 25, 26). Resilience is a critical property of an inter-actome as the breakdown of proteins can fundamentally affectthe exchange of any biological information between proteins in acell (Fig. 1A). Network failure could occur through the removalof a protein (e.g., by a nonsense mutation) or the disruption of aprotein–protein interaction (e.g., by environmental factors, suchas availability of resources). The removal of even a small numberof proteins can completely fragment the interactome and leadto cell death and disease (4, 5) (SI Appendix, section S5.1 andTable S3). Disruptions of interactions can thus affect the inter-actome to the extent that its connectivity can be completely lostand the interactome loses its biological function and increasesthe risk of disease (5).
We formally characterize the resilience of an interactome of aspecies by measuring how fragmented the interactome becomeswhen all interactions involving a fraction f of the proteins(nodes) are randomly removed from the interactome (Fig. 1A).The resulting isolated network components then determine theinteractome fragmentation. A network component is a con-nected subnetwork of the interactome in which any two nodescan reach each other by a path of edges. The smaller the networkcomponent is, the fewer nodes can be reached from any givennode in the component. To characterize how the interactomefragments into isolated components we use the Shannon diver-sity index (28–31), which we modify to ensure that the resilienceof interactomes with different numbers of proteins can be com-pared (Fig. 1B and SI Appendix, section S5.2). In particular, whenthe interactome G is subjected to a network failure rate f , itis fragmented into a number of isolated components of vary-ing sizes (SI Appendix, Fig. S1). We quantify connectivity of theresulting fragmented interactome Gf by calculating the modifiedShannon diversity on the resulting set of isolated components.Let {C1, C2, . . . , Ck} be k isolated components in Gf . The modi-fied Shannon diversity of Gf is then calculated as the entropy of{C1, C2, . . . , Ck} as
Hmsh(Gf )=−1
logN
k∑i=1
pi log pi , [1]
where N is the number of proteins in the interactome andpi = |Ci |/N is the proportion of proteins in the interactome Gthat are in component Ci . We can interpret pi as the proba-bility of seeing a protein from component Ci when samplingone protein from the fragmented interactome Gf . That is,Eq. 1 quantifies the uncertainty in predicting the componentidentity of a protein that is taken at random from the interac-tome. Finally, we use the normalization factor 1/ logN becauseit corrects for differences in the numbers of proteins in theinteractomes and ensures that interactomes of different speciescan be compared. The range of possible Hmsh values is between0 and 1, where these limits correspond, respectively, to a con-nected interactome in which any two proteins are connectedby a path of edges and a completely fragmented interactomein which every protein is its own isolated component. If thefragmented interactome has one large component and onlya few small broken-off components, then the modified Shan-non diversity is low, providing evidence that the interactomehas network structure that is resilient to network failures (23)(SI Appendix, Fig. S2). In contrast, if the interactome breaksinto many small components, it becomes fragmented, and itsmodified Shannon diversity is high (SI Appendix, Fig. S2),
indicating that the interactome is not resilient to networkfailures.
To fully characterize the interactome resilience of a species wemeasure fragmentation of the species’ interactome across all pos-sible network failure rates (SI Appendix, Fig. S3). Consider theinteractome of the pathogenic bacterium Haemophilus influenzaeand the interactome of humans, which have different resilience(Fig. 1C). In the H. influenzae interactome, on removing smallfractions of all nodes many network components of varying sizesappear, producing a quickly increasing Shannon diversity. Incontrast, the human interactome fragments into a few small com-ponents and one large component whose size slowly decreases assmall components break off, resulting in Shannon diversity thatincreases linearly with the network failure rate (Fig. 1C). Thus,unlike the fragmentation of the H. influenzae interactome, thehuman interactome stays together as a large component for veryhigh network failure rates, providing evidence for the topologicalstability of the interactome. In general, the calculation of mod-ified Shannon diversity over all possible network failure rates fyields a monotonically increasing function that reaches its min-imum value of 0 at f =0 (i.e., a connected interactome) and itsmaximum value of 1 at f =1 (i.e., a completely fragmented inter-actome) as the interactome becomes increasingly fragmentedwith increasing network failure rate f (SI Appendix, section S5.3and Fig. S3). We therefore define resilience of interactome G asone minus the area under the curve defined by that function,
Resilience(G)= 1−∫ 1
0
Hmsh(Gf ) df , [2]
which takes values between 0 and 1; a higher value indicates amore resilient interactome.
Resilience of Interactomes Throughout Evolution. We characterizesystematically the resilience of interactomes for all species inthe dataset (Fig. 1D and SI Appendix, Table S5). We find thatspecies display varying degrees of interactome resilience to net-work failures (Fig. 1E). At a global, cross-species scale, we findthat a greater amount of genetic change is associated with amore resilient interactome structure [locally weighted scatterplotsmoothing (LOWESS) fit; R2 =0.36; Fig. 1F], and this associ-ation remains strong even after statistical adjustments for theinfluence of many other variables (SI Appendix, section S8). Themore genetic change a species has undergone, the more resilientis its interactome. The evolution of a species, which is repre-sented by the total branch length from the root to the leaf taxonrepresenting that species in the tree of life (12), thus predictsresilience of the species’ interactome, providing empirical evi-dence that interactome resilience is an evolvable property oforganisms (26). This finding also suggests that the structure ofpresent-day interactomes reflects their history or that interac-tomes must have a certain structure because that structure is wellsuited to the network’s biological function. From an evolutionarystandpoint, this finding points in the direction of topologicallystable interactomes, which suggests that evolutionary forces mayshape protein interaction networks in such a way that their large-scale connectivity, i.e., the network’s biological function, remainslargely unaffected by small network failures as long the failuresare random.
We also find that species from the same taxonomic domainhave more similar interactome resilience than species fromdifferent domains (P =6 · 10−11 for bacteria against eukary-otes; see SI Appendix, Fig. S10 for comparisons between othertaxonomic groups). Furthermore, the degree of interactomeresilience is significantly higher than expected by chance alone(SI Appendix, Fig. S9); that is, in a similar random net-work of identical size and degree distribution (P =5 · 10−12),indicating that naturally occurring interactomes have higher
2 of 8 | www.pnas.org/cgi/doi/10.1073/pnas.1818013116 Zitnik et al.
EVO
LUTI
ON
InteractomeA failed interaction
Isolated componentof 4 proteins
Isolated components
Frac
tion
of p
rote
ins
in th
e co
mpo
nent
Isolated componentof 6 proteins
Modified Shannon diversityHmsh = 0.520
Daniorerio
Homosapiens
Apismellifera
Moraxellacatarrhalis
Vibrio anguillarum
R2 = 0.36p < 9 . 10-10
Drosophilamelanogaster
Streptomycescoelicolor
Interactomeresilience
0.3Tree scale
Eukaryotic organism
Bacterialorganism
EUKARYOTA
BACTERIA
ARCHAEA
Low interactomeresilience
High interactomeresilience
0.05
0.15
0.25
Cryptosporidium parvum
Network failure rate, f
Inte
ract
ome
resi
lienc
eM
odifi
ed S
hann
ondi
vers
ity, H
msh
0.20
0.25
0.30
0.35
0.40
0.45
0.50
2.20 2.60 3.00 3.40 3.80 4.20 4.60 5.00
Evolution (nucleotide substitutions per site)
A B
CD
E F
Fig. 1. Protein interaction data of 1,840 species consisting of 8,762,166 interactions by 1,450,633 proteins reveal the resilience of interactomes across vastevolutionary distances. (A) The interactome of an organism consists of all physical interactions between proteins in the organism. When interactions involv-ing a certain fraction (f = 5/45 in this example) of the proteins are removed from the interactome, the interactome fragments into a number of isolatednetwork components. (B) Modified Shannon diversity Hmsh (SI Appendix, section S5) measures how the interactome fragments into isolated componentsat a given network failure rate f . (C) The resilience of the interactome integrates modified Shannon diversity Hmsh across all possible failure rates f (SIAppendix, section S5). Resilience value 1 indicates the most resilient interactome, and resilience value 0 indicates a complete loss of the connectivity of theinteractome (SI Appendix, Fig. S3). Homo sapiens (H. influenzae) has the most (least) resilient interactome (their resilience is 0.461 and 0.267, respectively)among the three selected organisms. (D) A small neighborhood of the interactome in a eukaryotic and a bacterial species. As ancestral species have goneextinct, older interactomes have been lost, and only interactomes of present-day species are available to us. (E) Phylogenetic tree showing 1,539 bacteria,111 archaea, and 190 eukarya (12). Evolution of a species is represented as the total branch length (nucleotide substitutions per site) from the root to thecorresponding leaf in the tree (SI Appendix, section S2). The outside circle of bars shows the interactome resilience of every species. Current protein–proteininteraction data might be prone to notable selection and investigative biases (SI Appendix, section S1). (F) This plot shows the interactome resilience for 171species with at least 1,000 publications in the NCBI PubMed (SI Appendix, Fig. S7). Across all species, evolution of a species predicts resilience of the species’interactome to network failures (LOWESS fit; R2 = 0.36); more genetic change implies a more resilient interactome. Three species with the most nucleotidesubstitutions per site (far right on the x axis) have on average a 20.4% more resilient interactome than the three species with the least substitutions (far lefton the x axis).
Zitnik et al. PNAS Latest Articles | 3 of 8
resilience than their random counterparts. These findings areindependent of genomic attributes of the species, such as genomesize and the number of protein-coding genes, and are not directeffects of network size, the number of interactions in eachspecies, broad-tailed degree distributions (23), or the presenceof hubs in the interactome networks (SI Appendix, Fig. S8 andTable S1). Furthermore, these findings are consistent across avariety of assays that are used to measure the interactome (SIAppendix, Table S2).
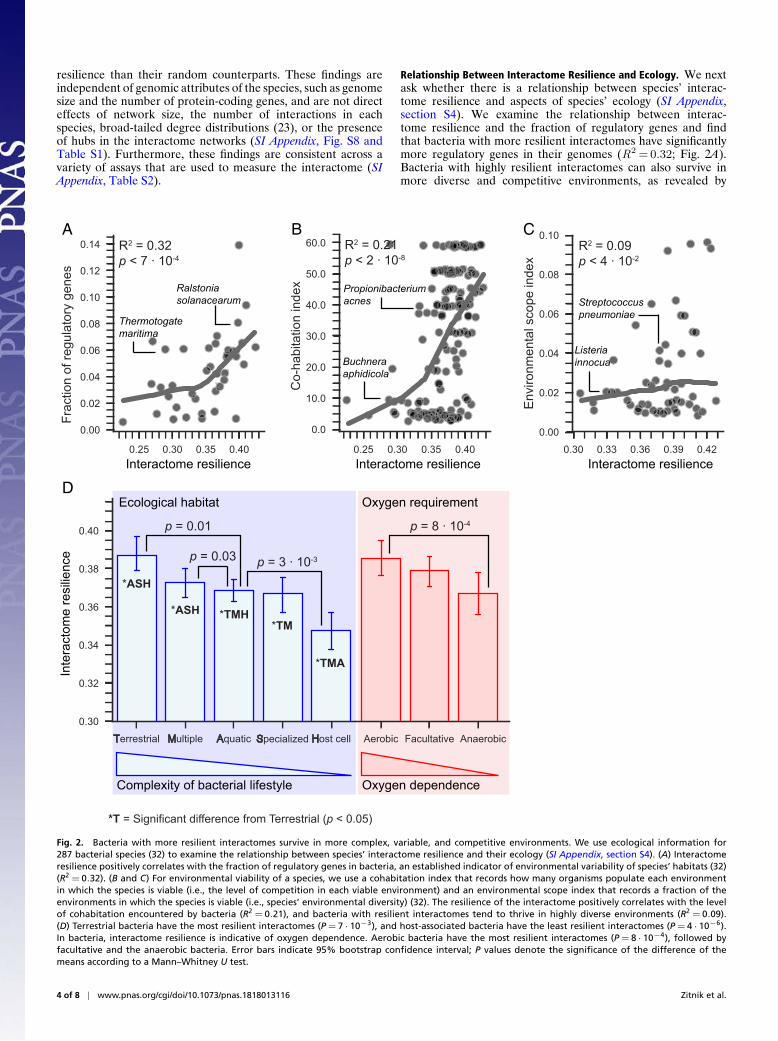
Relationship Between Interactome Resilience and Ecology. We nextask whether there is a relationship between species’ interac-tome resilience and aspects of species’ ecology (SI Appendix,section S4). We examine the relationship between interac-tome resilience and the fraction of regulatory genes and findthat bacteria with more resilient interactomes have significantlymore regulatory genes in their genomes (R2 =0.32; Fig. 2A).Bacteria with highly resilient interactomes can also survive inmore diverse and competitive environments, as revealed by
Thermotogatemaritima
Ralstoniasolanacearum
R2 = 0.32p < 7 . 10-4
Propionibacteriumacnes
Buchneraaphidicola
R2 = 0.21p < 2 . 10-8
Streptococcuspneumoniae
Listeriainnocua
R2 = 0.09p < 4 . 10-2
p = 0.01
p = 3 . 10-3p = 0.03
p = 8 . 10-4
*ASH
*ASH *TMH*TM
*TMA
*T = Significant difference from Terrestrial (p < 0.05)
Interactome resilience Interactome resilience Interactome resilience
Inte
ract
ome
resi
lienc
e
Oxygen dependenceComplexity of bacterial lifestyle
Ecological habitat Oxygen requirement
A B C
D
Fig. 2. Bacteria with more resilient interactomes survive in more complex, variable, and competitive environments. We use ecological information for287 bacterial species (32) to examine the relationship between species’ interactome resilience and their ecology (SI Appendix, section S4). (A) Interactomeresilience positively correlates with the fraction of regulatory genes in bacteria, an established indicator of environmental variability of species’ habitats (32)(R2 = 0.32). (B and C) For environmental viability of a species, we use a cohabitation index that records how many organisms populate each environmentin which the species is viable (i.e., the level of competition in each viable environment) and an environmental scope index that records a fraction of theenvironments in which the species is viable (i.e., species’ environmental diversity) (32). The resilience of the interactome positively correlates with the levelof cohabitation encountered by bacteria (R2 = 0.21), and bacteria with resilient interactomes tend to thrive in highly diverse environments (R2 = 0.09).(D) Terrestrial bacteria have the most resilient interactomes (P = 7 · 10−3), and host-associated bacteria have the least resilient interactomes (P = 4 · 10−6).In bacteria, interactome resilience is indicative of oxygen dependence. Aerobic bacteria have the most resilient interactomes (P = 8 · 10−4), followed byfacultative and the anaerobic bacteria. Error bars indicate 95% bootstrap confidence interval; P values denote the significance of the difference of themeans according to a Mann–Whitney U test.
4 of 8 | www.pnas.org/cgi/doi/10.1073/pnas.1818013116 Zitnik et al.

EVO
LUTI
ON
A‘
A‘‘
Protein family (A’, A’’, A’’’)
A‘‘‘Organism 1
Organism 2
Organism 3
Organism 2
Organism 1
Ancestralspecies
Speciationevent
Organism 3
Organism 1
Organism 2Isolated components = 1.0Effective size = 1.0
Isolated components = 0.83Effective size = 0.94
Isolated components = 0.43Effective size = 0.79
Organism 1 Organism 2 Organism 3
A‘‘ A‘‘‘A‘
Orthologpair
Orthologpair
Protein-protein interaction
Orthologous relationship
Protein
Rewiring of interactions over time
Ancestralspecies
A
Proteinnetworkneighborhood
A‘‘
A‘
Organism 1
Organism 2
Addition ofthe interaction
Nodedeletion
Orthologpair
Paralogpair
A‘‘
A‘
Organism 1
Organism 2
Deletionof the interaction
Orthologpair
Paralogtriple
Paralogpair
A‘
A‘‘
Orthologpair
Evolution
Isolated network component
0.1Tree scale
A =1/dA Σ(1 - 1/dA Σ eij )j Є N1(A)i Є N1(A)
dA =|N1(A)| Degree of protein A
Isol
ated
net
wor
kco
mpo
nent
s
Evolution (nucleotide substitutions per site) Evolution (nucleotide substitutions per site)
Effe
ctiv
ene
ighb
orho
od s
ize
Isolated componentsA = nA/dA
nA Number of isolated components arising when all interactions involving A faileij Binary indicator of interaction between i and j
Organism 2
Organism 1
2.60 2.80 3.00 3.20 3.40 3.60 3.80 4.00 4.20 4.400.00
0.10
0.20
0.30
0.40
0.20
0.30
0.40
0.50
0.60
0.70
2.60 2.80 3.00 3.20 3.40 3.60 3.80 4.00 4.20 4.40
A
B
DC
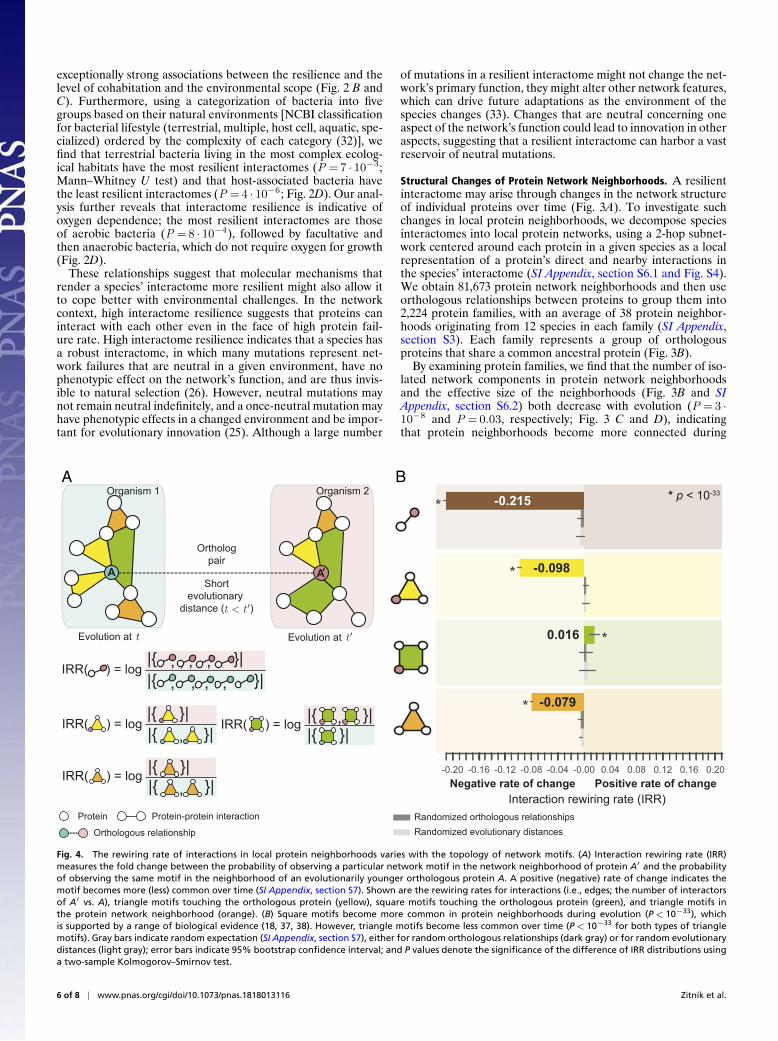
Fig. 3. Evolution mitigates local network structural changes in protein interactomes. (A) A hypothetical phylogenetic tree illustrates a speciation eventthat gives rise to two lineages according to the speciation-divergence model (11) and leads to present-day organisms “1” (green) and “2” (pink). In thisexample, a single ancestral protein A that was present in the ancestral species gives rise to proteins A′ and A
′′upon speciation; A′ and A
′′form an
orthologous protein pair. As the two newly arising species diverge and protein sequences evolve, protein network neighborhoods (SI Appendix, Fig. S4) intheir interactomes can rewire independently over time. Shown are also in-paralogs, proteins which arise through gene duplication events in species 1 and2 after speciation. (B) A hypothetical protein family with three protein members (A′, A′′, A′′′), each from a different organism. In the phylogenetic tree,organism 1 is located at the tip of the lineage with the shortest branch length, whereas organism 3 is in the lineage with the longest branch length in thetree. We represent the protein family by a sequence of orthologous proteins ordered by the branch length of proteins’ originating species (SI Appendix,section S3). We then characterize the network neighborhood of each protein in the family by calculating two network metrics (SI Appendix, Fig. S5). Isolatedcomponents are given by the degree-adjusted number of connected components in the neighborhood that arise when the central protein is removed fromthe interactome (gray) (SI Appendix, section S6). The neighborhood size down-weighted by the redundancy of local interactions gives the effective size ofthe neighborhood (SI Appendix, section S6). (C and D) The number of isolated network components and the effective size of protein neighborhoods bothdecrease with evolution (P = 3 · 10−8 and P = 0.03, respectively; Spearman’s ρ rank correlation), suggesting that local interaction neighborhoods rewire viaa coordinated evolutionary mechanism. Lines in C and D show the LOWESS fit of median-aggregated network metric values for 81,673 proteins from 2,224protein families; color bands indicate 95% confidence band for the LOWESS fit; gray lines show random expectation.
Zitnik et al. PNAS Latest Articles | 5 of 8
exceptionally strong associations between the resilience and thelevel of cohabitation and the environmental scope (Fig. 2 B andC). Furthermore, using a categorization of bacteria into fivegroups based on their natural environments [NCBI classificationfor bacterial lifestyle (terrestrial, multiple, host cell, aquatic, spe-cialized) ordered by the complexity of each category (32)], wefind that terrestrial bacteria living in the most complex ecolog-ical habitats have the most resilient interactomes (P =7 · 10−3;Mann–Whitney U test) and that host-associated bacteria havethe least resilient interactomes (P =4 · 10−6; Fig. 2D). Our anal-ysis further reveals that interactome resilience is indicative ofoxygen dependence; the most resilient interactomes are thoseof aerobic bacteria (P =8 · 10−4), followed by facultative andthen anaerobic bacteria, which do not require oxygen for growth(Fig. 2D).
These relationships suggest that molecular mechanisms thatrender a species’ interactome more resilient might also allow itto cope better with environmental challenges. In the networkcontext, high interactome resilience suggests that proteins caninteract with each other even in the face of high protein fail-ure rate. High interactome resilience indicates that a species hasa robust interactome, in which many mutations represent net-work failures that are neutral in a given environment, have nophenotypic effect on the network’s function, and are thus invis-ible to natural selection (26). However, neutral mutations maynot remain neutral indefinitely, and a once-neutral mutation mayhave phenotypic effects in a changed environment and be impor-tant for evolutionary innovation (25). Although a large number
of mutations in a resilient interactome might not change the net-work’s primary function, they might alter other network features,which can drive future adaptations as the environment of thespecies changes (33). Changes that are neutral concerning oneaspect of the network’s function could lead to innovation in otheraspects, suggesting that a resilient interactome can harbor a vastreservoir of neutral mutations.
Structural Changes of Protein Network Neighborhoods. A resilientinteractome may arise through changes in the network structureof individual proteins over time (Fig. 3A). To investigate suchchanges in local protein neighborhoods, we decompose speciesinteractomes into local protein networks, using a 2-hop subnet-work centered around each protein in a given species as a localrepresentation of a protein’s direct and nearby interactions inthe species’ interactome (SI Appendix, section S6.1 and Fig. S4).We obtain 81,673 protein network neighborhoods and then useorthologous relationships between proteins to group them into2,224 protein families, with an average of 38 protein neighbor-hoods originating from 12 species in each family (SI Appendix,section S3). Each family represents a group of orthologousproteins that share a common ancestral protein (Fig. 3B).
By examining protein families, we find that the number of iso-lated network components in protein network neighborhoodsand the effective size of the neighborhoods (Fig. 3B and SIAppendix, section S6.2) both decrease with evolution (P =3 ·10−8 and P =0.03, respectively; Fig. 3 C and D), indicatingthat protein neighborhoods become more connected during
Organism 2
Shortevolutionary
distance ( )
Evolution at Evolution at
-0.215
-0.098
-0.079
0.016
*
*
*
*
Interaction rewiring rate (IRR)
A A‘
* p < 10-33
IRR( ) = log|{ , , , , }||{ , , , , }|
IRR( ) = log |{ }||{ , }|
IRR( ) = log|{ }||{ , }| IRR( ) = log |{ , }|
|{ }|
Positive rate of changeNegative rate of change
Organism 1
Orthologpair
Randomized evolutionary distancesRandomized orthologous relationshipsProtein-protein interaction
Orthologous relationship
Protein
A B
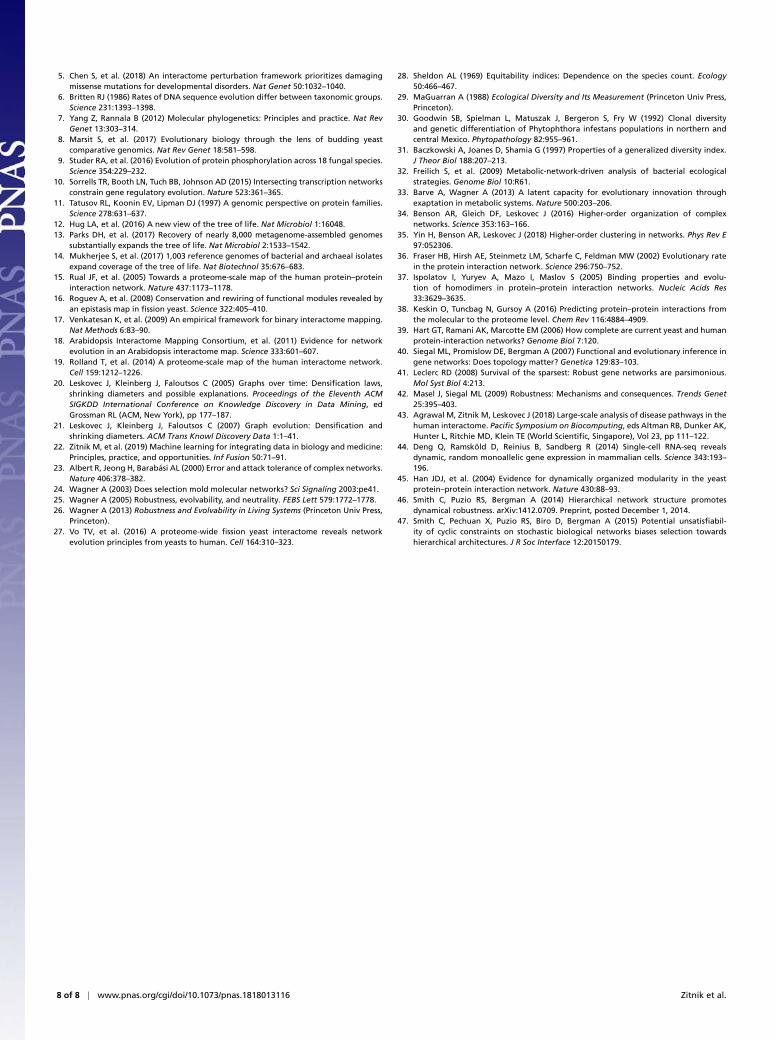
Fig. 4. The rewiring rate of interactions in local protein neighborhoods varies with the topology of network motifs. (A) Interaction rewiring rate (IRR)measures the fold change between the probability of observing a particular network motif in the network neighborhood of protein A′ and the probabilityof observing the same motif in the neighborhood of an evolutionarily younger orthologous protein A. A positive (negative) rate of change indicates themotif becomes more (less) common over time (SI Appendix, section S7). Shown are the rewiring rates for interactions (i.e., edges; the number of interactorsof A′ vs. A), triangle motifs touching the orthologous protein (yellow), square motifs touching the orthologous protein (green), and triangle motifs inthe protein network neighborhood (orange). (B) Square motifs become more common in protein neighborhoods during evolution (P< 10−33), whichis supported by a range of biological evidence (18, 37, 38). However, triangle motifs become less common over time (P< 10−33 for both types of trianglemotifs). Gray bars indicate random expectation (SI Appendix, section S7), either for random orthologous relationships (dark gray) or for random evolutionarydistances (light gray); error bars indicate 95% bootstrap confidence interval; and P values denote the significance of the difference of IRR distributions usinga two-sample Kolmogorov–Smirnov test.
6 of 8 | www.pnas.org/cgi/doi/10.1073/pnas.1818013116 Zitnik et al.

EVO
LUTI
ON
evolution. These structural changes in the neighborhoods sug-gest a molecular network model of evolution (Fig. 3B): Fororthologous proteins in two species, as the evolutionary distancebetween the species increases, the proteins’ local network neigh-borhoods become increasingly different and the neighborhoodbecomes more interconnected in the species that has undergonemore genetic change.
Network Rewiring of Protein–Protein Interactions. To study evolu-tionary mechanisms of structural changes in the interactomes, weinvestigate network motifs (34, 35). We first identify orthologousprotein pairs from evolutionarily close species (SI Appendix, sec-tion S3), resulting in 2,485,564 protein pairs, which we then useto calculate interaction rewiring rates (IRRs) for selected net-work motifs (Fig. 4A). We calculate the number of times eachmotif appears in each protein neighborhood and derive the IRRby comparing the motif occurrences between the interactomesof the older and the younger species of each protein pair (SIAppendix, section S7.1). We find strong statistical evidence thatnetwork motifs rewire during evolution (P < 10−33 for all net-work motifs; Fig. 4B), suggesting that rewiring of interactions isan important mechanism for the evolution of interactomes. Forexample, proteins in evolutionarily older species on average par-ticipate in a factor of 0.861 fewer protein–protein interactionscompared with proteins in evolutionarily younger species (IRR=−0.215; Fig. 4B). This significant negative correlation between aprotein’s number of interactions and the protein’s evolutionaryage confirms earlier studies of Saccharomyces cerevisiae (36). Wealso find that square motifs of interactions become more com-mon in protein neighborhoods during evolution (IRR=0.016;Fig. 4B). A range of biological evidence (18, 37, 38) supportsthis positive rate of change in the number of square motifs:From a structural perspective (38), protein–protein interactionsoften require complementary interfaces; hence two proteins withsimilar interfaces share many of their neighbors. However, theymight not interact directly with each other, which manifests in theinteractome as a square motif of interactions (see SI Appendix,Fig. S6 for an illustration of interaction interfaces recognizingthe binding sites in proteins). Evolutionary arguments follow-ing gene duplication (18) reach the same conclusion; proteinswith multiple shared interaction partners are likely to shareeven more partners and thereby produce new square motifs ofinteractions. To test the predictive power of our motif-basedmodel of structural network changes, we estimate the size of thewhole human interactome by extrapolating the S. cerevisiae inter-actome, using IRRs from Fig. 4B (SI Appendix, section S7.3).Assuming one splice isoform per gene, we predict the numberof interactions in humans to be ∼160,000. This prediction isin surprisingly good agreement with three previous estimates ofthe size of the human interactome, which range from 150,000to 370,000 interactions (15, 17, 39) and have proved crucial inestablishing the complexity of the human interactome (19).
DiscussionOur analyses reveal how protein–protein interaction networkschange through evolution and how changes in these networksaffect phenotypes and organismal response to environmen-tal complexity. This systematic investigation of protein–proteininteraction networks from an evolutionary perspective wasenabled by a dataset of interactomes, consisting of protein–protein interaction networks from 1,840 species. To date, mostevolutionary analyses of biological networks have focused on asmall number of organisms with high-coverage protein–protein
interaction data, such as S. cerevisiae, Mus musculus, and humans.This is because interactomes mapped by unbiased tests of allpossible pairwise combinations of proteins on the same plat-form remain scarce, an important limitation of the present study.Furthermore, experimentally documented protein interactionsare currently subject to a high number of false positives andnegatives. As more protein interaction data are collected, andmore genomes become available, the generalizability of ourfindings can be further evaluated. However, our results are con-sistent across both different subsets of protein interaction data(SI Appendix, Table S2) and different phylogenetic lineages (SIAppendix, Fig. S10) and are not explained by many possiblegenomic and network confounders (SI Appendix, section S8,Fig. S8, and Table S1), thus providing confidence that our keyfindings cannot be attributed to biases in the datasets.
Interactome resilience is an important aspect of our study. Theresilience measures fragmentation of the interactome into iso-lated components and thus represents a global measure of theinteractome’s topological stability. Beyond fragmentation, thereare other possible modifications of the interactome that couldalter the network’s biological function without necessarily dis-connecting the network (40–42). As more detailed informationabout functions of individual proteins in the interactome (43), aswell as dynamic protein-expression data (44), becomes available,our measure of interactome resilience could be adapted to givea more complex definition of resiliency, which might yield moredetailed evolutionary predictions. Additionally, information onhow protein–protein interactions change dynamically both intime and space (45–47) might reveal how topological stability ofthe interactome depends on large-scale interactome connectivityas well as on the interactome’s dynamic properties (40).
Our study presents an additional paradigm for evolutionarystudies by demonstrating that interactomes reveal fundamentalstructural principles of molecular networks. Our findings high-light evolution as an important predictor of structural networkchange and show that evolution of a species predicts resilienceof the species’ interactome to protein failures. The findingsoffer quantitative evidence for the biological proposition thatan organism that has undergone more genetic change has amore resilient interactome, which, in turn, is associated withthe greater ability of the organism to survive in a more com-plex, variable, or competitive environment. Our findings can alsohelp clarify the mechanisms of how interactomes change dur-ing evolution, why currently observed network structures exist,and how they may change in the future and facilitate the extrap-olation of functional information from experimentally charac-terized proteins to their orthologous proteins in poorly studiedorganisms.
Materials and MethodsDetailed description of data, statistical methodology, and additional analy-ses are provided in SI Appendix.
Code and Data Availability. Software implementation of statistical method-ology is publicly available at snap.stanford.edu/tree-of-life. All data usedin this paper, including the processed interactomes, are shared with thecommunity and available from snap.stanford.edu/tree-of-life.
ACKNOWLEDGMENTS. For helpful discussion and comments on the manu-script, we thank Aaron Goodman, Hunter B. Fraser, Alice Y. Ting, Emma Pier-son, Michael An, and Pratyaksh Sharma. M.Z., R.S., and J.L. were supportedin part by NSF, NIH, Defense Advanced Research Projects Agency, Boeing,Stanford Data Science Initiative, and Chan Zuckerberg Biohub. M.W.F. wassupported in part by the Stanford Center for Computational, Evolutionary,and Human Genomics and a grant from the John Templeton Foundation.
1. Castelle CJ, Banfield JF (2018) Major new microbial groups expand diversity and alterour understanding of the tree of life. Cell 172:1181–1197.
2. Barabasi AL, Oltvai ZN (2004) Network biology: Understanding the cell’s functionalorganization. Nat Rev Genet 5:101–113.
3. Hu JX, Thomas CE, Brunak S (2016) Network biology concepts in complex diseasecomorbidities. Nat Rev Genet 17:615–629.
4. Huttlin EL, et al. (2017) Architecture of the human interactome defines proteincommunities and disease networks. Nature 545:505–509.
Zitnik et al. PNAS Latest Articles | 7 of 8
5. Chen S, et al. (2018) An interactome perturbation framework prioritizes damagingmissense mutations for developmental disorders. Nat Genet 50:1032–1040.
6. Britten RJ (1986) Rates of DNA sequence evolution differ between taxonomic groups.Science 231:1393–1398.
7. Yang Z, Rannala B (2012) Molecular phylogenetics: Principles and practice. Nat RevGenet 13:303–314.
8. Marsit S, et al. (2017) Evolutionary biology through the lens of budding yeastcomparative genomics. Nat Rev Genet 18:581–598.
9. Studer RA, et al. (2016) Evolution of protein phosphorylation across 18 fungal species.Science 354:229–232.
10. Sorrells TR, Booth LN, Tuch BB, Johnson AD (2015) Intersecting transcription networksconstrain gene regulatory evolution. Nature 523:361–365.
11. Tatusov RL, Koonin EV, Lipman DJ (1997) A genomic perspective on protein families.Science 278:631–637.
12. Hug LA, et al. (2016) A new view of the tree of life. Nat Microbiol 1:16048.13. Parks DH, et al. (2017) Recovery of nearly 8,000 metagenome-assembled genomes
substantially expands the tree of life. Nat Microbiol 2:1533–1542.14. Mukherjee S, et al. (2017) 1,003 reference genomes of bacterial and archaeal isolates
expand coverage of the tree of life. Nat Biotechnol 35:676–683.15. Rual JF, et al. (2005) Towards a proteome-scale map of the human protein–protein
interaction network. Nature 437:1173–1178.16. Roguev A, et al. (2008) Conservation and rewiring of functional modules revealed by
an epistasis map in fission yeast. Science 322:405–410.17. Venkatesan K, et al. (2009) An empirical framework for binary interactome mapping.
Nat Methods 6:83–90.18. Arabidopsis Interactome Mapping Consortium, et al. (2011) Evidence for network
evolution in an Arabidopsis interactome map. Science 333:601–607.19. Rolland T, et al. (2014) A proteome-scale map of the human interactome network.
Cell 159:1212–1226.20. Leskovec J, Kleinberg J, Faloutsos C (2005) Graphs over time: Densification laws,
shrinking diameters and possible explanations. Proceedings of the Eleventh ACMSIGKDD International Conference on Knowledge Discovery in Data Mining, edGrossman RL (ACM, New York), pp 177–187.
21. Leskovec J, Kleinberg J, Faloutsos C (2007) Graph evolution: Densification andshrinking diameters. ACM Trans Knowl Discovery Data 1:1–41.
22. Zitnik M, et al. (2019) Machine learning for integrating data in biology and medicine:Principles, practice, and opportunities. Inf Fusion 50:71–91.
23. Albert R, Jeong H, Barabasi AL (2000) Error and attack tolerance of complex networks.Nature 406:378–382.
24. Wagner A (2003) Does selection mold molecular networks? Sci Signaling 2003:pe41.25. Wagner A (2005) Robustness, evolvability, and neutrality. FEBS Lett 579:1772–1778.26. Wagner A (2013) Robustness and Evolvability in Living Systems (Princeton Univ Press,
Princeton).27. Vo TV, et al. (2016) A proteome-wide fission yeast interactome reveals network
evolution principles from yeasts to human. Cell 164:310–323.
28. Sheldon AL (1969) Equitability indices: Dependence on the species count. Ecology50:466–467.
29. MaGuarran A (1988) Ecological Diversity and Its Measurement (Princeton Univ Press,Princeton).
30. Goodwin SB, Spielman L, Matuszak J, Bergeron S, Fry W (1992) Clonal diversityand genetic differentiation of Phytophthora infestans populations in northern andcentral Mexico. Phytopathology 82:955–961.
31. Baczkowski A, Joanes D, Shamia G (1997) Properties of a generalized diversity index.J Theor Biol 188:207–213.
32. Freilich S, et al. (2009) Metabolic-network-driven analysis of bacterial ecologicalstrategies. Genome Biol 10:R61.
33. Barve A, Wagner A (2013) A latent capacity for evolutionary innovation throughexaptation in metabolic systems. Nature 500:203–206.
34. Benson AR, Gleich DF, Leskovec J (2016) Higher-order organization of complexnetworks. Science 353:163–166.
35. Yin H, Benson AR, Leskovec J (2018) Higher-order clustering in networks. Phys Rev E97:052306.
36. Fraser HB, Hirsh AE, Steinmetz LM, Scharfe C, Feldman MW (2002) Evolutionary ratein the protein interaction network. Science 296:750–752.
37. Ispolatov I, Yuryev A, Mazo I, Maslov S (2005) Binding properties and evolu-tion of homodimers in protein–protein interaction networks. Nucleic Acids Res33:3629–3635.
38. Keskin O, Tuncbag N, Gursoy A (2016) Predicting protein–protein interactions fromthe molecular to the proteome level. Chem Rev 116:4884–4909.
39. Hart GT, Ramani AK, Marcotte EM (2006) How complete are current yeast and humanprotein-interaction networks? Genome Biol 7:120.
40. Siegal ML, Promislow DE, Bergman A (2007) Functional and evolutionary inference ingene networks: Does topology matter? Genetica 129:83–103.
41. Leclerc RD (2008) Survival of the sparsest: Robust gene networks are parsimonious.Mol Syst Biol 4:213.
42. Masel J, Siegal ML (2009) Robustness: Mechanisms and consequences. Trends Genet25:395–403.
43. Agrawal M, Zitnik M, Leskovec J (2018) Large-scale analysis of disease pathways in thehuman interactome. Pacific Symposium on Biocomputing, eds Altman RB, Dunker AK,Hunter L, Ritchie MD, Klein TE (World Scientific, Singapore), Vol 23, pp 111–122.
44. Deng Q, Ramskold D, Reinius B, Sandberg R (2014) Single-cell RNA-seq revealsdynamic, random monoallelic gene expression in mammalian cells. Science 343:193–196.
45. Han JDJ, et al. (2004) Evidence for dynamically organized modularity in the yeastprotein–protein interaction network. Nature 430:88–93.
46. Smith C, Puzio RS, Bergman A (2014) Hierarchical network structure promotesdynamical robustness. arXiv:1412.0709. Preprint, posted December 1, 2014.
47. Smith C, Pechuan X, Puzio RS, Biro D, Bergman A (2015) Potential unsatisfiabil-ity of cyclic constraints on stochastic biological networks biases selection towardshierarchical architectures. J R Soc Interface 12:20150179.
8 of 8 | www.pnas.org/cgi/doi/10.1073/pnas.1818013116 Zitnik et al.