evolutionary theories of aging: confirmation of a
TRANSCRIPT

vol. 152, no. 1 the american naturalist july 1998
Evolutionary Theories of Aging: Confirmation of aFundamental Prediction, with Implications forthe Genetic Basis and Evolution of Life Span
Robert E. Ricklefs*
wear and tear, on the one hand, and genetically controlled mecha-Department of Biology, University of Missouri at St. Louis,nisms of prevention and repair, on the other. Evidently, remediesSt. Louis, Missouri 63121-4499for extreme physiological deterioration in old age either are not
Submitted June 2 1997; Accepted January 16, 1998 within the range of genetic variation or are too costly to be favoredby selection.
Keywords: aging, antagonistic pleiotropy, birds, mammals, mortal-ity rate, senescence.
abstract: Evolutionary considerations predict that rate of agingshould vary in direct relation to the mortality rate of presenescentyoung adults (extrinsic mortality rate) independently of differencesin physiology, such as rate of metabolism. This prediction emerges Senescence (or aging) is a decline in physiological func-from theory irrespective of the particular genetic mechanisms re- tioning with age that results in a decrease in reproductivesponsible for variation in aging. Yet this critical relationship has rate, increase in mortality rate, or both (Finch 1990; Ab-not been confirmed in comparative studies of natural populations. rams 1991; Rose 1991; Holmes and Austad 1995b). De-In the present analysis, rate of aging is estimated by the rate of in-
fined as such, senescence may result in part from accu-crease in mortality rate (mx) with age (x). Comparisons betweenmulated effects of cellular wear and tear on thenatural and captive populations of birds suggest that the Weibullindividual associated with life itself (Sohal 1986; Finchmodel (mx 5 m0 1 αxβ) provides a better description of aging
than the Gompertz model (mx 5 m0eγx). Rate of aging is quantified 1990). However, differences in maximum potential lifeby the parameter ω (dimension: 1/time), which is calculated from span among organisms with similar metabolic rates sug-the Weibull parameters α and β (ω 5 α1/(β11)). In this analysis, gest that rate of aging may be modified by biological pro-rate of aging in birds and mammals is directly related to extrinsic cesses that are under genetic control and subject to evo-mortality (estimated by the initial mortality rate, m0) indepen-
lutionary adjustment (Rose 1991; Charlesworth 1994).dently of taxonomic group and of variation in body size and, byFor example, sparrows can live 15 yr while rodents ofimplication, metabolic rate. When time is expressed in years,similar size rarely attain a third of that age under idealrate of senescence is related to initial mortality rate by ω 5
0.294m00.367. This result implies that natural selection in response conditions. This contrast suggests that wear and tear re-
to variation among taxa in m0 has resulted in the evolutionary lated to rate of living cannot fully explain variation inmodification of factors that influence the rate of aging in natural rate of aging in natural populations (Holmes and Austadpopulations. The potential strength of selection on factors that 1995b).could further reduce rate of aging is indicated by the proportion
Evolutionary theories of aging portray the pattern ofof deaths due to aging-related causes. Although species with lowsenescence as a balance between factors that promoteinitial mortality rates also exhibit reduced rates of increase in mor-aging and factors that retard aging, at least some oftality rate with age (i.e., delayed senescence), the relatively high
proportion of aging-related deaths in such species suggests that which exhibit genetic variation (Williams 1957; Hamiltonfurther evolutionary responses leading to long life are severely con- 1966; Partridge and Barton 1993a, 1993b). Evolutionarystrained. This argues against mutation accumulation and antago- modification of aging depends on the variance in fitnessnistic pleiotropy as genetic mechanisms underlying senescence and resulting from differences among individuals in a popu-suggests, instead, that rate of aging represents a balance between
lation with respect to genetic factors expressed in old age.The variance in fitness within a population is a measureof the relative potential strength of selection. For a given*E-mail: [email protected] on the phenotype of the individual, this value isAm. Nat. 1998. Vol. 152, pp. 24–44. 1998 by The University of Chicago.
0003-0147/98/5201-0003$03.00. All rights reserved. age related and is a function of the proportion of indi-

Rate of Aging in Birds and Mammals 25
viduals reaching a particular age weighted by their ex- mals, Promislow (1991, p. 1876) stated that ‘‘while short-lived taxa have high rates of senescence, there is no cor-pected future reproductive output (Charlesworth 1994).
Even in a population without senescence (i.e., with con- relation between mortality rate at age of maturity andrate of senescence.’’stant adult survival and fecundity), the relative strength
of selection declines with advancing age: as potentially Many genetic factors are known to influence the pat-tern of physiological aging or to affect the age-specificimmortal individuals die as a result of causes that affect
all ages alike, relatively few survive to express genetic fac- schedules of mortality and fecundity that express changesin underlying physiological processes (Finch 1990; Rosetors manifested only late in life.
Evolutionary theories of aging predict that the rate of 1991; Rose and Finch 1993; Holmes and Austad 1995a;Shmookler Reis and Ebert 1996; Finch and Tanzi 1997).senescence should be directly related to age-independent
mortality rates experienced by young adult individuals It is unclear, however, whether single gene effects identi-fied within human or laboratory populations resemble(Williams 1957; Rose 1991; Charlesworth 1993; Keller
and Genoud 1997). This extrinsic mortality rate influ- genetic factors that differentiate patterns of aging be-tween species. Artificial selection, particularly applied toences the proportion of adult individuals in a population
that reaches old age, hence the relative strength of selec- populations of Drosophila melanogaster, has also revealedconsiderable evolutionary responsiveness in age-specifiction on genetic factors that influence rate of aging. Thus,
in populations with lower extrinsic mortality, more indi- patterns of mortality and fecundity (Rose 1984, 1991;Partridge and Barton 1993a), even though heritabilitiesviduals survive to older ages, and selection more strongly
favors attributes that delay senescence. for longevity are low (Fukui et al. 1996; Promislow et al.1996). Still, one could argue that responses to powerfulAlthough the predicted relationship between rate of
aging and extrinsic mortality is key to interpreting senes- artificial selection do not closely mimic the results ofweaker selection in natural populations. Although con-cence as an evolved life-history trait, the existence of such
a relationship has not been confirmed directly in com- siderable circumstantial evidence suggests that patterns ofaging in natural populations are subject to evolutionaryparisons among natural populations. To be sure, animals
such as elephants (and humans), which are assumed to modification, it is crucial to show a direct connection be-tween a population’s demography and its pattern of se-have low extrinsic mortality, age slowly (Finch 1990).
However, one cannot readily disentangle the statistically nescence. Without this empirical link, it is difficult toconclude that senescence has important fitness conse-related effects of body size (associated with variation in
metabolic intensity) and mortality rate in such compari- quences for individuals in natural populations and thatpatterns of senescence have been molded by natural se-sons (Austad and Fischer 1991). Because of their ability
to fly, birds are thought to avoid much of the predation lection.In this article, I use data from the literature on age-and adverse weather that causes death among mammals
of similar body size, and they are also known to have specific mortality rates of birds and mammals to evaluatethe relationship between the rate of increase in mortalitylonger maximum life spans (Calder 1983; Holmes and
Austad 1995b), implying low extrinsic mortality. Bats rate with age and extrinsic adult mortality. First, how-ever, I discuss several issues that impinge on the analysistend to be relatively long-lived, as well, apparently for the
same reasons as birds (Austad and Fischer 1991). Yet and interpretation of mortality data. These include therelationship between selection and population demogra-methods of sampling life span generally differ between
birds and mammals, and maximum reported life span it- phy and the way in which age-dependent mortality ischaracterized mathematically. I argue that the Weibullself does not directly estimate either extrinsic mortality
or rate of aging. Keller and Genoud (1997) have recently function, rather than the more familiar Gompertz func-tion, should be used to characterize the pattern of in-pointed to the association of the long life spans of ant
queens and the protected environment of social insect crease in mortality with age. Taking this approach, analy-ses of the coefficients of Weibull models fitted to datacolonies as confirming a relationship between extrinsic
mortality and rate of aging. However, neither mortality show not only that rate of senescence is directly relatedto extrinsic adult mortality but also that this relationshiprates nor aging parameters were quantified in their com-
parison. Summarizing earlier empirical evidence in sup- is the same for birds and mammals. This result suggeststhat senescence produces unique causes of mortality un-port of evolutionary theories of senescence, Rose (1991,
p. 98) admitted that ‘‘all these patterns [relating rate of related to extrinsic factors and that the model of the evo-lutionary modification of senescence envisioned by Med-aging to mortality rate] have exceptions, and the com-
parative predictions of the theory concerning rates of awar (1952) and Williams (1957) is essentially correct forbirds and mammals. Furthermore, the analyses revealaging do not provide material for critical tests.’’ More
strikingly, in his analysis of life-history patterns of mam- that populations with lower extrinsic mortality suffer a
26 The American Naturalist
higher proportion of senescent deaths. This result is in- and Houston 1996). However, reproductive output typi-cally does not increase in old age in organisms having aconsistent with genetic models of senescence based on
mutation accumulation and certain types of antagonistic fixed adult size and is often observed to decline instead(e.g., birds and mammals: Newton 1989a; Forslund andpleiotropy, and it suggests instead that the pattern of se-
nescence balances somatic wear and tear against mainte- Part 1995; Holmes and Austad 1995a). Twenty-five re-ported patterns of avian senescence in natural popula-nance and repair mechanisms whose efficacy is under ge-
netic control. tions (19 species; Holmes and Austad 1995a, table 1, ex-cluding three zoo populations) included 13 cases ofactuarial senescence, seven cases of reproductive senes-cence, three cases of apparent physiological decline, andAnalysis and Interpretation of Mortality Dataonly two cases of apparent increase in reproductive suc-
The exact form of the relationship between relativecess at old age (for the last, see Wooller et al. 1989;
strength of selection and age depends on how geneticPugesek and Diem 1990). It is therefore unlikely that ac-
factors influence age-specific values of mortality and fe-tuarial senescence results directly or solely from higher
cundity (Abrams 1991; Abrams and Ludwig 1995). In ainvestment in reproduction.
hypothetical nonsenescing population (age-independentThere is little direct evidence from natural populations
adult mortality and fecundity), genes that turn on atfor physiological decline in function of adult birds with
adult age x and have a continued influence on mortalityincreasing age, although laboratory mammals and, to a
rate m for the rest of the individual’s life influence fitnesslesser extent, domesticated birds have been thoroughly
(the intrinsic exponential growth rate of the population,characterized in this respect (see references in Finch
r) according to1990; Holmes and Austad 1995a). Domestic fowl andJapanese quail exhibit decreased function of the repro-∂r
∂m5 2
1
(b 1 1)x, (1) ductive tract with age (Ottinger 1991), but these species
are strongly selected for early egg laying and may nolonger provide useful models for natural populations.where b is the rate of fecundity (Abrams 1991). Thus, the
strength of selection on genetic factors that cause a given A. P. Møller and F. de Lope (unpublished manuscript)have demonstrated decreases with age in the size of sexu-change in adult mortality rate declines rapidly with in-
creasing age, especially in populations with high fecun- ally selected characters, developmental stability, migra-tion characteristics, reproductive performance, and abil-dity.
As it is defined in this article, senescence refers to an ity to control infestations of ectoparasites in the barnswallow Hirundo rustica. These results support a directincrease in adult mortality rate with age associated with
progressive physiological decline. The relationship be- relationship between increasing mortality rate and de-clining physiological condition in this species. Other spe-tween mortality and age is sometimes called actuarial se-
nescence (Holmes and Austad 1995a) to distinguish de- cies kept in zoos, and several natural populations ofbirds, exhibit declining reproductive performance withmographic and physiological manifestations of aging. In
order to interpret analyses of life-table data, one must as- age (Clum 1995; Holmes and Austad 1995b; Ottinger etal. 1995).sume that actuarial senescence is related to decline in
physiological function. Theoretical studies have shown Abrams (1993) showed how the relationship betweenextrinsic adult mortality rate and senescence can be af-that factors other than senescence may cause mortality to
increase with age (Abrams 1993; Blarer et al. 1995; fected by the pattern of density-dependent effects on age-specific values of survival and fecundity in a population.McNamara and Houston 1996). When the expectation of
future reproduction declines with age, an optimized life An important result is that when density feedbacks re-sulting from change in adult survival influence fecun-history may include increased reproductive effort late in
life, which in turn may cause mortality to increase (Tay- dity independently of age or when they influence juve-nile survival or both (generally, recruitment), the rate oflor et al. 1974; Pianka and Parker 1975; Charlesworth
and Leon 1976; Blarer et al. 1995). For organisms that senescent mortality at any given age—hence, the rate ofsenescence—will be directly related to extrinsic adultlive more than 1 yr, this model presupposes some senes-
cence-like process that causes reduced expectation of fu- mortality. A decrease in the rate of senescent mortalitywith increasing age will be favored when density mainlyture reproduction with age, and thus it cannot be used to
argue against physiological decline being responsible for affects survival or fecundity late in life. That is, when re-duced extrinsic mortality leads to an increase in popula-increasing mortality rate with age. Reproductive effort
may also increase when size or condition increases with tion size, older age classes increase disproportionately,which increases the relative strength of selection on ge-age, and this may lead to higher mortality (McNamara

Rate of Aging in Birds and Mammals 27
netic factors expressed in old age. This model presup- sumption concerning the interaction between extrinsicmortality and senescence reduces the evolutionary influ-poses senescence in the population and also that senes-
cent individuals are most adversely affected by crowding. ence of increased extrinsic mortality on rate of senes-cence because rate of senescent mortality responds phe-Abrams (1993) also pointed out that higher mortality can
select for decreased senescent mortality when a senescent notypically to variation in extrinsic mortality and thereforethe proportion of senescence-related deaths in the popula-trait increases the vulnerability of an individual to a par-
ticular mortality factor. For example, declining physio- tion does not change. Indeed, Promislow (1991), in his com-parison of age-dependent mortality rates in mammals,logical function may impair an individual’s ability to es-
cape predators or survive severe weather. In this case, found that the value of the exponential ‘‘aging’’ parameterγ was statistically uncorrelated with the estimated extrinsicmore powerful mortality factors tend to increase the
strength of selection against senescence, thereby tending mortality. As a result, Promislow concluded that rate ofaging was independent of initial mortality rate. Of course,to obscure a relationship between extrinsic adult mortal-
ity and rate of senescence. in comparisons having constant γ, senescent mortality (mx
at any given age) actually increases in direct proportion toIn birds and mammals, therefore, a relationship be-tween rate of senescence and extrinsic adult mortality m0. Hence, the Gompertz parameter γ is not, by itself, an
informative measure of absolute mortality resulting fromwould support a population model of the evolutionarymodification of senescence in which density dependence actuarial senescence.
Alternatively, aging-related mortality may be caused byfalls most heavily on prereproductive individuals and inwhich vulnerability to extrinsic mortality factors is factors different from those that affect young adults (e.g.,
degenerative disease, reduced resistance to infections, tu-mostly independent of the aging-related physiologicalstate of the organism. The exact form of the relationship mors), in which case initial (extrinsic) mortality and
aging-related (intrinsic) mortality should add together tobetween mortality and age, and of the relationship be-tween rate of increase in age-specific mortality and ex- give the total at any particular age, and they should be
computationally independent. The Makeham modifica-trinsic mortality, cannot be predicted without knowinghow genetic factors influence fitness. However, failure to tion of the Gompertz equation partitions mortality into
separate terms for initial and aging mortality, that is,find a direct relationship between rate of senescent mor-tality and extrinsic mortality rate (Promislow 1991) mx 5 m0 1 aeγx (Gavrilov and Gavrilova 1991; Wilson
1994). However, because the aging term is exponential,would require a reevaluation of the demographic con-texts of both the evolutionary modification of aging and the initial mortality rate (x 5 0) is now m0 1 a, and ac-
tuarial aging is still expressed as an age-dependent multi-the evolutionary optimization of reproductive invest-ment. ple of a portion of the initial mortality rate.
The Weibull equation mx 5 m0 1 αxβ separates theinitial mortality and aging terms computationally andMethodscharacterizes aging-related mortality by two parameters,
Models of Aging-Related Parametersone (β [dimensionless]) controlling shape and the other(α [time2(β11)]), magnitude for a given shape. The vari-Several mathematical models are commonly used to
characterize the consequences of senescence for mortality able ω, which equals α1/(β11) [time21], provides a shape-adjusted index to the rate of aging that is comparable torates in populations (Gavrilov and Gavrilova 1991; Wil-
son 1994). These relate mortality rate at age x (mx [di- parameter γ of the Gompertz equation but portrays therate of aging independently of the initial mortality rate.mension: time21]), to initial mortality rate at age 0 (m0
[time21]) by one or more ‘‘aging’’ parameters. The In both Gompertz and Weibull models, rate of mortal-ity continues to increase, at an accelerating rate, with in-Gompertz equation (Mueller et al. 1995) describes an ex-
ponential increase in mortality rate with age at rate γ creasing age. Empirical studies of large populations offlies and humans have shown, however, that a plateau in(time21), that is, mx 5 m0eγx. Rate of aging has been
compared among populations by the parameter γ and by mortality rate may be reached in extremely old age(Carey et al. 1992; Fukui et al. 1993, 1996). Mueller andthe derived mortality rate doubling time (MRDT [time]
5 loge2/γ) (Finch 1990). To interpret the Gompertz pa- Rose (1996) have suggested that this occurs because theforce of selection at extreme old age becomes signifi-rameter as an index to the rate of aging, one implicitly
assumes that physiological senescence increases the vul- cantly less than forces of mutation and drift, which areindependent of age. However, the point at which selec-nerability of individuals to the same mortality factors
that kill young adults; mortality is a multiple (eγx) of the tively responsive senescence leaves off is attained by onlya small fraction of a population and is mostly beyond theinitial rate (m0), which grows exponentially with age. Ac-
cording to Abrams’s (1993) theoretical results, this as- reach of the samples compared here or in any study of

28 The American Naturalist
natural populations of vertebrates. Thus, conventionalmodels of senescence are appropriate for this analysis.
Choice of Aging Model
Which aging model is appropriate depends on both sta-tistical and biological considerations. Statistically, it isimportant that estimates of extrinsic mortality and agingparameters are independent. For the Gompertz equation,m0 and γ are not independently estimated. Variation indata that result in a higher estimate of one parameter re-sult in a lower estimate of the other. This is why Promis-low (1991) estimated extrinsic mortality (µ) indepen-dently from survival curves. For the Weibull equation,estimates of α and β are highly intercorrelated, but these
Figure 1: Survival curves for five species of bird in the Londonare relatively independent of m0. For example, in maxi-Zoo. Data from Comfort (1962). See table 1 for fitted parame-mum likelihood estimates of aging parameters for femaleters of Weibull equations.pied flycatchers and male Dall sheep (see below), the as-
ymptotic correlations for estimates of m0 and γ were20.91 and 20.97, respectively. For the Weibull equation, as a whole (see below), estimates of m0 for all five speciesasymptotic correlations between α and β were 20.99 in varied from 0 to 0.11 yr21 and estimates of ω varied be-both cases, but correlations between these parameters tween 0.09 and 0.21 yr21 (table 1). None of the speciesand m0 averaged 20.69 and 20.55, respectively. included in this sample is well known in nature, but ini-
The more important consideration concerning a tial mortality rates are likely to exceed 0.10, for which ωchoice of aging model is whether the effects of senescence estimated from the observed relationship between ω andon mortality multiply (Gompertz), or add to (Weibull), m0 in figure 6 below is 0.12 yr21. North American black-the initial mortality rate. One way to distinguish between crowned night herons (N. nycticorax) have adult mortal-the assumption of factorial increase and that of incre- ity rates of m 5 0.27 (Henny 1972), for which estimatedmental increase would be to manipulate the initial mor- ω is 0.17 yr21. A natural population of ring-neckedtality rate experienced by a population and estimate the pheasant (Phasianus colchicus) in Denmark had a value ofaging-related mortality (Promislow 1991). The Gompertz m 5 0.88 (Cramp 1980; the zoo population of Reeve’smodel would be implied by a proportional response of pheasant Syrmaticus reevesi, had m0 5 0.011), for whichmx to m0, and the Weibull model would be implied by estimated ω is 0.27 yr21. Thus, aging-related mortality inindependence between the two. This ‘‘experiment’’ is zoo populations (ω 5 0.156 6 0.019 SE, n 5 5) is simi-conducted inadvertently with captive populations that lar to that observed in the wild (ω 5 0.160 6 0.018 SE,are removed from natural sources of extrinsic mortality. n 5 18; app. A, table A1) and therefore appears to be in-To take advantage of this circumstance, Weibull equa- sensitive to experimental manipulation of m0. In con-tions of the form trast, Gompertz equations of the form
lx 5 exp12m0x 2αxβ11
β 1 12 , (2) lx 5 exp12m0
γ[eγx 2 1]2 (3)
fitted to the London zoo data yielded initial mortalitywhere lx is the proportion of the population surviving toage x, were fitted to survival data for five species of bird rates of 0.003–0.07 yr21 and mortality rate doubling
times of 0.09–0.27 yr (1–3 mo). These MRDTs are morein the London Zoo (Comfort 1962; fig. 1). Initial mortal-ity rates (m0) for these captive populations (table 1) were than an order of magnitude lower than values estimated
for natural populations of birds (Finch 1990) because oflower by one to two orders of magnitude than values innatural populations of comparable species. In two cases, the low initial mortality rates of captive populations. In
contrast, Weibull aging parameters (ω) calculated for zooit was possible to estimate values for β, which were 2.4(Pavo cristatus) and 2.0 (Nycticorax nycticorax); these fits populations are consistent with initial mortality rates of
natural populations. Thus, the Weibull function is ayielded m0 5 0.11 (0.01 SE) yr21 and 0.024 (0.010 SE)yr21, and ω 5 0.19 yr21 and 0.10 yr21, respectively. When more appropriate model than the Gompertz function
for describing aging-related mortality. Patterns of agingβ was fixed at 3.0, which is close to the average for birds

Rate of Aging in Birds and Mammals 29
Table 1: Parameters of the Weibull equation fitted to survival curves of five species in theLondon Zoo
Species N m0(SE) α(SE) ω
Pea fowl Pavo cristatis 80 .111 (.007) 1.1E23 (.8E23) .181Reeves pheasant Syrmaticus reevesi 107 .011 (.009) 1.8E23 (.3E23) .205Brush turkey Alectura lathami 34 .019 (.007) 6.0E24 (.4E24) .155Sacred ibis Threskiornis aethiopicus 30 .000 (.000) 5.2E23 (.4E23) .151Night heron Nycticorax nycticorax 44 .024 (.009) 6.6E25 (1.0E25) .090
Note: Shape parameter of Weibull function (β) fixed at 3; N 5 number of individuals; m0 5 initial mortal-ity rate (yr21); α 5 scale parameter of Weibull function; ω 5 Weibull aging parameter (yr21). Data from Com-fort (1962).
in zoo populations of birds would appear to reject one the estimation of extrinsic mortality rate. First, fitted pa-rameter values for m0 are compared to the pattern ofof the conditions cited by Abrams (1993; senescence-
dependent expression of extrinsic mortality factors) as age-specific mortality rate exhibited by the data. Whenm0 was similar to mortality rates of young adult agereducing the evolutionary relationship of rate of senes-
cence on extrinsic adult mortality. Therefore, we can as- classes, it was accepted as an estimate of extrinsic mortal-ity rate. When m0 differed substantially (usually beingsume that senescence is associated with unique mortality
factors related to physiological deterioration, which cause too low, even negative), I calculated the average mortalityrate of adults over age classes showing a low and rela-an increase in mortality with age independently of ex-
trinsic mortality. tively constant mortality rate (me). Handling of data inparticular cases is explained in appendix A.
In his analysis of mammalian life tables, PromislowEstimation of Extrinsic Mortality
(1991) estimated extrinsic mortality rate as the instanta-neous rate of mortality at the age of maturity (µ). ThisThe extrinsic mortality of a population may be defined
operationally as the minimum mortality exhibited by an was calculated by fitting a third-order polynomial curveto the log-transformed survival curve and evaluating theadult age class. In birds and mammals, mortality rates
typically decrease dramatically between independence slope of the curve at the age of maturity. For 12 mamma-lian data sets for which I accepted m0 as an estimate ofand sexual maturity and often continue to decrease for
some period after the onset of reproduction (e.g., New- extrinsic mortality rate, m0 was highly correlated withPromislow’s µ (log-transformed values: r 5 0.79, P 5ton and Rothery 1997). Thus, the age-specific pattern of
mortality includes both increasing mortality with age due .0024; rs 5 0.79, P 5 .0023). In a regression of m0 on µ,the intercept did not differ significantly from 0 (0.14to senescence and decreasing mortality with age associ-
ated with size and experience (Sæther 1990; Forslund and [0.26 SE]) and the slope did not differ significantly from1 (1.15 [0.28 SE]). Thus, estimates of m0 and µ were sim-Larsson 1992; Forslund and Part 1995). Because the latter
is not incorporated into mathematical models of aging, ilar in these cases. For 11 mammalian data sets for whichI estimated extrinsic mortality by the mortality rates ofthe value of m0 is not strictly an estimate of extrinsic
mortality. When the effects of senescence on mortality do young adults, my estimate and Promislow’s µ were notsignificantly correlated (r 5 0.48, P 5 .13; rs 5 0.60,not begin to increase dramatically until well after the
benefits of experience have leveled off, adult mortality P 5 .051). This sample included primarily species withlow extrinsic mortality, and µ for these species (log10should exhibit a broad valley over which mortality rate is
low and does not change rapidly with respect to age. This units, 21.39 6 0.77 SD) was much more variable thanme (21.08 6 .36 SD). Unlike µ, the estimate of me is notminimum mortality rate should be close to the extrinsic
mortality of the population. In addition, under these cir- influenced by mortality outside of young adult age classesand may be more representative for that reason.cumstances values of m0 obtained by fitting aging equa-
tions to data should also estimate extrinsic mortality rea-sonably well. This is because a period of constant
Parameter Estimationmortality rate through young adulthood establishes alower asymptote for mortality rate, which extrapolates Much has been written about estimating the parameters
of survival models (e.g., Eakin et al. 1995; Mueller et al.with little change to age 0 (see, e.g., fig. 4).In this analysis, I have taken a two-tiered approach to 1995; Nichols et al. 1997). Approaches generally involve

30 The American Naturalist
Table 2: Estimates of coefficients of Weibull functions fitted to the relationship between mortality rate and age in naturalpopulations of birds and mammals
m0 α βAge Reference
Species Sex groups Coefficient SE Coefficient SE Coefficient SE ω notes
Birds:Larus canus MF 13 .097 .021 3.32E25 .00E25 2.96 1.08 .074 2Puffinus tenuirostris MF 13 .051 .035 2.28E23 6.13E23 1.34 .81 .074 6Diomedia exulans MF 4 .013 .000 6.64E25 1.34E25 2.01 .00 .041 7Ficedula hypoleuca F 7 .664 .032 2.35E23 1.64E23 3.14 .36 .232 8F. hypoleuca M 7 .778 .045 1.35E23 1.42E23 3.47 .54 .228 8Parus major F 6 .043 .162 .60E23 2.67E23 3.80 2.25 .213 9Turdoides squamiceps F 5 .183 .211 .62E21 1.55E21 1.18 1.31 .279 11T. squamiceps M 6 .115 .031 .84E23 1.68E23 3.39 1.10 .199 11Passerina cyanea Reserve M 5 .437 .041 3.69E23 5.24E23 2.59 .76 .210 12
Mammals:Hippopotamus amphibius MF 12 .000 .00 1.21E27 .12E27 4.00 .00 .041 9Ovis dalli M 11 .043 .00 3.11E26 .59E26 5.35 .08 .136 16
Note: Table includes only those studies for which nonlinear curve fitting converged to a solution. For references and notes, see appendix A,table A2 for birds and table A1 for mammals.
a trade-off between the number of parameters and other fixing the value of β on estimates of the rate of actuarialsenescence (ω) is illustrated in figure 2. In fact, ω iseffects in a model and ability to estimate parameters ac-
curately. In general, maximum likelihood approaches are rather insensitive to the value of β chosen for nonlinearcurve fitting, and values of ω for parameter estimatespreferred to linear and nonlinear regression (Petersen
1986; Mueller et al. 1995), although sample sizes in stud- with β free and β fixed are strongly correlated (fig. 3).ies of natural populations are often so small that maxi-mum likelihood approaches may not converge on stable Datasolutions. Following the application of several estimation
Field Studiesprocedures to a few data sets and the recovery of param-eter values from simulated data (app. B), I ended up by Most studies of demography in mammal populations are
based on collections of the remains of individuals whosefitting Weibull functions to the relationship betweenmortality rate (mx) and age (x) by unweighted nonlinear ages are estimated from size, tooth wear, and other mor-
phological indices (Caughley 1977). The resulting tabula-regression (Procedure NLIN of SAS; SAS Institute 1985).This approach performs best with small sample sizes and tion of ages at death is then converted to a survivorship
table, from which age-specific survival rates are calcu-does not require information on the numbers of individ-uals per age class, which are not given in many published lated. In this study, survival rates were converted to in-
stantaneous mortality rates (m 5 2logeS), which werestudies. Thus, unweighted nonlinear least squares per-mitted the estimation of parameters from the largest then fitted by Weibull functions to the relationship be-
tween mx and age. Most life tables of bird populationsnumber of data sets and introduced little bias comparedto differences between species. are obtained from local, longitudinal studies of individu-
als marked in the year of birth, from time-specific sur-I calculated mx as the instantaneous (exponential)mortality rate—that is, the negative of the natural loga- vival rates in a population of known-age birds, or from
a combination of these two approaches (Newton 1989a;rithm of the proportion of individuals surviving over aunit interval of time (1 yr). The quality of the life tables LeBreton et al. 1992). Age-specific annual survival is esti-
mated directly from the persistence of known-age indi-for natural populations of mammals were poor com-pared with those of birds (see below), and the Weibull viduals in the population. Survival data from such studies
were converted to instantaneous mortality rates for fit-parameters α and β could not be estimated simulta-neously by nonlinear curve fitting in most cases. These ting with Weibull functions.
Data on age-specific survival rates were obtained pri-data were then fitted (Procedure NLIN of SAS) by Wei-bull equations with β 5 3, which is approximately the marily from sources listed in (Promislow 1991) for mam-
mals (app. A; table A2), and from (Newton 1989a) andaverage value among birds (see table 2). The effect of

Rate of Aging in Birds and Mammals 31
sources listed in (Holmes and Austad 1995b) for birds(app. A, table A1). Data for males and females, whenpresented separately, were considered as independent es-timates of aging parameters. Studies on mammals wereincluded only if they revealed a significant increase inmortality rate with age in Promislow’s analysis. This se-lection criterion presumes that studies failed to show asenescent pattern of age-specific mortality rate because ofinadequate sampling either of ages or of number of indi-viduals. In Promislow’s (1991) sample of 56 mammaldata sets, half showed significant (P , .05) actuarial se-nescence. Of these, 22 out of 28 were represented byeight or more age classes. Of the 28 nonsignificant datasets, 18 included fewer than eight age classes. Further-more, mammalian life tables constructed by sampling theage structure or the distribution of ages at death in apopulation are less likely to reveal actuarial senescencethan are age-specific survival data because the variance inFigure 2: Sensitivity of the Weibull aging parameter (ω) to vari-
ation in the value of β used in fitting the Weibull model to the the estimate of mortality at a particular age is greater.increase in mortality rate with age, using data for the pied fly- These considerations, and the simulations presented incatcher (Ficedula hypoleuca) and the short-tailed shearwater appendix B, emphasize that parameter estimates from(Puffinus tenuirostris). Arrows indicate the fitted values of β small data sets must be interpreted cautiously. For thiswhen it is retained as a free parameter. reason, several analyses in this study were run both with
the entire data set and with species represented by smallsamples deleted.
Most of the reported data were accepted at face value,although age-specific mortality rates were recalculated insome cases. Higher mortality rates reported for youngerage classes (e.g., Newton and Rothery 1997), which ex-press lack of maturity or experience (Forslund and Lar-sson 1992; Forslund and Part 1995; Sæther 1990), weredeleted from the analyses.
Phylogenetic Comparisons
In comparative studies, phylogenetic relationship amongtaxa may influence the statistical interpretation of corre-lations and regressions among traits and has beenclaimed to produce biased or spurious results in somecases (Harvey and Pagel 1991). I have not applied phylo-genetically corrected methods to this analysis becausecomparisons of statistics based on phylogenetically inde-pendent contrasts (PIC) and species data generally donot differ; calculation of PICs introduces its own sourcesof error to the data and embodies restrictive assump-tions; and phylogenetic relationships, especially for mam-mals, are not well resolved (Ricklefs and Starck 1996).Among mammals, the 27 samples of life tables reportedin appendix A, table A2, are drawn from 13 families be-Figure 3: Relationship between the Weibull aging parameterlonging to seven orders (authority for taxonomy: Wilson(ω) when it is calculated from fitted Weibull equations with βand Reeder 1993).as a free parameter compared with β as a fixed parameter with
Among birds, the 18 life tables analyzed (app. A, tablea value of 3. Solid symbols represent species of bird; open sym-bols, species of mammal. A1) belong to 12 species in nine families (authority for

32 The American Naturalist
taxonomy: Monroe and Sibley 1993). However, taxa withrapid aging (ω . 0.15) were all Passeriformes except forthe European sparrowhawk (Accipiter nisus: Ciconii-formes). Taxa with delayed aging were either Anseri-formes or Ciconiiformes. Thus, there appears to be astrong taxonomic association to rate of aging, but this isassociated with similar taxonomic patterns in body massand initial mortality rate. The most compelling argumentagainst a strong phylogenetic component to rate of agingis the parallel patterns and similar ranges of variation inbirds and mammals. Potential problems for statistical in-ference of phylogenetic relationship are addressed in partby estimating the minimum degrees of freedom thatwould support statistical significance of a particular rela-tionship.
Results
Figure 5: Relationship of the shape constant (β) of the WeibullThe fit of a Weibull equation to age-specific mortalityequation to initial mortality rate (m0) in seven species of bird
rates of female pied flycatchers (Ficedula hypoleuca: Mus-(table 2). The vertical and horizontal lines are 61 SE of the es-
cicapidae) is shown in figure 4. In this example, the timate. The regression has the equation β 5 2.2 (0.4 SE) 1 1.9shape parameter β is 3.14 6 0.36 SE, and the rate of (0.7 SE) m0 (F 5 7.7, df 5 1, 7, P 5 .028, R2 5 0.52; nonpara-aging-related increase in mortality, ω, is 0.00235 0.24 5 metric rs 5 0.64, P 5 .035). Sexes are combined for five of the0.23 yr21. Weibull shape constants, which could be esti- species and separated for two of them; when the denominatormated for seven species of bird, tended to increase with degrees of freedom are reduced by two to account for two spe-
cies with values for both males and females, .025 , P , .05;increasing initial mortality rate but not markedly so (fig.the average of β is 3.1. When values of β for the two species5). For these species, the logarithmic relationship be-of mammals in table 2 are added to the statistical analysis, thetween ω and m0 was significant (F 5 18, df 5 1, 7, P 5relationship between β and m0 becomes insignificant (F 5 0.8,.0037, R2 5 0.72; rs 5 0.76, P 5 .017); the regression isdf 5 1, 9, P 5 .4).described by log10(ω) 5 20.55 (0.09 SE) 1 0.40 (0.09
SE) log10(m0). When the number of degrees of freedomwas reduced by two to account for two species in which males and females were analyzed separately, the F test
had a significance value of P , .005, and Spearman’srank correlation (rs), P , .05. When the two species ofmammals for which β could be estimated were addedto the regression analysis, the regression equation islog10(ω) 5 20.54 (0.10 SE) 1 0.41 (0.09 SE) log10(m0)(F 5 20, df 5 1, 9, P 5 .0015, R2 5 0.69; rs 5 0.84, P 5.0012); reducing the degrees of freedom by two changedthe P values to ,.005 and ,.01, respectively. These re-sults are consistent with predictions of evolutionarymodels of aging. However, nonlinear regression algo-rithms failed to converge on stable solutions when ap-plied to many data sets, and so it was not possible toestimate β for some birds and most mammals. Conse-quently, rate of senescence was further compared by esti-mating α and ω under the assumption that β 5 3, whichis approximately the average value for birds in table 2.Because the fitted value of α is strongly inversely corre-
Figure 4: Relationship of mortality rate (mx) to age in femalelated with the estimated value of β for a given set of data,pied flycatchers (Ficedula hypoleuca), with fitted Gompertzfixing β results in a shape-adjusted estimate of the rate of(dashed line) and Weibull (solid line) aging models. The Wei-increase in mortality with age (ω) that is relatively insen-bull equation is mx 5 0.664 1 0.00235x3.467. The Gompertzsitive to variation in β over the range observed in thisequation is mx 5 0.440e0.187x. Vertical bars are 61 SE of the
mean. Data from Sternberg (1989). study (see fig. 2).

Rate of Aging in Birds and Mammals 33
freedom could drop to as low as 7 and still have a sig-nificance level of P , .001.
When values for males and females were averaged, thenumber of observations (species) decreased to 30, but therelationship between log10ω and log10m0 remained strong(F 5 34, df 5 1, 28, P , .001, R2 5 0.55); the slope ofthe regression increased to 0.441 (60.076 SE). When theanalysis included only data sets with .100 individuals(32 data sets), the results were qualitatively identical, andthe relationship between log10ω and log10m0 was basicallyunchanged (F 5 32.5, df 5 1, 30, P , .0001, R2 5 0.52),with a regression slope of 0.41 (60.07 SE). Reducing theanalysis to data sets with .200 individuals (18 data sets)further confirmed this result: regression of log10ω onlog10m0 (F 5 46.0, df 5 1, 16, P , .0001, R2 5 0.74);intercept 20.512 (60.059 SE); slope 0.410 (60.060 SE).Figure 6: Relationship between rate of senescence (ω of theThese results confirm, for mammals and birds, the fun-Weibull equation, when β 5 3) and initial mortality rate indamental prediction of evolutionary theories of aging.populations of birds (solid circles) and mammals (open circles).
Data from captive populations in the London Zoo are indicatedby open triangles; m0 is the value estimated from the zoo data
Proportion of Senescent Deathsand does not refer to natural extrinsic mortality.
Senescence is an important source of mortality in naturalpopulations, particularly those with low initial mortality
At a given body mass, rate of senescence (ω) varied rates. The impact of senescence may be estimated fromover an order of magnitude. Furthermore, ω increased in the proportion of deaths in a population that can be at-both birds and mammals in direct relation to initial tributed to aging-related causes (PS). For the Weibullmortality rate (fig. 6), independently of body mass. An model, this proportion isANCOVA revealed that rate of aging (ω) decreased
PS 5 #∞
x50αxβlx dx , (4)with respect to increasing mass, specifically with mass
raised to the 20.17 (60.04 SE) power, and was 0.39 log10
where probability of survival to age x(lx) isunits (2.4-fold) lower in birds than in mammals of simi-lar mass (F 5 10.6, df 5 2, 40, P , .0002, R2 5 0.35; lx 5 e2{m0x1[α/(β11)]xβ11} . (5)interaction term F 5 1.2, df 5 1, 39, P 5 .28, NS). How-ever, m0 also decreased with increasing mass, specifically For predicted values of α (5 ωβ11) at empirically deter-with mass raised to the 20.39 (60.05 SE) power, and m0 mined values of m0 (assuming β 5 3) observed in birdswas 0.69 (60.15 SE) log10 units (4.9-fold) lower in birds and mammals (fig. 6), the maximum fraction of senes-than in mammals of comparable size (F 5 43.4, df 5 cent deaths (PS) varies from 79% at m0 5 0.01 yr21 to less2, 40, P , .0001, R2 5 0.68; interaction F 5 4.8, df 5 than 3% at m0 5 1.0 yr21 (table 3). For analyses in which1, 39, P 5 .034, marginally significant and deleted). The β was a free parameter (table 2), the relationship betweenrelationship of ω to m0 turned out to be independent PS and m0 is shown in figure 7. The best model relatesof body mass. In a multiple logarithmic regression relat- the logarithm of PS to m0 by the equation log10PS 5ing ω to m0 and body mass (M), both the m0 3 M inter- 20.20 (60.06 SE) 2 1.85 (60.13 SE) m0(F 5 212, df 5action (F 5 0.1, df 5 1, 39, P 5 .77) and M (F 5 0.43, 1, 9, P 5 , .0001, R2 5 0.96). Another way to assess thedf 5 1, 40, P 5 .52) were insignificant effects. When impact of senescence is to compare the average life spanbirds and mammals were distinguished as a main effect (T) of adult individuals in natural populations to that in(TAXON) in this analysis, neither the m0 3 TAXON in- hypothetical nonaging populations (T 5 1/m0). For theteraction (F 5 0.7, df 5 1, 39, P 5 .40) nor TAXON it- Weibull model of aging, the average life span isself (F 5 1.4, df 5 1, 40, P 5 .25) was significant. Rate
T 5 #∞
x50e2{m0x1[α/(β11)]xβ11}dx . (6)of senescence ω was directly related to initial mortality
rate m0 (F 5 31.2, df 5 1, 41, P , .0001, R2 5 .43) bythe equation log10ω 5 20.531 (60.074 SE) 1 0.367 Senescence reduces average life span by only 2% when
m0 5 1.0 yr21 but by almost 80% when m0 5 0.01 yr21(60.066 SE) log10m0. Thus, rate of senescence in thissample increased as the approximately 3/8 or 1/3 power of (table 3 and fig. 8). These comparisons suggest that se-
nescence should be easier to detect in populations of rel-m0. With an F value of 31, the denominator degrees of

34 The American Naturalist
Table 3: Proportion of senescence-related deaths (PS) and average life span (T)in populations with different initial mortality rates (m0)
Average life span (T)
% senescent %m0(yr21) α ω(yr21) death (PS) Years nonsenescent
.01 7.8E26 .053 78.6 21.4 21.4
.02 2.1E25 .068 69.0 15.5 31.0
.05 8.2E25 .095 51.9 9.6 48.2
.10 2.2E24 .122 36.6 6.4 63.7
.20 6.2E24 .158 19.5 3.9 78.9
.50 2.4E23 .220 7.6 1.86 92.91.00 6.5E23 .284 2.4 .98 98.1
Note: Values of α and ω are those predicted by the regression equation relating α tom0 with β 5 3 (see fig. 6).
atively long-lived individuals provided that studies on Discussionsuch populations are long enough to include large num-
For a particular intrinsically determined schedule of se-bers of old individuals. Indeed, this result clears up an
nescent mortality defined by α and β, the proportion ofenigma evident in the data of Botkin and Miller (1974).
deaths resulting from aging would increase if initial ex-These authors compared maximum observed longevities
trinsic mortality were to decrease. In response to such in-with predicted longevity in a population of a particular
creasing selection resulting from factors that cause aging-size and age-independent (nonsenescent) mortality rate.
related deaths, populations should evolve modificationsThey found reasonable correspondence between observed
that reduce senescent mortality at a given age, resultingand predicted values in species with high adult mortality
in lower α, β, or both. The results of this analysis sug-rates, which is consistent with little senescent death.
gest, however, that although such evolutionary responsesIn species with low adult mortality, however, observed
do occur, they are not sufficient to offset fully the largermaximum life spans were far short of the nonsenescent
proportions of individuals that survive to old age andprediction, suggesting that mortality rate increased in
suffer deaths hastened by physiological decline. As a re-old age.
sult, a larger proportion of individuals succumbs to fac-tors related to physiological aging in populations witholder age distributions. The inability of evolutionary re-
Figure 7: Relationship between the proportion of mortalitycaused by senescence (PS) and the initial mortality rate (m0) in Figure 8: Fractional change in the average life span (T) of indi-
viduals in a population resulting from a 10-fold increase or de-a population for samples in which Weibull equations were fit-ted with β as a free parameter (table 2). Solid symbols represent crease in the value of α (1.8-fold change in ω) when β 5 3 and
values of α are determined by the regression in figure 6.species of bird; open symbols, species of mammal.

Rate of Aging in Birds and Mammals 35
sponses to fully remedy high proportions of senescent ronmental factors and use (wear and tear), with variationin rate of senescence among populations and species be-mortality could be due to (1) weaker relative strength of
selection to retard senescence at lower initial mortality ing modified by genetically controlled preventive and re-pair mechanisms (Kirkwood and Holliday 1979; Kirk-rates, which clearly is false, (2) increased costs of delay-
ing senescence at progressively older ages, which would wood 1990). The last type of mechanism, often referredto as the ‘‘disposable soma’’ theory of aging, creates anbe considered as an expression of negative antagonistic
pleiotropy, or (3) lack of suitable genetic variation to en- apparent antagonistic pleiotropy when such mechanismsimpose costs that reduce the fecundity or survival ofhance mechanisms that reduce senescence at extreme old
age, that is, a physiological constraint. As pointed out by young individuals.Mutations with deleterious effects at old age (mecha-Mueller and Rose (1996), at some point selection be-
comes weaker than the forces of mutation and genetic nism a) are removed by selection in proportion to thevariance in fitness that they produce within populations.drift and adaptive evolutionary responses cease (mecha-
nism 4). However, this point occurs well after 99% of in- In mutation-selection models, evolutionary equilibria areachieved that balance the rates of mutation and selectivedividuals in a population have died, and the mechanism
therefore is not relevant to mechanisms of senescent removal of mutants (Ewens 1979; Charlesworth 1994).Thus, unless the rate of appearance of new mutants in-death occurring up to this point.
The strength of selection on changes in rate of senes- creased (i.e., more loci expressed or higher mutationrates) as a function of age of expression or in populationscence (α) can be estimated from the effect of such
changes on fitness. In the absence of information on the with older age structures, the total fitness consequence ofsenescence should be similar for all populations regard-age-specific schedule of fecundity, a relative measure of
fitness, which assumes stable population size and con- less of age structure. This clearly is not the case becausethe proportion of senescence-related deaths is greater instant fecundity with respect to age, is the average life
span (T) of individuals in a population. For m0 5 0.01 populations having average age of individuals. Someform of antagonistic pleiotropy is thus implicated in theand α 5 7.8 3 1026, T 5 21.3 yr. Decreasing and in-
creasing α by a factor of 10 (equivalently, ω by a factor evolutionary modification of aging in birds and mam-mals.of 1.8 when β 5 3) changes T by 162% and 241%, re-
spectively. For m0 5 0.1 and α 5 2.2 3 1024 (T 5 6.4 According to hypothesis b, genes that accelerate agingmust confer commensurate fitness benefits early in life.yr), changing α by factors of 0.1 and 10 alters T by
129% and 231%; for m0 5 1.0 and α 5 6.5 3 1023 Because populations with older age structure suffer pro-portionately more deaths from aging-related causes than(T 5 1.0 yr), these values are 12% and 29% (fig. 8).
Thus, the change in life span that would be associated do populations with younger age structure, the total ben-efit conferred by antagonistically pleiotropic genes earlywith comparable factorial changes in the rate of senes-
cence (α) is larger for populations with lower initial in life would have to be greater in populations with oldercompared with younger age structures. Few plausiblemortality rates. Accordingly, populations with lower ini-
tial mortality rates experience potentially stronger selec- candidates for antagonistically pleiotropic genes havebeen recognized, and the physiological mechanisms con-tion to further postpone senescence than do populations
with higher initial mortality rates, contrary to proposi- necting opposing early and late effects on fitness are notwell characterized (Rose 1991; Ricklefs and Finch 1995;tion 1 above. This implies that delaying senescence is
more difficult to accomplish at older than at younger Tatar et al. 1996). Furthermore, there is no reason to sus-pect that the earlier beneficial effects of antagonisticallyages and that either the costs for greatly extending natu-
ral life span are prohibitive (proposition 2) or the possi- pleiotropic genes should increase consistently with in-creasing age of expression of their later deleterious ef-bilities for doing so regardless of cost (proposition 3) are
severely limited. fects. Thus, the observation reported here of increasingsenescence-related mortality in populations with progres-This apparent constraint on the evolutionary response
sheds some light on the genetic bases of variation among sively older age structure (lower initial mortality rate, m0)weighs against two popular hypotheses (mutation accu-species in rate of senescence. Senescence is generally
thought to be caused by one or more of three mecha- mulation and antagonistic genetic pleiotropy) for the ge-netic basis of aging in birds and mammals.nisms (Rose 1991; Ricklefs and Finch 1995): (a) the ac-
cumulated effects of deleterious mutations having their The repair hypothesis of senescence (c) could be con-sistent with observed patterns of aging-related mortalityexpression at increasing age (Edney and Gill 1968;
Mueller 1987; Partridge and Barton 1993b); (b) negative if genetic variation for repair capabilities decreased withincreasing age of expression of physiological deteriora-effects of the expression in old age of genes that enhance
survival and/or reproduction at younger ages (antagonis- tion. That is, the lesser damage experienced by youngerindividuals may be more readily prevented or repairedtic pleiotropy; Williams 1957; Rose 1991); and (c) envi-

36 The American Naturalist
than the more serious damage suffered by older individ- creases and thus creates an older age structure implies astrong constraint on the improvement of life span inuals. As physiological deterioration progresses further, it
may simply be more difficult, or more costly, to prevent long-lived organisms, including humans. If populationsof long-lived organisms lacked genetic variation foror reverse. The key difference between this hypothesis
and both a and b above is that in case c the degenerative mechanisms that would further retard aging and increaselife span, the most sensible approaches to aging as a pub-bases of senescence have environmental or somatic
causes, rather than being genetically determined. This lic health problem would include behavioral control ofwear and tear and therapeutic remedy of damage, ratherrelaxes the tight correlation between genetic variation
and senescent mortality implicit in a and b. As a result, than manipulation of gene products and engineering ofthe genetic material itself.evolutionary responses to selection generated by aging-
related deaths may be increasingly limited at older age bylack of genetically determined physiological or biochemi-
Acknowledgmentscal avenues of repair and prevention, that is, genetic vari-ation that could create genetic variance in fitness and I thank P. Abrams, S. Heard, S. Isenberg, C. Kelly, D.
Promislow, D. Reznick, and several anonymous reviewershence selection. The effects of aging simply become in-creasingly irreversible. for helpful comments on earlier versions of this manu-
script. My research on avian life histories is supported byRegardless of the underlying genetic mechanisms thatcontrol the rate of physiological senescence, the fact that the National Science Foundation (OPP-9696134).senescent mortality increases as initial adult mortality de-
APPENDIX A
Table A1: Parameters of the Weibull equation fitted to the relationship between mortality rate and age in natural populationsof birds
m0 αOldest Mass Reference
Species Sex N age Coefficient SE Coefficient SE ω (kg) notes
Anseriformes:Anatidae:
Cygnus columbianus M 32 18 .036 .030 3.89E25 1.33E25 .079 6.4 1C. columbianus F 27 18 .009 .055 1.05E24 .29E24 .101 5.7 1
Ciconiiformes:Laridae:
Larus canus MF 5,422 18 .098 .010 2.99E25 .35E25 .074 .404 2Rissa tridactyla M .160 .12 .196 .014 2.31E25 1.10E25 .069 .421 3R. tridactyla F .181 .12 .135 .022 3.02E25 1.72E25 .074 .393 3
Accipitridae:Accipiter nisus F ⋅ ⋅ ⋅ .8 .201 .089 1.84E23 .32E24 .207 .202 4
Spheniscidae:Eudyptula minor MF 246 16 .195 .077 3.13E24 .75E24 .133 1.105 5
Procellariidae:Puffinus tenuirostris MF ⋅ ⋅ ⋅ 25 .080 .010 1.12E24 .02E24 .103 .543 6Diomedia exulans MF 1,254 .28 .020 .004 2.12E26 .30E26 .038 7.65 7
Passeriformes:Muscicapidae:
Ficedula hypoleuca M 953 7 .748 .034 3.35E23 .21E23 .241 .012 8F. hypoleuca F 1,298 7 .656 .021 3.07E23 .13E23 .235 .012 8
Paridae:Parus major M ⋅ ⋅ ⋅ 7 .756 .085 3.43E23 .48E23 .242 .019 9P. major F ⋅ ⋅ ⋅ 7 .989 .103 2.93E23 .59E23 .233 .019 9Parus atricapillus MF ,150 6 .361 .059 1.10E23 .50E23 .182 .011 10

Table A1 (Continued)
m0 αOldest Mass Reference
Species Sex N age Coefficient SE Coefficient SE ω (kg) notes
Sylviidae:Turdoides squamiceps F 71 6 .297 .054 2.58E23 .93E23 .225 .074 11T. squamiceps M 69 7 .097 .006 1.99E23 .15E23 .211 .074 11
Fringillidae:Passerina cyanea
(Reserve) M 184 6 .429 .092 3.35E23 .87E23 .241 .015 12P. cyanea (Niles) M 173 6 .454 .016 1.71E23 .14E23 .203 .015 12
Note: Taxonomy based on Monroe and Sibley (1993). Body masses from Dunning (1993), unless otherwise noted. ‘‘Oldest age’’ refers to theoldest age class used in fitting the Weibull parameters. References and notes are as follows: (1) Scott (1988), table 14.2; survival from ages 7 to18 yr. (2) Rattiste and Lilleleht (1987); from fourth year of breeding (approximately 6 yr) to sixteenth year of breeding; oldest individual in popula-tion was 24 yr. (3) Coulson and Wooller (1976); survival calculated for age classes based on number of years of breeding experience: 1, 2, 3, 4–5,6–7, and 8–17 yr; age at first reproduction about 4 yr. (4) Newton (1989b), figure 17.1; 3–81 yr (survival lower in years 1 and 2); 465 bird-years.(5) Dann and Cullen (1990); life table constructed from ages of known-age birds last recovered dead (table 3.1); ages 4–15 yr included; ages 9–10 and 11–16 combined. (6) Bradley et al. (1989); Wooller et al. (1989), table 24.2; data for years 3 to 20–27 after first breeding, which begins atan average age of 7 yr; sample size 2,127 bird-years, 126–268 individuals per age class. (7) Weimerskirch (1992); survival rates calculated fromrecaptures of 998 individuals aged 4–22 yr, and 256 individuals older than 28 yr; age of individuals in the latter group unknown because bandingprogram was only 24 yr old; Weibull function fitted to survival for age classes 10–12, 13–15, 16–22, and .28 yr. (8) Gustafsson (1989), table 4.1;based on years 1–7; breeders only; 1,946 bird-years for males and 1,504 bird-years for females. (9) McCleery and Perrins (1989). (10) Loery et al.(1987). (11) Zahavi (1989), table 16.2; ages 1–6 for females and 1–7 for males, includes hatchlings banded in 1979–1983, whose survival wasfollowed through 1989; birds older than 6 and 7 yr, respectively, exhibited increased survival rates, but samples were only 20 and 22 bird-years,respectively; adult mass 64–83 g (Cramp and Perrins 1993). (12) Payne (1989), table 10.1; ages 2–6 yr for Reserve population (first-year survivallow) and 1–6 for Niles population; females showed no decrease in survival rate through 6 yr.
Table A2: Parameters of the Weibull equation fitted to the relationship between mortality rate and age in natural populationsof mammals
m0 αOldest Mass Reference
Species Sex N age Coefficient SE Coefficient SE ω (kg) notes
Primates:Cercopithidae:
Macaca mulatta F 164 21 .087 .017 1.21E25 .57E25 .059 4.6 1Hominidae:
Pan troglodytes F 22 37 .055 .011 4.22E26 .83E26 .045 39 2Carnivora:
Felidae:Panthera leo F 412 16 .032 ⋅ ⋅ ⋅ 2.52E24 .47E24 126 156.0 3
Mustelidae:Martes zibellina ? 2,598 12 .280 .076 5.42E24 1.54E24 .153 1.18 4
Otaridae:Callorhinus ursinus F 8,797 23 .051 ⋅ ⋅ ⋅ 8.60E25 4.40E25 .096 250.0 5
Phocidae:Phoca hispida M 130 40 .063 .008 1.07E25 .07E25 .057 65.0 6P. hispida F 160 37 .032 .004 9.75E26 .28E26 .056 65.0 6
Proboscidea:Elephantidae:
Loxodonta africana MF 174 60 .040 ⋅ ⋅ ⋅ 1.70E26 .24E26 .036 6,607.0 7Perrisodactyla:
Equidae:Equus burchelli M 55 23 .057 .015 7.72E25 .61E25 .094 237.7 8E. burchelli F 49 20 .064 ⋅ ⋅ ⋅ 1.24E24 .21E24 .106 ⋅ ⋅ ⋅ 8
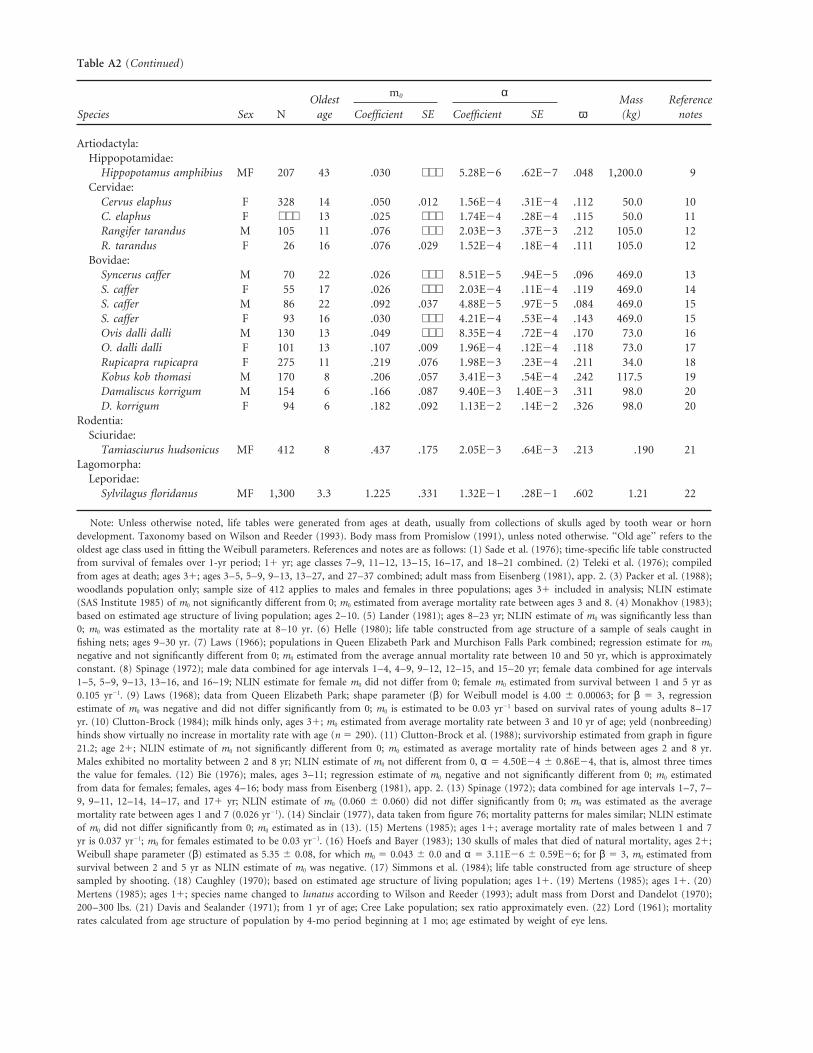
Table A2 (Continued)
m0 αOldest Mass Reference
Species Sex N age Coefficient SE Coefficient SE ω (kg) notes
Artiodactyla:Hippopotamidae:
Hippopotamus amphibius MF 207 43 .030 ⋅ ⋅ ⋅ 5.28E26 .62E27 .048 1,200.0 9Cervidae:
Cervus elaphus F 328 14 .050 .012 1.56E24 .31E24 .112 50.0 10C. elaphus F ⋅ ⋅ ⋅ 13 .025 ⋅ ⋅ ⋅ 1.74E24 .28E24 .115 50.0 11Rangifer tarandus M 105 11 .076 ⋅ ⋅ ⋅ 2.03E23 .37E23 .212 105.0 12R. tarandus F 26 16 .076 .029 1.52E24 .18E24 .111 105.0 12
Bovidae:Syncerus caffer M 70 22 .026 ⋅ ⋅ ⋅ 8.51E25 .94E25 .096 469.0 13S. caffer F 55 17 .026 ⋅ ⋅ ⋅ 2.03E24 .11E24 .119 469.0 14S. caffer M 86 22 .092 .037 4.88E25 .97E25 .084 469.0 15S. caffer F 93 16 .030 ⋅ ⋅ ⋅ 4.21E24 .53E24 .143 469.0 15Ovis dalli dalli M 130 13 .049 ⋅ ⋅ ⋅ 8.35E24 .72E24 .170 73.0 16O. dalli dalli F 101 13 .107 .009 1.96E24 .12E24 .118 73.0 17Rupicapra rupicapra F 275 11 .219 .076 1.98E23 .23E24 .211 34.0 18Kobus kob thomasi M 170 8 .206 .057 3.41E23 .54E24 .242 117.5 19Damaliscus korrigum M 154 6 .166 .087 9.40E23 1.40E23 .311 98.0 20D. korrigum F 94 6 .182 .092 1.13E22 .14E22 .326 98.0 20
Rodentia:Sciuridae:
Tamiasciurus hudsonicus MF 412 8 .437 .175 2.05E23 .64E23 .213 .190 21Lagomorpha:
Leporidae:Sylvilagus floridanus MF 1,300 3.3 1.225 .331 1.32E21 .28E21 .602 1.21 22
Note: Unless otherwise noted, life tables were generated from ages at death, usually from collections of skulls aged by tooth wear or horndevelopment. Taxonomy based on Wilson and Reeder (1993). Body mass from Promislow (1991), unless noted otherwise. ‘‘Old age’’ refers to theoldest age class used in fitting the Weibull parameters. References and notes are as follows: (1) Sade et al. (1976); time-specific life table constructedfrom survival of females over 1-yr period; 11 yr; age classes 7–9, 11–12, 13–15, 16–17, and 18–21 combined. (2) Teleki et al. (1976); compiledfrom ages at death; ages 31; ages 3–5, 5–9, 9–13, 13–27, and 27–37 combined; adult mass from Eisenberg (1981), app. 2. (3) Packer et al. (1988);woodlands population only; sample size of 412 applies to males and females in three populations; ages 31 included in analysis; NLIN estimate(SAS Institute 1985) of m0 not significantly different from 0; m0 estimated from average mortality rate between ages 3 and 8. (4) Monakhov (1983);based on estimated age structure of living population; ages 2–10. (5) Lander (1981); ages 8–23 yr; NLIN estimate of m0 was significantly less than0; m0 was estimated as the mortality rate at 8–10 yr. (6) Helle (1980); life table constructed from age structure of a sample of seals caught infishing nets; ages 9–30 yr. (7) Laws (1966); populations in Queen Elizabeth Park and Murchison Falls Park combined; regression estimate for m0
negative and not significantly different from 0; m0 estimated from the average annual mortality rate between 10 and 50 yr, which is approximatelyconstant. (8) Spinage (1972); male data combined for age intervals 1–4, 4–9, 9–12, 12–15, and 15–20 yr; female data combined for age intervals1–5, 5–9, 9–13, 13–16, and 16–19; NLIN estimate for female m0 did not differ from 0; female m0 estimated from survival between 1 and 5 yr as0.105 yr21. (9) Laws (1968); data from Queen Elizabeth Park; shape parameter (β) for Weibull model is 4.00 6 0.00063; for β 5 3, regressionestimate of m0 was negative and did not differ significantly from 0; m0 is estimated to be 0.03 yr21 based on survival rates of young adults 8–17yr. (10) Clutton-Brock (1984); milk hinds only, ages 31; m0 estimated from average mortality rate between 3 and 10 yr of age; yeld (nonbreeding)hinds show virtually no increase in mortality rate with age (n 5 290). (11) Clutton-Brock et al. (1988); survivorship estimated from graph in figure21.2; age 21; NLIN estimate of m0 not significantly different from 0; m0 estimated as average mortality rate of hinds between ages 2 and 8 yr.Males exhibited no mortality between 2 and 8 yr; NLIN estimate of m0 not different from 0, α 5 4.50E24 6 0.86E24, that is, almost three timesthe value for females. (12) Bie (1976); males, ages 3–11; regression estimate of m0 negative and not significantly different from 0; m0 estimatedfrom data for females; females, ages 4–16; body mass from Eisenberg (1981), app. 2. (13) Spinage (1972); data combined for age intervals 1–7, 7–9, 9–11, 12–14, 14–17, and 171 yr; NLIN estimate of m0 (0.060 6 0.060) did not differ significantly from 0; m0 was estimated as the averagemortality rate between ages 1 and 7 (0.026 yr21). (14) Sinclair (1977), data taken from figure 76; mortality patterns for males similar; NLIN estimateof m0 did not differ significantly from 0; m0 estimated as in (13). (15) Mertens (1985); ages 11; average mortality rate of males between 1 and 7yr is 0.037 yr21; m0 for females estimated to be 0.03 yr21. (16) Hoefs and Bayer (1983); 130 skulls of males that died of natural mortality, ages 21;Weibull shape parameter (β) estimated as 5.35 6 0.08, for which m0 5 0.043 6 0.0 and α 5 3.11E26 6 0.59E26; for β 5 3, m0 estimated fromsurvival between 2 and 5 yr as NLIN estimate of m0 was negative. (17) Simmons et al. (1984); life table constructed from age structure of sheepsampled by shooting. (18) Caughley (1970); based on estimated age structure of living population; ages 11. (19) Mertens (1985); ages 11. (20)Mertens (1985); ages 11; species name changed to lunatus according to Wilson and Reeder (1993); adult mass from Dorst and Dandelot (1970);200–300 lbs. (21) Davis and Sealander (1971); from 1 yr of age; Cree Lake population; sex ratio approximately even. (22) Lord (1961); mortalityrates calculated from age structure of population by 4-mo period beginning at 1 mo; age estimated by weight of eye lens.

Rate of Aging in Birds and Mammals 39
APPENDIX B and therefore
Comparison of Approaches to Estimatingln(n!) 5 2n 1 n ln(n) 1
1
2ln(2πn) . (B5)Aging Parameters
Unweighted nonlinear least squares (LS), weighted non-linear least squares (WLS), and maximum likelihood Log-likelihood functions were evaluated using the NLIN
procedure of SAS with a weight equal to the variance in(ML) approaches to estimating aging parameters arecompared. For the LS approach, the data are the instan- D(x), that is, WEIGHT 5 1/N(x) ⋅ q(x) ⋅ (1 2 q(x)),
and a criterion ( LOSS ) function equal to the sum oftaneous mortality rates mx estimated as the negative ofthe natural logarithm of the survival from time x to time the log-likelihood terms divided by their weights.
In general, parameter estimates obtained by the LS,x 1 1. In the WLS approach, I weighted observations bythe square root of the initial number of individuals in WLS, and ML approaches did not differ markedly. This
point is illustrated in table B1, where results for the threeeach age class, which is inversely related to the standarderror of the estimate of the survival fraction. Calculations approaches are shown for female pied flycatchers and
male Arabian babblers. In these comparisons, estimateswere done in the NLIN procedure of SAS (SAS Institute1985). of the initial mortality rates are nearly identical. Maxi-
mum likelihood tended to produce higher shape parame-For the ML approach, the data were the number of in-dividuals living through each age class (S(x)) and the ters (β), but lower values of α resulted in similar esti-
mated values of the aging parameter ω. Other similarnumber dying in each age class (D(x)). The sum of S(x)and D(x) is the total number entering each age class comparisons revealed little difference in parameter esti-
mates of Weibull functions, particularly with respect to(N(x)). We define L(x) as the probability that an individ-ual will live to the beginning of age class x, and q(x) as the value of m0 and the secondary parameter ω.
Gompertz equations were also fitted by ML to the datathe probability that a newborn individual will die duringthe age interval x to x 1 1. In this case, q(x) 5 L(x) 2 for female pied flycatchers and to a sample of male Dall
sheep Ovis dalli. The values for the convergence func-L(x 1 1). Given a particular value of q(x), the likelihoodof a particular number of deaths in the interval x to tions ( LOSS ) for each of the species were 220.0 (Wei-
bull: F 5 2083, df 5 3, 4) and 223.0 (Gompertz: F 5x 1 1 is960, df 5 2, 5) for Ficedula hypoleuca, and 220.1 (Wei-bull: F 5 310, df 5 3, 7) and 221.4 (Gompertz: F 5
Likelihood (D(x)) 5N(x)!
S(x)!D(x)! 192, df 5 2, 8) for O. dalli. It is not surprising that thethree-parameter Weibull equation provides a better fit to
3 [q(x)D(x) ⋅ (1 2 q(x))S(x)] .(B1)
the data than the two-parameter Gompertz equationdoes in each case.
The logarithm of this expression is In order to examine the influence of sample size on es-timates of the parameters of the Weibull equation, I per-
ln(likelihood (D(x)) 5 ln(N(x)!) formed three exercises patterned after the approach ofMueller et al. (1995). First, the data for female pied fly-2 ln(S(x)!) 2 ln(D(x)!)
(B2) catchers were randomly rarified to one-half and one-1 D(x) ln(q(x)) quarter of the 1,504 bird-years in the original sample of
data. This was accomplished by reducing the number of1 S(x) ln(1 2 q(x)),individuals in each class, randomly selecting individualsfrom the group that survived and the group that died.and the total log-likelihood is the sum of this expressionWeibull equations were fitted to the rarified data by ML.over all age classes.This was repeated 10 times for each level of rarefaction.For the Weibull function, the fraction of individuals inSecond, life tables were generated randomly using partic-the population dying during age interval x to x 1 1 isular values of Weibull parameters, and the resultingnumbers of surviving and dying individuals in each age
q(x) 5 1 2 exp52m0 2αβ
[(x 1 1)β11 2 xβ11]6 . (B3) class were fitted using an ML approach. Ten life tableswere generated with each of 250, 500, 1,000, 2,000, 5,000,and 10,000 individuals. Third, randomly generated lifeValues of N(x)!, D(x)!, and S(x)! were approximated bytables having either 1,000 or 10,000 individuals were gen-Stirling’s formulaerated using parameters of the Weibull equation, and theresulting data were fitted by Weibull equations using LS,n! 5 e2nnn√2πn , (B4)WLS, and ML approaches.

40 The American Naturalist
Table B1: Least squares (LS), weighted least squares (WLS), and maximum likelihood (ML) estimates ofWeibull parameters for female pied flycatchers (Ficedula hypoleuca) and male Arabian babblers(Turdoides squamiceps)
m0 α β
Species and fit Estimate SE Estimate SE Estimate SE ω
Ficedula hypoleuca:LS .664 .032 2.53E23 1.64E23 3.14 .36 .232WLS .667 .023 2.03E23 1.53E23 3.22 .40 .230ML .663 .032 .75E23 1.55E23 3.62 1.16 .211
Turdoides squamiceps:LS .115 .031 .84E23 1.68E23 3.39 1.10 .199WLS .114 .029 .96E23 1.87E23 3.31 1.09 .199ML .113 .038 .35E23 1.46E23 3.71 2.29 .185
Note: For details of the data sets, see appendix A, table A1.
With the rarified data sets for the pied flycatcher, ML 10,000 individuals were simulated up to a maximum ageof 10 yr. Each of these cases was repeated 10 times. Whenfitting often failed to converge on a stable solution. In ta-
ble B2, which summarizes these results, convergence is either D(x) or S(x) for an age class was 0, that age classwas dropped from the data set. The different categoriestabulated under three categories: ‘‘yes,’’ meaning that the
solution converged within 50 iterations; ‘‘no,’’ meaning of convergence success were handled as above. Estimatedparameters were divided by the parameter values used tothat the algorithm was approaching a stable solution after
50 iterations but had not reached it; and ‘‘failed,’’ mean- generate the data, giving a relative value normalized to 1(fig. B1). Down to a sample of 500 individuals, parame-ing that one or more of the estimated parameters had be-
come negative during the course of the iterations. In the ters estimated by ML were very close to the generatingparameter values, although the standard deviations of thecase of a ‘‘no’’ outcome, the last set of parameters (itera-
tion 50) was retained. In the case of a ‘‘failed’’ outcome, data were large. With 250 individuals, the estimate of theshape parameter β (3.80 6 0.32 SE) significantly ex-the set of parameters corresponding to the lowest value
of the LOSS function during the iterations was re- ceeded the generating value (3). This was compensatedby a reduced value of α (0.00131 6 0.00054 SE), so thattained.
Table B2 indicates considerable stability in m0 with re- the estimated value of ω (0.193 6 0.012 SE) was not verydifferent from the generating value. Convergence successspect to rarifaction but a decrease in α, a corresponding
increase in β, and a slight decrease in ω, particularly with the ML approach fell from 9/10 at 10,000 individualsto 5/10 at 1,000, and 2/10 at 250 individuals.compared with the variation among species in this anal-
ysis. The third set of simulations, with either 1,000 or10,000 individuals per data set were fitted by LS, WLS,In the second set of simulations, I used Weibull pa-
rameter values of m0 5 0.6, α 5 0.002, and β 5 3. These and ML approaches. The first two approaches, LS andWLS, consistently overestimated the value of β. However,yield a calculated value of ω 5 0.211. Either 1,000 or
Table B2: Maximum likelihood estimates of Weibull parameters for female pied flycatcher datararified to one-half and one-quarter
Convergence Mean of estimates (SD)
Yes No Failed m0 α β ω
Unreduced ⋅ ⋅ ⋅ ⋅ ⋅ ⋅ ⋅ ⋅ ⋅ .663 .75E23 3.62 .210Reduced to .5 5 5 0 .651 4.81E23 3.38 .213
(.030) (11.1E23) (.97) (.014)Reduced to .25 3 4 3 .691 1.75E23 3.68 .180
(.065) (3.17E23) (1.36) (.041)
Note: Mean and standard deviation (in parentheses) based on 10 repetitions.

Rate of Aging in Birds and Mammals 41
performance is only marginally better than LS and WLSapproaches. Biases in β and ω are generally small com-pared with variation among species. Values of m0 are es-timated well regardless of the sample size and approachtaken. The general failure of estimation at small samplesizes, regardless of the approach, explains in part why somany data sets fail to show evidence of actuarial agingbut also cautions against using parameter estimates fromsuch small populations.
Literature Cited
Abrams, P. A. 1991. The fitness costs of senescence: theevolutionary importance of events in early adult life.Evolutionary Ecology 5:343–360.
———. 1993. Does increased mortality favor the evolu-Figure B1: Maximum likelihood estimates of parameters m0
tion of more rapid senescence? Evolution 47:877–887.and β, and the calculated rate of aging ω, as a function of sam-Abrams, P. A., and D. Ludwig. 1995. Optimality theory,ple size for simulated data sets using Weibull survival functions.
Gompertz’ law, and the disposable soma theory of se-Estimated values are shown relative to the parameter valuesnescence. Evolution 49:1055–1066.used to generate the data sets (m0 5 0.6, α 5 0.002, β 5 3,
ω 5 0.211). Each simulation was repeated 10 times. Estimated Austad, S. N., and K. E. Fischer. 1991. Mammalian aging,values are reported as means 6 1 SD. metabolism, and ecology: evidence from the bats and
marsupials. Journal of Gerontology: Biological Sciences46:B47–B53.with respect to the critical aging parameter ω, all three
Bie, S. de 1976. Survivorship in the Svalbard reindeerestimation approaches performed reasonably well, with(Rangifer tarandus platyrhynchus Vrolik) on Edgeøya,the biases in ω averaging less than 20% in all cases, andSvalbard. Norsk Polarinstitutt Arbok 1976:249–270.even less for ML approaches at the smaller sample size
Blarer, A., M. Doebeli, and S. C. Stearns. 1995. Diagnos-(fig. B2). With samples of 100 individuals (results noting senescence: inferring evolutionary causes fromshown), none of the estimating approaches led to stablephenotypic patterns can be misleading. Proceedings ofsolutions with this set of parameter values.the Royal Society of London B, Biological SciencesThe basic conclusion from this exercise is that while262:305–312.ML produces less biased estimates of parameters, this
Botkin, D. B., and R. S. Miller. 1974. Mortality rates andsurvival of birds. American Naturalist 108:181–192.
Bradley, J. S., R. D. Wooller, I. J. Skira, and D. L.Serventy. 1989. Age-dependent survival of breedingshort-tailed shearwaters Puffinus tenuirostris. Journal ofAnimal Ecology 58:175–188.
Calder, W. A., III. 1983. Body size, mortality, and lon-gevity. Journal of Theoretical Biology 102:135–144.
Carey, J. R., P. Liedo, D. Orozco, and J. W. Vaupel.1992. Slowing of mortality rates at older ages inlarge medfly cohorts. Science (Washington, D.C.) 258:457–461.
Caughley, G. 1970. Population statistics of chamois.Mammalia 34:194–199.
Figure B2: Least squares (LS), weighted least squares (WLS), ———. 1977. Analysis of vertebrate populations. Wiley,and maximum likelihood (ML) estimates of parameters m0 and
New York.β, and the calculated rate of aging ω, for simulated data sets ofCharlesworth, B. 1993. Evolutionary mechanisms of se-10,000 and 1,000 individuals using Weibull survival functions.
nescence. Genetica 91:11–19.Estimated values are shown relative to the parameter values———. 1994. Evolution in age-structured populations.used to generate the data sets (m0 5 0.6, α 5 0.002, β 5 3,
2d ed. Cambridge University Press, Cambridge.ω 5 0.211). Each simulation was repeated 10 times. Estimatedvalues are reported as means 6 1 SD. Charlesworth, B., and J. A. Leon. 1976. The relations of

42 The American Naturalist
reproductive effort to age. American Naturalist 110: Finch, C. E., and R. E. Tanzi. 1997. Genetics of aging.Science (Washington, D.C.) 278:407–411.449–459.
Clum, N. J. 1995. Effects of aging and mate retention on Forslund, P., and K. Larsson. 1992. Age-related repro-ductive success in the barnacle goose. Journal of Ani-reproductive success of captive female peregrine fal-
cons. American Zoologist 35:329–339. mal Ecology 61:195–204.Forslund, P., and T. Part. 1995. Age and reproduction inClutton-Brock, T. H. 1984. Reproductive effort and ter-
minal investment in iteroparous animals. American birds—hypotheses and tests. Trends in Ecology & Evo-lution 10:374–378.Naturalist 123:212–229.
Clutton-Brock, T. H., S. D. Albon, and F. E. Guinness. Fukui, H. H., L. Xiu, and J. W. Curtsinger. 1993. Slowingof age-specific mortality rates in Drosophila melanogas-1988. Reproductive success in male and female red
deer. Pages 325–343 in T. H. Clutton-Brock, ed. Re- ter. Experimental Gerontology 28:585–599.Fukui, H. H., L. Ackert, and J. W. Curtsinger. 1996. De-productive success: studies of individual variation in
contrasting breeding systems. University of Chicago celeration of age-specific mortality rates in chromo-somal homozygotes and heterozygotes of DrosophilaPress, Chicago.
Comfort, A. 1962. Survival curves of some birds in the melanogaster. Experimental Gerontology 31:517–531.Gavrilov, L. A., and N. S. Gavrilova. 1991. The biology ofLondon Zoo. Ibis 104:115–117.
Coulson, J. C., and R. D. Wooller. 1976. Differential sur- life span: a quantitative approach. Harwood Academic,New York.vival rates among breeding kittiwake gulls Rissa tridac-
tyla (L.). Journal of Animal Ecology 45:205–214. Gustafsson, L. 1989. Pied flycatcher. Pages 55–74 in I.Newton, ed. Lifetime reproduction in birds. AcademicCramp, S. 1980. Handbook of the birds of Europe, the
Middle East, and North Africa: the birds of the West- Press, London.Hamilton, W. D. 1966. The moulding of senescence byern Palearctic. Vol. 2. Hawks to bustards. Oxford Uni-
versity Press, Oxford. natural selection. Journal of Theoretical Biology 12:12–45.Cramp, S., and C. M. Perrins. 1993. Handbook of the
birds of Europe, the Middle East and North Africa: the Harvey, P. H., and M. S. Pagel. 1991. The comparativemethod in evolutionary biology. Cambridge Universitybirds of the Western Palearctic. Vol. 7. Flycatchers to
shrikes. Oxford University Press, Oxford. Press, Cambridge.Helle, E. 1980. Age structure and sex ratio of the ringedDann, P., and J. M. Cullen. 1990. Survival, patterns of re-
production, and lifetime reproductive output in little seal Phoca (Pusa) hispida Schreber population in theBothnian Bay, northern Baltic Sea. Zeitschrift furblue penguins (Eudyptula minor) on Phillip Island,
Victoria, Australia. Pages 63–84 in L. S. Davis and J. T. Saugetierkunde 45:310–317.Henny, C. J. 1972. An analysis of the population dynam-Darby, eds. Penguin biology. Academic Press, San
Diego, Calif. ics of selected avian species. U.S. Fish and Wildlife Ser-vice Wildlife Research 1:1–99.Davis, D. W., and J. A. Sealander. 1971. Sex ratio and age
structure in two red squirrel populations in northern Hoefs, M., and M. Bayer. 1983. Demographic character-istics of an unhunted Dall sheep (Ovis dalli dalli) pop-Saskatchewan. Canadian Field-Naturalist 85:303–308.
Dorst, J., and P. Dandelot. 1970. A field guide to the ulation in southwest Yukon, Canada. Canadian Jour-nal of Zoology 61:1346–1357.larger mammals of Africa. Collins, London.
Dunning, J. B., Jr. 1993. CRC handbook of avian body Holmes, D. J., and S. N. Austad. 1995a. Birds as animalmodels for the comparative biology of aging: a pro-masses. CRC, Boca Raton, Fla.
Eakin, T., R. Shouman, Y. Qi, G. Liu, and M. Witten. spectus. Journal of Gerontology: Biological Sciences50A:B59–B66.1995. Estimating parametric survival model parameters
in gerontological aging studies: methodological prob- ———. 1995b. The evolution of avian senescence pat-terns: implications for understanding primary aginglems and insights. Journal of Gerontology: Biological
Sciences 50A:B166–B176. processes. American Zoologist 35:307–317.Keller, L., and M. Genoud. 1997. Extraordinary lifespansEdney, E. B., and R. W. Gill. 1968. Evolution of senescence
and specific longevity. Nature (London) 220:281–282. in ants: a test of evolutionary theories of ageing. Na-ture (London) 389:958–960.Eisenberg, J. F. 1981. The mammalian radiations: an
analysis of trends in evolution, adaptation, and behav- Kirkwood, T. B. L. 1990. The disposable soma theory ofaging. Pages 9–19 in D. E. Harrison, ed. Genetic effectsior. University of Chicago Press, Chicago.
Ewens, W. J. 1979. Mathematical population genetics. on aging. Telford, Caldwell, N.J.Kirkwood, T. B. L., and R. Holliday. 1979. The evolutionSpringer, Berlin.
Finch, C. E. 1990. Longevity, senescence, and the ge- of ageing and longevity. Proceedings of the Royal Soci-ety of London B, Biological Sciences 205:531–546.nome. University of Chicago Press, Chicago.

Rate of Aging in Birds and Mammals 43
Lander, R. H. 1981. A life table and biomass estimate for of common pochards, Aythya ferina. Ecology 78:1009–1018.Alaskan fur seals. Fisheries Research 1:55–70.
Laws, R. M. 1966. Age criteria for the African elephant, Ottinger, M. A. 1991. Neuroendocrine and behavioraldeterminants of reproductive aging. Critical Reviews ofLoxodonta a. africana. East African Wildlife Journal 4:
1–37. Poultry Biology 3:131–142.Ottinger, M. A., I. C. T. Nisbet, and C. E. Finch. 1995.———. 1968. Dentition and ageing of the hippopota-
mus. East African Wildlife Journal 6:19–52. Aging and reproduction: comparative endocrinologyof the common tern and Japanese quail. American Zo-LeBreton, J.-D., K. P. Burnham, J. Clobert, and D. R.
Anderson. 1992. Modeling survival and testing biologi- ologist 35:299–306.Packer, C., L. Herbst, A. E. Pusey, J. D. Bygott, J. P.cal hypotheses using marked animals: a unified ap-
proach with case studies. Ecological Monographs 62: Hanby, S. J. Cairns, and M. B. Mulder. 1988. Re-productive success of lions. Pages 363–383 in T. H.67–118.
Loery, G., K. H. Pollock, J. D. Nichols, and J. E. Hines. Clutton-Brock, ed. Reproductive success: studies ofindividual variation in contrasting breeding systems.1987. Age-specificity of black-capped chickadee sur-
vival rates: analysis of capture-recapture data. Ecology University of Chicago Press, Chicago.Partridge, L., and N. H. Barton. 1993a. Evolution of68:1038–1044.
Lord, R. D., Jr. 1961. Mortality rates of cottontail rabbits. aging: testing the theory using Drosophila. Genetica 91:89–98.Journal of Wildlife Management 25:33–40.
McCleery, R. H., and C. M. Perrins. 1989. Great tit. ———. 1993b. Optimality, mutation and the evolutionof ageing. Nature (London) 362:305–311.Pages 35–54 in I. Newton, ed. Lifetime reproduction
in birds. Academic Press, London. Payne, R. B. 1989. Indigo bunting. Pages 153–172 in I.Newton, ed. Lifetime reproduction in birds. AcademicMcNamara, J. M., and A. I. Houston. 1996. State-depen-
dent life histories. Nature (London) 380:215–221. Press, London.Petersen, T. 1986. Estimating fully parametric hazard rateMedawar, P. B. 1952. An unsolved problem in biology.
H. K. Lewis, London. models with time-dependent covariates: use of maxi-mum likelihood. Sociological Methods and ResearchMertens, H. 1985. Structures de population et tables de
survie des buffles, topis et cobs de Buffon au Parc Na- 14:219–246.Pianka, E. R., and W. S. Parker. 1975. Age-specific repro-tional des Virunga, Zaire. Revue d’Ecologie la Terre et
la Vie 40:33–51. ductive tactics. American Naturalist 109:453–464.Promislow, D. E. L. 1991. Senescence in natural popula-Monakhov, V. G. 1983. Age structure of the sable
(Martes zibellina) populations [in Russian]. Zoolog- tions of mammals: a comparative study. Evolution 45:1869–1887.icheskii Zhurnal 62:1398–1406.
Monroe, B. L., Jr., and C. G. Sibley. 1993. A world check- Promislow, D. E. L., M. Tatar, A. A. Khazaeli, and J. W.Curtsinger. 1996. Age-specific patterns of genetic vari-list of birds. Yale University Press, New Haven, Conn.
Mueller, L. D. 1987. Evolution of accelerated senescence ance in Drosophila melanogaster. I. Mortality. Genetics143:839–848.in laboratory populations of Drosophila. Proceedings
of the National Academy of Sciences of the USA 84: Pugesek, B. H., and K. L. Diem. 1990. The relationshipbetween reproduction and survival in known-aged1974–1977.
Mueller, L. D., and M. R. Rose. 1996. Evolutionary the- California gulls. Ecology 71:811–817.Rattiste, K., and V. Lilleleht. 1987. Population ecology ofory predicts late-life mortality plateaus. Proceedings of
the National Academy of Sciences of the USA 93: the common gull Larus canus in Estonia. Ornis Fen-nica 64:179–186.15249–15253.
Mueller, L. D., T. J. Nusbaum, and M. R. Rose. 1995. Ricklefs, R. E., and C. E. Finch. 1995. Aging: a naturalhistory. Scientific American Library, New York.The Gompertz equation as a predictive tool in demog-
raphy. Experimental Gerontology 30:553–569. Ricklefs, R. E., and J. M. Starck. 1996. Applications ofphylogenetically independent contrasts: a mixed prog-Newton, I. 1989a. Lifetime reproduction in birds. Aca-
demic Press, London. ress report. Oikos 77:167–172.Rose, M. R. 1984. Laboratory evolution of postponed se-———. 1989b. Sparrowhawk. Pages 279–296 in I. New-
ton, ed. Lifetime reproduction in birds. Academic nescence in Drosophila melanogaster. Evolution 38:1004–1010.Press, London.
Newton, I., and P. Rothery. 1997. Senescence and repro- ———. 1991. Evolutionary biology of aging. OxfordUniversity Press, New York.ductive value in sparrowhawks. Ecology 78:1000–1008.
Nichols, J. D., J. E. Hines, and P. Blums. 1997. Tests Rose, M. R., and C. E. Finch. 1993. The Janiform geneticsof aging. Genetica 91:3–10.for senescent decline in annual survival probabilities

44 The American Naturalist
Sade, D. S., K. Cushing, P. Cushing, J. Dunaif, A. Figue- Curtsinger. 1996. Age-specific patterns of genetic vari-ance in Drosophila melanogaster. II. Fecundity and itsroa, J. R. Kaplan, C. Lauer, D. Rhodes, and J. Schnei-
der. 1976. Population dynamics in relation to social genetic covariance with age-specific mortality. Genetics143:849–858.structure on Cayo Santiago. Yearbook of Physical An-
thropology 20:253–262. Taylor, H. M., R. S. Gourley, C. E. Lawrence, and R. S.Kaplan. 1974. Natural selection of life history attri-Sæther, B. E. 1990. Age specific variation in reproductive
performance in birds. Current Ornithology 7:251–283. butes: an analytical approach. Theoretical PopulationBiology 5:104–122.SAS Institute. 1985. SAS user’s guide: statistics, version 5
ed. SAS Institute, Cary, N.C. Teleki, G., E. E. Hunt, Jr., and J. H. Pfifferling. 1976. De-mographic observations (1963–1973) on the chimpan-Scott, D. K. 1988. Breeding success in Bewick’s swans.
Pages 220–236 in T. H. Clutton-Brock, ed. Reproduc- zees of Gombe National Park, Tanzania. Journal ofHuman Evolution 5:559–598.tive success: studies of individual variation in con-
trasting breeding systems. University of Chicago Press, Weimerskirch, H. 1992. Reproductive effort in long-livedbirds: age-specific patterns of condition, reproductionChicago.
Shmookler Reis, R. J., and R. H. Ebert II. 1996. Genetics and survival in the wandering albatross. Oikos 64:464–473.of aging: current animal models. Experimental Geron-
tology 31:69–81. Williams, G. C. 1957. Pleiotropy, natural selection andthe evolution of senescence. Evolution 11:398–411.Simmons, N. M., M. B. Bayer, and L. O. Sinkey. 1984.
Demography of Dall’s sheep in the Mackenzie Moun- Wilson, D. E., and D. M. Reeder. 1993. Mammal speciesof the world: a taxonomic guide and geographical ref-tains, Northwest Territories. Journal of Wildlife Man-
agement 48:156–162. erence. Smithsonian Institution Press, Washington,D.C.Sinclair, A. R. E. 1977. The African buffalo: a study of re-
source limitation of populations. University of Chicago Wilson, D. L. 1994. The analysis of survival (mortality)data: fitting Gompertz, Weibull, and logistic functions.Press, Chicago.
Sohal, R. S. 1986. The rate of living theory: a contempo- Mechanisms of Ageing and Development 74:15–33.Wooller, R. D., J. S. Bradley, I. J. Skira, and D. L.rary interpretation. Pages 23–44 in R. S. Sohal and K.
G. Collatz, eds. Insect aging, strategies and mecha- Serventy. 1989. Short-tailed shearwater. Pages 405–417in I. Newton, ed. Lifetime reproduction in birds. Aca-nisms. Springer, Berlin.
Spinage, C. A. 1972. African ungulate life tables. Ecology demic Press, London.Zahavi, A. 1989. Arabian babbler. Pages 253–275 in I.53:51–78.
Sternberg, H. 1989. Pied flycatcher. Pages 55–74 in I. Newton, ed. Lifetime reproduction in birds. AcademicPress, London.Newton, ed. Lifelong reproduction in birds. Academic
Press, London.Tatar, M., D. E. L. Promislow, A. A. Khazaeli, and J. W. Associate Editor: Dolph Schluter