evonik leading beyond chemistry€¦ · a strong basis in specialty chemicals 1. sales with top 1-3...
TRANSCRIPT

1
Evonik
Leading Beyond Chemistry
Company Presentation Q4/FY 2019
2
Table of contents
1. Evonik at a glance
2. Strategy
3. Financials Q4/FY 2019
4. Appendix

3
A strong basis in Specialty Chemicals
1. Sales with top 1-3 market position by sales, production volume or capacity (depending on available data)
Leading market
positions in
80% of our businesses1
Almost 90% of direct sales
via
marketing & sales force
of ~2,000 employees
Leading and
proprietary technology
platforms in
25 countries
on
5 continents
Highly qualified
workforceas key factor for a
successful and
sustainable business
development
Qualified employees
Market leadership
Customerproximity
Technologyleadership
Unique brand recognition
(selected product brands)

4
Three segments with differentiated management
Nutrition
& Care
Resource
Efficiency
Performance
Materials
Growth Efficiency
€4,582 m €728 m / 15.9% €5,685 m €1,290 m / 22.7%
Sales
€2,043 m
Adj. EBITDA / Margin
€224 m / 11.0%
Sales Adj. EBITDA / MarginSales Adj. EBITDA / Margin
Sales
€13,108 m
Adj. EBITDA
€2,153 m
Margin
16.4%
ROCE
8.6%
Group financials 20191
1. Continuing Operations

5
Balanced regional and end market split
End market split
Plastics and rubber1
Food & animal feed
Consumer &
personal care
products
Construction
Automotive &
mechanical
engineering
Pharma & Healthcare
Paints & coatings1
Metal & oil products
Renewable energies
Electrical & electronics
Paper & printing
Agriculture
<5% 5-10% 10-15% 15-20%
Sales by region
Western Europe
Eastern Europe
North America
Central & South America
Asia-Pacific
Other
Other industries
6
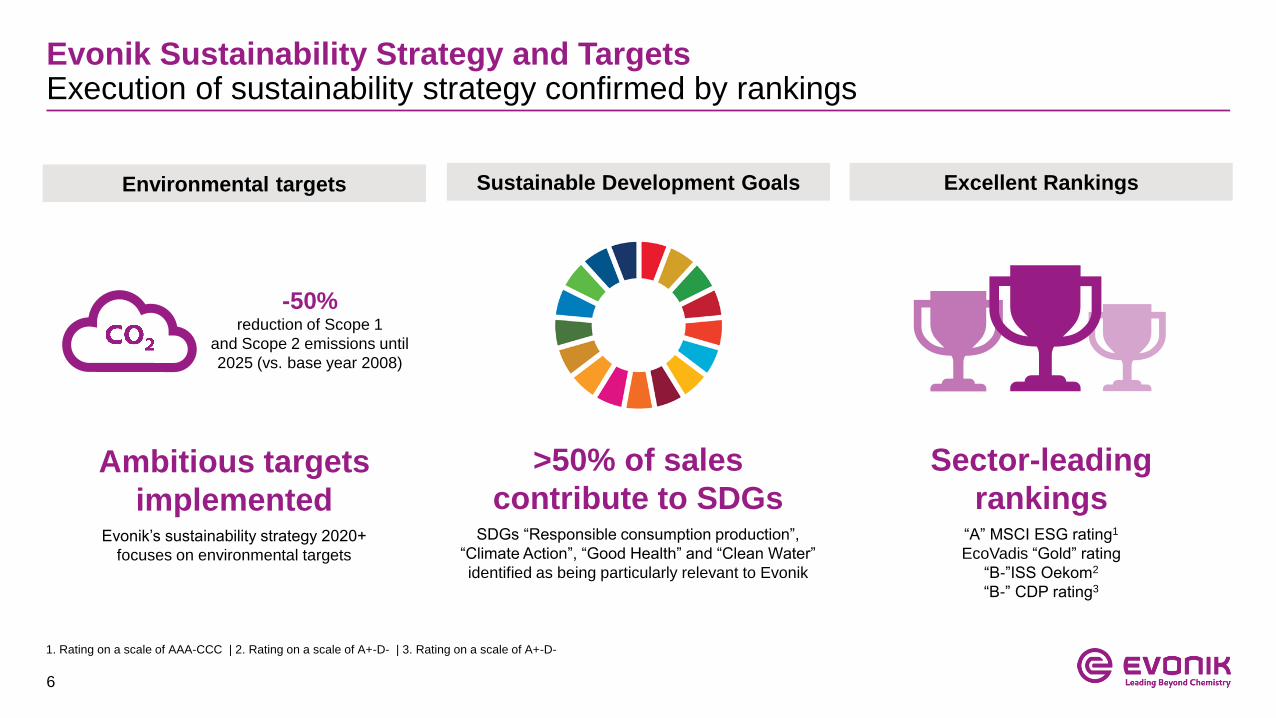
Evonik Sustainability Strategy and TargetsExecution of sustainability strategy confirmed by rankings
>50% of sales
contribute to SDGs SDGs “Responsible consumption production”,
“Climate Action”, “Good Health” and “Clean Water”
identified as being particularly relevant to Evonik
Sustainable Development Goals
1. Rating on a scale of AAA-CCC | 2. Rating on a scale of A+-D- | 3. Rating on a scale of A+-D-
Ambitious targets
implementedEvonik’s sustainability strategy 2020+
focuses on environmental targets
Environmental targets
-50% reduction of Scope 1
and Scope 2 emissions until
2025 (vs. base year 2008)
Sector-leading
rankings“A” MSCI ESG rating1
EcoVadis “Gold” rating
“B-”ISS Oekom2
“B-” CDP rating3
Excellent Rankings

7
Reliable and attractive dividend policy
20112008 20122009 2010 2013 20152014 2016 2017
1.151.15
2018 20191
+6% CAGR
▪ Sustainable dividend growth over the
last years: 6% CAGR between 2008
and 2019
▪ Attractive dividend yield
▪ Reliable dividend policy targeting:
− dividend continuity
− a payout ratio of ~40% of
adjusted net income
Dividend (in €) for FY
Payout ratio 41% 59%
1. Dividend proposal

8
Table of contents
1. Evonik at a glance
2. Strategy
3. Financials Q4/FY 2019
4. Appendix
9
Building a best-in-class
specialty chemicals company
10
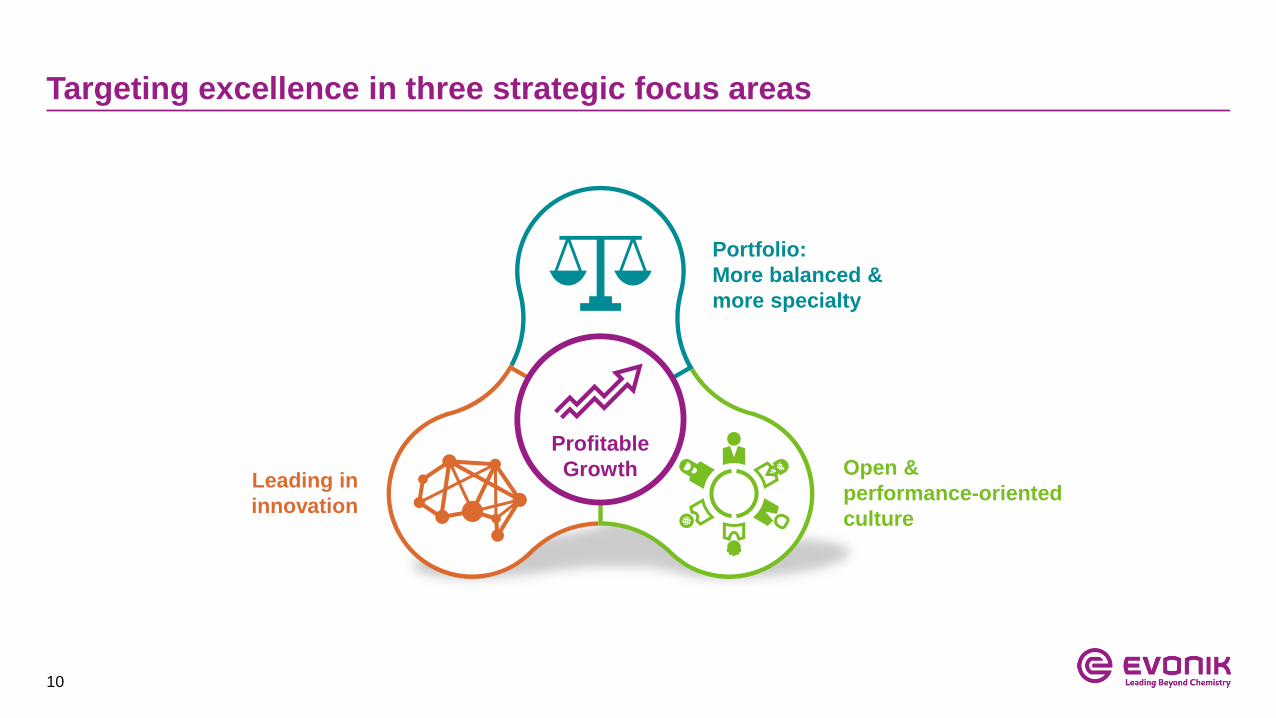
Targeting excellence in three strategic focus areas
Portfolio:
More balanced &
more specialty
Leading in
innovation
Open &
performance-oriented
culture
Profitable
Growth
11
Smart MaterialsHealth & Care
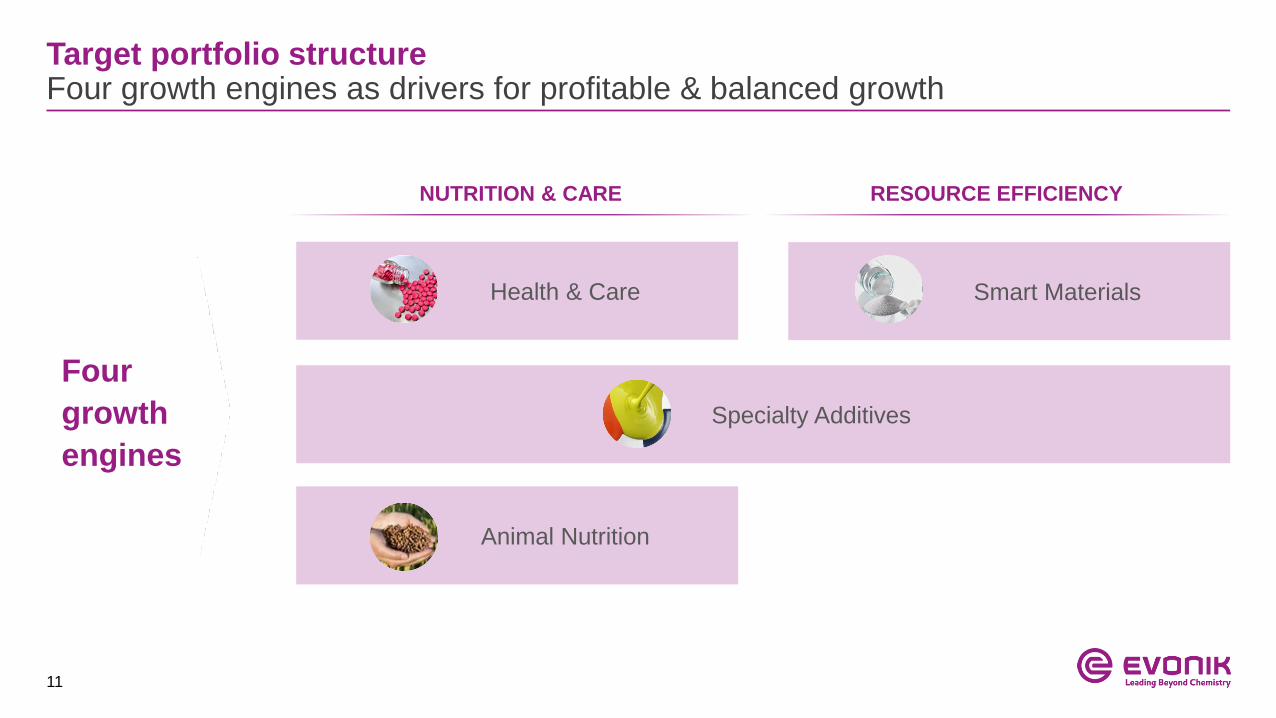
Target portfolio structureFour growth engines as drivers for profitable & balanced growth
Four
growth
engines
NUTRITION & CARE RESOURCE EFFICIENCY
Animal Nutrition
Specialty Additives

12
Building on our strengthsDeveloping our growth segments and businesses
NUTRITION & CARE RESOURCE EFFICIENCY PERFORMANCE MATERIALS
€4.6 bn €5.7 bn €2.0 bn
Meeting specialty chemicals characteristics
Growth
businesses
Growth
businesses
Mature
businesses
Mature
businesses
Mature
businesses
2019 Financials continuing operations
13
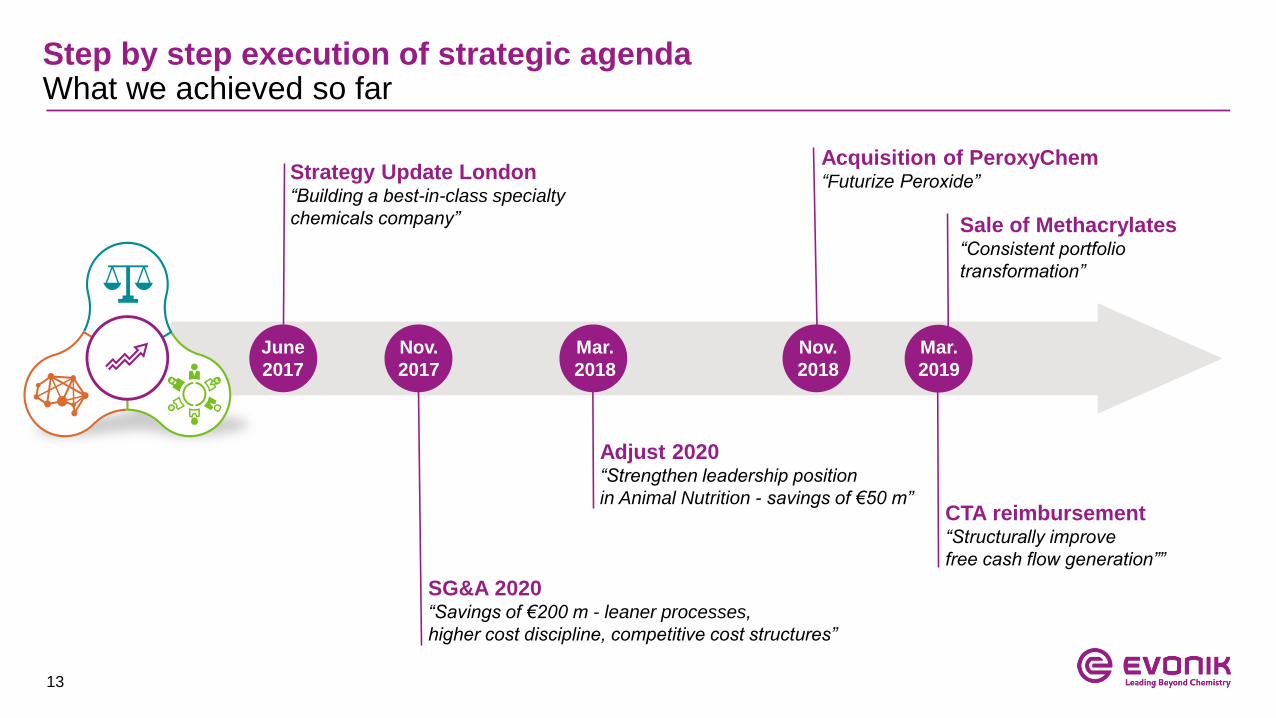
Step by step execution of strategic agendaWhat we achieved so far
Sale of Methacrylates“Consistent portfolio
transformation”
Adjust 2020“Strengthen leadership position
in Animal Nutrition - savings of €50 m”
June
2017
Nov.
2017
SG&A 2020“Savings of €200 m - leaner processes,
higher cost discipline, competitive cost structures”
Strategy Update London“Building a best-in-class specialty
chemicals company”
Acquisition of PeroxyChem“Futurize Peroxide”
Mar.
2018
Nov.
2018
CTA reimbursement“Structurally improve
free cash flow generation””
Mar.
2019

14
Active portfolio management More balanced and specialty with improved financial metrics
Acquisitions Divestments
APD Specialty Additives„Creating a global leader in Specialty & Coating Additives“
Huber Silica„Excellent complementary fit for resilient silica business“
Dr. Straetmans„Expansion as leading partner for the cosmetics industry”
PeroxyChem„Expansion of high-growth & -margin H2O2 specialty applications“
Jayhawk (non-core agrochemical site in PM)„Streamlining on business-line level”
MMA/PMMA Verbund„Major step towards a more specialty & balanced portfolio”
▪ Stable businesses with GDP+ growth
▪ EBITDA margin above target range
▪ CAPEX-light
▪ Sustained high cash conversion
▪ Supply/demand-driven cyclical businesses
▪ Margin and FCF volatility over the cycle
▪ CAPEX-intensive
15
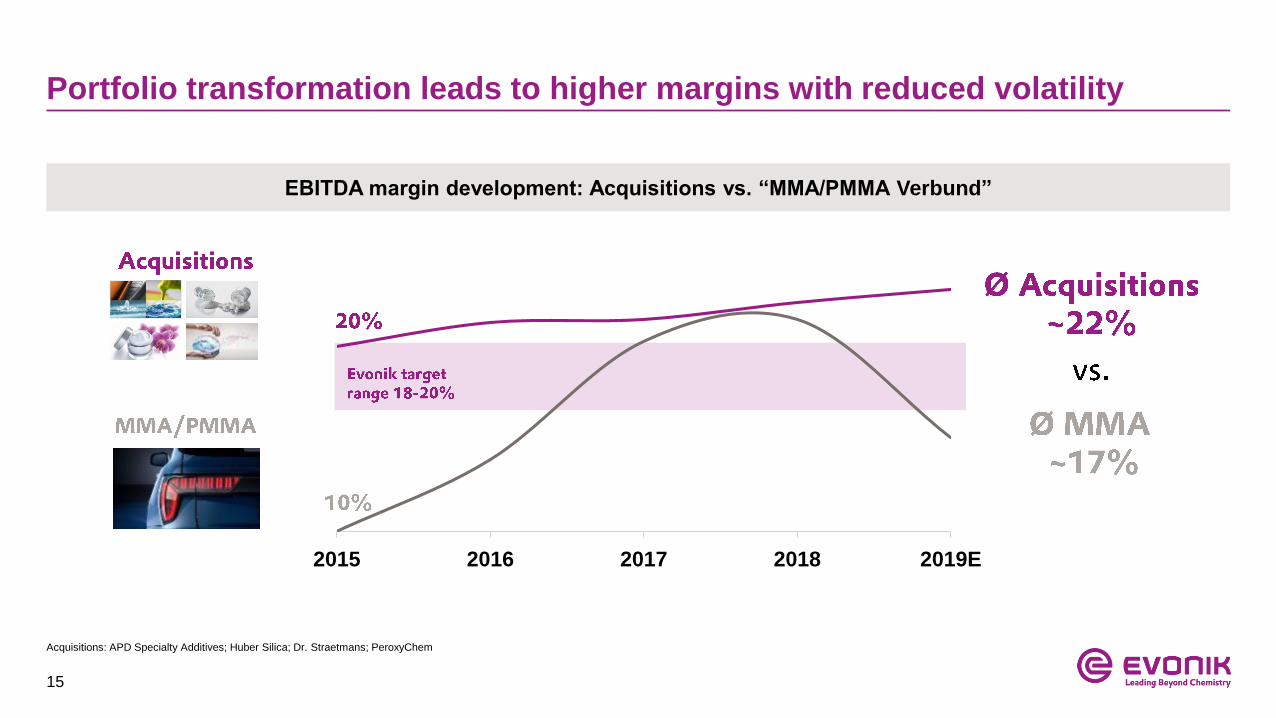
Portfolio transformation leads to higher margins with reduced volatility
2015 2016 20182017 2019E
EBITDA margin development: Acquisitions vs. “MMA/PMMA Verbund”
Acquisitions: APD Specialty Additives; Huber Silica; Dr. Straetmans; PeroxyChem

16
Portfolio development Asset-light shift towards specialties leads to margin uplift
PA12Processing PA12 product into powders suitable for highest needs in 3D
printing (additive manufacturing)
Omega 3 fatty acidsRepurposing fermenters of mature lysine business to produce high-end
algae based omega-3 fatty acids
H2O2Add purification stages to further transform base business into high-end
applications in electronics and environmental applications
Care SolutionsAligning the product portfolio and adapting the asset network to meet the
future requirements for a higher share of specialties
Asset-light shift towards specialty applications offers significant margin potential
Ma
rgin
po
ten
tia
l
Asset light

17
Strategic agenda reflected in ambitious financial targetsStructurally lifting EBITDA margin and driving balanced growth
Historic margin range (in %) Targets going forward (over the cycle)
15.5
16.2
2010 2011 2012 2013 2014 2015 2016 2017 2018 2019
ROCE above cost of capital
FCF significantly above dividend level
Reliable and sustainably growing dividend
Solid investment grade rating
18-20%Structurally lift EBITDA margin
into sustainably higher range of
16-18%GDP+Above-average volume growth
2017-2019: continued operations
16.4

18
Table of contents
1. Evonik at a glance
2. Strategy
3. Financials Q4/FY 2019
4. Appendix
19
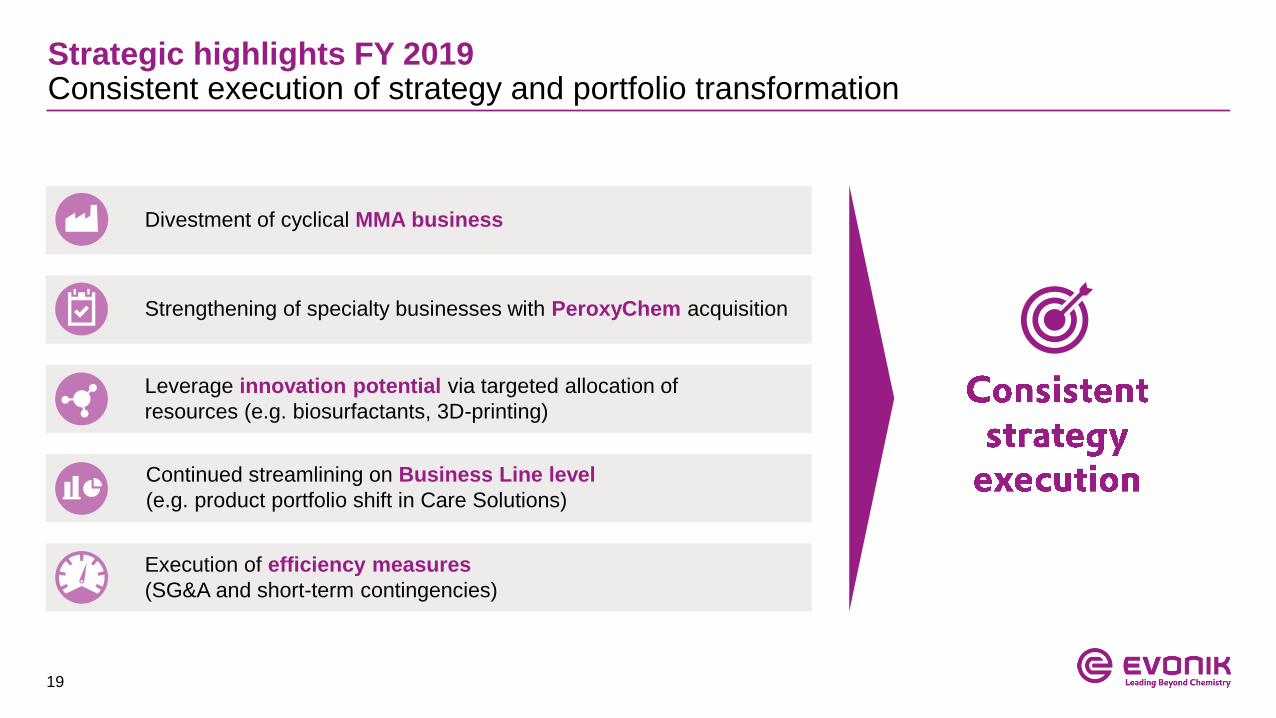
Strategic highlights FY 2019Consistent execution of strategy and portfolio transformation
Divestment of cyclical MMA business
Strengthening of specialty businesses with PeroxyChem acquisition
Execution of efficiency measures
(SG&A and short-term contingencies)
Leverage innovation potential via targeted allocation of
resources (e.g. biosurfactants, 3D-printing)
Continued streamlining on Business Line level
(e.g. product portfolio shift in Care Solutions)

20
FY 2019 – we delivered on our main financial targets
EBITDA EBITDA margin1 Free cash flow1 Dividend
1. Compared to prior year | 2. Free cash flow conversion (FCF/adj. EBITDA)
Delivering on guidance,
despite more difficult
macro environment
Improvement supported
by strict cost discipline
Clear improvement of
absolute FCF level
and cash conversion rate
Reliable and attractive
dividend at the top of the
chemicals industry

21
Successful efficiency measures also reflected in improved financial metrics
Admin expenses1
1. FY 2019 P&L compared to prior year | 2. FY 2019 P&L in % of sales compared to prior year
▪ Delivering SG&A savings faster than planned
▪ accelerated phasing in 2019: €70 m savings realized
▪ Measures for remaining €80 m in 2020 defined and in
implementation
▪ Program will be fully realized in 2020 (initial plan: 2021)
▪ FTEs reduced by ~600 → fully on track for targeted 1,000
R&D expenses ▪ More targeted R&D approach and focus on innovation growth fields
▪ Sales of the innovation growth fields are fully on track
(>€300 m in 2019; target >€1 bn by 2025)
Selling expenses1
22
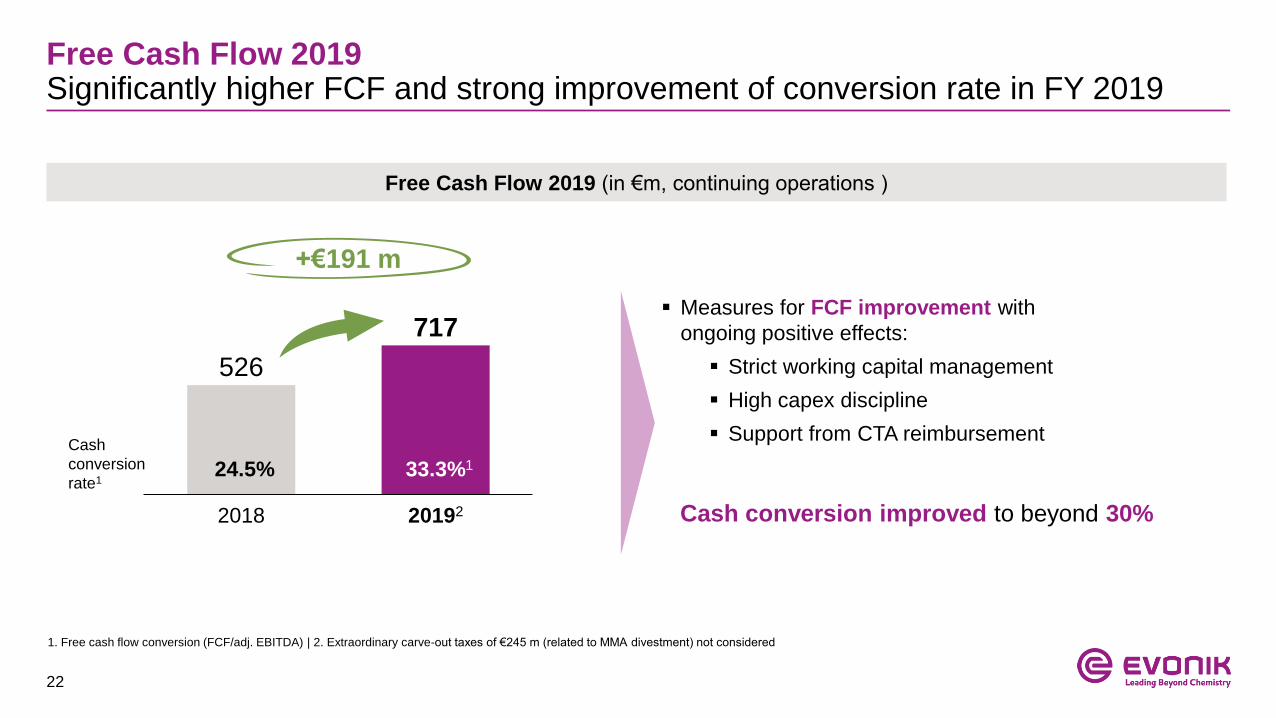
Free Cash Flow 2019Significantly higher FCF and strong improvement of conversion rate in FY 2019
526
717
201922018
Free Cash Flow 2019 (in €m, continuing operations )
▪ Measures for FCF improvement with
ongoing positive effects:
▪ Strict working capital management
▪ High capex discipline
▪ Support from CTA reimbursement
Cash conversion improved to beyond 30%
+€191 m
33.3%124.5%
Cash
conversion
rate1
1. Free cash flow conversion (FCF/adj. EBITDA) | 2. Extraordinary carve-out taxes of €245 m (related to MMA divestment) not considered
23
Resource EfficiencyResilient business performance supported by license income
Sales (in € m) Adj. EBITDA (in € m) / margin (in %)
▪ Difficult market environment for auto and coatings businesses
continued, visible in declining volume
▪ High margin level due to continued solid pricing, cost savings
and license income in Active Oxygen business (~€40 m)
▪ Oil Additives, High Performance Polymers and Crosslinkers with
resilient performance throughout the year
Q4 19
vs. Q4 18
Volume Price FX Other
-4% +/-0% +1% +2%
23.017.5 22.3 23.2
18.7 21.8 21.8
FY 18Q1 19Q4 18 Q2 19 Q3 19 Q4 19
1,445
FY 19
1,4381,402 1,414 1,387
5,708 5,685-1%
0%
256330 326 322 314
Q4 18 Q4 19Q1 19 Q2 19 Q3 19 FY 18 FY 19
1,283 1,290+23%
+1%
22.818.3 22.9 22.6 22.6 22.5 22.7
→

24
Nutrition & Careyoy earnings growth in Q4, price pressure in Animal Nutrition fading out
Sales (in € m) Adj. EBITDA (in € m) / margin (in %)
▪ For the first time in 2019, Nutrition & Care with yoy earnings
growth in Q4
▪ High volumes in Animal Nutrition continue to be mitigated by
planned shift from bulk to specialty products (in Care Solutions and
for Veramaris JV)
▪ Strong finish in Care Solutions and Health Care
▪ Methionine with ongoing strong volumes and sequentially almost
stable pricing
19.1 16.8 17.0 16.7
Q4 19
vs. Q4 18
Volume Price FX Other
+1% -5% +1% +2%
15.4 23.3 16.6
FY 18Q4 18 Q1 19
1,149
Q2 19 Q3 19 Q4 19 FY 19
1,131 1,1381,172 1,163
4,646 4,582-1%
-1%
167 180 190 188 170
Q2 19Q4 18 Q4 19Q1 19 Q3 19 FY 18 FY 19
810
728+2%
-10%
14.2 15.7 16.8 16.5 14.6 17.4 15.9

25
Performance MaterialsUnusual high number of one-offs impacting FY earnings level
Sales (in € m) Adj. EBITDA (in € m) / margin (in %)
506 520 553 475 495
Q4 18 Q1 19 Q2 19 Q3 19 Q4 19 FY 18 FY 19
2,2332,043-2%
-9%
▪ As guided, Q4 with ~€10 m negative impact from compressor
failure in C4 businesses (Q4 2018 with ~€20 negative effect from
low Rhine water levels)
▪ Higher volumes, as prior year was burdened by low Rhine water
level and limited raw material availability
▪ Price decline due to yoy weaker Butadiene and INA spreads
▪ Functional solutions holding up well due to persistent high
demand for alkoxides
46 5374
47 50
239
Q1 19Q4 18 Q2 19 Q3 19 Q4 19 FY 18 FY 19
224+9%
-6%
9.99.1 10.2 13.4
Q4 19
vs. Q4 18
Volume Price FX Other
+9% -14% +3% +/-0%
10.1 10.7 11.0
→

26
Outlook 2020: Adj. EBITDA
▪ Assumption of ongoing low growth
environment in 2020
▪ Outlook includes PeroxyChem (11 months)
▪ Specialty businesses expected to grow
▪ Performance Materials with challenging price
environment
▪ Further execution of efficiency measures2019
€2,153 m
2020E

27
Indications 2020 on Segment level
Resource Efficiency Nutrition & Care Performance Materials
▪ Resilient performance expected for
majority of businesses
▪ Lower growth in Auto-related end
markets to continue
▪ High level of license income will not
reoccur in 2020
▪ 11 months contribution from PXC
▪ Resilience and earnings growth
expected for Health & Care
▪ Strong volumes and assumption of
stable Methionine price (yoy annual
average)
▪ Lower earnings contribution from
Baby Care
▪ Continued price weakness leading to
lower product spreads year-on-year
▪ Negative impact from limited raw
material supply and plant outages
should not reoccur
Earnings at least stable Slightly higher earnings Stable to slightly lower earnings
28
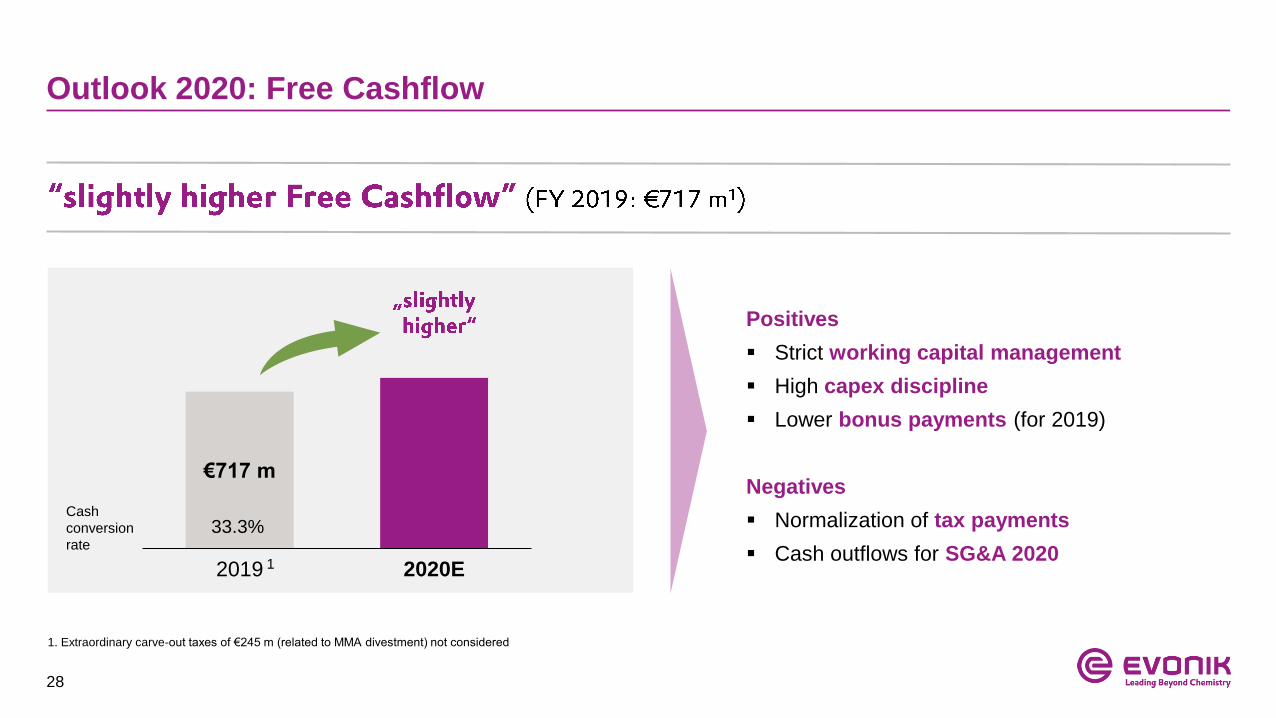
Outlook 2020: Free Cashflow
€717 m
2020E2019 1
Positives
▪ Strict working capital management
▪ High capex discipline
▪ Lower bonus payments (for 2019)
Negatives
▪ Normalization of tax payments
▪ Cash outflows for SG&A 2020
1. Extraordinary carve-out taxes of €245 m (related to MMA divestment) not considered
Cash
conversion
rate
33.3%

29
Structure follows strategy:
Logical evolution of defined growth engines into divisional structure
New divisional structure – the next logical step in our portfolio transformationClear benefits of new divisional structure
▪ Clearly defined strategic roles
▪ Higher transparency
▪ Easier-to-understand and to model (common themes, drivers & end markets for each division)
▪ Smoother internal management (e.g. technology platforms assigned to single divisions)

30
New Divisional Setup
New divisional structure – the next logical step in our portfolio transformationConsequent evolution of our growth engines into new divisions
Specialty Additives Nutrition & Care Smart Materials Performance Materials
Sustainable solutions for
consumer markets,
particularly in
pharmaceutical, personal
care, and nutrition industries
Quarterly sales for sub-
divisions “Animal Nutrition”
and “Health & Care”
Broad spectrum of
performance-defining
additives making the
key difference in industrial
applications for coatings,
polyurethane foam &
lubricants
Innovative materials for
resource-saving solutions
and the replacement of
conventional materials
Quarterly sales for sub-
divisions “Inorganics” and
“Polymers”
Leading platforms with
efficient processes for
production of intermediates
and superabsorbent
polymers
▪ Coating additives
▪ PU additives
▪ Lubricant additives
▪ Amino acids
▪ Active ingredients
▪ Drug delivery systems
▪ Silica / Silanes
▪ H2O2
▪ PA12
▪ Catalysts
▪ C4 derivatives
▪ Superabsorbers
Ke
y
pro
du
cts
Po
rtra
it

31
Timeline for implementation of new divisional structure
▪ Deep-dive into
new divisions
▪ Restated financials
▪ Reporting and outlook in
old segment structure
▪ No changes to current
setup
▪ Reporting in old segment
structure
▪ Segment outlook
transferred into
division outlook
▪ Reporting in new
divisional structure
April
Capital Markets
Day 2020
May
1st quarter
reporting 2020
August
2nd quarter
reporting 2020
November
3rd quarter
reporting 2020
32
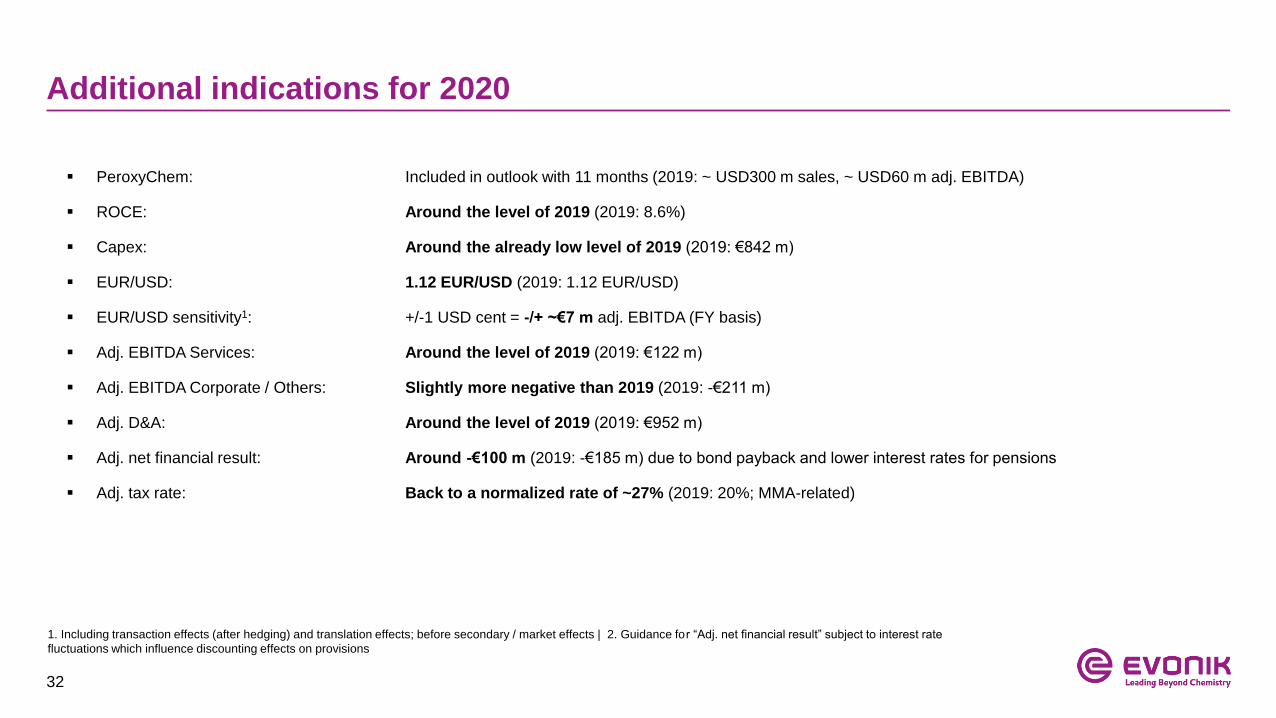
Additional indications for 2020
1. Including transaction effects (after hedging) and translation effects; before secondary / market effects | 2. Guidance for “Adj. net financial result” subject to interest rate
fluctuations which influence discounting effects on provisions
▪ PeroxyChem: Included in outlook with 11 months (2019: ~ USD300 m sales, ~ USD60 m adj. EBITDA)
▪ ROCE: Around the level of 2019 (2019: 8.6%)
▪ Capex: Around the already low level of 2019 (2019: €842 m)
▪ EUR/USD: 1.12 EUR/USD (2019: 1.12 EUR/USD)
▪ EUR/USD sensitivity1: +/-1 USD cent = -/+ ~€7 m adj. EBITDA (FY basis)
▪ Adj. EBITDA Services: Around the level of 2019 (2019: €122 m)
▪ Adj. EBITDA Corporate / Others: Slightly more negative than 2019 (2019: -€211 m)
▪ Adj. D&A: Around the level of 2019 (2019: €952 m)
▪ Adj. net financial result: Around -€100 m (2019: -€185 m) due to bond payback and lower interest rates for pensions
▪ Adj. tax rate: Back to a normalized rate of ~27% (2019: 20%; MMA-related)

33

34
Appendix
1. Strategy Details
2. Segment overview
3. Financials
4. Upcoming events
35
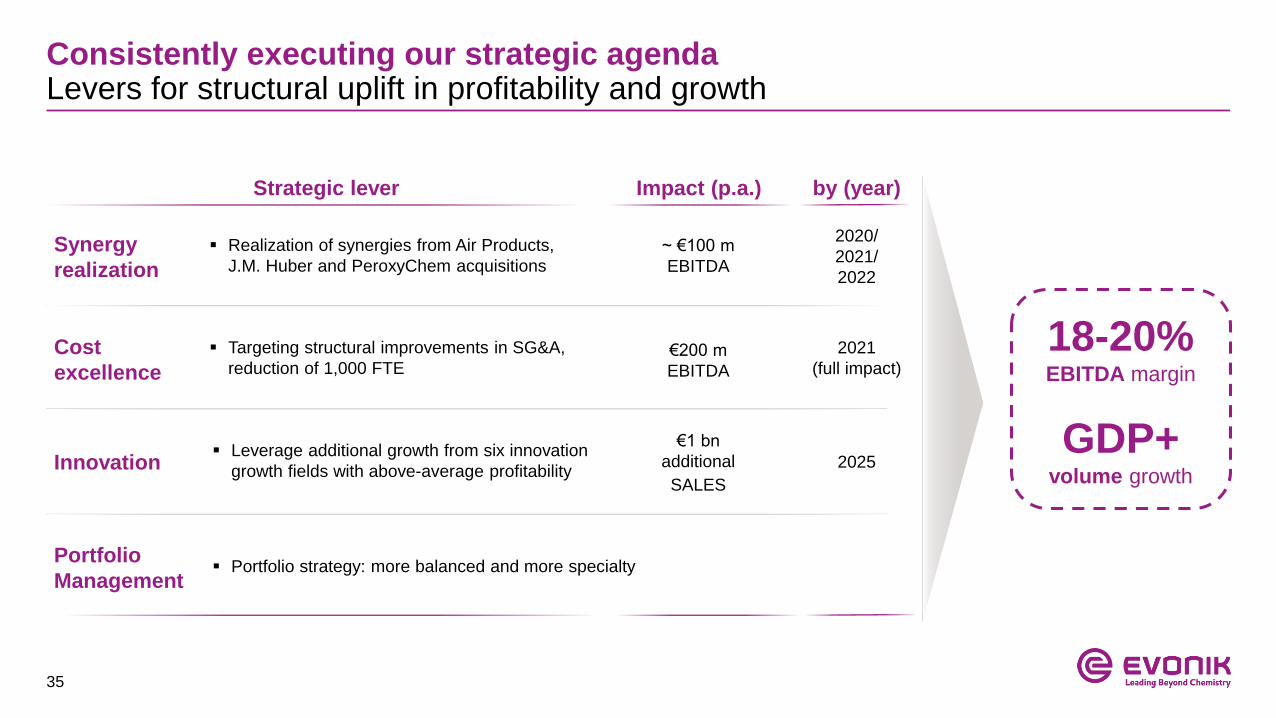
Consistently executing our strategic agenda Levers for structural uplift in profitability and growth
Cost
excellence
Innovation
Portfolio
Management
Synergy
realization
by (year)
▪ Realization of synergies from Air Products,
J.M. Huber and PeroxyChem acquisitions
▪ Targeting structural improvements in SG&A,
reduction of 1,000 FTE
▪ Leverage additional growth from six innovation
growth fields with above-average profitability
▪ Portfolio strategy: more balanced and more specialty
Impact (p.a.)
~ €100 m
EBITDA
€200 m
EBITDA
€1 bn
additional
SALES
Strategic lever
2020/
2021/
2022
2021
(full impact)
2025
18-20%EBITDA margin
GDP+volume growth

36
Four growth enginesGrowth drivers and product examples
Health & CarePreferred partner in Pharma
and Cosmetics
Smart MaterialsTailored functionalities for
sustainable solutions
Animal NutritionComprehensive portfolio for
more sustainable food chain
Specialty Additives“Small volume, big impact”
Growth trends and drivers Market growth
5-7%
5-6%
5-6%
4-7%
▪ More sophisticated requirements on additive effects
▪ Need for increased product performance and
efficiency
▪ Increasing health-awareness and lifestyle
▪ Bio based products and environmentally-safe
cosmetics
▪ Trend towards resource efficiency in high
demanding applications
▪ Engineered materials and systems to fulfill high
performance requirements
▪ Sustainable nutrition
▪ Improving food quality and safety
Product examples
Coating Additives
PU-Additives
Oil Additives
Pharma polymers
Oleochemicals
Advanced biotechnology
Rubber Silica & Silanes
High Performance Polymers
Membranes
Amino acids
Probiotics

37
Portfolio Management Targeted and disciplined M&A approach
Air ProductsPerformance Materials (2017)
Huber Silica(2017)
PeroxyChem(2020)
Business Highly attractive strategic fit, seamless integration into existing businesses
Purchase price ~ €3.5 bn ~ €600 m $640 m
EBITDA margin >20% >20% ~20%
Market growth ~4-5% ~4-6% ~6%1
Disciplined expansion in high-growth & -margin businesses with excellent strategic fit
Dr. Straetmans(2017)
€100 m
~20%
~10%
1. In specialty applications (~65% of total Adj. EBITDA) | 2. EV/EBITDA pre / post synergies & tax benefits
Multiple215.2x / 9.9x 10.5x / 7x 9.9x / 7.6x(not disclosed)
38
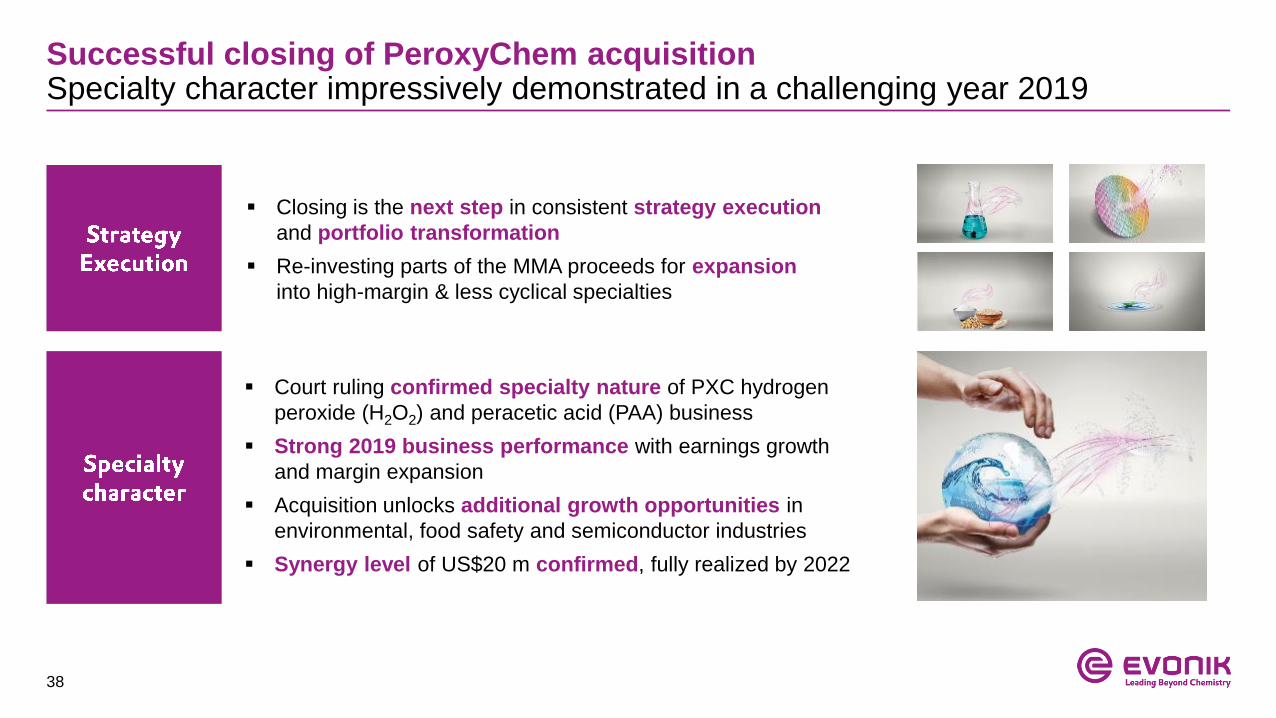
Successful closing of PeroxyChem acquisitionSpecialty character impressively demonstrated in a challenging year 2019
▪ Court ruling confirmed specialty nature of PXC hydrogen
peroxide (H2O2) and peracetic acid (PAA) business
▪ Strong 2019 business performance with earnings growth
and margin expansion
▪ Acquisition unlocks additional growth opportunities in
environmental, food safety and semiconductor industries
▪ Synergy level of US$20 m confirmed, fully realized by 2022
▪ Closing is the next step in consistent strategy execution
and portfolio transformation
▪ Re-investing parts of the MMA proceeds for expansion
into high-margin & less cyclical specialties

39
EBITDA margin of ~20% above Evonik’s average group margin
Strong FCF generation with sustainable FCF conversion >60%
Strengthening of Evonik’s growth segment Resource Efficiency✓
✓
✓
✓
✓
✓
PeroxyChem acquisition highlights
Attractive end-market growth with low cyclicality
Fair valuation with EV / adj. EBITDA multiple 7.8x (incl. synergies) ✓
Excellent fit with Evonik’s peroxide portfolio – expansion of business in North America
Focus on environmentally-friendly specialty applications

40
Acquisition of PeroxyChemExcellent complementary fit with Evonik’s existing peroxide business
Evonik Business Line Active Oxygens PeroxyChem’s peroxide portfolio
1. Sales of Evonik Business Line Active Oxygen and PeroxyChem
Standard Business
Specialties
HPPO
Standard Business
HPPO
Combined sales1: > €700 m
3% p.a.
6% p.a.
Market
growth
PAASpecialties
PAA
H2O2 H2O2

41
Attractive peroxide applicationsFocus on specialty applications with strong secular growth drivers
Industry Environmental Electronics Food & Beverage Other specialties Process Chemicals
Application
fields
▪ Solutions for waste water
treatment, soil remediation
and groundwater treatment
▪ H2O2 and PAA as
alternative to chlorine
▪ Ultra-pure hydrogen
peroxide as cleaning agent
in semiconductor Fabs
▪ PAA as disinfectant in
poultry & beef processing
▪ Aseptic packaging with
H2O2 and PAA
▪ Medical, consumer and
personal care applications
such as sterilization of
medical equipment and
contact lens solutions
▪ Energy: Persulfates and
PAA in hydraulic fracturing
▪ Hydrogen peroxide
for pulp and paper
processing
▪ H2O2 and PAA in
chemical synthesis
Growth
driver
▪ Stricter environmental
regulations
▪ Redevelopments of former
industrial or military sites
▪ Growth of mobile devices
▪ Automatization and
digitalization
▪ Stronger regulations for
food safety
▪ Increased demand for
convenient packaged food
▪ Increased regulations on
cosmetic and care products
for high purity grades
▪ Rising domestic oil and
natural gas production
▪ Customer need for
increased high
product quality and
supply security
Growth 5-6% p.a. >7% p.a. 4-6% p.a. 3-5% p.a. 3% p.a.
Specialties

42
Evonik and PeroxyChem specialty exposureExpansion of high-growth and -margin specialty applications
Evo
nik
Bu
sin
ess L
ine
Acti
ve O
xyg
en
s Standard applications Specialty applications
EBITDA
Combined peroxide portfolio with
higher specialty exposure
Pero
xyC
hem
pero
xid
e p
ort
folio Standard applications Specialty applications
EBITDA
Standard
application
Share of
specialty business
increasing from
~50% to ~65%
Combined specialty applications Evonik and PeroxyChem
EBITDA
43
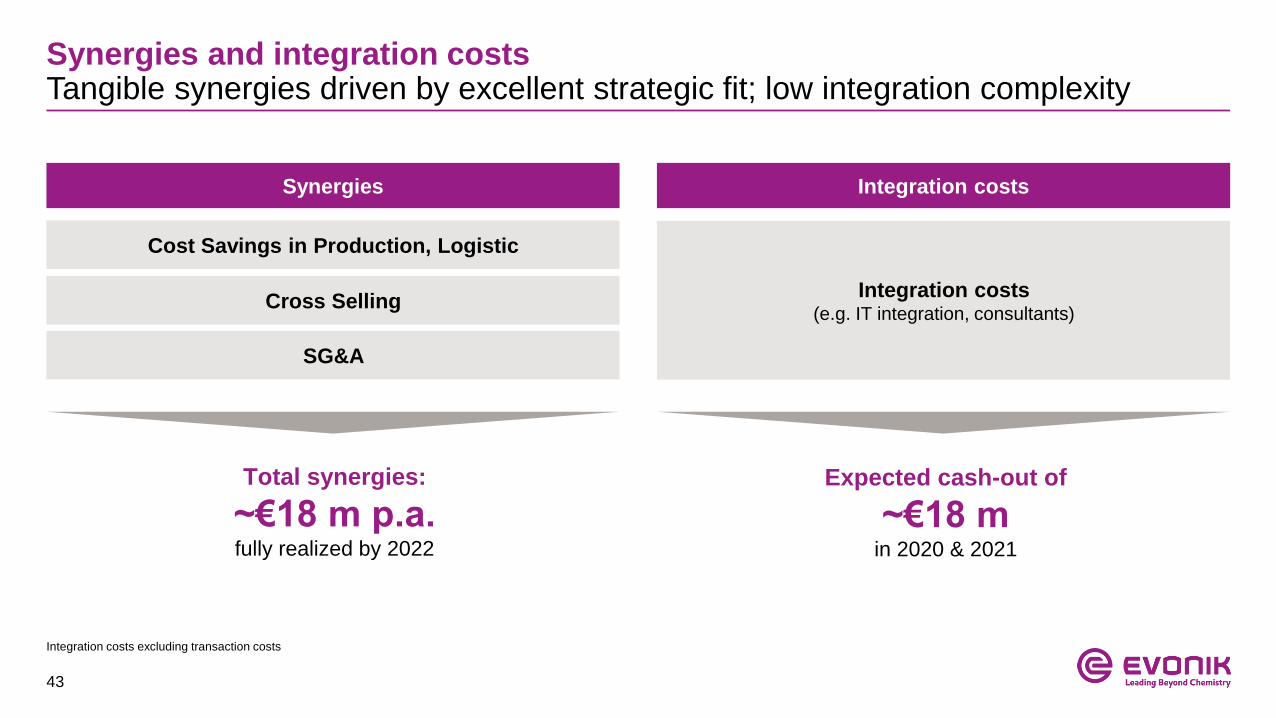
Synergies and integration costsTangible synergies driven by excellent strategic fit; low integration complexity
Cost Savings in Production, Logistic
Total synergies:
~€18 m p.a.fully realized by 2022
Synergies
Cross Selling
SG&A
Integration costs
Integration costs(e.g. IT integration, consultants)
Expected cash-out of
~€18 m in 2020 & 2021
Integration costs excluding transaction costs
44
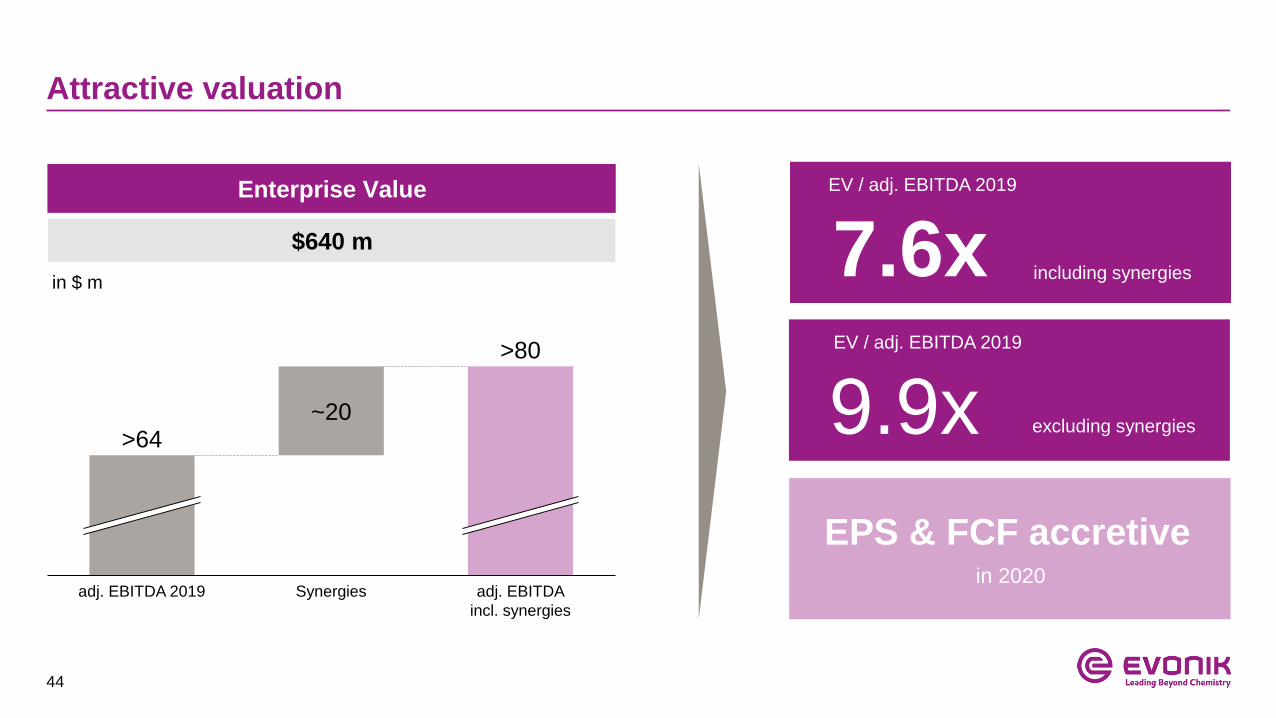
Attractive valuation
Enterprise Value
adj. EBITDA 2019
~20
>80
Synergies adj. EBITDA
incl. synergies
>64
$640 m
10.6x
7.6xEV / adj. EBITDA 2019
including synergies
9.9xEV / adj. EBITDA 2019
excluding synergies
EPS & FCF accretivein 2020
in $ m
45
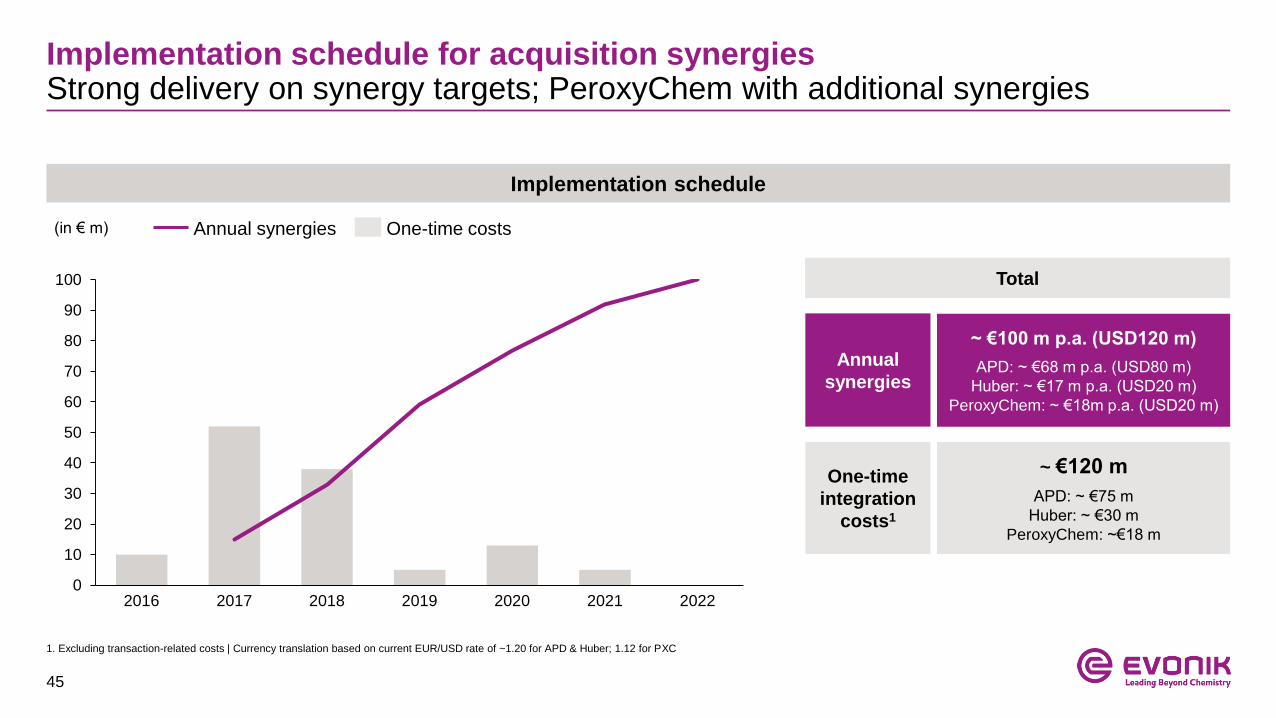
Implementation schedule for acquisition synergiesStrong delivery on synergy targets; PeroxyChem with additional synergies
Implementation schedule
(in € m)
One-time
integration
costs1
Annual
synergies
Total
~ €100 m p.a. (USD120 m)
APD: ~ €68 m p.a. (USD80 m)
Huber: ~ €17 m p.a. (USD20 m)
PeroxyChem: ~ €18m p.a. (USD20 m)
~ €120 m
APD: ~ €75 m
Huber: ~ €30 m
PeroxyChem: ~€18 m
Annual synergies One-time costs
1. Excluding transaction-related costs | Currency translation based on current EUR/USD rate of ~1.20 for APD & Huber; 1.12 for PXC
0
10
20
30
40
50
60
70
80
90
100
20192016 2017 2018 2020 2021 2022

46
SG&A 2020 – progressing faster than expected Full saving potential already realized by end of 2020
50 50
80
20
2019 20212018 2020
50 50 60
2018
+20
2019 2020
+20
(SG&A savings p.a. in €m)
As a
nn
ou
nced
N
ew
ph
asin
g
(SG&A savings p.a. in €m)
Nutrition
& Care
Resource
Efficiency
Corp. &
Servicessavings
already realized
by end of 2020
Perf.
Materials
47
Recent cost initiatives Program to achieve cost excellence in admin and selling initiated
2008 2016 2018 2020
On Track
Administration Excellence
€500 m
Measures with savings potential
>€200 m implemented
Project focus, e.g.:
implementation of Service Hubs,
SAP harmonization, etc.
Selling, General
& Admin
Production,
Technology &
Procurement
Scope Cost initiative
>€600 m
On Track organization
transferred into a
continuous factor cost
compensation program
~€120 m
p.a.
€200 m by end of 2020
On Track 2.0
SG&A 2020
Focus on all admin and selling functions

48
Leading in InnovationInnovation growth fields with tangible size already today – strong growth ahead
Innovation Growth Fields Sales contribution
Additional contribution to sales from
Innovation Growth Fields
Advanced
Food Ingredients
Cosmetic
Solutions
Healthcare
Solutions
Additive
Manufacturing
Membranes
Sustainable
Nutrition
202520182015

49
New corporate values
• Guidelines for cultural change
• Introduced in September 2018, now drilled down
into the organization
New performance management system
• Leaner process and strict alignment with Group financial
targets on all levels
• Reach goals together rather than individually and in silos
• Clearer differentiation of individual performance levels
• Implemented since 2019
Open & performance-oriented cultureNew corporate values and performance management system

50
Appendix
1. Strategy Details
2. Segment overview
3. Financials
4. Upcoming events
51
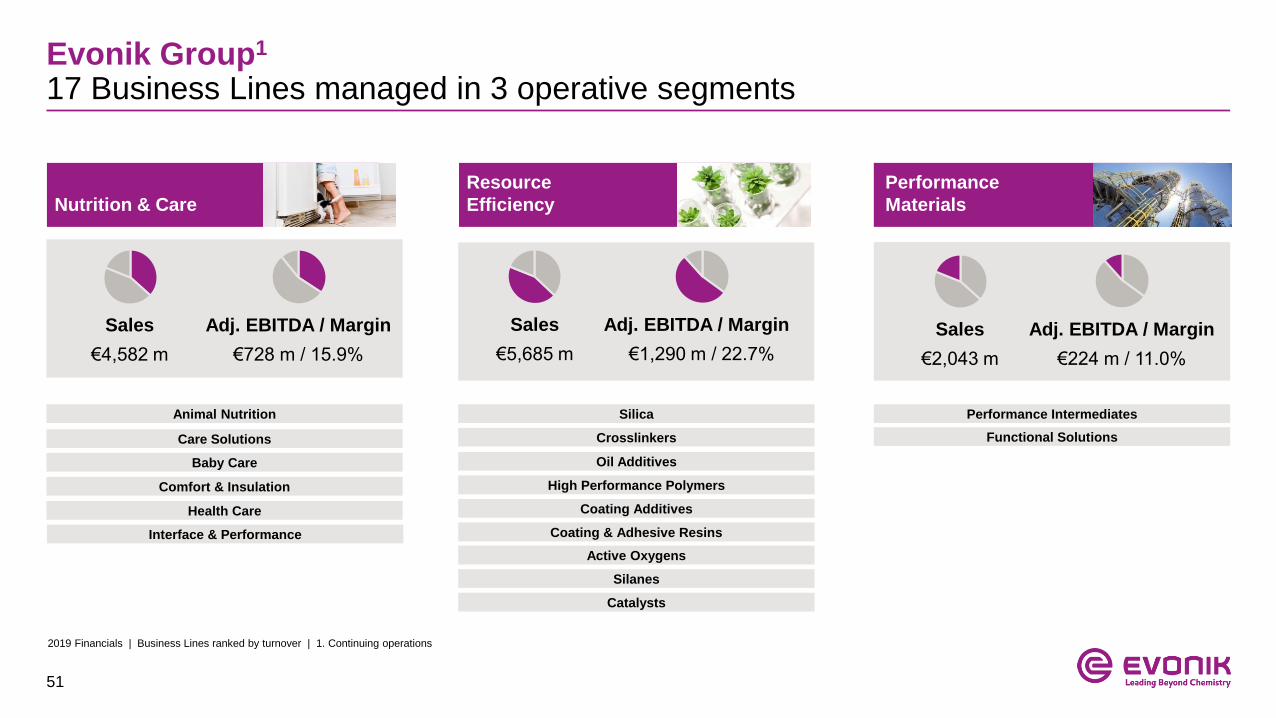
Evonik Group1
17 Business Lines managed in 3 operative segments
Animal Nutrition
Baby Care
Comfort & Insulation
Health Care
Interface & Performance
Silica
Crosslinkers
Oil Additives
High Performance Polymers
Coating Additives
Active Oxygens
Silanes
Catalysts
Performance Intermediates
2019 Financials | Business Lines ranked by turnover | 1. Continuing operations
Nutrition & Care
Resource
Efficiency
Performance
Materials
€4,582 m €728 m / 15.9%
Sales Adj. EBITDA / Margin
€5,685 m €1,290 m / 22.7%
Sales Adj. EBITDA / Margin Sales
€2,043 m
Adj. EBITDA / Margin
€224 m / 11.0%
Functional SolutionsCare Solutions
Coating & Adhesive Resins
52
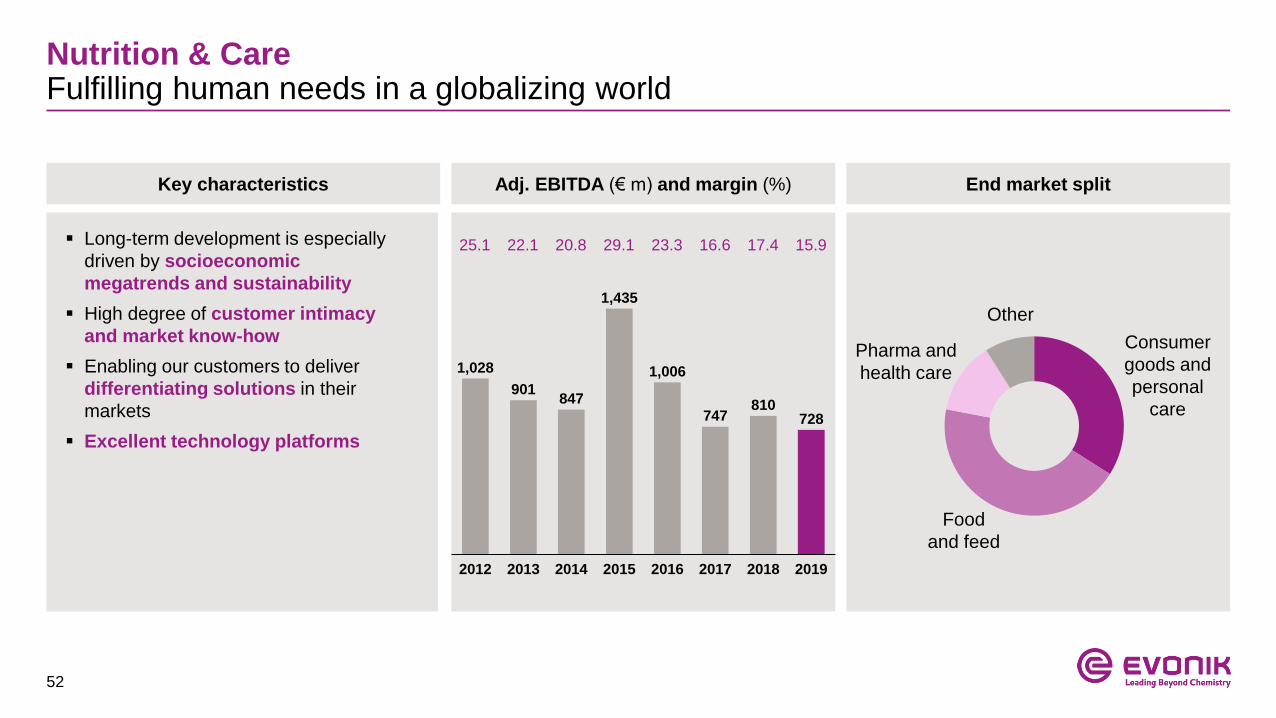
Key characteristics Adj. EBITDA (€ m) and margin (%) End market split
901847
747810
728
2018201420132012 2015 2016 2017 2019
1,435
1,028 1,006
16.625.1 20.8 29.1
Consumer
goods and
personal
care
Food
and feed
Other
Pharma and
health care
Nutrition & CareFulfilling human needs in a globalizing world
▪ Long-term development is especially
driven by socioeconomic
megatrends and sustainability
▪ High degree of customer intimacy
and market know-how
▪ Enabling our customers to deliver
differentiating solutions in their
markets
▪ Excellent technology platforms
23.3 17.422.1 15.9

53
Nutrition & CareSelected growth trends and products examples
With RHEANCE ®, we offer a
multifunctional solution for gentle
cleansing enabling 100% biodegradable
skin and hair care products
Growth example
Growth example
Growth example
Growth example
With smart drug delivery systems
like EUDRAGIT ®, active
ingredients get to where
they are needed in the body
Nutrition & Care produces specialty chemicals, principally for use in consumer goods
for daily needs, in animal nutrition and in healthcare products
With our amino acids and probiotics,
we have an extensive offering of
solutions for sustainable healthy
nutrition of animals
With our innovative additives
based on organically modified
silicones like TEGOSTAB ®
mattresses are more flexible

54
Nutrition & Care – VeramarisConserving marine life in the ocean: Omega-3 fatty acids from natural marine algae
Strong consumer-pull for sustainable salmon products
▪ Product
and used by the
largest salmon farmers in Norway and Chile
▪ First Veramaris-fed salmon
across Europe
Next targets 2020:
▪ Entering the
▪ Intensifying consumer-pull through further
and

55
Biosurfactants are the next game changer in Evonik’s innovation portfolioLarge-scale production of world’s first “green” biosurfactant (rhamnolipids)
A unique process resulting in a unique product
Introduction for selected
personal care products
RHEANCE®
One awarded at in-cosmetics
global 2018
Successful launch of first cleaning agent
2020: Investment decision for a world
scale plant to support scaling
globally
20202019
▪ 100% renewable natural resource & biodegradable
▪ Plant based sugars as only carbon source – no oils used
▪ Unique product properties, especially cleansing & foaming
(comparable products usually made from petrochemicals)
▪ → First large-scale biosurfactant for cosmetics and cleaning
Commercialization to capture future growth
▪ Unilever has successfully launched a product in Chile in 2019
▪ Next step in commercializing Evonik’s leading biotechnology
capabilities: designs of a global scale production plant
▪ Evonik will be the first company to produce biosurfactants on
industrial scale with focus on attractive markets in personal and
home care
2017 2018
SugarsFermentation
Biosurfactants
(rhamnolipids)cosmetics &
cleaning agents
Raw
materials
56
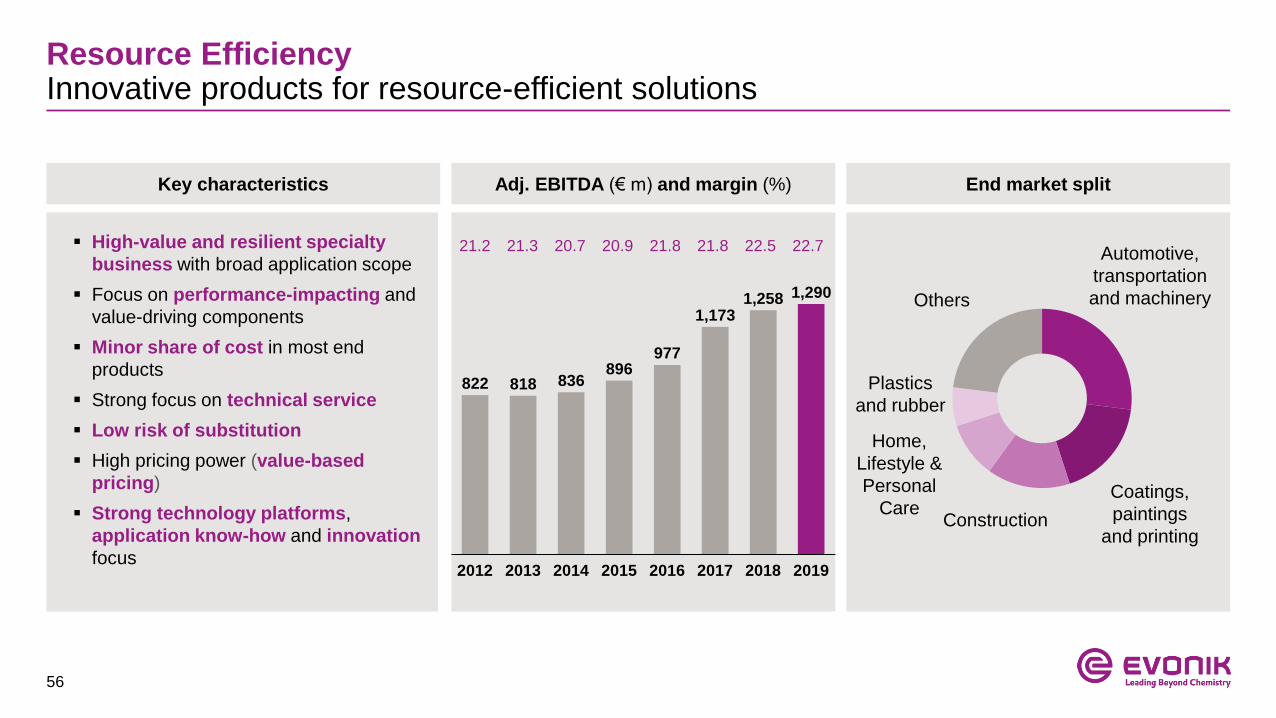
822 818 836896
977
20182012 2013 2014 20192015 2016 2017
1,1731,258 1,290
Resource EfficiencyInnovative products for resource-efficient solutions
Key characteristics Adj. EBITDA (€ m) and margin (%) End market split
Others
▪ High-value and resilient specialty
business with broad application scope
▪ Focus on performance-impacting and
value-driving components
▪ Minor share of cost in most end
products
▪ Strong focus on technical service
▪ Low risk of substitution
▪ High pricing power (value-based
pricing)
▪ Strong technology platforms,
application know-how and innovation
focus
21.821.2 21.3 20.7 20.9 Automotive,
transportation
and machinery
Construction
Coatings,
paintings
and printing
21.8
Plastics
and rubber
Home,
Lifestyle &
Personal
Care
22.722.5

57
Resource EfficiencySelected growth trends and products examples
With our purely mineral and fully
recycable insulation material
CALOSTAT ®, we insulate houses
efficiently
Growth example
Growth example
Growth example
Growth example
With high performance polymers
like ROHACELL® or Polyamid 12,
we make for example airplanes or
cars lighter
Resource Efficiency provides environment-friendly and energy-efficient system solutions,
mainly for the automotive sector and for the paints, coatings and construction industries
With our ULTRASIL® Silica/Silane
technology, we reduce the rolling
resistance of tires and help to
save fuel
With our waterborne and TEGO ®
applications, we make coatings
environmentally friendly
58
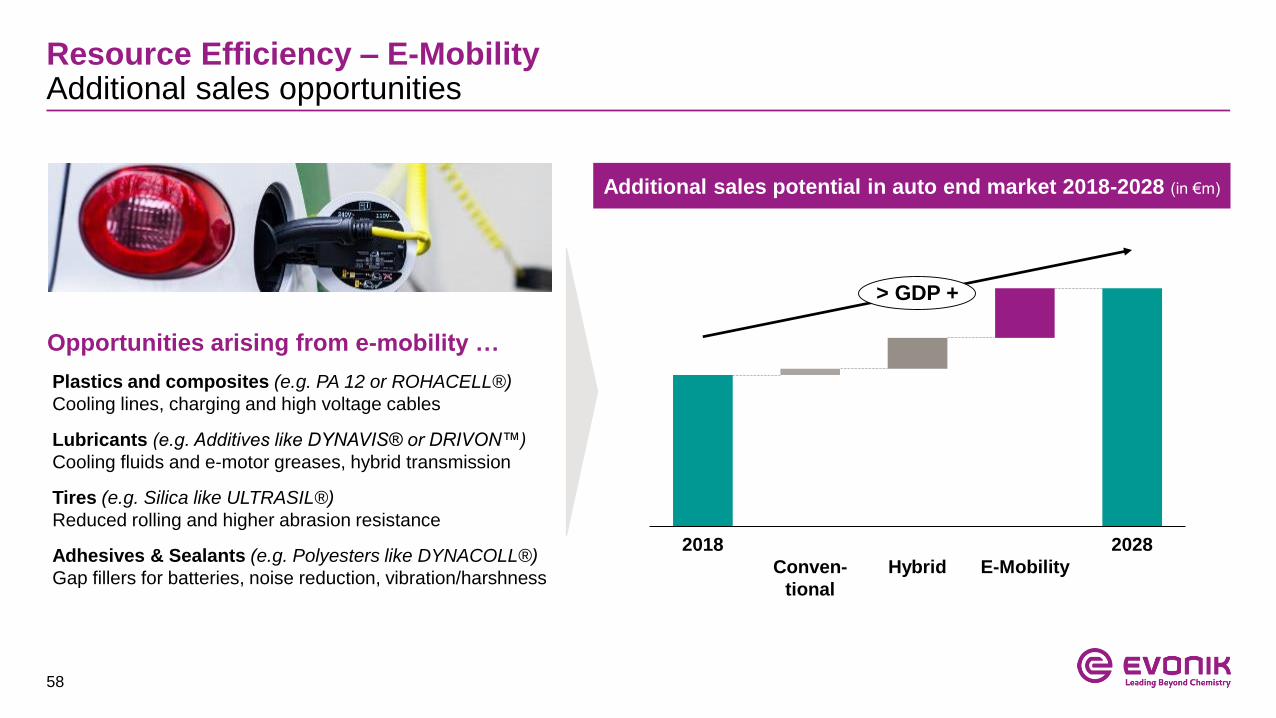
Resource Efficiency – E-MobilityAdditional sales opportunities
Additional sales potential in auto end market 2018-2028 (in €m)
Opportunities arising from e-mobility …
Plastics and composites (e.g. PA 12 or ROHACELL®)
Cooling lines, charging and high voltage cables
Lubricants (e.g. Additives like DYNAVIS® or DRIVON™)
Cooling fluids and e-motor greases, hybrid transmission
Tires (e.g. Silica like ULTRASIL®)
Reduced rolling and higher abrasion resistance
Adhesives & Sealants (e.g. Polyesters like DYNACOLL®)
Gap fillers for batteries, noise reduction, vibration/harshness
cathodes and anodes
2018 2028
Conven-
tional
Hybrid E-Mobility
> GDP +

59
Performance Materials Integrated production platforms forefficientproductionof rubberandplastic intermediates
Key characteristics
Key products
Adj. EBITDA1 (€ m) and margin1 (%) End market split
▪ Strong integrated production platforms
▪ Leading cost positions
▪ Favorable raw material access
▪ Focus on continuous efficiency
improvements
▪ High degree of supply reliability
▪ Butadiene for synthetic
rubber
▪ MTBE as fuel additive
▪ Alkoxides for biodiesel and
life-science products
404
325 309
371
658
239 224
20162013 2014 20172015 20192018
17.510.6 8.5 9.0 11.4 10.7
1. 2017- 2019: restated for continuing operations (excluding methacrylates)
Plastic &
Rubber
Automotive
Plasticizer
Specialties
Others
11.0

60
Appendix
1. Strategy Details
2. Segment overview
3. Financials
4. Upcoming events
61
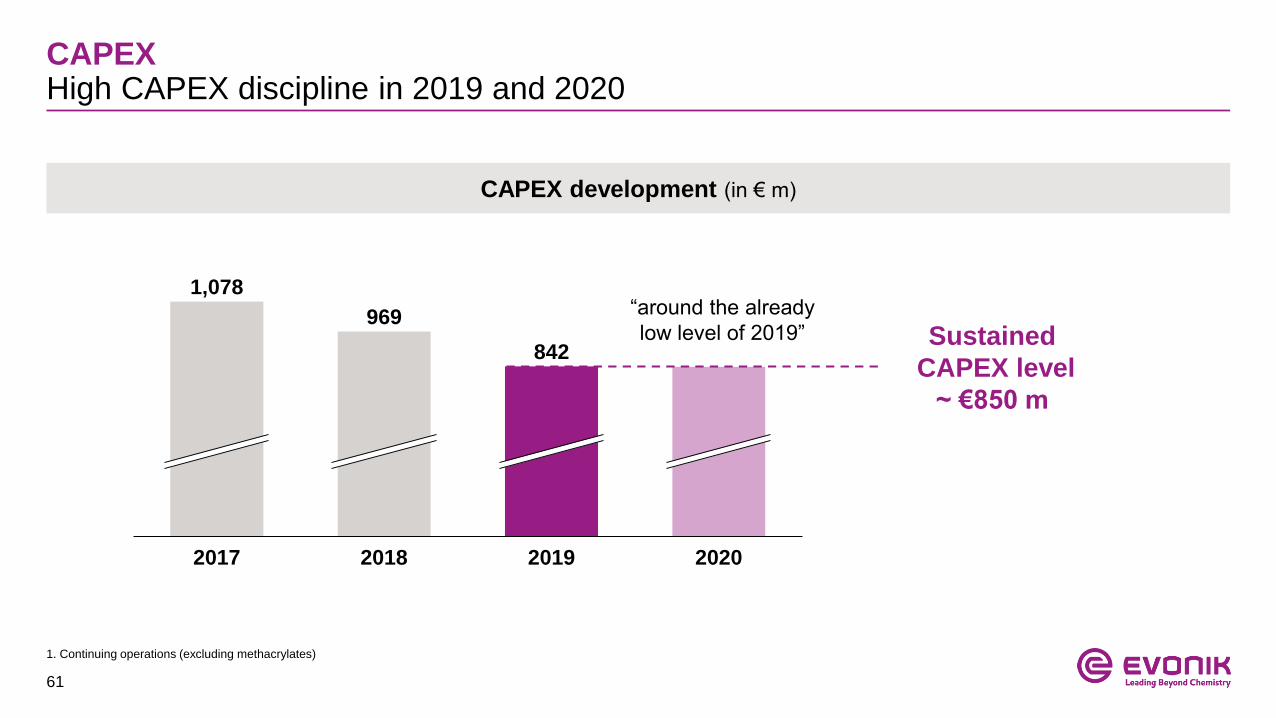
CAPEX High CAPEX discipline in 2019 and 2020
1,078
2017 2018 2019 2020
969
842Sustained
CAPEX level
~ €850 m
CAPEX development (in € m)
1. Continuing operations (excluding methacrylates)
“around the already
low level of 2019”

62
Funding level at ~ 70%
Pension fund /
reinsured support
fund
Funded through
Evonik CTA
30%
30%
10%
30%
Unfunded
(~ pension
provision on
balance sheet) DBO:
€12.2 bn
Funded
outside Germany
PensionsPension funding overview as of 31 December 2019
▪ Pensions very long-term,
debt (>17 years) with no funding
obligations in Germany
▪ DBO level of €12.2 bn (interest rate
at 1.30%)
▪ Funding ratio at ~70% mainly due
to positive development of pension
asset

63
Debt structureWell balanced maturity profile
▪ Well balanced debt maturity profile with no single
bond maturity greater than € 750m
▪ Long-term capital market financing secured at
favorable conditions:
− average coupon of 0.74% p.a. on €3.15 bn
senior bonds
− coupon of 2.125% p.a. on €0.5 bn hybrid bond
▪ MMA disposal proceeds partially used for
deleveraging: €500 m senior bond due April 2020
will be repaid (coupon of 1.875% p.a.)
▪ Undrawn €1.75 bn syndicated revolving credit facility
maturing June 2024
(in € m as of December 31, 2019)
1,000
600
200
0
400
800
2020 2030 ff.2021 2022 2023 2024 2025 2026 2027 2028 2029
Hybrid bond Senior bonds Leasing Other debt instruments1
1. Formal lifetime of 60 years; first redemption right for Evonik in 2022
64
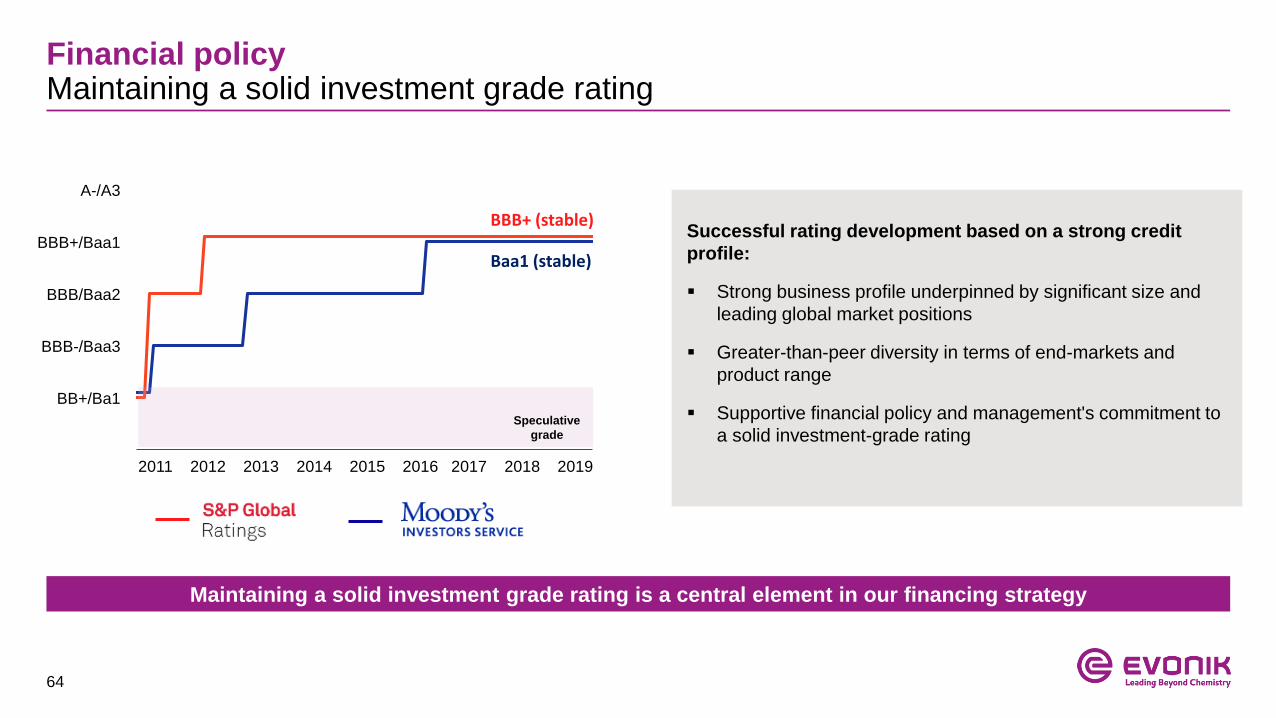
Financial policyMaintaining a solid investment grade rating
Maintaining a solid investment grade rating is a central element in our financing strategy
Successful rating development based on a strong credit
profile:
▪ Strong business profile underpinned by significant size and
leading global market positions
▪ Greater-than-peer diversity in terms of end-markets and
product range
▪ Supportive financial policy and management's commitment to
a solid investment-grade rating
A-/A3
BB+/Ba1
BBB+/Baa1
BBB-/Baa3
BBB/Baa2
BBB+ (stable)
Baa1 (stable)
Speculative
grade
2011 2012 2013 2014 2015 2016 2017 2018 2019

65
Development of debt and leverage over time
3,023
2015
-1,098
3,349
-1,111
3,852
2,907
2016
3,817 3,967
2017
3,732
2018
2,141
20191
2,2512,741
6,840 6,6396,108
Pension provisionsNet financial debt Total leverage2
0.9x 1.3x 2.8x 2.5x
▪ Net financial debt significantly reduced mainly by
disposal proceeds from methacrylate activities,
mitigated by IFRS 16 effect (€666 m)
▪ Net financial debt leverage at only 0.9x as per
end of 2019
▪ Around 2/3 of net debt consists of long-dated
pension obligations with > 17 years duration
▪ Pension provisions increased due to sharp
discount rate decline, mitigated by transfer of
€0.6 bn pension provisions with methacrylate
disposal and strong performance of plan assets
▪ Pension provisions partly balanced by
corresponding deferred tax assets of ~€1.35 bn
2.7x
Adj. net debt3 2,251 2,741 6,590 6,389 5,8581
Adj. EBITDA 2,465 2,165 2,357 2,601 2,1531
German pension
discount rate (%)
2.75 2.00 2.00 2.00 1.30
1. Continuing operations (excluding methacrylate activities, including IFRS 16 effect)
2. Adj. net debt3 / adj. EBITDA
3. Net financial debt – 50% hybrid bond + pension provisions
(in € m)

66
Financials
19.1% 18.9% 16.5% 15.2%
201820172011
1,940
2012 2013 2014 2016 20192015
2,246 2,2311,836 1,734
2,2981,970 2,150 2,153
19.2%
11.2
20162013 20172011 20142012 2015 2018
11.8 11.911.8 11.4 11.312.7 13.3
2019
13,108
550 490
-49 -60
785511
526
717
1,052
20162011 20132012 20152014 2017 2018
672
2019
10.2
201720162013 2014
12.5
2011 2012 2015 2018
18.7
11.2
20.4
15.1 16.614.0
12.1
2019
8.6
Sales1 (in € bn) Adj. EBITDA1 (in € m) / margin
Free Cash Flow (as reported, in € m) ROCE (as reported, in %)
17.2% 15.5% 16.2%
1. Continuing operations
Methacrylates Divestment Methacrylates Divestment
16.4%

67
Segment overview by quarter – continuing operations
Sales (in € m) Q1/18 Q2/18 Q3/18 Q4/18 FY 2018 Q1/19 Q2/19 Q3/19 Q4/19 FY 2019
Nutrition & Care 1,119 1,189 1,167 1,172 4,646 1,149 1,131 1,138 1,163 4,582
Resource Efficiency 1,402 1,478 1,425 1,402 5,708 1,438 1,445 1,414 1,387 5,685
Performance Materials 563 573 591 506 2,233 520 553 475 495 2,043
Services 160 169 161 175 664 174 171 196 221 763
Corporate / Others 3 4 3 6 16 6 6 9 18 35
Evonik Group 3,247 3,413 3,347 3,261 13,267 3,287 3,306 3,232 3,284 13,108
Adj. EBITDA (in € m) Q1/18 Q2/18 Q3/18 Q4/18 FY 2018 Q1/19 Q2/19 Q3/19 Q4/19 FY 2019
Nutrition & Care 209 222 212 167 810 180 190 188 170 728
Resource Efficiency 324 367 335 256 1,283 330 326 322 314 1,290
Performance Materials 60 71 63 46 239 53 74 47 50 224
Services 35 25 39 0 100 31 36 32 24 122
Corporate / Others -74 -69 -70 -67 -282 -55 -60 -46 -53 -211
Evonik Group 554 616 579 402 2,150 539 566 543 505 2,153

68
Raw material split
Fossil
▪ Crack C4
▪ Propylene
▪ Acrylic acid
▪ Acetone
▪ MethanolInorganic & other
▪ Sodium silicate
▪ Sodium hydroxide
▪ Silicon metal
Bio
▪ Dextrose
▪ Fatty alcohols
▪ Tallow fatty acid
▪ Fatty acids
▪ tallow
1. Raw material spend 65% of total procurement volume in 2019
Total procurement volume 2019 (in € m) Breakdown of raw material spend1 (examples)
Machinery
& Equipment
Raw materials
Energy
(incl. natural gas)
Logistic & Packaging
~€9.4 bn ~€6.1 bn
69
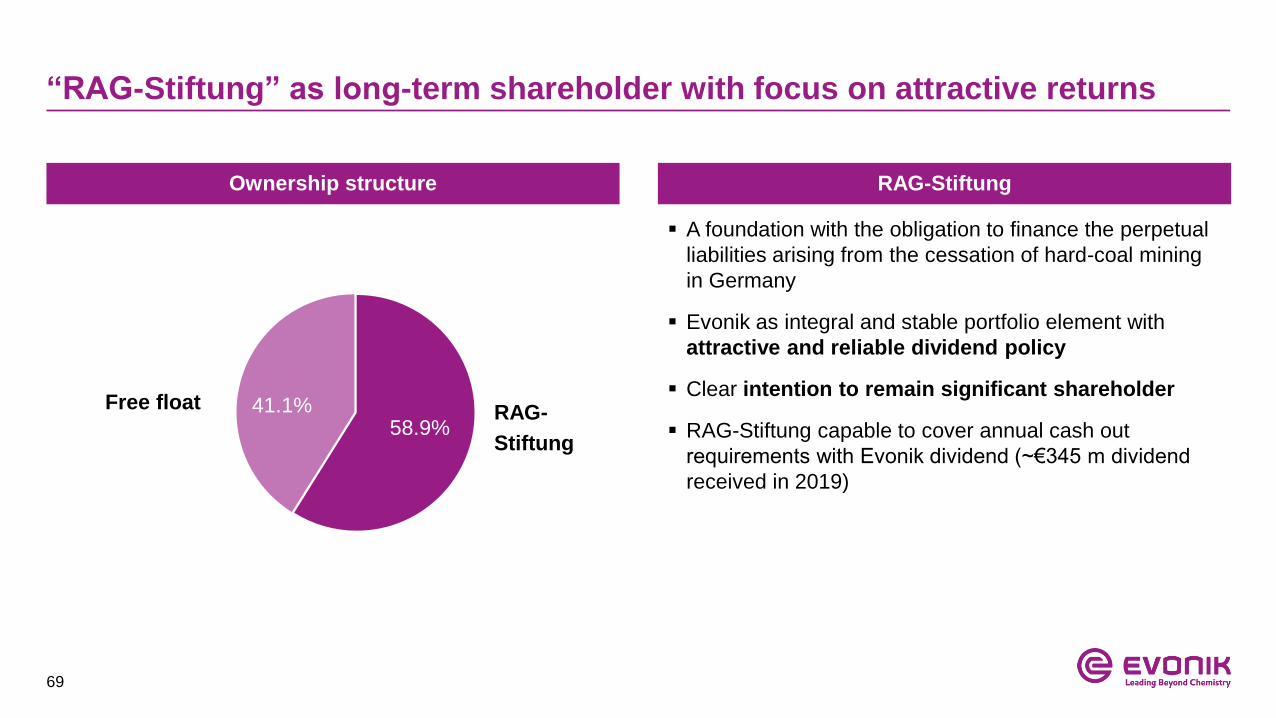
“RAG-Stiftung” as long-term shareholder with focus on attractive returns
41.1%58.9%
RAG-
Stiftung
Free float
Ownership structure RAG-Stiftung
▪ A foundation with the obligation to finance the perpetual
liabilities arising from the cessation of hard-coal mining
in Germany
▪ Evonik as integral and stable portfolio element with
attractive and reliable dividend policy
▪ Clear intention to remain significant shareholder
▪ RAG-Stiftung capable to cover annual cash out
requirements with Evonik dividend (~€345 m dividend
received in 2019)

70
Management compensation
▪ To be paid in cash for each financial year on a monthly basisFixed salary
~1/3
Bonus
~1/3
▪ Granted LTI target amount is calculated in virtual shares (4-year lock-up)
▪ Value of LTI to mirror the development of Evonik’s share price (incl. dividends)
▪ Amount payable is determined by two performance elements
▪ Absolute performance: Real price of the Evonik share
▪ Relative performance against external index benchmark (MSCI Chemicals)
▪ Bonus capped at 300% of initial amount
▪ To be paid out in cash after lock-up period
Long-term incentive plan
~1/3
▪ Pay-out calculated on the basis of the achievement of
focused KPIs; aligned to mid-term strategic targets:
1. Progression towards EBITDA margin target
2. EBITDA growth (yoy)
3. Contribution to FCF target
4. Accident performance
▪ Factor of between 0.8 and 1.2 to take into account the achievement of further individual targets
▪ Bonus capped at 200% of initial target

71
Appendix
1. Strategy
2. Segment overview
3. Financials
4. Upcoming events
72
Disclaimer
In so far as forecasts or expectations are expressed in this presentation or where our statements concern the future, these
forecasts, expectations or statements may involve known or unknown risks and uncertainties. Actual results or developments
may vary, depending on changes in the operating environment. Neither Evonik Industries AG nor its group companies
assume an obligation to update the forecasts, expectations or statements contained in this release.
73
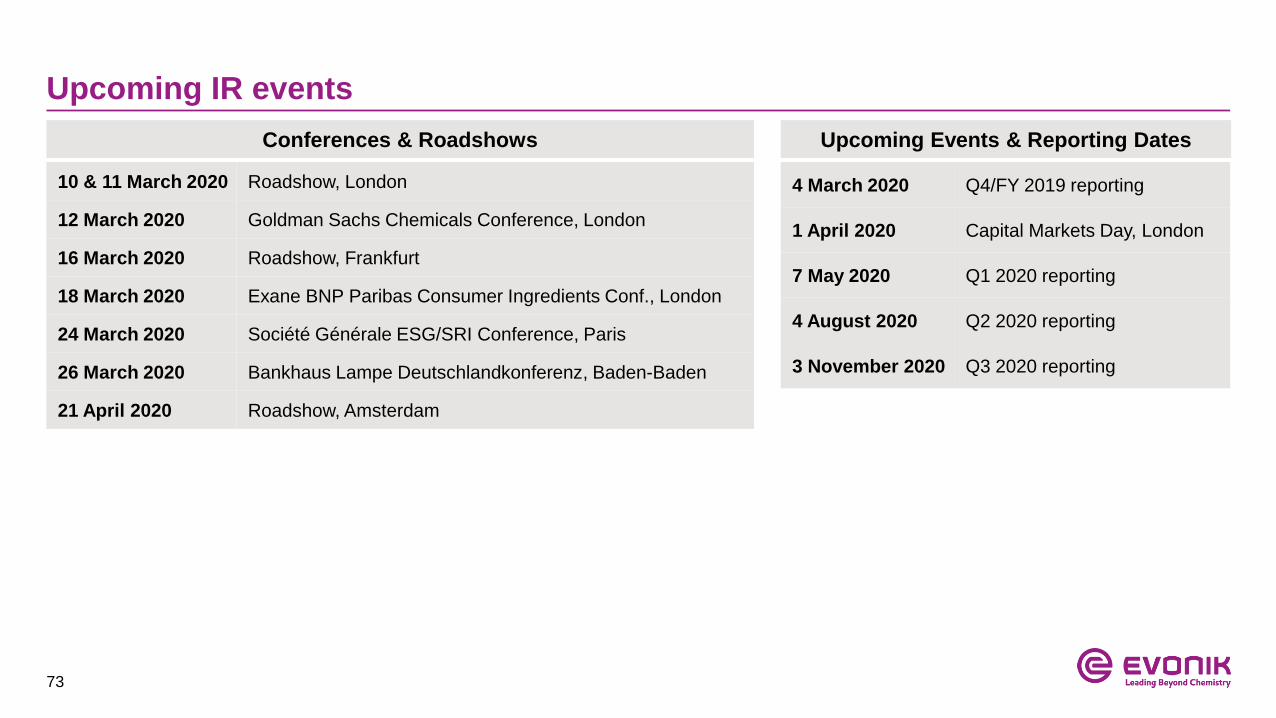
Upcoming IR events
Conferences & Roadshows Upcoming Events & Reporting Dates
10 & 11 March 2020 Roadshow, London
12 March 2020 Goldman Sachs Chemicals Conference, London
16 March 2020 Roadshow, Frankfurt
18 March 2020 Exane BNP Paribas Consumer Ingredients Conf., London
24 March 2020 Société Générale ESG/SRI Conference, Paris
26 March 2020 Bankhaus Lampe Deutschlandkonferenz, Baden-Baden
21 April 2020 Roadshow, Amsterdam
4 March 2020 Q4/FY 2019 reporting
1 April 2020 Capital Markets Day, London
7 May 2020 Q1 2020 reporting
4 August 2020 Q2 2020 reporting
3 November 2020 Q3 2020 reporting
74
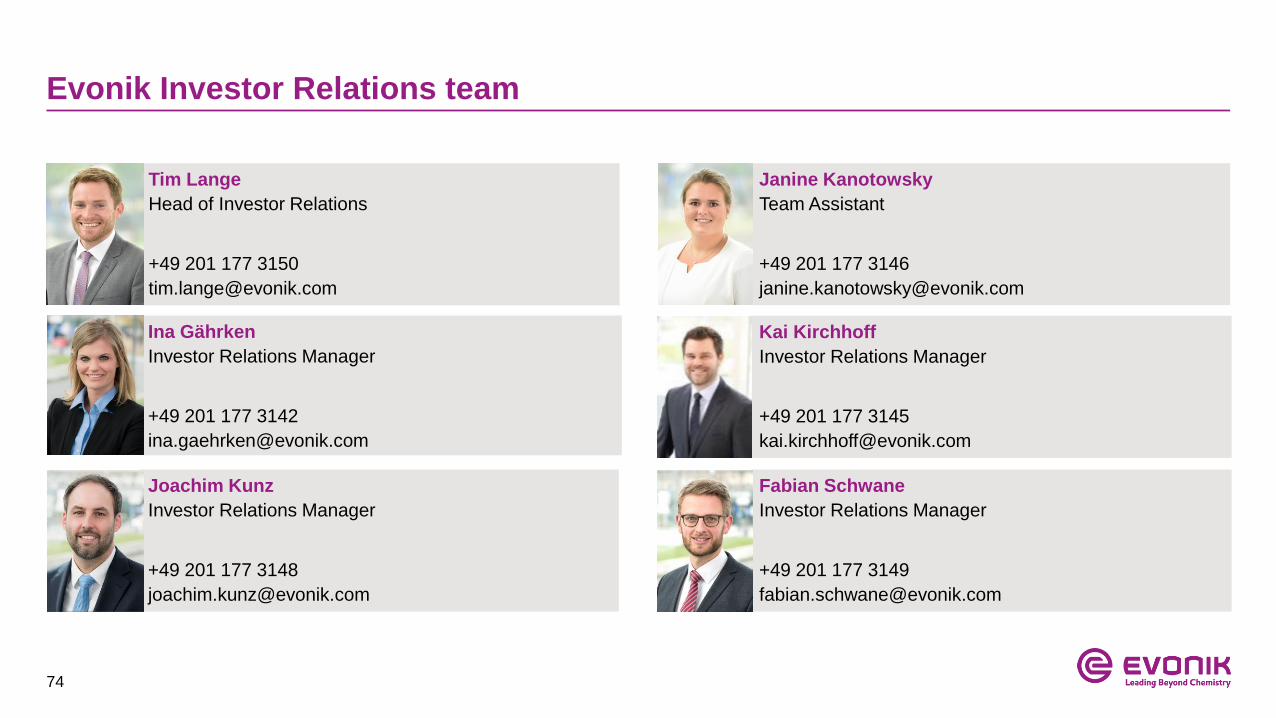
Evonik Investor Relations team
Tim Lange
Head of Investor Relations
+49 201 177 3150
Janine Kanotowsky
Team Assistant
+49 201 177 3146
Kai Kirchhoff
Investor Relations Manager
+49 201 177 3145
Joachim Kunz
Investor Relations Manager
+49 201 177 3148
Fabian Schwane
Investor Relations Manager
+49 201 177 3149
Ina Gährken
Investor Relations Manager
+49 201 177 3142
75