ewec 2007 scour protection around offshore wind turbine foundations……full-scale measurements...
TRANSCRIPT

Ewec 2007 Scour Protection around Offshore Wind Turbine Foundations……Full-scale Measurements
Erik Asp Hansen DHI (Present company DNV)Hans Jacob Simonsen DHI Anders Wedel Nielsen DHI Jan Pedersen DONG EnergyMichael Høgedal Vestas Wind Systems

80 Wind Turbines at Horns Rev
Water depth 6.5 m - 13 m
Extreme High water level +2.5m
Extreme Low water level -1.8m
Extreme Current 1.2 m/s
Extreme Significant Wave Heights 4-6m
Seabed sand 0.1 mm - 1.0 mm
Tower Diameter 4.2m
Towers installed in 2002,(original purpose of the present study, to compare stability Full scale and
model scale measurements of armour and filter layers)

Why Scour Protection?
Fix the support at a certain level (typically the present seabed level)
Local Scour Unprotected mono-towers on sand in pure Current– (scour depths up-to 2.0 times the tower diameter)
General Scour (Associated with overall sediment transport) – (estimated to be max 0.5m at Horns Rev)
max6-8 m depthmax6-8 m depth

Overview How to Design of Scour Protection, 1
– Input • Environment conditions• Seabed properties• Tower dimension
– Design Philosophy• No Maintenance• Some damage allowed• Scour protection installed before tower installation• Scour protection installed after tower installation

Overview, How to Design of Scour Protection, 2
– Type of scour protection• Armor Stones above one or two filter-layers• Artificial sea-grass• Mattresses• Armor Stones on geo-textile, Mattresses on geo-textile• …….
– Engineering • number of filter layers, Grain sizes, Densities• Thickness, Horizontal Extension• Cost• Time of Installation….
– If required Physical experiments (Froude Scaling) • Stability of Armor layer , Stability of Filer Layer• Note….Sand can not be studied in a Froude scaled model

The Horns Rev scour protectionradius =9.5 m (from tower center)
15d 50d 85d
Armour 370 mm 400 mm 550 mm Filter 20 mm 100 mm 200 mm Seabed 0.1 mm 0.5 mm 1.0 mm
armour stonesarmour stones

Over View Surveys

Windturbine no. 35 Difference 2005 and 2002 Surveys
Net transport: app..-270m3 away from the turbine

Windturbine no 35
20022002
20052005
EWEW
NSNS
-
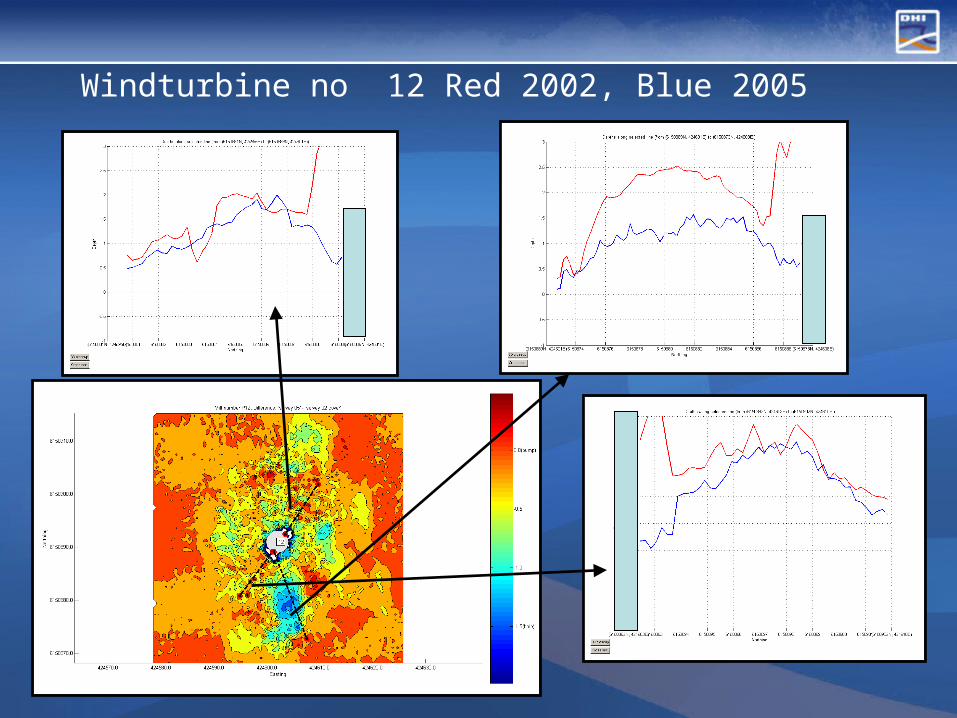
Windturbine no 12 Red 2002, Blue 2005

-
bed development in m3 from 2002-2005

Average lowering around the turbines
From 2002-2005
Distance fromTurbine Center
20% of Turbinesmore than
50% of Turbinesmore than
80% of Turbinesmore than
2.5m-3.5m 0.94m 0.72m 0.53m
3.5m-6m 0.42m 0.26m 0.13m
6m-10m 0.38m 0.20m 0.09

Horns Rev Wave Hindcast
wavemodelling Numerical Grid

Horns Rev Wave Hindcast
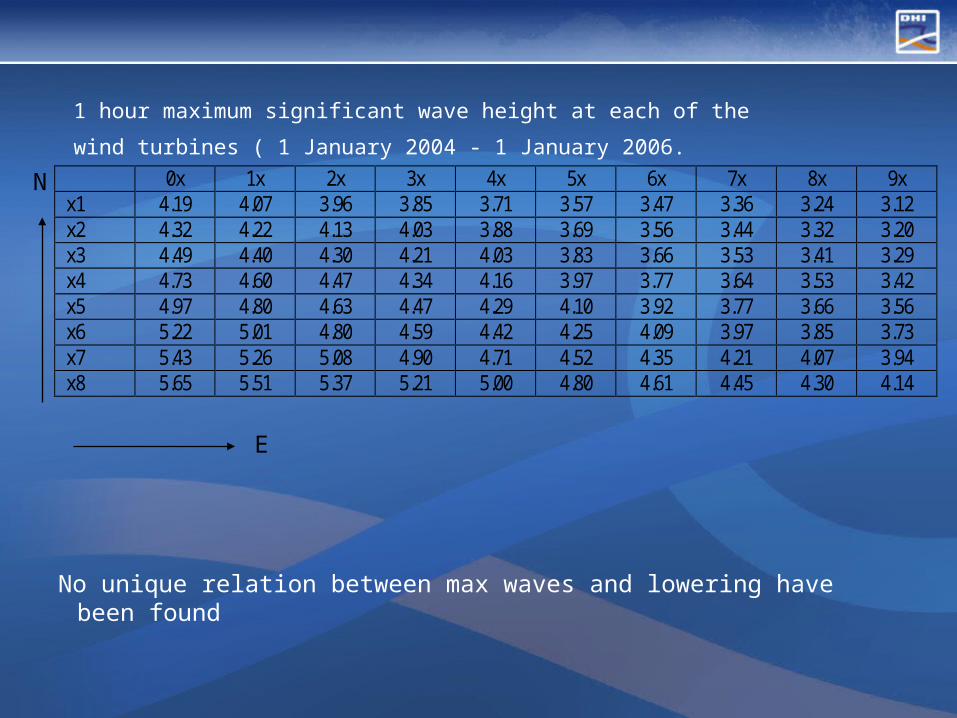
1 hour maximum significant wave height at each of the wind
turbines ( 1 January 2004 - 1 January 2006. 0x 1x 2x 3x 4x 5x 6x 7x 8x 9x x1 4.19 4.07 3.96 3.85 3.71 3.57 3.47 3.36 3.24 3.12 x2 4.32 4.22 4.13 4.03 3.88 3.69 3.56 3.44 3.32 3.20 x3 4.49 4.40 4.30 4.21 4.03 3.83 3.66 3.53 3.41 3.29 x4 4.73 4.60 4.47 4.34 4.16 3.97 3.77 3.64 3.53 3.42 x5 4.97 4.80 4.63 4.47 4.29 4.10 3.92 3.77 3.66 3.56 x6 5.22 5.01 4.80 4.59 4.42 4.25 4.09 3.97 3.85 3.73 x7 5.43 5.26 5.08 4.90 4.71 4.52 4.35 4.21 4.07 3.94 x8 5.65 5.51 5.37 5.21 5.00 4.80 4.61 4.45 4.30 4.14
N
E
No unique relation between max waves and lowering have been found

What has happened?
Armor stones transported away from the tower?
– Is it possible?– Where is the armor stones now?
Filter layer has transported away from the tower?
– Is it possible?– Where is the filter stones now?
Seabed material transported away from the tower?
– Is it possible?

What has happened? 2
Armor stones transported away from the tower?– Is it possible to move stones close to the tower in the upwards
direction ?

Traditional Filter Criteria fulfilled?
f
a
d
d
,85
,15
f
a
d
d
,50
,50
f
a
d
d
,15
,15
Upper Lower
Horns Rev armour layer to filter
1.75 4 12
Horns Rev filter to sea bed
30 200 300
Thompson & Shuttler criterion
≤4 ≤7 ≤7
U.S. Army (Shore protection manual) criterion
~2.2 ~2.3 ~2.5

Traditional Filter criteria
P+ P-SAND Filter Stone
FlowFlow DirectionDirection
Established under stationary flow conditions
Only a function of the grain size distributions
Not dependent on
Pressure gradient
Grain densities
Period of oscillation
…..

Sumer, Cokgor og Fredsøe 2001 : ’Suction Removal of Sediments Between Armour Blocks’.
One of the main objectivesOne of the main objectives
Why/When/HowWhy/When/How
are stones moving downwards?are stones moving downwards?

The Result from one layer tests, can they be used
– When several layers above each other are present?
– When vertical velocities are present?
– When vertical pressure gradients are present?

Physical model test of a Scour Protection (no filter)
Erosion in waves and currentErosion in waves and current(seen from downstream side)(seen from downstream side)

Erosion in waves and current Erosion in waves and current (seen from downstream side)(seen from downstream side)
0.15mm sand have moved up to though a 2mm hole0.15mm sand have moved up to though a 2mm holeat similar pressure gradients as at Horns Rev !at similar pressure gradients as at Horns Rev !

UB
F ??????
Transport of Sand and Filter Stones upwards through Armour Layer

Transport of Sand and Filter Stones upwards through the Armour Layer ( A Simple Model )
Step 1, determine near bed environment
Step 2, evaluate the effect from tower and protection
Step 3, determine the flow inside the scour protection
Step 4, determine stability of the interfaces
Step 5, evaluate sand movement during one wave cycle

pressure gradient from the flow outside the scour protection
Darcy's formula (modified for turbulence and inertia forces)
t
VcVVbVaI
''
V is the velocity
I is the pressure gradient
a,b and c empirical constants dependent the porosity, reynolds number,… , (to be used with caution)
Step 3, flow inside the scour protection

50,ff
f
gd)(
''
Step 4, stability of the interfaces
221
awf Uf'
50,04.041
NNw k
a
k
af
5040
750
N
.
N
w k
a,
k
a.f
Possible movement of the sand/filter material at the inter-phase is determined by the Shields Parameter:
Shear Force
Gravity
Shields Parameter:
Relation between the shear stresses and the gravity acting on the acting on a grain

Filter layer :Shields parameter
Armour layer D50 = 0.4 m, Hs = 3.5 m, Tp = 10 s, and h = 10 m
No movement
movement
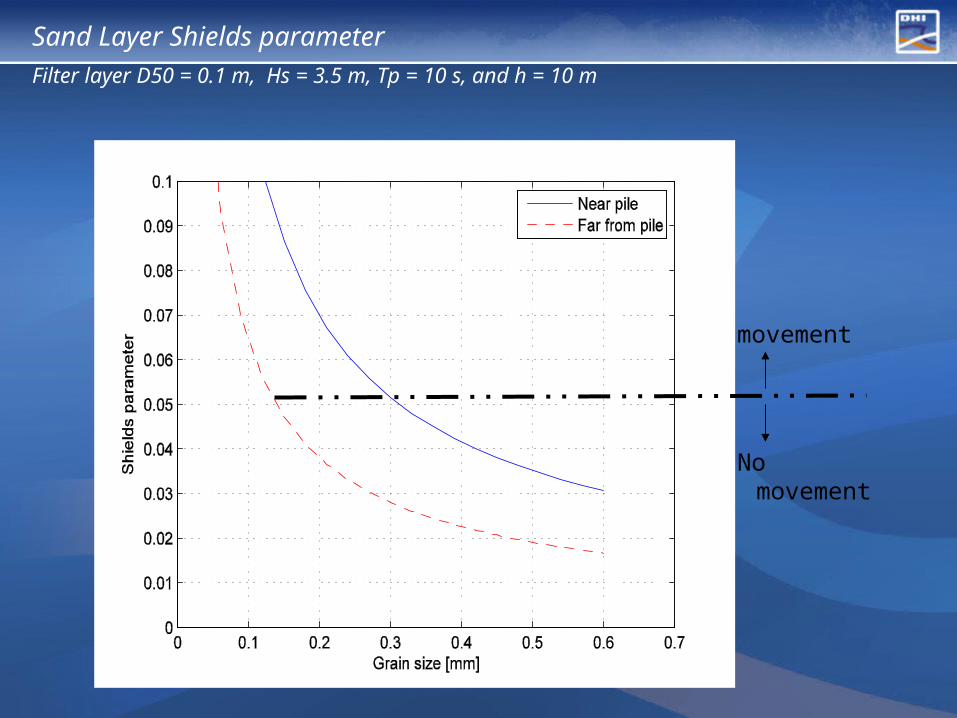
Sand Layer Shields parameter Filter layer D50 = 0.1 m, Hs = 3.5 m, Tp = 10 s, and h = 10 m
movement
No movement
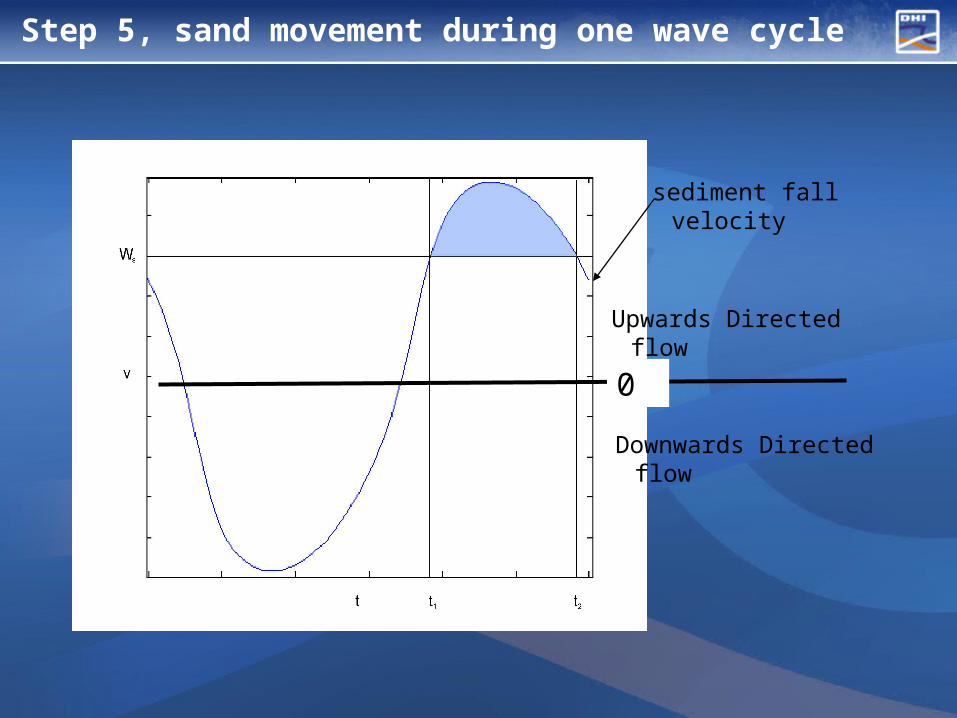
Step 5, sand movement during one wave cycle
Upwards Directed flow
Downwards Directed flow
sediment fall velocity
0

Sand: Vertical movement during one wave cycle.
Upper layer D50 = 0.1 m, Hs = 3.5 m, Tp = 10 s, and h = 10m
α ratio between vertical and horizontal α ratio between vertical and horizontal velocitiesvelocities
The simple model shows/indicates
Why the most severe lowering has taken close to the tower
Sand finer than 0.45 mm close to the tower can move 0.5 m upwards (all the way through the filter layer) during one wave cycle for wave heights equal 3.5 m.

Conclusions
The surveys indicate that the armour layers have been stable
Only a small part of the filter layer has moved up through the armour layer
The sand has moved up through the filter layer and further through the armour layer
In order to avoid the lowering of the armour layer two filter layersor much thicker filter layer with a wider gradationor a geo-textile could have been used.
Do not underestimate the value of a good filter design!

The financial support of the Danish Public Service Program (PSO) under Contract PSO: 6508 (FU5102) is gratefully acknowledged.
Thank You for Your AttentionThank You for Your Attention
Erik Asp Hansen Erik Asp Hansen DHIDHI