examination of electric arc behavior in open airlib.tkk.fi/dipl/2012/urn100737.pdf · examination...
TRANSCRIPT

Vikramjit Singh
Examination of Electric Arc Behavior in Open Air
School of Electrical Engineering
Thesis submitted for examination for the degree of Master of Science in Technology Espoo 06.08.2012 Thesis supervisor: Prof. Matti Lehtonen Thesis instructor: Prof. Matti Lehtonen


1
List of Abbreviations
E Electric field
B Magnetic field
atm Atmospheric
CB Circuit Breaker
TRV Transient recovery voltage
RRRV Rate of rise of recovery voltage
S Unit of conductivity-Siemens
dg/dt Conductivity slope
kK 1000 Kelvins
AC Alternating Current
DC Direct Current
dv/dx Voltage Gradient
Uarc Arc Voltage
H Unit of Inductance-Henry
EPA Post Arc Energy
UV Ultra Violet Radiations
hpa Unit of Pressure-Hectopascal
J Current density

2
Preface
This Master thesis has been done, at Aalto University, School of Electrical
Engineering, at Department of Electrical Engineering as a part of SGEM
project.
I would like to thank my supervisor Prof. Matti Lehtonen, who gave me
this wonderful subject which I find more and more interesting, deeper I
went in it. I must acknowledge that I am very thankful to him for believing
on my potential during all my studies at Aalto University. His way of
leadership and supervision has definitely encouraged me and made me
more passionate about electrical engineering field.
I would like to thank all the personnel at department especially Mr. John
Miller, Mr. Joni Kluss and Adj. Prof. Anour Belahcen. Special thanks to
personnel of High voltage laboratory to Mr. Petri Hyvönen, Mr. Jouni
Mäkinen, and especially to Mr. Tatu Nieminen from whom I learned a lot
of practical things at High voltage laboratory. I would like to thank Mr.
Shafiq Mohammed whose company made my working, very pleasant. I
also thank, Micheal Omidiora who guided me during my initial face of
this master thesis.
Finally I would like to thank my father Prof. Harcharan Singh and my
mother Baljit Kaur. Without their inspiration I would not have been an
Engineer. I thank my brother Lecturer Jaskaran Singh, for always being
with me and for moral support. I would like to thank Engg. Jagdeep Singh,
who always guided me to choose right path to reach towards my goal.
Espoo, August 2012.
Vikramjit Singh

3
Table of Contents List of Abbreviations ............................................................................................ 1
Preface ................................................................................................................ 2
1 INTRODUCTION ......................................................................................... 6
1.1 Background .............................................................................................. 6
1.2 Objective of the Research ....................................................................... 6
1.3 Outline of the Thesis ................................................................................ 7
2 OVERVIEW OF ELECTRIC ARC AND RELATED FACTORS ............................ 8
2.1 Different types of electrode .................................................................... 8
2.1.1 Refractory electrodes ................................................................... 8
2.1.2 Non-Refractory electrodes ........................................................... 8
2.2 Arc phenomenon in circuit breaker ......................................................... 9
2.3 Regions in the arc .................................................................................. 14
2.3.1 Arc column .................................................................................. 14
2.3.2 Cathode region ........................................................................... 14
2.3.3 Anode region .............................................................................. 15
2.4 Ionization and Recombination............................................................... 17
2.4.1 Thermal ionization ...................................................................... 17
2.4.2 Ionization by collision ................................................................. 17
2.4.3 Recombination ............................................................................ 17
2.5 Breakdown regimes after arc current interruption ............................... 18
2.5.1 Thermal regime........................................................................... 18
2.5.2 Dielectric or spark breakdown regime ....................................... 19
2.6 Arc sectional area .................................................................................. 20
2.7 Interruption in DC and AC current ......................................................... 21
2.8 Magnetic phenomena in arcs ................................................................ 22
3 ARC IN OPEN AIR ................................................................................... 24
3.1 Arc recovery .......................................................................................... 24
3.1.1 Effect of uniform and non-uniform field .................................... 24
3.1.2 Erosion rate ................................................................................. 24
3.1.3 Electrode material ...................................................................... 25
3.1.4 Prior arcing .................................................................................. 26

4
3.1.7 Deion circuit breaker .................................................................. 28
3.2 Circuit parameters and device to limit reignition ............................ 28
3.2.1 Circuit parameters ...................................................................... 28
3.2.2 Zinc Oxide device ........................................................................ 29
3.3 Difference between Short Arcs and Long Arcs ...................................... 30
3.3.1 Short arcs .................................................................................... 30
3.3.2 Long arcs ..................................................................................... 31
3.4 Electric field of non-refractory cathode after current zero ................... 35
3.5 Power losses from arc ........................................................................... 36
3.6 Post arc energy ...................................................................................... 37
4 EFFECT OF TEMPERATURE AND ARC PARAMETERS .............................. 39
4.1 Effect of temperature ............................................................................ 39
4.2 Arc parameters ...................................................................................... 44
4.3 Heat losses from arc ............................................................................... 46
4.3.1 Convection loss ........................................................................ 46
4.3.2 Radiation losses ....................................................................... 47
4.3.3 Conduction losses .................................................................... 48
4.4 Effect of thermal conductivity in cooling high temperature space ........ 49
5 EXPERIMENTAL RESULTS ........................................................................ 50
5.1 Indirect parameters ............................................................................... 50
5.1.1 Cassie and Mayr Models ............................................................. 50
5.2 Measuring electric conductivity decay near current zero ...................... 52
5.2.1 Procedure to find out arc time constant and power losses for 50
Hz………54
5.2.2 Results ........................................................................................ 62
5.2.3 Discussion ................................................................................... 63
5.2.4 Comparison of the results with other research work ................ 63
5.3 Effect of temperature on breakdown voltage ........................................ 64
5.4 Measurements ....................................................................................... 67
5.6 Test Results ............................................................................................ 69
5.7 Comparison with other research work ................................................. 70
6 CONCLUSION AND FUTURE WORK ........................................................ 71

5
6.1 Conclusion ............................................................................................... 71
6.2 Future work ............................................................................................ 72
References: ........................................................................................................ 73
APPENDIX .......................................................................................................... 80
1. Matlab commands for measuring arc time constant ............................. 80
1.1 Matlab commands for 50 Hz, to find out arc time constant and .. 80
power losses ................................................................................. 80
1.2 Filter used to remove the high frequency ripple in measured ...... 84
waveforms .................................................................................... 84
1.3 Filter used to find zero crossing of sine waveform ........................ 84
1.4 Measured value of arc parameters at different frequencies ........ 85
2 Measured values from the experiment in order to find the effect of
temperature on breakdown voltage ...................................................... 86

6
Chapter 1
1 INTRODUCTION
1.1 Background
Most of the faults in power systems are temporary faults out of which
arcing faults are most common. An electric arc which is nothing but an
electric discharge happened when electric-field between two conductors
exceeds the breakdown strength of the air or other medium in the space
between electrodes, is considered a source of harmonics [19]. When a high
power arc exists, the temperature near it is so high such that it is issue of
danger for the personnel as well as for the equipment staying near to it.
When CB opens, in order to isolate a fault no matter whether it is arcing
fault or short circuit fault, an arc exist between CB electrodes.
Immediately after the interruption, arc reignition can occur, thus causing
failure of interruption. Therefore discontinuity of power supply is
prolonged in this way. Therefore correct knowledge of microscopic
processes that can initiate and extinguish an arc is of great importance for
reliability and quality of power in power systems. An understanding of the
interruption and re-ignition of an arc discharge has obvious significance
for the design and development of a wide variety of industrial devices.
1.2 Objective of the Research
The objective of this master thesis was to look closely on the behavior of
electric arc in open air, such that to have better understanding that when
interruption of AC electric arc can occur and what are the major factors
that hinders the recovery of air space between the electrodes after the

7
interruption. Electric arc conductivity decay near current zero is an
important parameter in deciding arc interruption and reignition, as AC
current interruption is generally achieved at current zero. Therefore arc
conductivity decay near current zero was our first area to investigate; as
more arc conductivity mean less probability of interruption. The second
area of investigation of this master thesis research was to find out how the
temperature effects the breakdown voltage of air space in the gap, such
that we have better understanding of the breakdown voltage dependence of
air on temperature.
1.3 Outline of the Thesis
This research work consists of six chapters as follows:
Chapter 2, gives an overview of the arc, its properties and related factors
needed to understand the further discussion in following chapters. It gives
the detail knowledge of phases of arcs.
Chapter 3, explains what are the factors that affect the recovery of
breakdown strength after the interruption.
Chapter 4, describes the recovery dependence of gap space on
temperature. It describes the arc parameters.
Chapter 5, describes the experimental methods used, their results together
with the discussion as well as the comparison of the results that we
obtained from the experiments, with research work of others.
Chapter 6, describes conclusion of this research work and future work,
after which appendix showing MATLAB codes as well as measured
readings, has been attached.

8
Chapter 2
2 OVERVIEW OF ELECTRIC ARC AND RELATED
FACTORS
2.1 Different types of electrode
2.1.1 Refractory electrodes
A refractory electrodes, are also called hot electrodes has ability to sustain
a strong thermionic emission which is emission of electrons when material
is heated, without strong melting or vaporization (e.g. Tungsten). Hot
cathode discharge is discharge in which thermionic emission is the main.
2.1.2 Non-Refractory electrodes
Non-refractory electrodes, are also called cold cathodes and there is very
little thermionic emission in cold electrode when heated. When they are
heated to a temperature to cause thermionic ionization, they start to
evaporate (e.g. Copper, Silver). Cold cathode discharge is a discharge
which is aided by secondary ionization.
Thermionic emission in cold cathode is not zero but is finite. This is
shown in Figure 1 below.

9
Fig 1: Ratio of flux of vaporized atoms to flux of thermionic electrons [1]
From Fig. 1 we can notice that as the temperature increases, ratio of vaporized
atom to thermionic electrons of cold electrode decreases, while it increases for
hot electrodes.
Non refractory electrodes show a very rapid (in micro seconds) dielectric
recovery at current zero, but only to a level of a few hundred volts [p. 23-
24, 8]. The recovery of electric strength is due to the relatively cold
surface of the electrode, cooling a very thin layer of plasma adjacent to it
from, temperature of many thousands of degree [8], where the plasma is a
good conductor, to a few thousands degree only where it forms an
insulating layer. Arc chute circuit breaker that uses metal arc splitter plates
operates wholly on this concept.
2.2 Arc phenomenon in circuit breaker
In High Voltage circuit breakers the current interruption takes place near
current zero as due to following reasons:
1. The voltage across arc and arc current are in phase, hence, arc is pure
resistive. Near current zero, voltage is also minimum hence the arc
energy is minimal and hence current conduction decreases.
10
2. Ions/electrons available for conduction in the medium are also
minimum at that instant, as during current zero, temperature in the gap
has also decreased due to losses, greater than energy input.
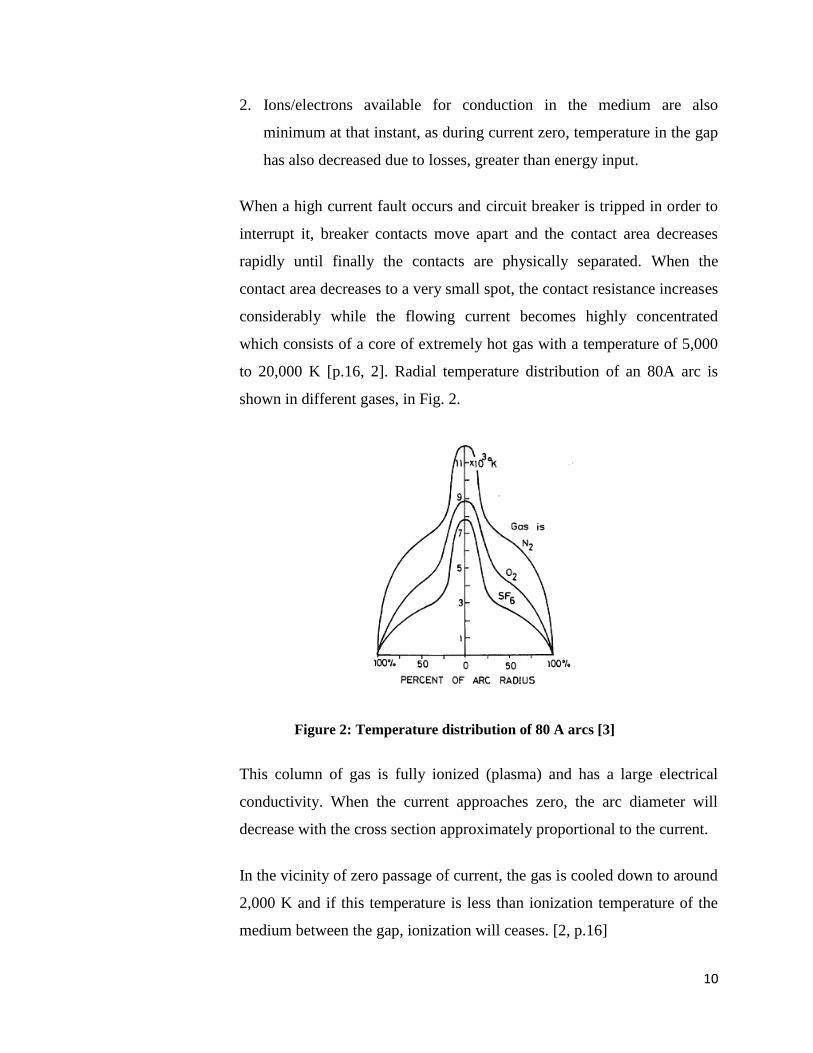
When a high current fault occurs and circuit breaker is tripped in order to
interrupt it, breaker contacts move apart and the contact area decreases
rapidly until finally the contacts are physically separated. When the
contact area decreases to a very small spot, the contact resistance increases
considerably while the flowing current becomes highly concentrated
which consists of a core of extremely hot gas with a temperature of 5,000
to 20,000 K [p.16, 2]. Radial temperature distribution of an 80A arc is
shown in different gases, in Fig. 2.
Figure 2: Temperature distribution of 80 A arcs [3]
This column of gas is fully ionized (plasma) and has a large electrical
conductivity. When the current approaches zero, the arc diameter will
decrease with the cross section approximately proportional to the current.
In the vicinity of zero passage of current, the gas is cooled down to around
2,000 K and if this temperature is less than ionization temperature of the
medium between the gap, ionization will ceases. [2, p.16]
11
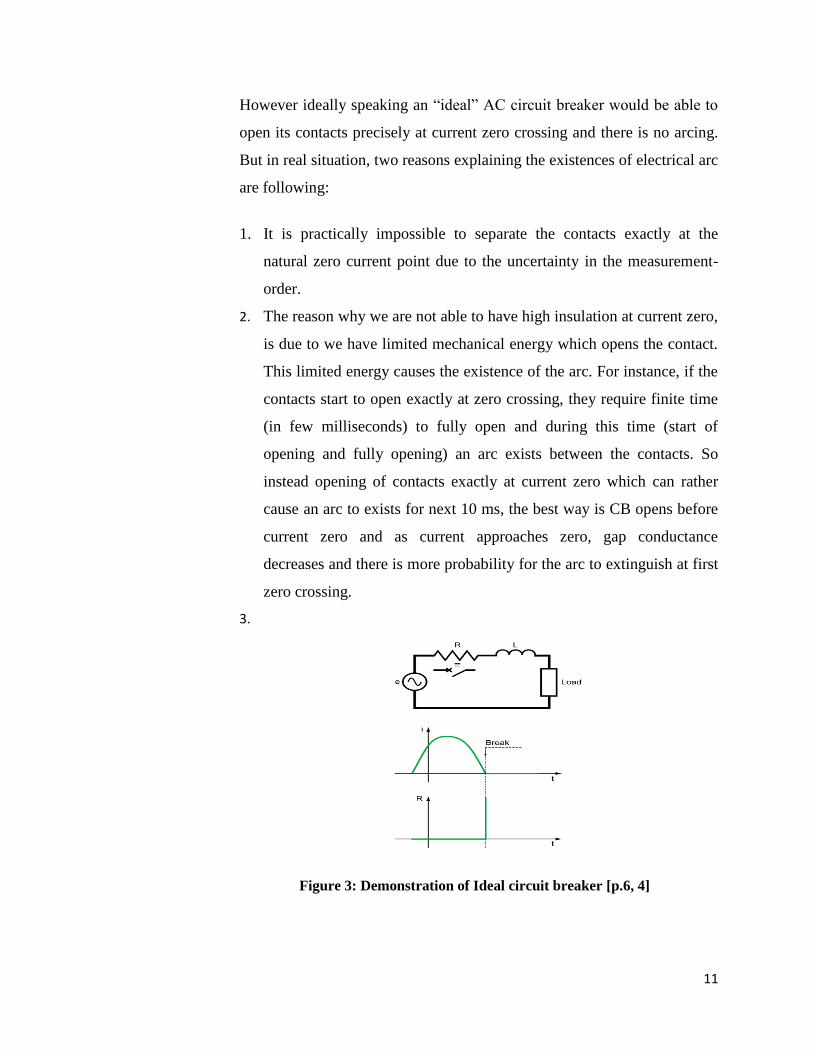
However ideally speaking an “ideal” AC circuit breaker would be able to
open its contacts precisely at current zero crossing and there is no arcing.
But in real situation, two reasons explaining the existences of electrical arc
are following:
1. It is practically impossible to separate the contacts exactly at the
natural zero current point due to the uncertainty in the measurement-
order.
2. The reason why we are not able to have high insulation at current zero,
is due to we have limited mechanical energy which opens the contact.
This limited energy causes the existence of the arc. For instance, if the
contacts start to open exactly at zero crossing, they require finite time
(in few milliseconds) to fully open and during this time (start of
opening and fully opening) an arc exists between the contacts. So
instead opening of contacts exactly at current zero which can rather
cause an arc to exists for next 10 ms, the best way is CB opens before
current zero and as current approaches zero, gap conductance
decreases and there is more probability for the arc to extinguish at first
zero crossing.
3.
Figure 3: Demonstration of Ideal circuit breaker [p.6, 4]

12
The electrical arcing breaking process in CB takes place in three phases
[p.7, 4] :
1. arc propagation phase,
2. the arc extinction phase,
3. the post arcing phase
1. Arc propagation phase
As generally the CB contacts, separate before current zero, however
feeding of energy causes current continue to flow and hence this causes an
arc to exist which is made up of a plasma column composed of ions and
electrons (see Fig. 4). This column remains conductive as long as its
temperature is maintained at a sufficiently high level. The arc is thereby
“sustained” by the energy that it dissipates by the Joule effect. There is
voltage drop near the electrodes called cathodic and anodic voltage and
voltage drop in arc column. The sum of all these voltage drops is called
the arcing voltage. Its value, which depends on the nature of the arc, is
influenced by the intensity of the current and by the heat exchange with
the medium (walls, materials, etc.).
Figure 4: Electrical arcing in gaseous medium [p. 6, 4]

13
2. Arc extinction phase
The extinction process is accomplished in the following manner: near zero
current, resistance to the arc increases according to a curve which mainly
depends on the de-ionization time constant in the inter-contact medium
(means how fast the deionization of the space takes place as the current
approaches zero) (see fig. 5 ).
Figure 5: Change in arc resistance [p. 18, 2]
At zero current, this resistance has a value which is not infinite and
therefore space has conductance (space is ionized, however no net
movement of particles) but as the voltage across the gap start to appear
electrons and ions are accelerated to the opposite polarities and hence this
causes a post-arcing current across the terminals.
3. Post-arcing phase
This post arcing current can cause thermal reignition if its rate of rise is
high enough after current zero (which is case for refractory electrodes) so
that the voltage (which start to appear across the gap) and this post arc

14
current, provide that much power which is greater than the power loss due
to recombination as well as due to diffusion. However if after a while this
post arc current ceases due to recombination or due to diffusion there is
another period after which the rate of rise of voltage causes electric
breakdown of the gap.
2.3 Regions in the arc
Arc is composed of three principle regions: the cathode region, the anode
region and the arc column, no matter what the total arc length is. Through
all these regions current is carried by electrons and ions. In a steady arc, a
balance is made between power input and losses. Arc become unstable
when there is disturbance in this balance [p. 186, 5].
2.3.1 Arc column
The arc column is a region in which ionized gas gives almost exact
equalities of positive and negative charge densities, and are comparable to
that of neutral gas molecules so that very low axial electric field exist in
that region [5]. Heat produced by the I2R losses in the arc column
maintains the ionization and flows axially towards the electrodes and
radially outwards from the arc. The ionization in the arc column is
maintained by the energy dissipated in the arc. A steady arc adjusts its
temperature and diameter such that power loss from arc is minimum. The
extreme temperature and high conductivities are confined to the core of
the arc column. Both these quantities decreases sharply at some radius
beyond which there is no current conduction to speak of.
2.3.2 Cathode region
Cathode region is a region adjacent to the cathode. In the arc the current is
carried partly by positive ions drifting slowly to the cathode from the
plasma of arc column. In the space between the surface of the cathode spot

15
(a very small point like object where from electrons leaves from surface of
the cathode) and the cloud of positive ions there is a high electric field.
This region is called cathode region. Therefore a significant cathode
voltage drops builds up over the cathode region. The width of the region
depends on the arc current, the medium in which it is burning and the
cathode material.
2.3.3 Anode region
As like cathode region, anode region is a region adjacent to the anode,
where due to cloud of electrons there exists an electric field, hence the
voltage drop. For long arc gaps (gap distance more than fraction of inch),
all the voltage appear across arc column (shown in Figure 9) however
voltage gradient dv/dr near the anode and cathode is higher than in the
column. The voltage distribution for long arc gap is shown in Figure 6
below:
Figure 6: Axial voltage distribution of an long arc [p. 1132,6]
As we know that near anode and cathode there is quite high voltage
gradient. This voltage gradient causes the charge particles to accelerate
with a high speed, therefore due to this high acceleration the jet is quite
straight and due to low voltage gradient in arc column the charge

16
travelling path is not that straight but rather diffuse. The energy of the unit
length of the arc jet is larger than that of the arc column. [p. 793, 7]
Figure 7: Long arc with electrode separation distance of 3.4m [p. 792, 7]
The Figure 7 shows that, the arc jet (which is caused by pressure gradient)
is quite straight near at both anode and cathode however the arc column
just follows diffuse path or meanders.
It has been found out [36] that the cathode or anode voltage drop is
affected by the electrode material however this anodic or cathodic voltage
drop of the SF6, Argon and Air arcs, is independent of the current in the
range of 10 to 20 000 A.
It should also be noted that the recovery and reignition of the electrode
regions and arc column proceed simultaneously and interactively, the
physical processes within these separate regions and within the transition
zones between the regions being different.

17
The small temperature difference between electrode and plasma causes
relatively weak cooling of the post-arc channel at the cathode [22]. This
means that larger the temperature difference between electrode and
plasma, larger will be the cooling of post-arc channel at cathode.
2.4 Ionization and Recombination
2.4.1 Thermal ionization
Thermal ionization occurs when a mass of gas is heated to such content
that is sufficient for the random thermal velocities of the particles to cause
ionization. The degree of ionization depends on pressure, the temperature
and the ionization potential of the gas.
2.4.2 Ionization by collision
Ionization by collision is the ionization occurring in a gas by electrons that
are directly accelerated by high electric gradients in the arc.
2.4.3 Recombination
When positively and negatively charged particles exist in a gas, there is a
rate of recombination means pairs of oppositely charged particles
recombine to form neutral particles. The recombination occurs more
rapidly at low temperatures, where particles have lower velocities, than at
high temperature because for recombination to occur the particles must
remain close enough to one another for a sufficient time for recombination
to occur [p.29, 8].

18
In circuit breaker arcs, two major ionization processes are of interest.
During the conduction period, ionization is almost wholly thermal
ionization means temperature of the gas is that much high that causes the
detachment of electrons from the neutral particles. During very near
current zero period, ionization by field emission can occur [p. 26, 8].
2.5 Breakdown regimes after arc current interruption
2.5.1 Thermal regime
The thermal regime occurs if rate of decrease of the current to be
interrupted (di/dt, before current zero) and the initial rate of rise of the
transient recovery voltage (dv/dt, immediately after current zero), provide
enough power so that reignition occurs.
At current zero, electrical conductivity of the space in the gap is not zero,
because, ions and electrons takes some time to disappear as a process of
recombination or other power losses effect. With the rising recovery
voltage, these ions and electrons accelerates to opposite electrodes hence it
gives rise to what is called a "post-arc current, with amplitude up to a few
Amperes. Whether or not interruption is going to be successful is
determined by a race between the cooling effect of the space between gap
and the energy input in the arc path by the transient recovery voltage and
post arc current. When the scales of the energy balance tip in favor of the
energy input the circuit breaker will fail thermally [p. 17, 2].
The thermal interruption regime for SF6 circuit breakers corresponds to
the period of time starting some µs before current zero, until extinguishing
of the post arc current, a few µs after current zero. [ p. 17, 2]

19
2.5.2 Dielectric or spark breakdown regime
When the circuit breaker has successfully passed the thermal regime
(means a few microseconds after post arc current), the transient recovery
voltage (TRV) between the contacts rises rapidly (this transient rise
depend on the circuit parameters across both ends) and will reach a high
value. For example, in a single unit 245 KV circuit breaker, the contact
gap may be stressed by 400 KV or more, 70 to 200 µs after the current
zero [p. 18, 2].
In the dielectric regime the space between the gap, is no longer electrically
conducting, but it still has a much higher temperature than the ambient.
This reduces the voltage withstand capacity of the contact gap. The stress
on the circuit breaker depends on the rate of rise and the amplitude of the
TRV.
The withstand capability of the contact gap must always be higher than the
transient recovery voltage otherwise a dielectric re-ignition will occur
(dielectric failure). This requires an extremely high dielectric withstand
capability of the gas, which is still rather hot and therefore has low
density.
It has long been known that interrupted arcs between non-refractory
electrodes (e.g., Cu, Ag) can be reignited only by the reapplication of a
voltage in excess of the minimum spark breakdown value and that most of
this appears across the cathode region of the discharge.
Refractory electrode regions however can have significant electrical
conductance for appreciable times after interruption, so that, for example,
continuity of current flow may be maintained through an AC current zero
without the appearance of high-voltage transients. [23]

20
For the successful interruption two physical requirements (regimes) are
involved:
Thermal regime: The hot arc channel has to be cooled down to a
temperature low enough that it ceases to be electrically conducting.
Dielectric regime: After the arc extinction, the insulating medium
between the contacts must withstand the rapidly increasing recovery
voltage. This recovery voltage has a transient component (transient
recovery voltage, TRV) caused by the system when current is interrupted.
If either of these two requirements is not met, the current will continue to
flow for another half cycle, until the next current zero is reached.
Different techniques are used to extinguish the arc including:
Division into partial arcs: As we know more the contact area of the
electrode used more it has effect in cooling the arc next to it.
Connecting capacitors in parallel with contacts: By doing this we decrease
RRRV and hence energy input to the arc is less.
Lengthening of the arc: By this we increase resistance to the arc current
and area of cross section of arc decreases.
Intensive cooling: By this we increase rate of recombination of ions and
electrons, as by cooling the K.E of ions and electrons decreases which
results in high rate of recombination.
2.6 Arc sectional area
Experiments show that the sectional area and the density of ions in the arc
stream increases with current [p.422, 9].In ac arcs, arc section is not that
which corresponds to the current flowing at the moment, but depends on
the current which has been flowing previously. If the current previously
21
has been larger, then the section will be larger than that corresponding to
the momentary current [p.425, 9]. The reason for this, is that the ions of
heavy weight will not have time to disappear instantaneously.
2.7 Interruption in DC and AC current
For direct current interruption, if there is direct current arc then resistance
of the arc must be increased rapidly enough to force the current down to
zero in a reasonably short time but not so rapidly that high over voltages
are generated in the inductance of the circuit.[ p.20, 8]
For ac arcs, there are two current zero every cycle, hence due to its nature,
the current is decreasing naturally and resistance start to increase as
current approaches zero due to natural deionization but more deionization
can be achieved artificially which help the interruption.
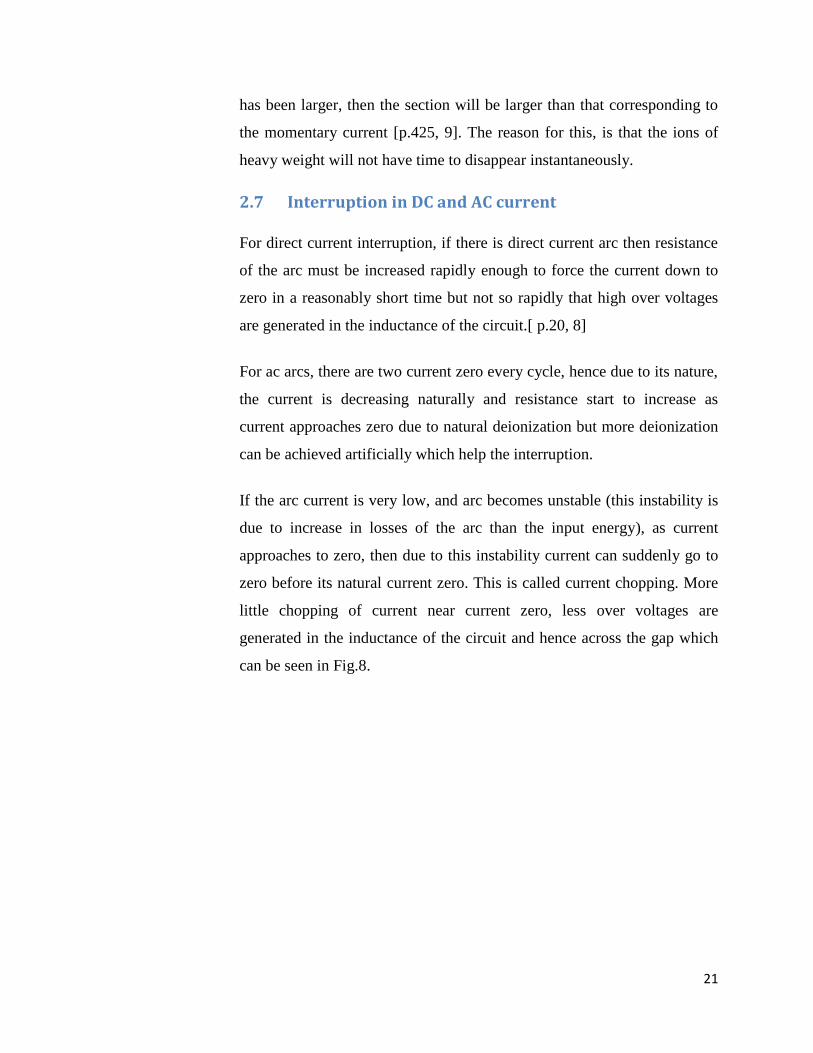
If the arc current is very low, and arc becomes unstable (this instability is
due to increase in losses of the arc than the input energy), as current
approaches to zero, then due to this instability current can suddenly go to
zero before its natural current zero. This is called current chopping. More
little chopping of current near current zero, less over voltages are
generated in the inductance of the circuit and hence across the gap which
can be seen in Fig.8.
22
Fig.8. (a) Arc voltage and (b) post-arc current after a smooth current decline
(dashed lines) and after a current chop (solid line). In both
measurements, a peak-arc current of 39 kA and an arcing time of
3.4ms were used. [p.1590, 10]
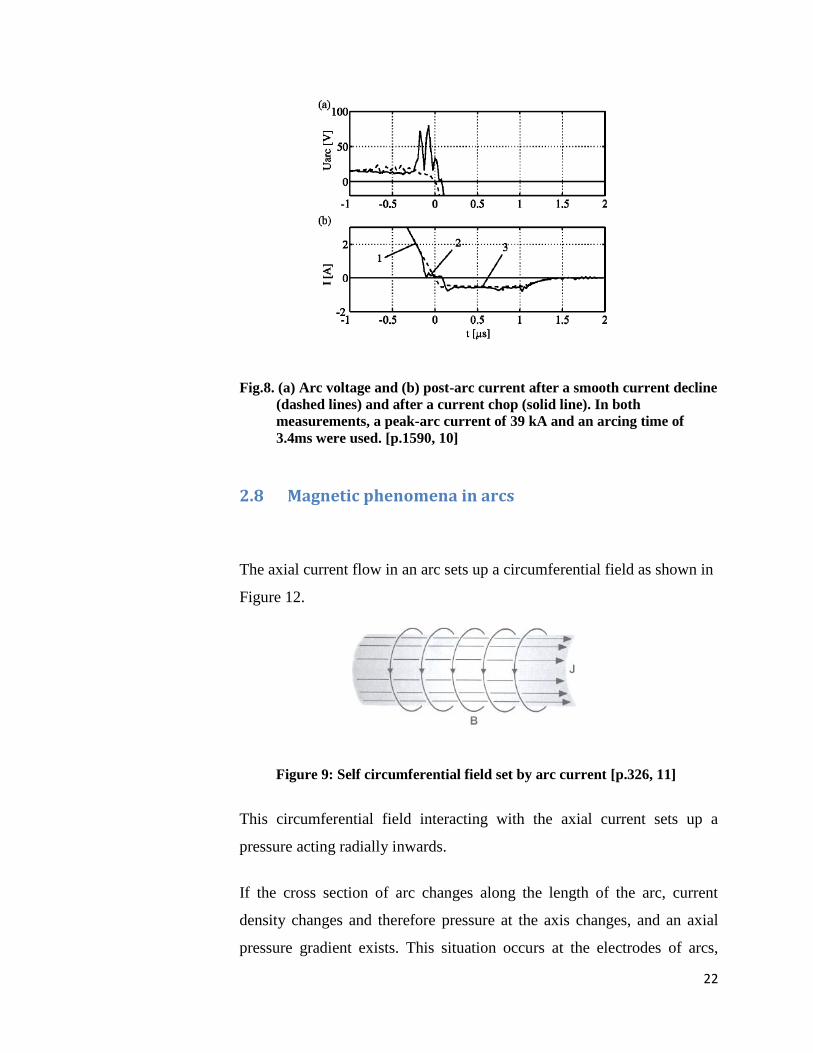
2.8 Magnetic phenomena in arcs
The axial current flow in an arc sets up a circumferential field as shown in
Figure 12.
Figure 9: Self circumferential field set by arc current [p.326, 11]
This circumferential field interacting with the axial current sets up a
pressure acting radially inwards.
If the cross section of arc changes along the length of the arc, current
density changes and therefore pressure at the axis changes, and an axial
pressure gradient exists. This situation occurs at the electrodes of arcs,
23
where current densities are commonly higher than in the arc column due to
high dv/dr (as cathodic and region has high dv/dr, which casues the
current to be rather straight that arc coloumn and J=I/A, is higher). A high
pressure thus exists in front of the electrode and this high pressure can set
up a jet of plasma moving away from the electrode at velocities up to 105
cm/s [p. 32, 8].
Consider an infinite cylindrical column of conducting fluid with an axial
current density J and a resulting azimuthal magnetic induction B. The
force acting on the plasma, forces the column to contract radially. This
radial constriction of the plasma column is known as the pinch effect.
As the plasma is compressed radially, the plasma numbers density and the
temperature increases. The plasma kinetic pressure counteracts to hinder
the constriction of the plasma column, whereas the magnetic force acts to
confine the plasma. When these counteracting forces are balanced, a
steady state condition results in which the plasma is mainly confined
within a certain radius R, which remains constant in time. This situation is
commonly referred to as the equilibrium pinch. When the self-magnetic
pressure exceeds the plasma kinetic pressure, the column radius changes
with time, resulting in a situation known as the dynamic pinch. [p. 325,
11]

24
Chapter 3
3 ARC IN OPEN AIR
3.1 Arc recovery
3.1.1 Effect of uniform and non-uniform field
Previous work has shown that faster dielectric recovery is obtained in
uniform than in non-uniform field conditions [13]. This has been shown to
be partly due to two effects each causing a lower breakdown voltage in the
non-uniform field situation. One of these is that the process of photo
detachment is more efficient in non-uniform field configuration in
providing the space charge field enhancement required to promote
breakdown at lower E values. The other is associated with the fact that E
is higher at the electrodes(due to more dv/dx (cathode or anode voltage
drop); at the electrode regions ) than at mid gap in the more non-uniform
field case, so that electrons coming from cathode region will have higher
energies than those corresponding to average electric field. This results in
increased ionization efficiency at mid-gap and consequently lower
breakdown voltage in the non-uniform field case which cause a longer
recovery time to a given voltage level.
3.1.2 Erosion rate
The increase erosion rate of a material electrode at after crossing a certain
current limit before which erosion is not that significant, causes the
roughening of the electrode surface and a lower breakdown voltage as a
result of increased field non-uniformity[13].

25
3.1.3 Electrode material
The dielectric recovery after the arc extinction is influenced by the
material of the electrode as well as the shape of the electrodes. The
experiments[12] shows that recovery is faster with Ag-CdO contacts than
with any other material tested, with flat contacts than with those having
high point at the contact center, with cone shaped rather than butt contacts.
Figure 10: Geometry of cone and butt shaped contacts [12]
Figure 11: Recovery characteristics for 2.4 cm diameter Ag-CdO contacts in
air at atm pressure following 1000A arc, where upper diagram
shows the effect of contact shape on recovery and lower diagram
shows the effect of contact surface angle on recovery [12]
26
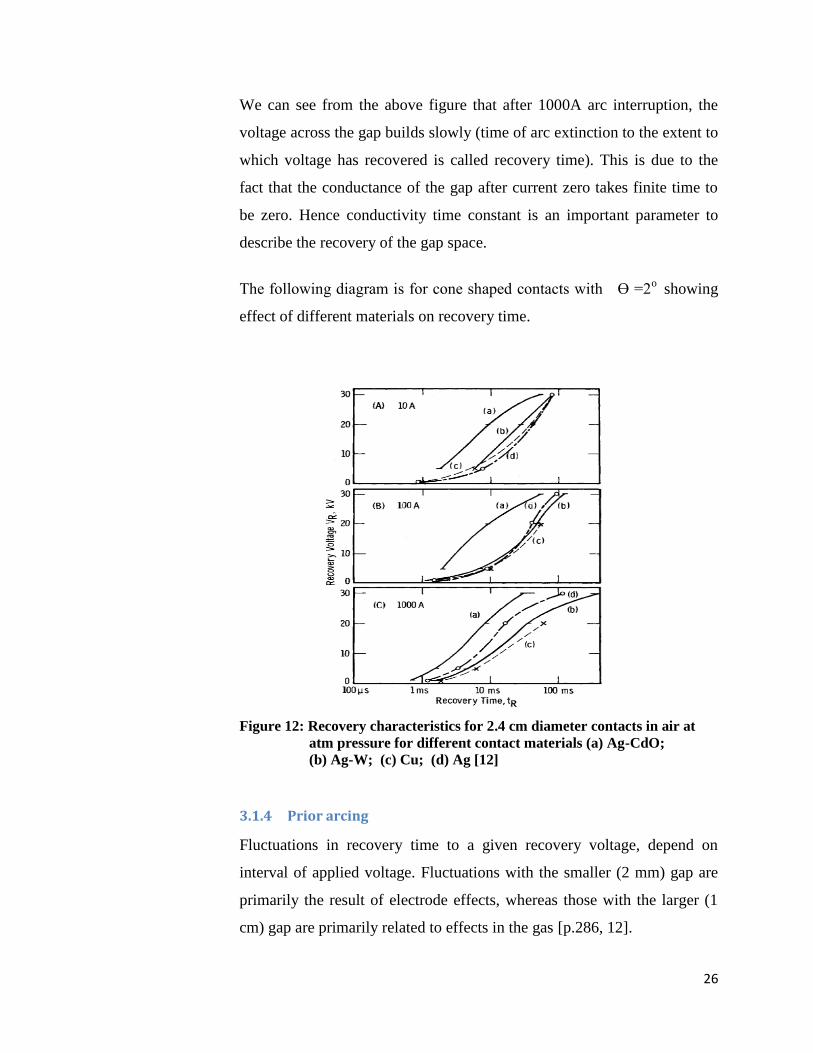
We can see from the above figure that after 1000A arc interruption, the
voltage across the gap builds slowly (time of arc extinction to the extent to
which voltage has recovered is called recovery time). This is due to the
fact that the conductance of the gap after current zero takes finite time to
be zero. Hence conductivity time constant is an important parameter to
describe the recovery of the gap space.
The following diagram is for cone shaped contacts with ϴ =2o
showing
effect of different materials on recovery time.
Figure 12: Recovery characteristics for 2.4 cm diameter contacts in air at
atm pressure for different contact materials (a) Ag-CdO;
(b) Ag-W; (c) Cu; (d) Ag [12]
3.1.4 Prior arcing
Fluctuations in recovery time to a given recovery voltage, depend on
interval of applied voltage. Fluctuations with the smaller (2 mm) gap are
primarily the result of electrode effects, whereas those with the larger (1
cm) gap are primarily related to effects in the gas [p.286, 12].
27
3.1.5 Electrode effects
With no prior discharges between the contacts, the gap required a large
voltage, to breakdown the gap space. If applied at an interval again and
again, the breakdown voltage gets lower than for first breakdown voltage.
The reason for this is when there is not prior arcing has occurred; the
presence of an absorbed cathode layer has reduced the secondary
ionization coefficient gamma of the gas and hence has increased the
breakdown voltage [12]. Immediately after arcing, which tends to remove
the oxide layer, a transient gamma increase can cause a reduction in
breakdown voltage. Even when the oxide layer reforms after arcing,
residual positive charges resting on the oxide layer or on dust particles
deposited on the surface can cause an effective reduction in surface work
function, with consequent gamma increase and breakdown voltage
decrease.
3.1.6 Gas Effects
In addition to the electrode effects, however, gas effects can cause
variations in breakdown voltage. It is known, for example, that electrical
discharges in air result in the formation of various impurity products due
to chemical activity in the cooling gas following the dissociation of 02 and
N2; in particular, NO2, NO, N20, and 03 are formed [12], and the latter two
have very high electron attachment cross-sections at electron energies
occurring at breakdown in air at atmospheric pressure. These products can
cause a factor of 10 increase in the average electron-attachment
coefficient, [15] resulting in an impulse breakdown voltage increase of up
to 40%. It has been found that the increase in impurity concentration, and
28
the resultant increase in breakdown voltage are greater following higher
energy input to the gap, [16] means flowing higher arcing current.
The faster recovery observed with flat contacts compared with those
having high contact surface angles is due to more uniform field
configuration. [12]
Gas density reduction, due to preceding arcing, result in lower breakdown
voltage. Increased secondary ionization coefficient gamma due to
deposition of charge onto the contact surface result in lower breakdown
voltage. [12]
3.1.7 Deion circuit breaker
It is evident that it is the slow rate of recombination of the ions in the arc
space away from the electrodes which limits the applicability of the arc in
air for interrupting high voltages. A fairly obvious suggestion would be to
reduce as far as possible the arc space remote from a cathode and so far as
possible causes all the arc to play in space close to a cathode, in other
words to use a large number of short arcs in series. This is what is done in
the Deion circuit breakers.
3.2 Circuit parameters and device to limit reignition
3.2.1 Circuit parameters
The arrangement of circuit parameters such as inductor and capacitor does
effect the rate of rise of recover voltage and hence in turn affect the
reignition phenomenon.

29
It has been concluded by [23], that the more the capacitance across the
CB, the less the rate of rise of recovery voltage as shown in Fig. 13, and
smaller the series inductance, smaller the rate of rise of recovery voltage
as shown in Fig. 14.
Figure 13: Measurement a.) with 10nF capacitor b.) with 1nF capacitor
across CB [22]
Figure 14: Measurement with series inductor a.) of 105 µH b.) of 225 µH
[22]
3.2.2 Zinc Oxide device
Due to the high financial outlay costs involved, the power utilities have
sought an alternative to reduce TRV peak. Zinc Oxide (ZnO) devices are
being applied as an alternative to limit TRV peaks in circuit breakers and
reclosers of 15 kV and 72.5 kV voltage class.

30
Figure 15: Schematic of circuit with ZnO device in parallel with the Breaker [24]
Taking into account Fig. 15, Capacitor Cs take care the magnitude and
frequency of TRV. Rs adjust the attenuation level while Cd is related to
the initial rate of rise of TRV.
3.3 Difference between Short Arcs and Long Arcs
3.3.1 Short arcs
Short arcs are the arcs which happen in a gap of distance fraction of an
inch [p. 422, 9] preferably less than 10mm electrode gap. As we know the
space next to cathode, deionized very quickly and have the capability to
withstand few hundred of volts immediately after arc extinction. The
space next to cathode layer deionizes rather slowly [p. 422, 9]. Hence after
few hundred volts the recovery which is done by the space next to layer is
rather slow. As deionization by the space next to cathode happens, the
cathode layer becomes widened.
Hence a arc is short if it extinguish in a circuit which impresses less than a
few hundred volts upon it, then use is made of recovered dielectric
strength of cathode layer, and the arc is to be regarded as short. If
however, the arc extinguish in a circuit which impresses more than a few
hundred volts upon it, then use is made of recovered dielectric strength
away from the cathode layer, and the arc is to be regarded as long.

31
Hence long arc is one in which during the extinction period the larger part
of the recovered dielectric strength resides in the space away from the
cathode layer.
3.3.2 Long arcs
From the electrical properties of an arc under steady conditions (volt-
ampere characteristics) point of view, it has been found that for long gap
arcs, arc voltage is directly proportion to the length of the arc.
Uarc = BL
Where B is voltage gradient of the arc column and L is length of the arc.
This voltage gradient is almost independent of arc current so the long high
current arc voltage is determined by arc length. From range of currents of
100 A to 20 kA, the average arc voltage gradients lie between 1.2 and 1.5
kV/m [p. 1141, 17]. It should be noted that the whole voltage drop come
across arc column for long arcs.
After the initiation of the arc, with very high current flowing, there is no
time taken by it to breakdown the gap again as due to high currents the
temperature of the plasma is so high that it requires no breakdown voltage.
Hence this seems like the situation as if there is pure resistor in the circuit
however this resistor seems non ideal as one sees in the Fig.16, it more or
less shows a hysteresis loop, in the arc voltage and current diagram.
Moreover one can see that the arc voltage is high with the same current
when current is increasing than with when current is decreasing. This is
because the temperature of the arc becomes higher by the accumulated
energy of the arc, which increases the conductivity of the arc. Therefore
the arc resistance becomes smaller.

32
Arc voltage characteristics for long arcs with high current are shown in
Fig. 16.
Figure 16: Arc voltage and current characteristics [p. 793, 7]
The long gap arc increases their length by the passage of the time. The
elongation of the arc is determined by the magnetic forces produced by the
supply current, the convection of the plasma and the surrounding air, the
atmospheric effects. [17]
As due to its natural nonlinear behavior the arc is assumed as the source of
harmonics which will distort the waveforms of the parameters in the
component. Hence this parameter can be used as a good indicator which
can distinguish the metallic faults with the arcing faults [19].
Figure 17: Arc voltage amplitude spectrum showing different harmonics[19]
33
Figure 17 shows the arc voltage amplitude. From the amplitude spectrum
it can be observed that arc voltage total harmonic distortion is 41.1%.
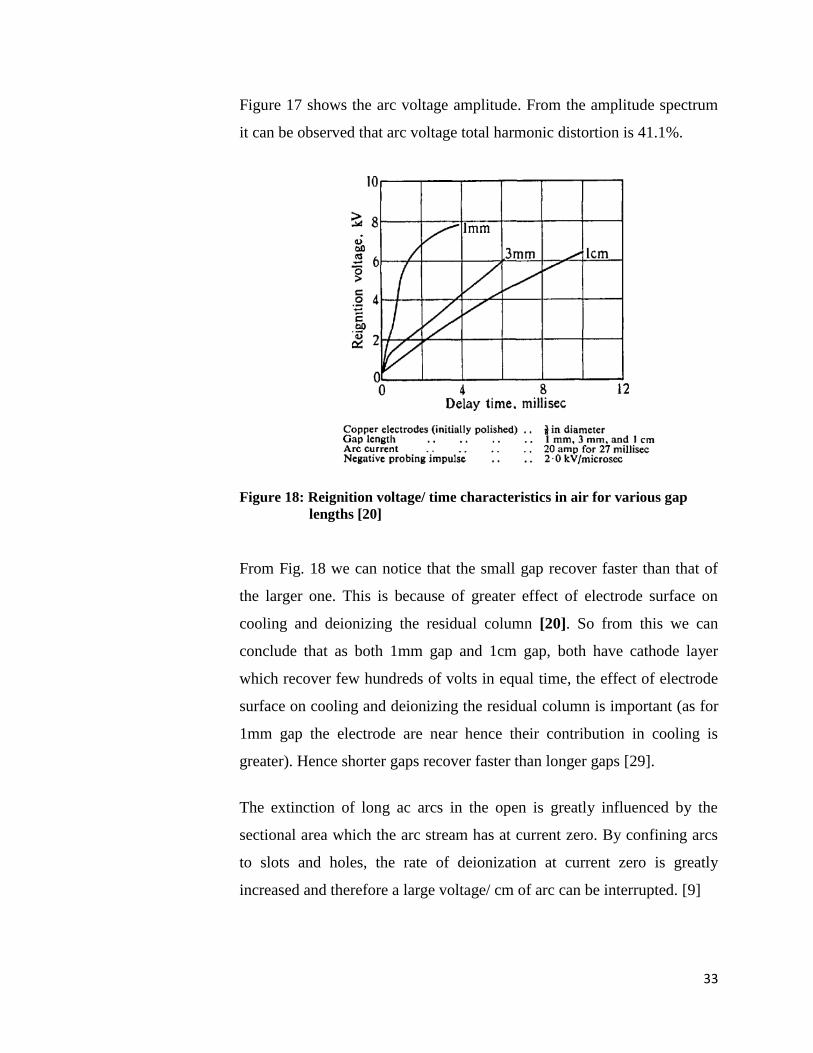
Figure 18: Reignition voltage/ time characteristics in air for various gap
lengths [20]
From Fig. 18 we can notice that the small gap recover faster than that of
the larger one. This is because of greater effect of electrode surface on
cooling and deionizing the residual column [20]. So from this we can
conclude that as both 1mm gap and 1cm gap, both have cathode layer
which recover few hundreds of volts in equal time, the effect of electrode
surface on cooling and deionizing the residual column is important (as for
1mm gap the electrode are near hence their contribution in cooling is
greater). Hence shorter gaps recover faster than longer gaps [29].
The extinction of long ac arcs in the open is greatly influenced by the
sectional area which the arc stream has at current zero. By confining arcs
to slots and holes, the rate of deionization at current zero is greatly
increased and therefore a large voltage/ cm of arc can be interrupted. [9]

34
Compton has shown that for the electric gradients which exist in the arc
stream at atm pressure ionization by collision is entirely inadequate to
supply the ions which are being lost. Also it has been found that ionization
by collision is also negligible at the gradient which is impressed upon the
arc space after arc extinction. Compton suggests that the high temperature
in the arc stream is responsible for the ionization. [9]
In the following Fig.19, we can see few gases showing the density of
ionization which is maintained entirely as a consequence of high
temperature.
In Fig. 19 below is ionization dependence of different gases on
temperature given by Saha's equation. We can see from these curves that
appreciable ionization does not start until a specific ionization temperature
of each gas. With further increase of temperature ionization increases very
rapidly.
Figure 19: Thermal ionization of the gases [9]

35
3.4 Electric field of non-refractory cathode after current
zero
Fig. 20: Distribution of electric field along cathode layer [22]
We can see from Fig.20 that immediately after current zero the electric
field in the cathode sheath grows very slowly.

36
3.5 Power losses from arc
Fig. 21 : Variation of power loss after arc interruption. (a) Arc current: 10A
(b) Arc current: 20A. PT= Total arc loss; PP= Positive coloumn loss.
Carbon electrodes, 4mm diameter; gap separation 5mm
From Figure 21, we can see that higher the current interrupted higher the
power losses near the interruption.
With refractory electrodes (carbon, tungsten, molybdenum) the hot
electrode mass cools only slowly and a net negative space charge will be
maintained by thermionic emission. Thus, for refractory arcs, reignition at
the electrode is easily achieved at low voltages. For cold-cathode arcs (e.g.
copper and mercury), the space charges are removed and the electrode
regions can be reformed only by the application of at least the minimum
sparking voltage, so that almost immediately after arc interruption (less

37
than 1 µs) voltage recovery to about 300 volts occurs. Clearly, in the latter
case, the process of thermal reignition in the gas will be masked, except
for very short times after current zero, by the spark breakdown required in
the electrode regions. [14]
3.6 Post arc energy
Post arc energy is an important parameter in deciding whether reignition
will occur or not. If the post arc energy is less than power losses arc will
extinguish and if post arc energy is greater than power losses arc will
reignite.
In Fig. 22, a successful interruption is shown with its respective post arc
current and post arc voltage. The calculated traces of post arc Power and
post arc Energy are shown as well.
Figure 22: Post arc voltage and current and calculated quantities [26]
It has been shown [26], that effect of di/dt (rate of change of current
before current zero) on post arc energy is more than that of dv/dt (rate of
change of voltage after current zero); which can be seen in Fig. 23 and
equation (1),but dv/dt cannot be neglected.

38
Figure 23: Variation dependence of post arc energy on di/dt and dv/dt [26]
and
(1)
From this calculation we can see the relative influence of di/dt is about
two times the relative influence of dv/dt. So this suggests that the
reignition is more probable with high current slope before current zero
than with low current slope before current zero. However as mentioned the
effect of dv/dt cannot be neglected. A low current slope before current
zero, but with a large dv/dt after current zero can also easily result in
reignition.

39
Chapter 4
4 EFFECT OF TEMPERATURE AND ARC
PARAMETERS
4.1 Effect of temperature
Figure 24, shows that the electric field intensity at the point of the cathode
surface decreases with the swelling of electron emission, which can be
explained by the reduction of net positive charge because of the increase
in electrons.
Figure 24: The relationship between the electric field intensity and the
cathode temperature [25]

40
Figure 25: The relationship between potential and the cathode
temperature [25]
Figure 25, shows potential drop of cathode sheath reduces with the
increase in cathode temperature, which is caused by the decrease in
electric field strength due to increase in electron emission due to
temperature.
Figure 26, shows the length of the cathode sheath drops with the increase
in cathode temperature.
Figure 26: Relationship length of the cathode sheath and cathode
temperature [25]

41
For an confined air, as the air temperature increases the kinetic energy of
the molecule increases and this exerts pressure on wall of the confine
material. Hence, pressure of the air increases as the temperature increases,
keeping the volume of the container constant. For an unconfined air
(which is not confined in any closed material), as the air temperature
increases, the gas expands, hence volume of air increases, but pressure
remains close to atmospheric pressure.
It should be noted that while happening of arc, it sends pressure waves to
the surrounding [40].This pressure wave is very strong when breakdown
happens and lightning is a good example of it. However due to open air
configuration, for small energy arcs, the pressure remains close to
atmospheric pressure.
Physical properties of the arc are greatly dependent on the temperature
[29]. The dependence of various physical properties of air, on temperature
is shown in Fig.27 below.
42
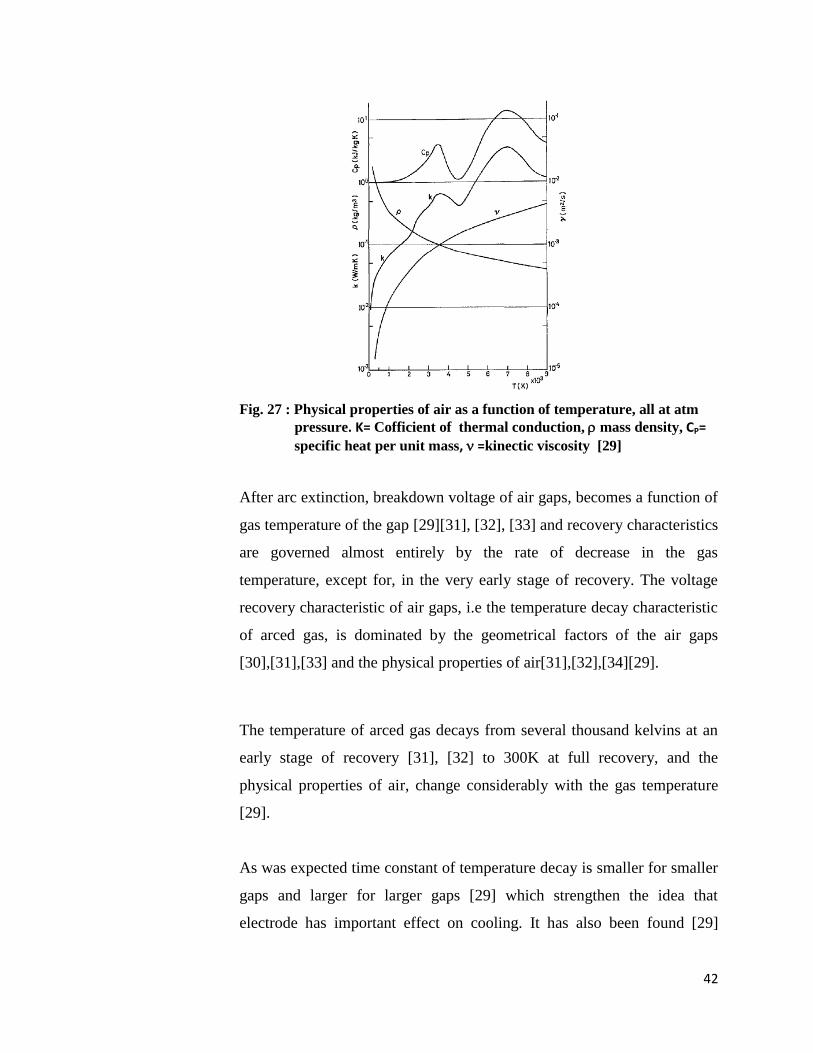
Fig. 27 : Physical properties of air as a function of temperature, all at atm
pressure. K= Cofficient of thermal conduction, mass density, CP=
specific heat per unit mass, =kinectic viscosity [29]
After arc extinction, breakdown voltage of air gaps, becomes a function of
gas temperature of the gap [29][31], [32], [33] and recovery characteristics
are governed almost entirely by the rate of decrease in the gas
temperature, except for, in the very early stage of recovery. The voltage
recovery characteristic of air gaps, i.e the temperature decay characteristic
of arced gas, is dominated by the geometrical factors of the air gaps
[30],[31],[33] and the physical properties of air[31],[32],[34][29].
The temperature of arced gas decays from several thousand kelvins at an
early stage of recovery [31], [32] to 300K at full recovery, and the
physical properties of air, change considerably with the gas temperature
[29].
As was expected time constant of temperature decay is smaller for smaller
gaps and larger for larger gaps [29] which strengthen the idea that
electrode has important effect on cooling. It has also been found [29]

43
greater the temperature of the arc, smaller the time constant, means arc of
very high temperature tend to cool faster than arc with lower temperature.
It can be seen in Fig. 28.
Figure 28: Time constants of the temperature decay process as a function of
gas temperature [29]
The Fig. 29 shows the temperature decay of air gap, after extinction of 150
A arc across spherical electrodes with gap distance 1mm, 3mm and 7mm;
derived by [29] with the help of Paschen’s curve and voltage recovery
characteristic of gap.
Fig. 29: Temperature decay of air after extinction of electric arc of 150A
[29]
44
It should be noted that immediately after arc interruption, the space is fully
ionised, and pashen law is not valid for ionised space [35], hence
temperature decay chractertics were not found in early period after
extinction of the arc.
4.2 Arc parameters
Two types of parameters can be readily used to gain insight in the
processes around current zero that are very relevant in deciding arc
interruption or reignition. [27]
These are called: (1) Direct parameters (2) Indirect parameters.
Direct parameters: These are the parameters that are directly available
from arc current and arc voltage (for instance arc conductivity which is
current/voltage). Use of these parameters gives insight into the margin of
the breaker in interrupting the current, effectiveness of shunt capacitances
etc.
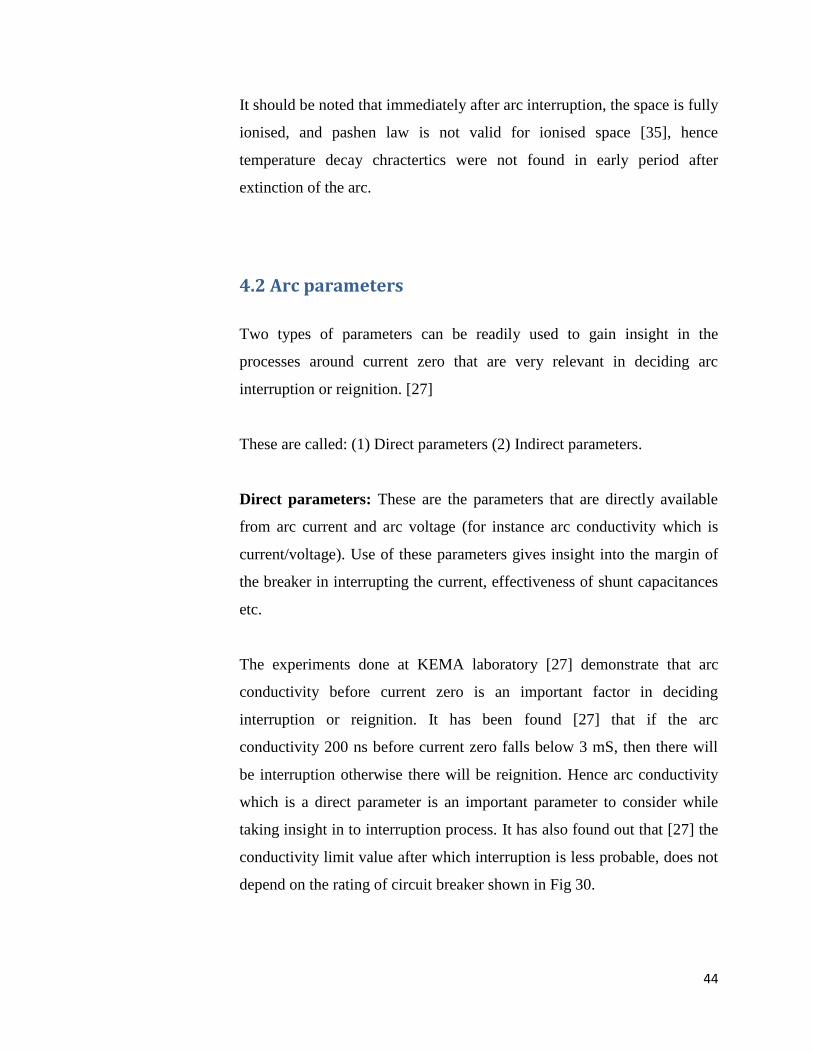
The experiments done at KEMA laboratory [27] demonstrate that arc
conductivity before current zero is an important factor in deciding
interruption or reignition. It has been found [27] that if the arc
conductivity 200 ns before current zero falls below 3 mS, then there will
be interruption otherwise there will be reignition. Hence arc conductivity
which is a direct parameter is an important parameter to consider while
taking insight in to interruption process. It has also found out that [27] the
conductivity limit value after which interruption is less probable, does not
depend on the rating of circuit breaker shown in Fig 30.
45
Fig. 30: Conuctivity value, 200 ns before current zero for circuit breakers of
different ratings. Circles indicate observed failures, squares
indicated observed interruptions. Horizontal lines indicates
conductivity limiting value before 200 ns of current zero after which
reignition happens [27]
Indirect parameters: Black-box models describe the wave traces of the
arc current and voltage by a set of mathematical equations [28]. Indirect
parameters are the parameters of a black box model of the arc. These
parameters can be used in analyzing interruption behavior under
conditions other than tested means which hasn’t been experimented yet
but having performed one basic experiment and after fitting the result in
some arc’s mathematical model, we will find the indirect parameters (for
instance arc time constant, power losses etc.). These indirect parameters
can be utilized to simulate the experiments which haven’t been performed.
Hence these parameters are useful tool for behavior forecasting of electric
arc.

46
4.3 Heat losses from arc
The electrical power is dissipated in three regions of the arc: anode,
cathode and plasma column. The area at cathode and anode has strong
effect on the flow of heat energy to the terminal. Heat loss of arc is an
important parameter in deciding how stable the arc is. Basically, heat
losses are of three kind; Radiation loss, Convective loss and Conduction
loss. Depending on the arc current, one out of these three losses is the
dominating one. If the sum of all these losses from the arc exceeds the
power input, arc becomes unstable and has more probability to extinct.
When power losses are equal to input power, arc is just stable. When
power input is more than power losses are becomes more stable. This
stability increases with increase in the power input and decrease in the
power losses. The explanation of these power losses is as follows:
4.3.1 Convection loss
As due to very high temperature of the arc which is basically caused by
Ohmic losses, the density of air in between the gap becomes lower than
the outward air. This causes a lift force to appear which makes the heated
air of light weight to move upward. Therefore the outward air, moves
downward and takes the position of lighter air and lighter air takes the
position of heavier air. Therefore this release of heat to surrounding from
the arc is called convection loss.

47
4.3.2 Radiation losses
All electric arcs emit radiation, the amount and character of which
depends on the atomic mass and chemical composition of gaseous
medium, the temperature and the pressure. As energy input to an arc
increases, higher states of ionization occur and higher level of radiation
result. By emitting radiation, the energy of arc gets lower.
Radiation from arc, is in the form of ultraviolet, visible and infrared light.
Since the intensity of radiation is high, arcs pose hazards to operator and
observers. UV radiation is particularly dangerous to the eyes but also can
cause sunburn-like damage to exposed skin, while infrared radiation
causes burning heat [37].
Radiation losses are dominant at high temperatures while the convection
has a major role at low temperatures. [38]
It has also been found [39] that, the electrode material has effects on
radiation extent. When Aluminum has been used as electrodes, the
radiation was 65% higher than that of Copper electrodes. Increase in arc
current gives almost linear rise in radiation. Increase in the electrode
separation, gave a rise in radiation that was slower than linear.
At pressure close to 1 atm, radiation is not a significant factor in heat
dissipation from the arc. At higher pressure, however the radiation may
become a very important factor in energy dissipation. [41]

48
The arc radiation losses in atm air are 1%, but they become significant at
pressure above 10 atm and for higher power arc. [42]
From all these research results, we can thus conclude that radiation losses
become an important factor when:
1. energy input to the arc, hence arc temperature is very high
2. pressure of the medium between the electrode gap before arcing is
much larger than atmospheric pressure.
3. electrode separation is large.
As during peak of the sinusoidal cycle of AC arc, the temperature is very
high hence during this period radiation plays an important role in heat
transfer.
4.3.3 Conduction losses
Conduction is movement of heat through a material. Conduction occurs
when rapidly moving or vibrating atoms and molecules interact with the
neighboring particles, thus transferring some of their kinetic energy to
them. In gases, conduction is due to the collisions and diffusion of the
molecules during their random motion. Photons in general, do not collide,
one another and hence heat transported by radiation is not regarded as
conductive.
Conduction has a dominant effect of heat transfer in solid. In gases the
conduction is very little, the reason being the atoms in solid are more close
to each other than gases, hence there are more collisions between atoms
hence more transfer of heat, than in gases. However, the thermal
conductivity of gases generally increases with increase in temperature.

49
4.4 Effect of thermal conductivity in cooling high
temperature space
Fig 31: Thermal conductivity of Air, Argon and carbon dioxide [45]
The variation of the thermal conductivity, depends rather strongly on the
nature of the gas as can be seen from Fig. 31, the high peaks at low
temperature are related to the phenomenon of molecular dissociation. [45]
During the first instants of the extinction of electric arc, the variation of
the axis temperature is mainly due to conduction and radiation losses
because convection tends to cool down the external parts of the plasma but
not the inner part.[45]
The lowest temperature at which peak thermal conductivity of nitrogen
occurs is at 7000K, that means after arc extinction [21], the decay of
temperature until 7000K is very fast but after that it is very slow. In SF6,
there are several peaks of thermal conductivity at around 2500K, which
leads to rather strong cooling until 2500K.

50
Chapter 5
5 EXPERIMENTAL RESULTS
5.1 Indirect parameters
It has been investigated [43] that the conductance of the arc at current zero
is a good electrical parameter for determination of the ability of the
circuit-breaker to interrupt the current. The reason for this, is that large
power loss increases the chance for interruption. Large power loss is equal
to small conductance. Because the resistance is the inverse of the
conductance, the resistance at current zero is an equally good parameter.
The behavior of space in the electrode gap, after arc extinction was
originally represented by Cassie and Mayr.
5.1.1 Cassie and Mayr Models
Cassie and Mayr, working independently, formulated two differential
equations based on rather different concepts of the physical nature of the
arc colomn.
Cassie assumed an arc column within which the temperature is fixed and
uniform in space and time, having resistivity, power loss and energy
content being constant. The cross sectional area varies with current and
time.
Mayr assumed a cylindrical arc column of constant cross-sectional area
within which the temperature varies with the arc’s radial dimension and
with time.

51
It has been observed that the Cassie model, with its steady state arc
voltage, fits best the voltage and current waveforms for the arc during the
period prior to current zero, whereas the Mayr model, describes best the
characteristics of a low current arc. Mayr’s equation becomes a better
approximation only when the arc temperature falls to a level just above that at
which electrical conductance due to thermal ionization practically disappears and
the energy is transferred mainly by radial heat conduction.[46]
In this master thesis, for first experiment of measuring arc parameters,
low current AC arc of 10A amplitude has been tested, in open air. The
main purpose was to find how the conductivity falls near current zero
period. As we were more concerned with conductivity decay near current
zero and the arc was of low current, therefore Mayr model has been used
as it is suitable to find conductivity decay for low current arcs. The Mayr
model is as follows:
For low current electric arcs, the arc conductance is assumed to vary with
a passage of time around current-zero, in accordance with
(
)
where is arc time constant, is arc power loss.
At instant of current zero, the power input is zero and therefor, , in
equation (2) and we are left with equation (3) as follows:
which is homogenous differential equation with solution as follows:
52
Where is some constant. The parameters and are called arc
parameters. Arc time constant is defined as the ratio of energy stored per
unit volume to the energy loss rate per unit volume [p 1.3, 41]. When the
energy loss rate in the gap increases than energy stored in the gap, time of
conductivity decay is less (means small time constant). This stored power
in the gap basically is arc current multiplied with arc voltage.
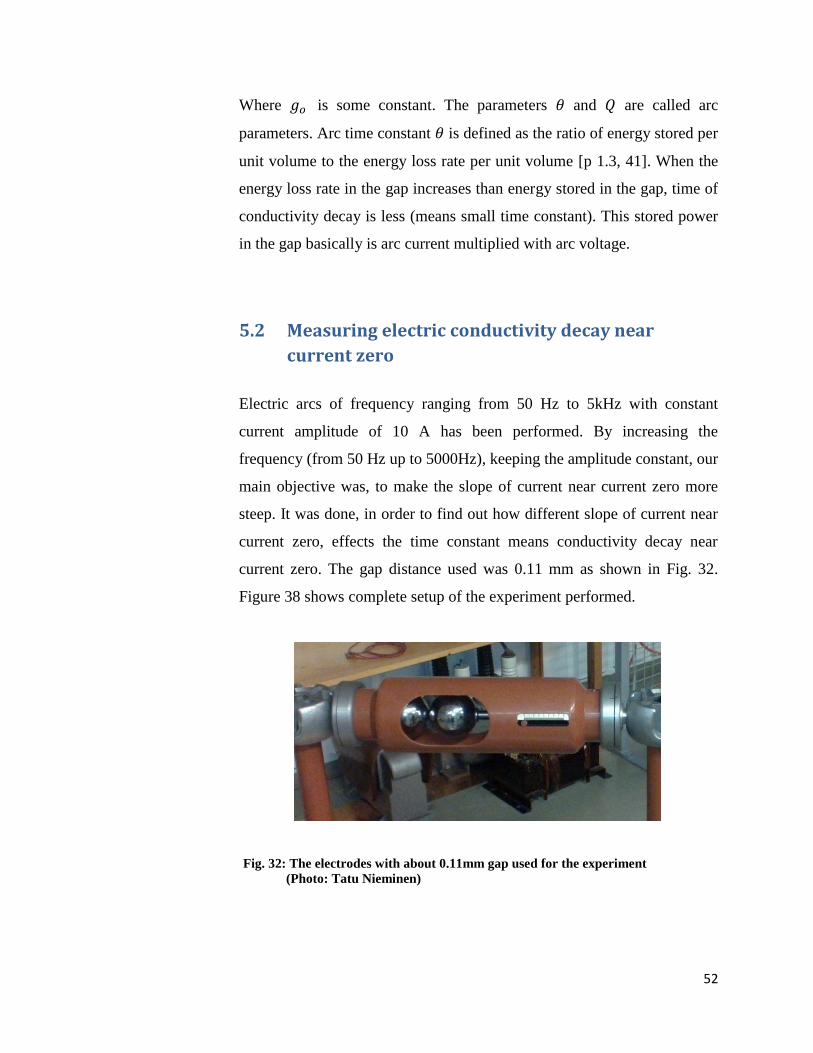
5.2 Measuring electric conductivity decay near
current zero
Electric arcs of frequency ranging from 50 Hz to 5kHz with constant
current amplitude of 10 A has been performed. By increasing the
frequency (from 50 Hz up to 5000Hz), keeping the amplitude constant, our
main objective was, to make the slope of current near current zero more
steep. It was done, in order to find out how different slope of current near
current zero, effects the time constant means conductivity decay near
current zero. The gap distance used was 0.11 mm as shown in Fig. 32.
Figure 38 shows complete setup of the experiment performed.
Fig. 32: The electrodes with about 0.11mm gap used for the experiment
(Photo: Tatu Nieminen)

53
Fig. 33: Complete setup of the experiment to find out indirect parameters of
arc (Photo: Tatu Nieminen)
Arc time constant and power losses, 15 µs before current zero has been
found. For each frequency sample (for instance 50 Hz and so on), about
150 zero crossing samples of arc current and arc voltage has been obtained
from the experiments. Then after, the results were analyzed in MATLAB.
The current and voltage waveform of the arc contained quite high
frequency ripples. In order to make the waveform, smoothened, an
MATLAB filter has been used (see IIR Filter in the appendix). Arc
conductivity has been obtained by dividing arc current to the arc voltage
and we obtained 150 samples of arc conductivity, from which an average
of all the samples is taken. As our main purpose was to obtain, arc
conductivity decay for specific time before current zero, hence a specific
amount of sample points before current zero has been taken so that, we
have, the average conductivity curve with a negative slope (means
conductivity is decreasing).

54
5.2.1 Procedure to find out arc time constant and power losses for 50
Hz
For 50 Hz, arc voltage and arc current are shown in Fig. 34, with
demonstration how the 2000 samples of arc voltage (Yellow color in Fig.
34) and 2000 of arc current (Black color in Fig. 34) has been taken before
each current zero.
Fig. 34: Arc voltage and arc current for 50 Hz frequency
It should be noted that this is the demonstration for one case that how,
2000 samples before current zero (black color) and 2000 samples before
voltage zero (Yellow color), are taken as arc current and arc voltage are
negative, but we take all the 2000 samples before current zero, when arc
voltage and arc current are both positive and both negative.
After this, input power which is arc voltage times arc current, for all 2000
samples before current zero (when arc voltage and arc current both
positive and both negative), has been found out and it can be seen on
following Fig. 35.
0.02 0.04 0.06 0.08 0.1 0.12 0.14 0.16 0.18 0.2 0.22
-10
-5
0
5
10
Time[sec]
Arc Voltage and Arc current after filter
newvoltage
newcurrent

55
Fig. 35: Arc Input power for a number of cycles, 2000 samples before
current zero
The curves, which were quite offset (for instance the very upper red curve
in Fig.35), were removed in few cases such that we have very accurate
result, when calculating the average value of all these input power curves
shown in Fig. 36. The negative sign on horizontal axis of Fig. 36 shows,
time before current zero.
Fig. 36: Arc average input power for a number of cycles
0 200 400 600 800 1000 1200 1400 1600 1800 20000
1
2
3
4
5
6
7
8VI, Power Input[W]
2000 samples points before current zero
Pow
er
Input[
W]
-2 -1.8 -1.6 -1.4 -1.2 -1 -0.8 -0.6 -0.4 -0.2
x 10-4
0
0.1
0.2
0.3
0.4
0.5
0.6
0.7
0.8
0.9
1Average input power Before Current Zero(W)
Time [sec] before current zero
Avera
ge I
nput
Pow
er[
W]

56
After that Arc conductivity has been found, by dividing arc current to arc
voltage, by taking each sample point of arc voltage and current, at specific
time before current zero, for 2000 sample points, for a number of cycles.
This is demonstrated in Fig. 37.
Fig. 37: Arc conductivity for a number of cycles before current and voltage
zero
Similar procedure which has been adopted for calculating average input
power, has been taken in calculating average conductivity. The Fig. 38
shows the average conductivity decay.
0 200 400 600 800 1000 1200 1400 1600 1800 20000
0.2
0.4
0.6
0.8
1
1.2
1.4
1.6
1.8
2Conductivity decay before current zero
2000 samples points before current zero
Conductivity [
S]

57
Fig. 38: Arc average conductivity for a number of cycles
In order to find arc time constant and power losses, the procedure
followed by [44] was adopted which is explained as:
Taking in to account the Mayr’s equation, firstly dg/dt curve, for a specific
time before current zero has been found which is shown in Fig. 39.
-2 -1.8 -1.6 -1.4 -1.2 -1 -0.8 -0.6 -0.4 -0.2
x 10-4
0.34
0.36
0.38
0.4
0.42
0.44
0.46
0.48
0.5Average Conductivity Before Current Zero
Time [sec] before current zero
Avera
ge C
onductivity [
S]

58
Fig. 39: dg/dt, 0,2ms before current zero
Then dg/dt/g curve versus time, before current zero has been drawn as
shown in Fig. 40.
Fig. 40: dg/dt/g, 0,2ms before current zero
-2 -1.8 -1.6 -1.4 -1.2 -1 -0.8 -0.6 -0.4 -0.2
x 10-4
-6
-5
-4
-3
-2
-1
0x 10
4 dg/dt
Time [sec] before current zero
dg/d
t
-2 -1.8 -1.6 -1.4 -1.2 -1 -0.8 -0.6 -0.4 -0.2
x 10-4
-18
-16
-14
-12
-10
-8
-6
-4
-2
0x 10
4 dg/dt/g
Time [sec] before current zero
1/g
*dg/d
t

59
After this, dg/dt/g has been plotted with input power. Near to very current
zero, (which we were scrutinizing the most, in order to find out the
behavior of conductivity fall), a tangent at different points has been drawn.
The point, where this tangent in dg/dt/g versus input power graph, meet
with dg/dt/g=0, from that point a straight vertical line meeting the input
power axis, has been drawn. The point where this straight vertical line
meets the input power axis, is the power loss(W) at that specific time.
The point where tangent line meets dg/dt/g axis, with input power=0, has
been divided by one, which is finally arc time constant (sec) at that
specific time.
A more closer look of this procedure is shown in Figure 41.
Fig. 41: Method showing, how arc time constant and power losses has been
found
Arc time constant and arc power losses for 0,2 ms, before current zero, can
be seen in Figure 42 and Fig. 43 respectively.
0 0.01 0.02 0.03 0.04 0.05 0.06 0.07
-16
-14
-12
-10
-8
-6
-4
-2
0
x 104
Input power vi(W)
dg/dt/g vs Input Power
(dg/d
t)/g
[per
sec])

60
Fig. 42: Arc time constant, 0.2 ms before current zero
Fig. 43: Arc power losses
-2 -1.8 -1.6 -1.4 -1.2 -1 -0.8 -0.6 -0.4 -0.2
x 10-4
0
1
2
3
4
5
6
7
8x 10
-4
time[sec]
tim
e c
onsta
nt
[sec]
-1.2 -1 -0.8 -0.6 -0.4 -0.2 0
x 10-4
0
10
20
30
40
50
60
70
80
90
100
time[sec]
Pow
er
losses (
W)
time vs Power losses

61
After finding, arc time constant and arc power losses at each specific time,
these values has been put in the basic Mayr arc model and then arc
conductivity has been found out in order to check our results. The
following Fig. 44, shows the arc conductivity using Mayr model after
filling arc parameters at each specific time.
Fig. 44: Arc conductivity using Mayr arc model, after filling arc parameters
It should be noted that all these demonstration shown is for 50 Hz
frequency cycles. Similar procedure has been followed for frequency up to
5kHz.
-2 -1.8 -1.6 -1.4 -1.2 -1 -0.8 -0.6 -0.4 -0.2
x 10-4
0.35
0.4
0.45
0.5New Conductivity after filling arc parameters
time before current zero
g[S
]
62
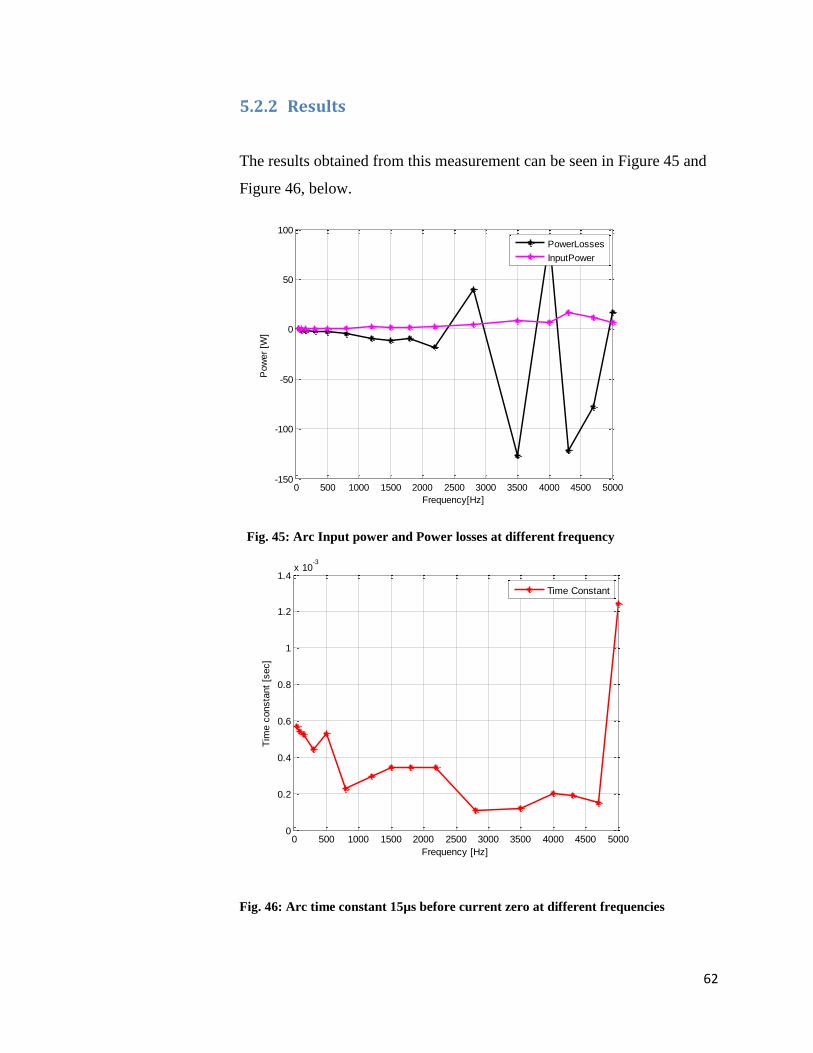
5.2.2 Results
The results obtained from this measurement can be seen in Figure 45 and
Figure 46, below.
Fig. 45: Arc Input power and Power losses at different frequency
Fig. 46: Arc time constant 15µs before current zero at different frequencies
0 500 1000 1500 2000 2500 3000 3500 4000 4500 5000-150
-100
-50
0
50
100
Frequency[Hz]
Pow
er
[W]
PowerLosses
InputPower
0 500 1000 1500 2000 2500 3000 3500 4000 4500 50000
0.2
0.4
0.6
0.8
1
1.2
1.4x 10
-3
Frequency [Hz]
Tim
e c
onsta
nt
[sec]
Time Constant
63
5.2.3 Discussion
With the increase in frequency, the arc power losses, using the procedure
[44], has sometimes positive and sometimes negative value. The negative
power loss at some specific frequency means, 15 µs before current zero,
tangent on dg/dt/g curve on dg/dt/g versus power input graph graph meets
the dg/dt/g=0, line at negative value of input power. From these results of
measuring arc time constant and power loss, with the increase of
frequency, no strong conclusion can be concluded.
5.2.4 Comparison of the results with other research work
In experiment done by [44], where circuit breaker contacts in Co2 medium
with pressure of 0,2 Mpa, gets apart on initiation of fault with arc current
of 1,7 kA (peak value) with gap distance which increases from 0 to
15,4mm (Fig. 47) where arc interrupts, arc parameters has been found, 2µs
before current zero. It should be noted that in [44], arc parameters has
been found when the interruption was successful. This means arc
conductivity value has been found from last waveforms current and
voltage. Arc time constant and arc power losses, 2µs before current were
1,3 µs and 0,32 kW respectively.
According to [48], the arc time constant for air at 0,2 Mpa with arc current
frequency of 45 kHz, were also found out to be range of few µs, but again
this was the case when interruption was successful.
It should be noted that in our experiment, arc parameters has been found
when there was no interruption which means that current and voltage
waveforms were continuous. The input power in [44], was much higher
than in our case as peak arc current in our case was 10A.

64
As there has been no interruption in our case, hence we expect arc time
constant to be larger than few µs; which was the case, as arc time constant
found out to be in range of ms (Fig. 46). Arc power losses were found out
to be also small, because arc during the experiment did not interrupt.
Because if it would have been interrupted then we would expect more
power losses. According to [48], arc time constant of air are greater than
that of Co2.
Fig. 47: Arc current, arc voltage and distance between the gap [44]
5.3 Effect of temperature on breakdown voltage
The second experiment has been performed in order to find out the effect
of temperature on breakdown voltage in air for different five materials.
The cross section of the material used as electrode was circular with
electrode shape being rounded. Five materials used, in order to find out the
differences of the effect of temperature on breakdown voltage of air, are as
follows:

65
1. Stainless steel
2. Aluminum
3. Copper
4. Brass
5. Iron
The diameter of the rods used was 20mm. A furnace has been used to set a
particular temperature, and rods were immersed in this furnace shown in
Fig.48. This causes a uniform temperature between electrode gap.
Complete setup of the experiment performed can be seen in Fig. 50. The
breakdown voltage has been measured from ambient temperature until
before, 100-200 degrees less than the melting temperature of the material
rod used. The applied voltage used was sinusoidal with rise time of 1kV/s.
The distance between the gap has been kept 5mm with an error in the
precision of 0,2mm. As there is extension in the material with rise in
temperature and as the structure of the material used is cylindrical with
rounded edges, there has been extension of the material radially as well as
axially. So when performed the test, each time when temperature has been
increased, there has been material extension axially as well as radially.
That means, when raised the temperature in the furnace, after the test in
ambient air with the gap distance of 5mm, the gap distance has been less
than 5mm due to axial extension. So each time, when temperature has
been raised, the gap has been adjusted to 5mm, so that a good comparison
of the result can be made at same gap distance. This adjustment has been
done with the help of meter shown in Figure 49, such that when
temperature in the furnace increased from one point to the next, before
measuring the next temperature breakdown voltage value, the electrodes
were brought together such that they touch and then by seeing the reading
from the meter, 5mm gap has been set.
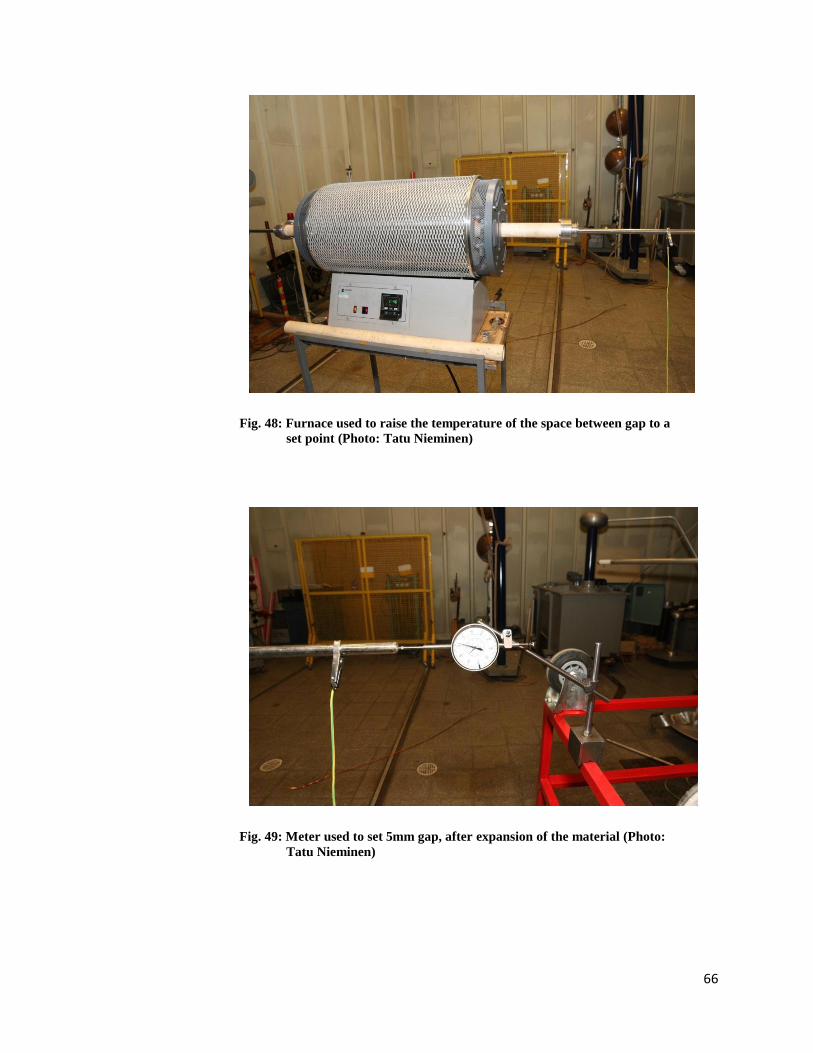
66
Fig. 48: Furnace used to raise the temperature of the space between gap to a
set point (Photo: Tatu Nieminen)
Fig. 49: Meter used to set 5mm gap, after expansion of the material (Photo:
Tatu Nieminen)

67
Fig. 50: Complete setup of the experiment with a transformer (Photo: Tatu
Nieminen)
5.4 Measurements
Test 1: Stainless steel
First, test has been performed with stainless steel. The ambient
temperature was 21,9 oC, with Relative humidity 15,4 %, Absolute
humidity 2,97 g/m3 and with pressure 1020,1 hpa on the day this
experiment has performed. The melting point of stainless steel is 1510 oC
[18], therefore temperature at which last breakdown voltage measurement
has been done, was 1300 oC.
Test 2: Aluminum
68
Second, test has been performed with Aluminum. The ambient
temperature was 23,4 oC, with Relative humidity 33 %, Absolute humidity
6,945 g/m3 and with pressure 1017,27 hpa on the day this experiment has
performed. The melting point of stainless steel is 660 oC [18], therefore
temperature at which last breakdown voltage measurement has been done
was 400 oC.
Test 3: Copper
Third, test has been performed with Copper. The ambient temperature was
22,5 oC, with Relative humidity 42,4 %, Absolute humidity 8,476 g/m3
and with pressure 1006,33 hpa on the day this experiment has performed.
The melting point of stainless steel is 1084 oC [18] therefore temperature
at which last breakdown voltage measurement has been done was 850 oC.
Test 4: Iron
Fourth, test has been performed with iron. The ambient temperature was
22,2 oC, with Relative humidity 19,1 %, Absolute humidity 3,753 g/m3
and with pressure 1006,24 hpa on the day this experiment has performed.
The melting point of iron is 1536 oC [18], therefore temperature at which
last breakdown voltage measurement has been done was 1350 oC.
Test 5: Brass
Fifth, test has been performed with Brass. The ambient temperature was
22,9 oC, with Relative humidity 24 %, Absolute humidity 4,909 g/m3 and
with pressure 1003,46 hpa on the day this experiment has performed. The

69
melting point of iron is 930 oC [18], therefore temperature at which last
breakdown voltage measurement has been done was 765 oC.
The variation of breakdown voltage of air with temperature, using
different electrode material can be seen in Fig. 51.
5.5 Test Results
From the results shown in Fig. 51, we can see that for all the materials the
breakdown voltage decreases more or less in the same fashion when
temperature of the electrode as well as between the electrode gap,
increases (as the electrode were immersed in furnace, so when temperature
in the furnace is raised, the electrode temperature also gets increased). It is
also very interesting to know that for Iron and Stainless steel, the
breakdown voltage stay constant for some temperature variation (for Iron
breakdown voltage stay constant from 1000 oC to 1200
oC and for
Stainless steel breakdown voltage stay constant from 1000 oC to 1150
oC
and then it decreases again following the original trend.

70
Fig. 51: Variation of breakdown voltage with temperature increase for different
electrode materials
5.6 Comparison with other research work
In a research carried out to find out effect of temperature on
breakdown voltage in air [47], it has been found that for millimetric
gap, in an approximately uniform field, breakdown voltage is
independent of the electrode material, where the electrode material
used has been Copper, Elkonite (tungsten-copper) and Nimonic
(nickel-chromium) and gap distance used were from 0,5mm, 1mm
and 2 mm. In our experiments, the electric field was also nearly
uniform due to rounded edge electrodes, and the difference of the
value of breakdown voltage at specific temperature for different
materials was found out to be not very large. It is also good to notice
the fashion in which breakdown voltage in [47] decreases with
increase in temperature, matches with our results.
0 100 200 300 400 500 600 700 800 900 1000 1100 1200 1300 14000
2
4
6
8
10
12
14
Temperature (oC)
Bre
akdow
n V
oltage (
kV
)
Copper
Stainless.Steel
Aluminum
Iron
Brass

71
Chapter 6
6 CONCLUSION AND FUTURE WORK
6.1 Conclusion
From this research work, it can be concluded that electric arc being
complex phenomenon, depends on many factors, for instance the electrode
gap space, electrode material, humidity etc. One of the important factor,
that it highly depends on, is temperature. It can be concluded that the
success of arc interruption depends on the temperature of the space
between gap, as we can see from results of experiment 2, the breakdown
voltage decreases with increases in temperature of the space between the
gap. However it does not mean that increase in temperature give a linear
decrease in breakdown voltage in open air as for a specific temperature
rise, the breakdown voltage remains constant. There was not much
difference in breakdown voltage for different electrode material used as
electrode in air when temperature of the space as well as of the electrode
has been increased. Our results match with [47], who says that in uniform
E-field, the breakdown voltage is independent of the material of the
electrode used.
Arc conductivity measurement, to get deeper understanding of interruption
or failure of arc, is a good factor to look on. As concluded by [27], there
must be some limiting value of arc conductivity, no matter what the
voltage rating of the equipment, such that if the arc conductivity crosses
that value, then reignition occurs. But from measured arc time constant
and power losses values, we were not able to conclude that how increase
in frequency hence increase in current slope effect the arc time constant.
However as expected, for our case where there was no interuuption, arc
time constant comes out to be in range of ms where in other researches

72
[44],[48], where there has been interruption, it came out to be in range of
µs.
From the literature study used in this research, we can conclude that for
short gap arcs the electrode material has dominating effect due to
immediate recovery of cathode layer as well as quite low temperature of
the electrodes than the arc column; however with gap greater than a inch,
the gas in space between the electrode gap has dominating effect.
6.2 Future work
As for experiment 2, performed during this research work, a arc furnace
has been used which increases the temperature of the electrode material as
well as the air space in the gap. Therefore we found the breakdown
voltage dependence on temperature. However it is good to know how only
the heated air affects the breakdown voltage and how the heated electrode
only effect the breakdown voltage in air for millimetric gaps. It will give
us better understanding that, for short gap (in our case 5mm), which has
the dominating effect on breakdown voltage, is it heated space in the gap
or heated electrodes. This can be done for instance by heating the
electrode, in furnace and then taking out of it in atmospheric air, and
applying the voltage across the electrodes. The another test which will
give the affect of heated space only on breakdown voltage, can be
performed by, firstly heating the arc furnace and then immersing the cool
electrodes in it.

73
References:
[1] S. Coulombe and J. Meunierr, ‘Arc-cold cathode interactions:
parametric dependence on local pressure’, Plasma Sources Sci.
Technol. 6, 1997, pp. 508–517.
[2] T. Roininen, C. E. Sölver, H. Nordli, A. Bosma, P. Jonsson, A.
Alfredsson, ‘ABB circuit breakers’, Application guide, pp.1-135.
[3] Frind,G.Z Angew Phys 42:515, 1960.
[4] S. Théoleyre, ‘MV breaking techniques’, Cahier Technique Schneider
Electric no. 193, pp.1-31.
[5] M. Abdel-Salam, H. Anis, A. El-Morshedy, ‘High-Voltage
Engineering, Theory and Practice’, Second Edition, CRC Press, 2000,
760 p.
[6] A.E. Guile, ‘Arc-electrode phenomena’, Preceeding of the institution
of Electrical Engineers , Volume 118, Issue 9, September 1971, pp.
1131 – 1154.
[7] Y. Goda, M. Iwata, K. Ikeda and S. Tanaka, ‘Arc voltage
characteristics of high current fault arcs in long gaps’, Vol. 15, Issue
2, April 2000, pp. 791-795.
[8] D.F. Amer, C.H Flurscheim, S.M. Gonek, M.N. John, M.W.Kennedy,
D.Legg, E.Maggi, J.S. Morton, M.P. Reece, J.A.Sullivan, F.1. Mech,
‘Power circuit breaker theory and design’, Peter Peregrinus Ltd.,

74
England, 548 p.
[9] J. Slepian, ‘Extinction of long ac arcs’ , Transactions of the American
Institute of Electrical Engineers, Vol. 49, Issue , April 1930, pp. 421 –
430.
[10] E. P. A Lanen, M. Popov, L. Sluis and R.P.P Smeets, ‘Vacuum circuit
breaker current zero phenomenon, IEEE Transactions on Plasma
Science, Vol. 33, issue 5, pp. 1589-1593.
[11] J.A bittencourt, ‘Fundamentals of plasma physics’, 3rd
edition,
Springer-verlag, Newyork, USA, 678 p.
[12] J. F. Perkins, ‘Dielectric recovery and interruption variability of air
arcs at atmospheric pressure’, IEEE Transactions on Power Apparatus
and Systems, Volume PAS-93, Issue 1, Jan. 1974, pp. 281-288.
[13] J. F. Perkins and A. B. Parker, ‘Mechanism of dielectric recovery in
uniform and nonuniform-field gaps after high-current high pressure
spark discharges’, Proc. of IEE, vol. 117, Issue 7, pp. 1460-1466,
July 1970.
[14] K.G. Evans, D.C. Strachan, H. Edels, ‘Refractory Electrode region
recovery following arc interruption’, Proc. of IEEE, Volume 59,
Issue 4, April 1971, pp. 525- 534.
[15] J. F. Perkins and A.B. Parker, ''Effects of changes in ionization and
attachment coefficients on the dielectric recovery of high current air
75
gaps'', J. Of Applied Physics, vol. 4, No. 7, 1970, pp. 2895-2902.
[16] H. Ryzko, ''Impulse breakdown voltages of sphere-plane gaps in air
containing ozone and nitric oxides'', Gas Discharge and the Electrical
Supply Industry(Butterworth Scientific Publications Ltd., London),
1962, pp.192-201.
[17] V.V. Terzija, H.-J. Koglin, ‘ Testing, Modeling and simulation of
long arcs in still air’, Power Engineering Society Winter Meeting,
2001. IEEE, Volume 3, Conference publications, 2001, pp.1140-1145.
[18] http://www.engineeringtoolbox.com/melting-temperature-metals-
d_860.html (date last visited: 09.07.2012)
[19] V.V Terzija, H.-J. Koglin, ‘ Long arc in free air: Laboratory testing,
modeling, Simulation and model parameter estimation’, IEE
Proceedings- Generation, Transmission and Distribution, Volume
149, Issue3, May 2002, pp. 319-325.
[20] W.O.Kelham, ‘The recovery of electric strength of an ARC-
Discharge coloumn following rapid interruption of the current’,
Proceedings of the IEE-Part 2: Power Engineering, Volume 101, Issue
81, June 1954, pp. 321-334.
[21] A. Ziani and H. Moulai, ‘Extinction properties of electric arcs in high
voltage circuit breakers’, Journal of Physics D: Applied Physics, Vol.
42, No. 10, 29 April 2009.

76
[22] Z. Kolacinski, ‘Modeling of short arc re-ignition’, Journal of
Physics D: A.Physics, Volume 26, Issue 11, 1941.
[23] H. Edels, Y. Ettinger, ‘Arc interruption and thermal reignition’,
Proceedings of the IEE- Part A: Power Engineering, Volume 109,
Issue 43, 1962, pp. 89-98.
[24] W. V. S. Azevedo, W.L.A Neves, D. Fernandes, B.A. Sousa, R.M.
Soares ‘Device to Limit Transient Recovery Voltage’, Transmission
and Distribution Conference and Exposition: Latin America,
Conference publication, 2010, pp. 1-6.
[25] L. Hui, Li J-. Feng. X. W-. dong, W.S-. De and W.Hai, ‘ Influence
of the Electron Emission on the properties of the cathode sheath’, Vol.
2, No. 1, 2000.
[26] Adriaan Johannes Pieter de Lange, ‘High Voltage Circuit breaker
testing with a focus on three phases in one enclosure gas insulated
type breakers’ Doctorate thesis, Technical University of Delft,
Netherland, Nov. 2000, 186 p.
[27] R.P.P. Smeets, V. Kertesz, ‘A new arc parameter database for
characterization of short-line fault interruption capability of high-
voltage circuit breakers’, Kema T&D Testing, The Netherlands,
CIGRE 2006.
[28] CIGRE WG 13.01, ‘Application of black box modeling to circuit
breakers’, Electra no. 149, 1993, pp. 41-71.

77
[29] K.Tsuruta and H.Ebara, ‘ A model of gas temperature decay after arc
extinction of small air gaps’, Proceedings of the 3rd
International
conference on Properties and Applications of Dielectric Materials,
Vol. 1, 1991, pp. 377-380.
[30] K. Tsuruta, I. Takahashi, Y. Kanzaki, T. Ojima and Y. Kmuro,
‘Experimental study of the voltage recovery characteristics of small air
gaps’, IEEE Trans. On Plasma Science, Vol. 17, No. 3, 1989, pp. 560-
564.
[31] H. Edels, D. Whittaker, K.G. Evans and A.B. Shaw, ‘Experiments
and theory on arc reignition by spark breakdown’, Proc. IEE Vol. 112,
No. 12, pp. 2343-2352, 1965.
[32] G.A Farrall and J.D. Combine, ‘Recovery strength measurements in
arcs from atmospheric pressure to vacuum’, IEEE Tans. On power
Apparatus and Systems, Vol. PAS-86, No. 8, pp.927-932, 1967.
[33] J.F. Perkins and A.B. Parker, ‘Mechanism of dielectric recovery in
uniform and non-uniform field gaps after high-current high pressure
spark discharges’’. Proc. IEE, Vol. 117, No.7, pp.1460-1466, 1970.
[34] S.L Moran and L.F.Rinehalt, ‘Voltage recovery time of small spark
gaps’, IEEE Trans. On Plasma Science, Vol. PS-10, No. 4, pp. 277-
280, 1982.
[35] Alston LL, High voltage technology. Oxford: Oxford University
Press, 1968.
[36] Y.Yokomizu, T. Matsumura, R. Henmi, Y. Kito, ‘Total voltage drops
in electrode fall regions of SF6, argon and air arcs in current range
78
from 10 to 20000 A’, Journal of Physics D: A. Physics, Vol. 25,
No.5, 1996.
[37] Robert W. Messeler, ‘Principles of welding: Processes, Physics,
Chemistry, and Metallurgy’ Printed on 2004, 685 p.
[38] F. V-.Tahami, M. Zehsaz, M.S -.Sadigh , ‘Finite Element Analysis of
the In-service-Welding of T Joint Pipe Connections’, European
Journal of Scientific Research , ISSN 1450-216X, Vol.40 No.4, 2010,
pp. 557-568.
[39] E. Fjeld, S. T. Hagen, D. Bjerketvedt, W. G. J. Rondeel, ‘ Radiation
Measurements of High Current Arcs in Air’, 30th ICPIG, August 28th
- September 2nd, Belfast, UK, 2011.
[40] R. H. Lee, ‘Pressure developed by arcs’, IEEE Transaction on
Industry Applications, Volume IA-23, Issue 4, July 1987, pp. 760-
763.
[41] Bharat Heavy Electricals Limited (BHEL), ‘Hand book of
switchgears’, Tata Mcgraw-Hill, 2005, 19.14 p.
[42] A. Fridman, ‘Plasma chemistry’, Cambridge university press, 2008,
USA, 963 p.
[43] R.P.P. Smeets, and V. Kertész, ‘Evaluation of high-voltage circuit-
breaker performance with a validated arc model’, IEE Proc. on
Generation, Transmission and Distribution, Volume 147, Issue 2, Mar
2000, pp. 121-125.

79
[44] T. Matsumura, I. Morooka, Y. Yokomizu, M. Suzuki ‘Arc
Parameters in Co2-blast quenching chamber with high-pressure
storage tank of different pressures’, Elsevier, Kidlington, Royaume-
Uni, Vol. 80, 2006, pp. 1305-1310.
[45] A. Gleizes, J. J Gonzalez and P. Freton, ‘Thermal plasma modelling’,
Journal of Physics D: A. Physics, Vol. 38, No. 9, April 2005.
[46] T.E Browne, IEEE Transaction, Volume PAS-97, 1978, pp. 478-484.
[47] L.L Alston, ‘High-temperature effects on flashover in air’, Power
Engineering, Proceedings of the IEE-Part A, Volume 105, Dec.2008,
pp. 549-553.
[48] K. Mochizuki, T. Ueno, H. Mizoguchi, S. Yuasa and S.
Okabe,‘Evaluation of Interruption Capability on Various Gases’ IEEJ
Transactions on Power and Energy, Volume 124, Issue 2, 2004,
pp. 299-306.

80
APPENDIX
1. Matlab commands for measuring arc time constant
1.1 Matlab commands for 50 Hz, to find out arc time constant and
power losses
clear all; close all; clc
%Loading the sample points of measured arc current waveform
and naming it %''Current'' current=ReadLeCroy('C2ballgapcurrent_50hz00000.trc');
%ZeroCSamples is a function built which gives number of
samples points for %one complete sin cycle, we are dividing by 100 as we need
2000 samples %before current zero samples = ZeroCSamples(current)/100;
%IIR Filter is a filter made to remove, ripples of very
high frequency %components from current and voltage waveforms of arc newcurrent=IIRfilter(current.y,samples); figure(1) %plot(current.x,current.y) where current.x represents time
sample points hold on; grid on; plot(current.x,newcurrent,'m') title('Current(A)')
%EtsiNollat function find the zeros of newcurrent as
newcurrent is filtered %waveform of current currentZeros = EtsiNollat(newcurrent); %Now we will find the indices where zeros of newcurrent
occurs currentZeroind = find(currentZeros); %Now we will take all 2000 indicices before current zero currentIndLow = currentZeroind-samples; currentIndHigh = currentZeroind-floor(samples/1000);
%Same procedure goes for voltage waveform voltage=ReadLeCroy('C1ballgapcurrent_50hz00000.trc'); newvoltage=IIRfilter(voltage.y,samples); voltageZeros = EtsiNollat(newvoltage); voltageZeroind = find(voltageZeros); voltageIndLow = voltageZeroind-samples;

81
voltageIndHigh = voltageZeroind-floor(samples/1000);
figure(2)
hold on; grid on; plot(voltage.x,newvoltage,'m') %plot(voltage.x,current.y) where voltage.x represents time
sample points %hold on; grid on; plot(current.x,newcurrent,'g')
hold on; hold all; grid on;
for k=60
plot(voltage.x(voltageIndLow(k):voltageIndHigh(k)),newvolta
ge(voltageIndLow(k):voltageIndHigh(k)),'y*')
plot(current.x(currentIndLow(k):currentIndHigh(k)),newcurre
nt(currentIndLow(k):currentIndHigh(k)),'k*')
end legend('newvoltage','newcurrent') title('Arc Voltage and Arc current after filter') xlabel('Time[sec]')
hold off;
%The following will show how many times we have current
zero koko = length(currentZeroind); koko2 = currentIndHigh(1)-currentIndLow(1); conductivity = zeros(koko,koko2+1); figure(3); hold all; grid on;
%The following loop will give input power for a number of
cyles, 2000 %samples before current zero
for k=1:koko power(k,:)=
(newcurrent(currentIndLow(k):currentIndHigh(k)).*newvoltage
(voltageIndLow(k):voltageIndHigh(k))); plot(power(k,:));

82
title('VI, Power Input[W]') xlabel('2000 samples points before current zero') ylabel('Power Input[W]') end figure(4); hold all; grid on;
%Taking average of input power for a number of cycle at
specfic time e= mean(power(1:koko,1:1999)); t=[-200e-6:0.1e-6:-0.0002e-003]; plot(t,e) title('Average input power Before Current Zero(W)') xlabel('Time [sec] before current zero') ylabel('Average Input Power[W]') figure(5); hold all; grid on;
%The following loop will give conductivity for a number of
cyles, 2000 %samples before current zero for k=1:koko conductivity(k,:) =
(newcurrent(currentIndLow(k):currentIndHigh(k))./newvoltage
(voltageIndLow(k):voltageIndHigh(k))); plot ((conductivity(k,:))); title('Conductivity decay before current zero') xlabel('2000 samples points before current zero') ylabel('Conductivity [S]') end figure(6); %Taking average conductivity for a number of cycle at
specfic time g= mean(conductivity(1:koko,1:1999));grid on; plot(g); title('Average Conductivity Before Current Zero'); xlabel('2000 samples points before current zero') ylabel('Conductivity [S]') figure(7);grid on; %Average condcutivity with time stamp plot(t,g) title('Average Conductivity Before Current Zero') xlabel('Time [sec] before current zero') ylabel('Average Conductivity [S]')
%The following loop will give the slope between two data
points of %conductvity for i=1:1998 slope(:,i)=(g(i+1)-g(i))/(t(i+1)-t(i)); end figure(8);grid on; %Plotting slope with time plot(t(1:1998),slope(1:1998));

83
title('dg/dt') xlabel('Time [sec] before current zero') ylabel('dg/dt')
figure(9); grid on; %dg/dt/g=slope_conductivity slope_conductivity=(slope./g(1:1998)); plot(t(1:1998),slope_conductivity) title('dg/dt/g') xlabel('Time [sec] before current zero') ylabel('1/g *dg/dt')
r=e(1:1998); r1=fliplr(r); slope_conductivity1=fliplr(slope_conductivity); m=diff(slope_conductivity1)./diff(r1);
for i=1:(length(r1)-1) y_intercept(i)=(slope_conductivity1(i)-m(i)*r1(i)); time_constant(i)=1/(y_intercept(i)); x_intercept(i)=((m(i)*r1(i))-slope_conductivity1(i))/m(i); end figure(10); grid on; plot(r,slope_conductivity) hold on; syms x ezplot(m(17)*(x)+y_intercept(17)) hold off; title('dg/dt/g vs Input Power') xlabel('Input power vi(W)'); ylabel('(dg/dt)/g[per sec])'); l=[-0.0004e-003:-0.1e-6:-200e-6]; figure(11); grid on; plot(l, -(time_constant)) xlabel('time[sec]') ylabel('time constant [sec]') k=fliplr(x_intercept); %slope=dg/dt j=fliplr(time_constant); %tr is new conductivity(g) after filling arc parametrs in
basic Mayr %equation for i=1:1997 tr(i,:)= ((slope(i)).*(-j(i)))/((e(i)./k(i))-1); end figure(12); grid on; %Plotting, to check is, after filling the mesured arc
parametrs in Mayr %equation, do we get the same counductivity curve plot(t(1:1997),tr)

84
title('New Conductivity after filling arc parameters') xlabel('time before current zero') ylabel('g[S]') figure(13); grid on; plot(t(900:1997),k(900:1997)) xlabel('time[sec]') ylabel('Power losses (W)') title('time vs Power losses')
1.2 Filter used to remove the high frequency ripple in measured
waveforms
function odata = IIRfilter(idata,r)
rip = .05; % passband ripple in dB nfilt = 8; [b,a] = cheby1(nfilt, rip, 1/r); while all(b==0) || (abs(filtmag_db(b,a,1/r)+rip)>1e-6) nfilt = nfilt - 1; if nfilt == 0 break end [b,a] = cheby1(nfilt, rip, 1/r); end
if nfilt == 0 error(message('signal:decimate:InvalidRange')) end
1.3 Filter used to find zero crossing of sine waveform
%This function finds the zero crossing of the sine waveform function out = EtsiNollat(in)
flen = length(in); maxin = max(abs(in)); out = (abs(in)/maxin)<1/750; startind = 0; for ind = 1:flen if out(ind) if startind == 0 startind = ind; %starty = in(ind);
end out(ind) = 0; else if startind indl = ind + 10;

85
if indl > flen indl = flen; end if sum(out(ind:indl)) == 0 endind = ind; valiaika = endind-startind; middle = floor(valiaika/2); out(startind+middle) = 1; % disp(['välinkeskeltä ',
num2str(startind+middle)]); % disp(['väliaika ', num2str(valiaika)]); startind = 0; end end end end end
1.4 Measured value of arc parameters at different frequencies
clear all; close all; clc
% Power losses and Arc time constant at different value of
frequency, % 15 us,before current zero Frequency= [50 100 150 300 500 800 1200 1500 1800 2200 2800
3500 4000 4300 4700 5000 ];
PowerLosses= [0.1190000 -1.1470000 -0.8915000 -2.0400000 -
2.3840000 -4.5490000 -9.1950000 -11.3100000 -9.1400000 -
17.7700000 39.8400000 -127.1000000 89.1400000 -122.0000000
-78.0200000 16.9900000 ];
TimeConstant= [0.0005730 0.0005440 0.0005277 0.0004438
0.0005305 0.0002264 0.0002970 0.0003453 0.0003471 0.0003476
0.0001103 0.0001212 0.0002038 0.0001910 0.0001489 0.0012410
]; InputPower=[ 0.0080930 0.0230600 0.0437900 0.1116000
0.1989000 0.6387000 2.2930000 1.9090000 1.7600000 2.2140000
4.3340000 8.1860000 6.4540000 17.2400000 11.6000000
7.1070000 ];
figure (1) %Time Constant
hand2=plot(Frequency,TimeConstant,'r-*');grid on;
set(hand2, 'LineWidth', 2); legend('Time Constant')

86
xlabel('Frequency [Hz]') ylabel('Time constant [sec]')
figure (2) %Power Losses hand1=plot(Frequency,PowerLosses,'k-*') set(hand1, 'LineWidth', 2);
hold on;
%Input Power
grid on; hand3=plot(Frequency,InputPower,'m-*'); set(hand3, 'LineWidth', 2);
hold off;
%axis([0 1400 0 14]) xlabel('Frequency[Hz]') ylabel('Power [W]') %set(gca,'XTick',0:100:1400) legend('PowerLosses', 'InputPower')
2 Measured values from the experiment in order to find
the effect of temperature on breakdown voltage
Test 1: Stainless steel
A.) Measurement at ambient temperature 21,9 oC
B.) Measurement at 150 oC
Breakdown voltage (kV) at ambient temperature 21,9 oC
1 2 3 4 5 6 7 8 9 10 Average
12,9800 12,9700 12,7300 12,9700 12,4900 12,7100 12,9800 12,8200 12,7800 12,5300 12,7960

87
C.) Measurement at 250 oC
D.) Measurement at 400 oC
E.) Measurement at 550 oC
F.) Measurement at 700 oC
G.) Measurement at 850 oC
H.) Measurement at 1000 oC
I.) Measurement at 1150 oC
J.) Measurement at 1300 oC
Breakdown voltage (kV) at ambient temperature 150 oC
1 2 3 4 5 6 7 8 9 10 Average
11,0900 11,0100 10,9600 10,7500 11,2300 10,8600 11,2900 10,9800 11,2500 10,9000 11,0320
Breakdown voltage (kV) at ambient temperature 250 oC
1 2 3 4 5 6 7 8 9 10 Average
10,4250 10,2260 10,1600 9,8514 10,0150 10,0480 10,0660 9,8248 9,3062 9,8102 9,9733
Breakdown voltage (kV) at ambient temperature 400 oC
1 2 3 4 5 6 7 8 9 10 Average
8,4255 8,3216 8,2031 7,9244 7,5808 8,2210 7,9809 8,3356 8,5300 8,1820 8,1705
Breakdown voltage (kV) at ambient temperature 550 oC
1 2 3 4 5 6 7 8 9 10 Average
6,4221 6,4458 6,3404 6,1976 6,3264 6,3341 6,1817 6,1653 6,0262 6,0628 6,2502
Breakdown voltage (kV) at ambient temperature 700 oC
1 2 3 4 5 6 7 8 9 10 Average
4,4594 4,4383 4,3825 4,2313 4,2637 4,2527 4,2597 4,1950 4,0688 4,1150 4,2666
Breakdown voltage (kV) at ambient temperature 850 oC
1 2 3 4 5 6 7 8 9 10 Average
4,0566 2,8919 3,0098 3,0445 2,9215 2,8248 2,8200 2,9138 2,8376 2,8376 3,0158
Breakdown voltage (kV) at ambient temperature 1000 oC
1 2 3 4 5 6 7 8 9 10 Average
3,7200 3,3400 3,4700 3,3400 3,4800 3,5400 3,6500 3,6500 3,7500 3,3400 3,5280
Breakdown voltage (kV) at ambient temperature 1150 oC
1 2 3 4 5 6 7 8 9 10 Average
3,7174 3,3444 3,4669 3,3422 3,4773 3,5398 3,6520 3,6468 3,7528 3,3395 3,5279
Breakdown voltage (kV) at ambient temperature 1300 oC
1 2 3 4 5 6 7 8 9 10 Average
2,1066 2,0449 2,0320 2,0700 2,0316 1,9906 2,0356 2,0310 2,0653 1,9821 2,0390

88
Test 2: Aluminum
A.) Measurement at 23,4 oC
B.) Measurement at 80 oC
C.) Measurement at 140 oC
D.) Measurement at 190 oC
E.) Measurement at 230 oC
F.) Measurement at 270 oC
G.) Measurement at 300 oC
H.) Measurement at 355 oC
I.) Measurement at 400 oC
Breakdown voltage (kV) at ambient temperature 23,4 oC
1 2 3 4 5 6 7 8 9 10 Average
11,7470 12,6460 12,2060 12,2060 12,3830 12,3620 12,3770 12,4810 12,4750 12,5060 12,3389
Breakdown voltage (kV) at ambient temperature 80 oC
1 2 3 4 5 6 7 8 9 10 Average
11,4890 11,5280 11,4970 11,5240 11,4920 11,4710 11,4650 11,4400 11,3880 11,3410 11,4635
Breakdown voltage (kV) at ambient temperature 140 oC
1 2 3 4 5 6 7 8 9 10 Average
10,5590 10,5455 10,5310 10,5040 10,6180 10,5370 10,5680 10,5620 10,5360 10,5540 10,5515
Breakdown voltage (kV) at ambient temperature 190 oC
1 2 3 4 5 6 7 8 9 10 Average
9,8898 10,0330 9,9458 9,9974 9,9495 9,9733 10,0100 9,8745 9,8604 9,8555 9,9389
Breakdown voltage (kV) at ambient temperature 230 oC
1 2 3 4 5 6 7 8 9 10 Average
9,2064 9,0341 8,8556 8,9092 8,9200 8,8849 8,9056 8,8808 8,9067 8,9055 8,9409
Breakdown voltage (kV) at ambient temperature 270 oC
1 2 3 4 5 6 7 8 9 10 Average
8,6426 8,5904 8,4988 8,5756 8,5529 8,5157 8,5566 8,4593 8,5115 8,5367 8,5440
Breakdown voltage (kV) at ambient temperature 300 oC
1 2 3 4 5 6 7 8 9 10 Average
8,4717 8,4852 8,4359 8,5225 8,3752 8,3974 8,4542 8,4289 8,4335 8,4251 8,4430
Breakdown voltage (kV) at ambient temperature 355 oC
1 2 3 4 5 6 7 8 9 10 Average
8,4159 8,2090 8,2743 8,0475 8,8146 8,0478 8,1386 8,1314 8,1575 8,1061 8,2343

89
Test 3: Copper
A.) Measurement at 22,5 oC
B.) Measurement at 90 oC
C.) Measurement at 165 oC
D.) Measurement at 230 oC
E.) Measurement at 300 oC
F.) Measurement at 370 oC
Breakdown voltage (kV) at ambient temperature 400 oC
1 2 3 4 5 6 7 8 9 10 Average
8,2188 8,0491 8,0011 7,9210 8,0162 7,8410 7,9097 7,9677 8,0783 7,8552 7,9858
Breakdown voltage (kV) at ambient temperature 22,5 oC
1 2 3 4 5 6 7 8 9 10 Average
12,2050 12,4990 12,2330 12,5980 12,2080 12,5190 12,3280 12,3830 12,8920 12,5280 12,4393
Breakdown voltage (kV) at ambient temperature 90 oC
1 2 3 4 5 6 7 8 9 10 Average
12,2010 12,0880 11,7920 11,6900 11,7260 11,5650 11,6210 11,7610 11,5840 11,4950 11,7523
Breakdown voltage (kV) at ambient temperature 165 oC
1 2 3 4 5 6 7 8 9 10 Average
11,1920 10,2230 10,1880 10,2170 10,1630 10,0300 10,1300 10,1640 10,0870 10,1450 10,2539
Breakdown voltage (kV) at ambient temperature 230 oC
1 2 3 4 5 6 7 8 9 10 Average
9,6656 9,6851 9,7416 9,5526 9,5241 9,4710 9,4721 9,5239 9,4476 9,4365 9,5520
Breakdown voltage (kV) at ambient temperature 300 oC
1 2 3 4 5 6 7 8 9 10 Average
8,9538 9,0229 8,9324 8,6962 8,5661 8,5928 8,5487 8,4834 8,3450 8,4333 8,6575
Breakdown voltage (kV) at ambient temperature 370 oC
1 2 3 4 5 6 7 8 9 10 Average
8,1158 7,8989 7,8323 7,9466 7,8195 7,8639 7,9722 8,1076 7,8169 7,8388 7,9213
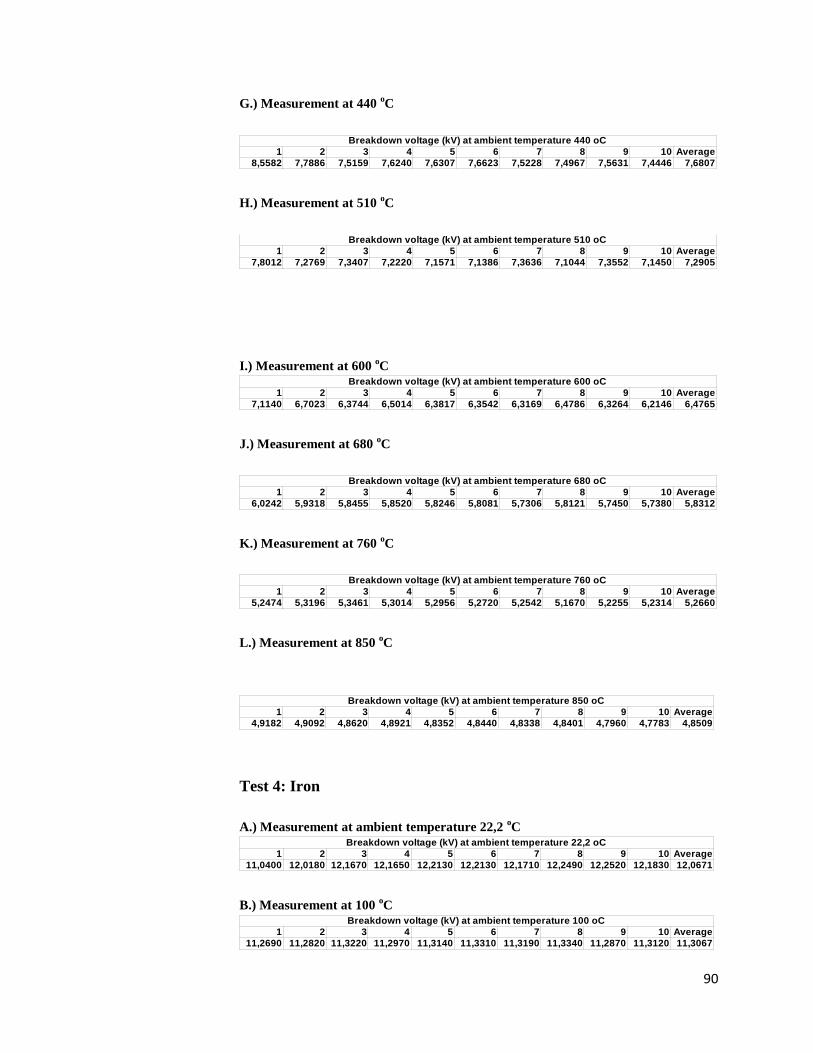
90
G.) Measurement at 440 oC
H.) Measurement at 510 oC
I.) Measurement at 600 oC
J.) Measurement at 680 oC
K.) Measurement at 760 oC
L.) Measurement at 850 oC
Test 4: Iron
A.) Measurement at ambient temperature 22,2 oC
B.) Measurement at 100 oC
Breakdown voltage (kV) at ambient temperature 440 oC
1 2 3 4 5 6 7 8 9 10 Average
8,5582 7,7886 7,5159 7,6240 7,6307 7,6623 7,5228 7,4967 7,5631 7,4446 7,6807
Breakdown voltage (kV) at ambient temperature 510 oC
1 2 3 4 5 6 7 8 9 10 Average
7,8012 7,2769 7,3407 7,2220 7,1571 7,1386 7,3636 7,1044 7,3552 7,1450 7,2905
Breakdown voltage (kV) at ambient temperature 600 oC
1 2 3 4 5 6 7 8 9 10 Average
7,1140 6,7023 6,3744 6,5014 6,3817 6,3542 6,3169 6,4786 6,3264 6,2146 6,4765
Breakdown voltage (kV) at ambient temperature 680 oC
1 2 3 4 5 6 7 8 9 10 Average
6,0242 5,9318 5,8455 5,8520 5,8246 5,8081 5,7306 5,8121 5,7450 5,7380 5,8312
Breakdown voltage (kV) at ambient temperature 760 oC
1 2 3 4 5 6 7 8 9 10 Average
5,2474 5,3196 5,3461 5,3014 5,2956 5,2720 5,2542 5,1670 5,2255 5,2314 5,2660
Breakdown voltage (kV) at ambient temperature 850 oC
1 2 3 4 5 6 7 8 9 10 Average
4,9182 4,9092 4,8620 4,8921 4,8352 4,8440 4,8338 4,8401 4,7960 4,7783 4,8509
Breakdown voltage (kV) at ambient temperature 22,2 oC
1 2 3 4 5 6 7 8 9 10 Average
11,0400 12,0180 12,1670 12,1650 12,2130 12,2130 12,1710 12,2490 12,2520 12,1830 12,0671
Breakdown voltage (kV) at ambient temperature 100 oC
1 2 3 4 5 6 7 8 9 10 Average
11,2690 11,2820 11,3220 11,2970 11,3140 11,3310 11,3190 11,3340 11,2870 11,3120 11,3067

91
C.) Measurement at 225 oC
D.) Measurement at 350 oC
E.) Measurement at 475
oC
F.) Measurement at 600 oC
G.) Measurement at 725 oC
H.) Measurement at 850 oC
I.) Measurement at 975 oC
I.) Measurement at 1100 oC
I.) Measurement at 1225 oC
Breakdown voltage (kV) at ambient temperature 225 oC
1 2 3 4 5 6 7 8 9 10 Average
9,4895 9,3832 9,4681 9,4462 9,4046 9,3820 9,4042 9,3368 9,2975 9,3067 9,3919
Breakdown voltage (kV) at ambient temperature 350 oC
1 2 3 4 5 6 7 8 9 10 Average
7,0082 8,0728 7,9900 7,9542 7,9862 7,9992 8,0040 7,9138 7,9397 7,8455 7,8714
Breakdown voltage (kV) at ambient temperature 475 oC
1 2 3 4 5 6 7 8 9 10 Average
6,9591 6,8533 6,8986 6,8088 6,7518 6,6872 6,7428 6,7418 6,6339 6,6946 6,7772
Breakdown voltage (kV) at ambient temperature 600 oC
1 2 3 4 5 6 7 8 9 10 Average
5,9044 5,7837 5,8037 5,8002 5,7392 5,7007 5,6470 5,6461 5,6698 5,6356 5,7330
Breakdown voltage (kV) at ambient temperature 725 oC
1 2 3 4 5 6 7 8 9 10 Average
4,6309 4,4579 4,6213 4,6586 4,6520 4,5850 4,5753 4,5390 4,5106 4,5300 4,5761
Breakdown voltage (kV) at ambient temperature 850 oC
1 2 3 4 5 6 7 8 9 10 Average
4,2059 4,2346 4,2214 4,2291 4,2232 4,2037 4,1627 4,1314 4,1084 4,1595 4,1880
Breakdown voltage (kV) at ambient temperature 975 oC
1 2 3 4 5 6 7 8 9 10 Average
3,6637 3,5377 3,5285 3,5217 3,5174 3,5566 3,5275 3,4702 3,5211 3,5524 3,5397
Breakdown voltage (kV) at ambient temperature 1100 oC
1 2 3 4 5 6 7 8 9 10 Average
3,5067 3,5686 3,5708 3,4994 3,5028 3,5475 3,5491 3,5201 3,5783 3,5045 3,5348
Breakdown voltage (kV) at ambient temperature 1225 oC
1 2 3 4 5 6 7 8 9 10 Average
3,5439 3,5853 3,5217 3,5146 3,5475 3,4630 3,5519 3,5336 3,4065 3,4910 3,5159

92
I.) Measurement at 1290 oC
I.) Measurement at 1350
oC
Test 5: Brass
A.) Measurement at ambient temperature 22,9 oC
B.) Measurement at 90 oC
C.) Measurement at 165 oC
D.) Measurement at 240 oC
E.) Measurement at 315 oC
F.) Measurement at 390 oC
Breakdown voltage (kV) at ambient temperature 1290 oC
1 2 3 4 5 6 7 8 9 10 Average
2,5469 2,5860 2,5214 2,5225 2,5499 2,5844 2,5202 2,6348 2,5988 2,6669 2,5732
Breakdown voltage (kV) at ambient temperature 1350 oC
1 2 3 4 5 6 7 8 9 10 Average
2,2564 2,2063 2,1720 2,2654 2,2208 2,2293 2,2663 2,1410 2,1572 2,1928 2,2108
Breakdown voltage (kV) at ambient temperature 22,9 oC
1 2 3 4 5 6 7 8 9 10 Average
12,2660 13,1380 12,9210 12,7510 13,0350 12,7020 12,4390 12,6050 13,0210 12,5760 12,7454
Breakdown voltage (kV) at ambient temperature 90 oC
1 2 3 4 5 6 7 8 9 10 Average
12,8020 12,1200 11,8290 12,0590 12,0860 11,6730 11,9870 11,9220 12,3760 12,4344 12,1288
Breakdown voltage (kV) at ambient temperature 165 oC
1 2 3 4 5 6 7 8 9 10 Average
10,1400 9,8230 10,2900 10,2810 10,3550 9,9585 9,8318 10,2340 10,0860 9,8662 10,0866
Breakdown voltage (kV) at ambient temperature 240 oC
1 2 3 4 5 6 7 8 9 10 Average
8,6423 8,8826 8,7292 8,9104 8,9562 8,9860 9,0248 8,8054 8,8848 8,7506 8,8572
Breakdown voltage (kV) at ambient temperature 315 oC
1 2 3 4 5 6 7 8 9 10 Average
8,0414 7,9270 8,3375 8,1903 7,8550 7,9702 7,9654 8,0846 7,9946 7,9756 8,0342
Breakdown voltage (kV) at ambient temperature 390 oC
1 2 3 4 5 6 7 8 9 10 Average
7,3601 7,2304 7,3221 7,2943 7,2433 7,2714 7,2412 7,2323 7,2406 7,2195 7,2655

93
G.) Measurement at 465 oC
H.) Measurement at 540 oC
I.) Measurement at 615 oC
I.) Measurement at 690 oC
I.) Measurement at 765 oC
Breakdown voltage (kV) at ambient temperature 465 oC
1 2 3 4 5 6 7 8 9 10 Average
7,0131 7,0003 6,9506 6,9267 6,8440 6,8637 6,9429 6,8353 6,9371 6,8010 6,9115
Breakdown voltage (kV) at ambient temperature 540 oC
1 2 3 4 5 6 7 8 9 10 Average
6,5387 6,4351 6,5134 6,4142 6,4138 6,4609 6,4970 6,4031 6,2987 6,4336 6,4409
Breakdown voltage (kV) at ambient temperature 615 oC
1 2 3 4 5 6 7 8 9 10 Average
5,7983 5,7880 5,7069 5,7812 5,7590 5,7375 5,6905 5,6862 5,6287 5,6711 5,7247
Breakdown voltage (kV) at ambient temperature 690 oC
1 2 3 4 5 6 7 8 9 10 Average
5,1462 5,1656 5,1540 5,1499 5,1029 5,0671 5,1187 5,0664 5,0172 5,0074 5,0995
Breakdown voltage (kV) at ambient temperature 765 oC
1 2 3 4 5 6 7 8 9 10 Average
4,4459 4,6275 4,5943 4,6093 4,6466 4,6351 4,6977 4,6620 4,7248 4,6922 4,6335