examination of the mitochondrial health of the basigin
TRANSCRIPT

UNF Digital Commons
UNF Graduate Theses and Dissertations Student Scholarship
2011
Examination of the Mitochondrial Health of theBasigin Null Mouse RetinaKristine Anne V. PabloUniversity of North Florida
This Master's Thesis is brought to you for free and open access by theStudent Scholarship at UNF Digital Commons. It has been accepted forinclusion in UNF Graduate Theses and Dissertations by an authorizedadministrator of UNF Digital Commons. For more information, pleasecontact Digital Projects.© 2011 All Rights Reserved
Suggested CitationPablo, Kristine Anne V., "Examination of the Mitochondrial Health of the Basigin Null Mouse Retina" (2011). UNF Graduate Thesesand Dissertations. 387.https://digitalcommons.unf.edu/etd/387

i
Examination of the mitochondrial health of the Basigin null mouse retina
By
Kristine Anne V. Pablo
A thesis submitted to the Department of Biology in partial fulfillment of the requirements for the degree of Master of Science in Biology
UNIVERSITY OF NORTH FLORIDA COLLEGE OF ARTS AND SCIENCES
August 2011

Signature Deleted
Signature Deleted
Signature Deleted
Signature Deleted
Signature Deleted
Signature Deleted
iii
Acknowledgements
I am thankful to my advisor, Dr Judith Ochrietor, whose patience, guidance and support
helped me not only to develop and finish my thesis, but also in my academic and personal
growth.
I am also thankful to my committee members Dr. Cliff Ross and Dr. Michael Lentz, for
their valuable advice that helped me shape my thesis.
Lastly, I offer my regards to the UNF Department of Biology and the UNF Graduate
program for funding the materials essential to the completion of my thesis.

iv
Table of Contents
Figure List v
Abstract 1 Chapter 1: Introduction 2 The neural retina 2 Mitochondria 6 Monocarboxylate Transporters 13 Basigin 15 Chapter 2: Materials and methods 21 Generation of Mouse retina cell extracts 21 Protein Assay of mouse retina cell extracts 22 Cytochrome c Assay 22 Autophagy Assay 26 Mitotracker Assay 27 Chapter 3: Results 28 Cytochrome c Assay 29 Autophagy Assay 29 Mitotracker Assay 31 Chapter 4: Discussion 36 References 41 Vita 50

v
Figure List
Figure number Description Page
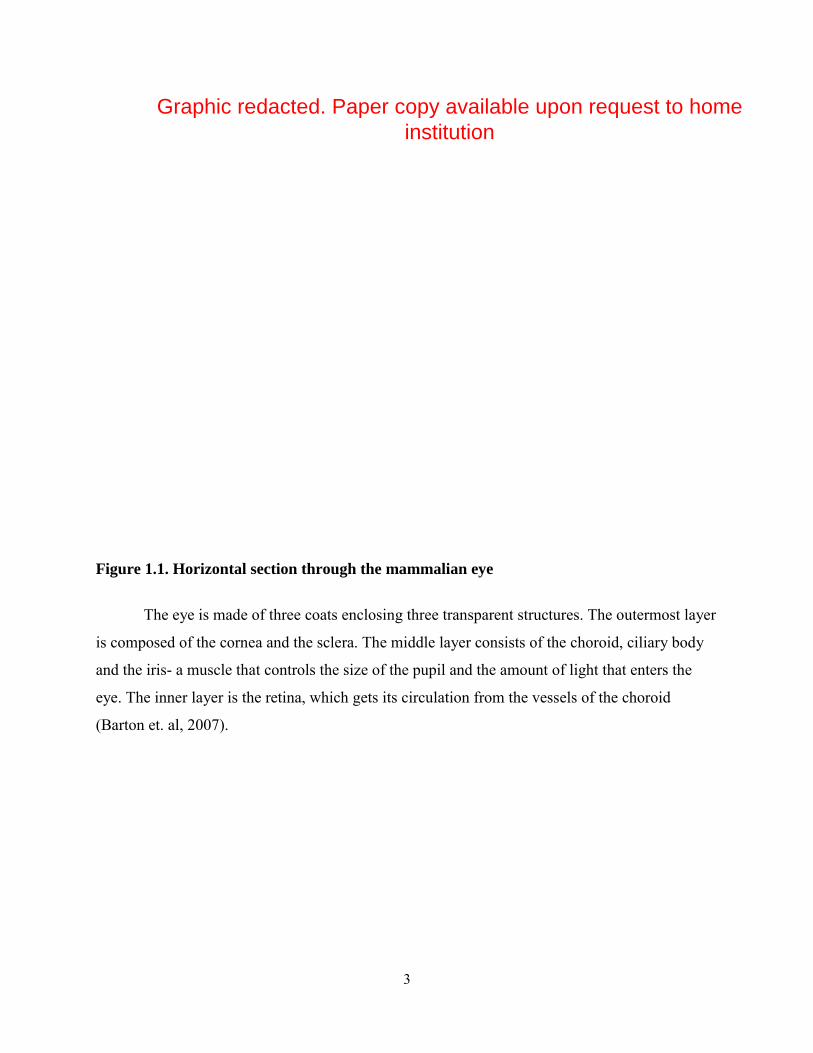
1.1 Horizontal section through the mammalian eye
The eye is made of three coats enclosing three transparent structures. The outermost layer is composed of the cornea and the sclera. The middle layer consists of the choroid, ciliary body and the iris- a muscle that controls the size of the pupil and the amount of light that enters the eye. The inner layer is the retina, which gets its circulation from the vessels of the choroid (Barton et. al, 2007).
3
1.2 Section of the mammalian retina as drawn by Ramon Y Cajal
in 1893
The ganglion cell layer (GCL) houses the cell bodies of the ganglion cells. Bipolar cell and ganglion cell layer synapses are located in the Inner plexiform layer (IPL), whereas the cell bodies of the bipolar cells and horizontal cells are found within the inner nuclear layer (INL). The synapses between photoreceptors (rods and cones) and second order neurons (bipolar cells and horizontal cells) are found within the outer plexiform layer, while the nuclei of the photoreceptors are found within the outer nuclear layer (ONL). The bacillary layer contains the inner (IS) and outer segments (OS) of the photoreceptors. The Müller cell (A) closely associates with photoreceptors and extends from the outer limiting membrane to the nerve fiber layer. Müller cell bodies are located in the INL (Andrews, 1999).
4
1.3 Rod and Cone Photoreceptors
Vision begins in the retina when rod and cone photoreceptor cells detect visual images and transduce them into neural signals (Ribelayga, 2008). Rods and cones primarily function under different lighting conditions: rods mediate dim light (scotopic) vision at night and cones mediate bright light (photopic) and color vision during the day (Ribelayga, 2008). The mitochondria are found in the inner segment (Stone, 2008).
7
1.4 Characteristics of an apoptotic and necrotic cells
(1), The disruption of plasma membrane and organelles is observed in necrotic cells. (2), An apoptotic (A) and a normal (N) cell are shown, note the characteristic chromatin rearrangement in A. (3) A necrotic cell is shown. Numerous lesions appear on the cell surface. (4), Surface blebbing is evident on the apoptotic cell. (5) The regular distribution of nuclear pores is visible. (6) The nuclear envelope shows a characteristic apoptotic clustering (asterisk) of nuclear pores. (Robinson, 2006)
9

vi
1.5 Autophagic pathway
Several proteins are involved in the autophagic process. The molecule named APG (autophagy) 1 stimulates autophagy, leading to autophagy-dependent restriction of cell growth and ultimately high levels of apoptotic activity. It is also a negative regulator of mTOR (mammalian target of rapamycin) signaling (Scott, 1997). The molecule named mTOR is a protein that regulates vital cell growth processes (Chen, 2009) BECN (Beclin 1) plays a role in two fundamentally important cellular pathways: autophagy and apoptosis. It is thought to function as an autophagy protein as part of a complex with a Class III PI3 kinase, Vps34, which regulates endolytic processes that occur during late stage autophagy (Scott,1997). The molecules APG16L and APG5L are expressed during autophagosome formation and the GTPase RAB 24 is expressed during the formation and regulation of autophagic vacuoles (Scott, 1997). The APG5 and APG16L complex is essential for the elongation of autophagic isolation membranes. This complex initially associates in uniform distribution with small vesicle membranes (Scott, 1997).
12
1.6 Schematic of MCT 1 within the plasma membrane
MCT 1 is made of twelve transmembrane helices with a long loop between transmembranes 6 and 7, and both the carboxy- (C-) and amino- (N-) termini facing the cytosol (Halestrap, 2000). Cuff et al., (2005) determined the site of transcription initiation for the MCT 1 gene (3410 bp) and demonstrated that its gene structure to comprise of five exons interrupted by four introns.
14
1.7 Basigin gene products
Basigin and Basigin-2 are members of the immunoglobulin superfamily (IGSF) and have Ig-like structures. Basigin is a 50 kDa integral plasma membrane glycoprotein belonging to the immunoglobulin (Ig) superfamily and possess two Ig domains, a hydrophobic transmembrane domain and a short cytoplasmic tail. Basigin-2 has a similar structure to Basigin with an additional Ig domain (open circles) in the extracellular portion composed of 116 amino acids, making the protein 55 kDa (Ochrietor, 2003).
17
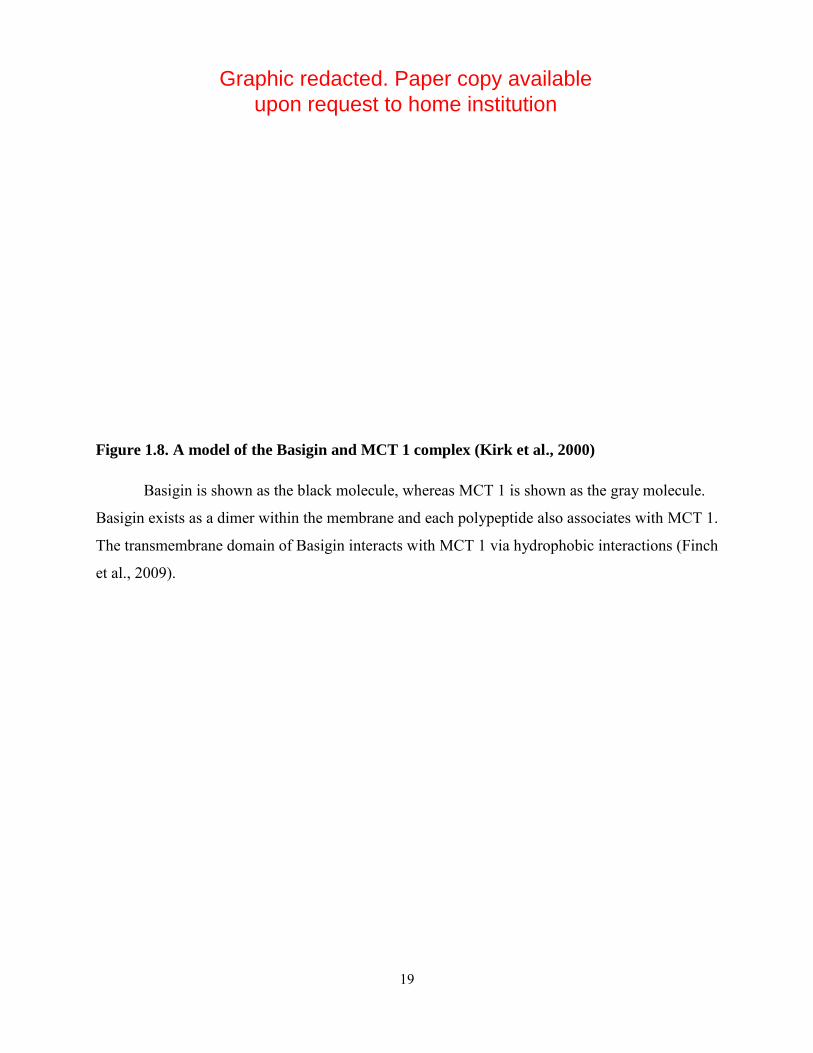
1.8 A model of the Basigin and MCT 1 complex (Kirk et al., 2000)
Basigin is shown as the black molecule, whereas MCT 1 is shown as the gray molecule. Basigin exists as a dimer within the membrane and each polypeptide also associates with MCT 1. The transmembrane domain of Basigin interacts with MCT 1 via hydrophobic interactions (Finch et al., 2009).
19
Table 2.1 BSA Standard Preparation 23

vii
Table 2.2. Dilution of Cytochrome c Standard 24
3.1 Cytochrome c assay
Cytochrome c concentrations (ng/mL) in Basigin normal and null mice retinas were determined using a Cytochrome c assay (Invitrogen Corporation). Samples of normal and Basigin null mouse retina lysates were compared to a standard curve of known Cytochrome c concentrations to determine the concentration of Cytochrome c within each sample. Runs were performed in duplicate. The average concentration at each age is plotted and the error bars indicate the standard deviation. Normal animals are indicated by the blue bars, whereas the Basigin null animals are indicated by the gray bars. * p < 0.05 via Student t-Test (comparison of normal to null at each age)
30
3.2 Relative expression of autophagy proteins in normal and
Basigin null mouse retinas Samples of normal and Basigin null mouse retina protein
lysates were compared for the relative expression of autophagy proteins via and ELISA analysis. Runs were performed in duplicate and the average absorbance at 405 nm is plotted. Error bars indicate the standard deviation for each sample. Normal mice are indicated by the blue bars, whereas Basigin null mice are indicated by the gray bars.
32
3.3 Mitotracker analyses of mitochondria from normal and
Basigin null mouse retinas
The percentage of active mitochondria (A) were measured using Mitotracker Red FM dye (Invitrogen Corporation) and the percentage of total mitochondria (B) were measured using Mitotracker Green FM dye (Invitrogen Corporation). Runs were performed in triplicates. The value obtained for normal mouse retinas was set to 100% and those for Basigin null mouse retinas were compared. The error bars represent the standard deviations. Normal mice are indicated by the blue bars, whereas Basigin null mice are indicated by the gray bars.
33
3.4 Mitotracker assay of mouse retina
Mitotracker Green was used to determine the concentration of the total number of mitochondria (blue) while Mitotracker red was used to determine the concentration of active mitochondria (gray). Runs were performed in triplicate. Absorbance was adjusted to reflect percentages of concentrations relative to P21 (retinal visual maturity). The error bars represent the standard deviations.
35
4.1 Metabolic uncoupling in the Basigin null mouse retina
Lactate is not delivered from Muller cells to photoreceptors, which results in decreased oxidative phosphorylation and subsequent decreases in mitochondria. The lack of energy in photoreceptors accounts for depressed ERGs in
40

viii
Basigin null mice, and hence their blindness from the time of eye opening. Neurons that do not work well die, therefore, degeneration of the photoreceptors is eventually observed. Lactate buildup in Muller cells leads to acidification of those cells and likely decreased glycolytic activity.

1
Abstract
Basigin gene products are cell adhesion molecules that are expressed by photoreceptor
cells, Müller cells and endothelial cells of the mammalian retina. Previous studies have
suggested that a lactate shuttle exists between the photoreceptor cells and the Müller cells, with
Basigin being an essential component in this shuttle. Deletion of the Basigin gene in mice results
in blindness with an eventual retinal degeneration. It was hypothesized that the lactate shuttle
between photoreceptors and Müller cells does not form in Basigin null mice and that the
blindness is attributed to faulty photoreceptor metabolism. Therefore, the purpose of this study
was to determine whether the mitochondria of the Basigin null mice are metabolically active in
the absence of the lactate shuttle. Mitochondrial health in the Basigin null mouse retina was
assessed by a variety of assays, including ELISA analyses to measure Cytochrome c
concentration and expression of autophagy-specific proteins. Mitotracker dyes were used to
stain the mitochondria of Basigin null and normal retinas to determine the number of
metabolically active mitochondria and the total number of mitochondria. The results showed that
apoptosis and autophagy are not occurring in the Basigin null animals at a rate greater than that
of the normal animals. The Mitotracker assay showed that there is a ~60% decrease in the total
number of mitochondria in the null animals compared to their normal counterparts. A
recalculation of the Cytochrome c assay in light of the reduced number of mitochondria in
Basigin null mice revealed that apoptosis is likely occurring in these animals prior to the first
signs of cytoarchitectural changes in the tissue. These results suggest that in the absence of the
lactate shuttle in the Basigin null animals, the photoreceptors are unable to perform oxidative
phosphorylation at the necessary rate, thus decreasing the number of mitochondria, which results
in limited photoreceptor functionality, hence blindness.

2
Chapter 1: Introduction
OVERVIEW OF THE EYE
The eye is a robust optical instrument composed of two positive lenses that produce real
images on the retina, initializing the visual process (Artal, 2008). The mammalian retina lies
loosely embedded in fatty tissue, each in its bony orbit. It is externally covered by a resistant and
flexible tissue called the sclera except in the anterior region – which is covered by the cornea,
allowing light to pass through the eye (Artal, 2008). Light reaching the eye is first transmitted
and refracted by the cornea and passes through an anterior chamber filled with aqueous humor.
Posterior to this chamber is the iris, a muscle that controls the pupil size, which in turn limits the
amount of light passing through the eye. The crystalline lens lies posterior to the iris and allows
images to pass through the posterior chamber filled with vitreous humor and be focused on the
retina (Artal, 2008). A diagram of the mammalian eye is shown in Figure 1.1 .
THE NEURAL RETINA
The retina is a thin neural tissue (~ 0.25 mm) composed of ten layers and lines the back
of the eye (Figure 1.2). It contains light-sensitive photoreceptor cells (rods and cones) and four
classes of neurons – horizontal, bipolar, amacrine and ganglion cells – along with astrocytes and
Müller glial cells (Dowling, 1987). The Müller cell extends from the ganglion cell layer to the
outer limiting membrane (OLM) and is closely associated with the photoreceptors. These
neurons are organized into three nuclear layers separated by two synaptic plexiform layers,
where all retinal synapses are found (Dowling, 1987). The pigmented epithelium is the most
posterior layer of the retina and is responsible for the phagocytosis of the ends of rods and cones
to maintain optimum function. Old discs containing visual pigment molecules in the outer
3
Figure 1.1. Horizontal section through the mammalian eye
The eye is made of three coats enclosing three transparent structures. The outermost layer
is composed of the cornea and the sclera. The middle layer consists of the choroid, ciliary body
and the iris- a muscle that controls the size of the pupil and the amount of light that enters the
eye. The inner layer is the retina, which gets its circulation from the vessels of the choroid
(Barton et. al, 2007).
Graphic redacted. Paper copy available upon request to home institution

4
Figure 1.2. Section of the mammalian retina as drawn by Ramon Y Cajal in 1893
The ganglion cell layer (GCL) houses the cell bodies of the ganglion cells. Bipolar cell
and ganglion cell layer synapses are located in the inner plexiform layer (IPL), whereas the cell
bodies of the bipolar cells and horizontal cells are found within the inner nuclear layer (INL).
The synapses between photoreceptors (rods and cones) and second order neurons (bipolar cells
and horizontal cells) are found within the outer plexiform layer, while the nuclei of the
photoreceptors are found within the outer nuclear layer (ONL). The bacillary layer contains the
inner (IS) and outer segments (OS) of the photoreceptors. The Müller cell (A) closely associates
with photoreceptors and extends from the outer limiting membrane to the nerve fiber layer.
Müller cell bodies are located in the INL (Andrews, 1999).

5
segment (OS) are constantly engulfed by the apical process of the pigmented epithelium and new
discs are added at the base of the OS cilium in a diurnal cycle (Young, 1971). Phagocytosis by
the pigmented epithelium is an integral element in establishing a balanced rate of OS growth,
renewal, and disposal (Spira, 2005). The choroid lies between the pigmented epithelium and the
sclera. It is a brown, pigmented coat that consists of blood vessels and connective tissue that
serves to nourish the eye.
The light travels through all the layers of the retina to the outer segments, where the
photons of light activate retinal, and a cascade of signaling events hyperpolarizes the cells. In
rods, photons captured in the OS trigger the conversion of rhodopsin into an active form (Meta II
rhodopsin; Simos,2001). The Meta II rhodopsin initiates a series of events that lead to the
hydrolysis and deactivation of cyclic guanosine monophosphate (cGMP) by the enzyme
phosphodiesterase (Simos,2001). The low levels of cGMP close the cationic channels, causing
the cell membrane to hyperpolarize. A similar mechanism occurs in cones. Photoreceptors
signal to the second order neurons (bipolar cells, horizontal cells, amacrine cells) and the signal
converges on the ganglion cells, whose axons become the optic nerve. The signal is sent through
the optic nerve bundle, ending in the lateral geniculate nuclei in the brain (Dowling, 1987). The
photoreceptor membrane can return to its depolarized state when the photoexcited form of
rhodopsin returns to its photosensitive state or there is a reduced level of intracellular Ca 2+,
leading to an enzymatic reactivation of cGMP (Simos,2001) .
Vision begins in the retina when rod and cone photoreceptor cells detect light from visual
images and transduce them into neural signals (Ribelayga, 2008). Rods and cones primarily
function under different lighting conditions: rods mediate dim light (scotopic) vision at night
and cones mediate bright light (photopic) and color vision during the day (Ribelayga, 2008). The

6
opsin proteins used dictate the wavelengths of light detected in rods and cones. A mature
mammalian retina contains about 7 million cones and 75 to 150 million rods. In mice, the
photoreceptors are mostly rods, and cones comprise less than 3% of the total photoreceptors
(Sharma, 2003). These photoreceptors also differ in structure, as seen in Figure 1.3.
Measurements from isolated and intact retinas show that the photoreceptors, particularly the
inner segments, have high oxygen consumption (Hoang, 2002) which indicates that aerobic
respiration occurs at a fast rate. This is important because ATP is necessary for neurotransmitter
release from photoreceptor neurons.
MITOCHONDRIA
Active neurons need ATP to support synthesis, release and recycling of neurotransmitter
molecules, movement of materials to and from the cell body by axoplasmic transport,
maintenance of normal resting potential, and the recovery of action potential through the sodium
and potassium pump. The ATP generated in the mitochondria must be expended to maintain
normal cytoplasmic ion concentrations (Martini, 1999). The mitochondria are membrane
enclosed organelles found in most eukaryotic cells, ranging from 0.5-10 µm in diameter (Henze,
2003). This organelle is composed of compartments which carry out specific functions,
including the outer membrane, the inter-membrane space, the inner membrane, and the matrix. In
addition to ATP generation, the mitochondria are involved in cell signaling, cell differentiation,
and cell growth and death.
Mitochondria in adult mammalian photoreceptors are sequestered to the inner segments
and the axon terminals of the OPL (Stone, 2008; Figure 1.3). The photoreceptor layer lacks
intrinsic blood vessels and is supplied oxygen by diffusion from the choroid. Mitochondria

7
Figure 1.3. Rod and Cone Photoreceptors
Vision begins in the retina when rod and cone photoreceptor cells detect visual images
and transduce them into neural signals (Ribelayga, 2008). Rods and cones primarily function
under different lighting conditions: rods mediate dim light (scotopic) vision at night and cones
mediate bright light (photopic) and color vision during the day (Ribelayga, 2008). The
mitochondria are found in the inner segment (Stone, 2008).
Graphic redacted. Paper copy available upon request to home
institution

8
migrate to these areas where oxygen concentration is high (Stone, 2008). Photoreceptors are
metabolically active cells which need large amounts of ATP.
The electron transport chain (ETC) in the inner membrane of mitochondria allows the
ATP synthase to use the flow of electrons to generate ATP (adenosine triphosphate) from ADP
(adenosine diphosphate) and inorganic phosphate (Karp, 2008). The ETC is comprised of several
complexes that participate in oxidation-reduction reactions. Complex I (NADH coenzyme Q
Reductase) accepts electrons from NADH and passes them to coenzyme Q, which also receives
electrons from Complex II (succinate dehydrogenase). Coenzyme Q passes electrons to Complex
III (cytochrome b-c complex) which passes electrons to Cytochrome c. This complex in turn
passes electrons to Complex IV (Cytochrome c oxidase) which uses the electron gradient to
reduce molecular oxygen to water (Karp, 2008). Energy from electron transfer allows
Complexes I, III and IV to pump protons to the intermembrane space. Protons then flow down
the concentration gradient through the ATP synthase to the matrix. Protons passing through the
synthase power the process of ATP synthesis.
APOPTOSIS
In addition to the metabolic function of the mitochondria, this organelle also functions in
the regulation of apoptosis (Hoang, 2002). Apoptosis is a form of programmed cell death
important in the development of tissues and homeostasis of multicellular organisms. During
apoptosis, cells die in a highly coordinated manner, with characteristic structural factors
including membrane blebbing, reduction in cell volume, and chromatin condensation (Bossy-
Wetzel, 2000; Figure 1.4)

9
Figure 1.4. Characteristics of an apoptotic and necrotic cells
(1), The disruption of plasma membrane and organelles is observed in necrotic cells. (2), An apoptotic (A) and a normal (N) cell are shown; note the characteristic chromatin rearrangement in A. (3) A necrotic cell is shown. Numerous lesions appear on the cell surface. (4). Surface blebbing is evident on the apoptotic cell. (5) The regular distribution of nuclear pores is visible. (6) The nuclear envelope shows a characteristic apoptotic clustering (asterisk) of nuclear pores. (Robinson, 2006)
Graphic redacted. Paper copy available upon request to home institution

10
Mitochondrial Cytochrome c, which functions as an electron carrier in the respiratory
chain, translocates into the cytosol in cells undergoing apoptosis. Cytochrome c is a water-
soluble protein with a net positive charge and is normally loosely associated with the
mitochondrial intermembrane space (Bossy-Wetzel, 2000). This protein functions in the
respiratory chain by interacting with redox (reduction-oxidation) partners of complex III and IV.
During apoptosis, Cytochrome c translocates into the cytosol from the mitochondria and binds
with apoptotic protease factor -1 (Apaf-1), ATP, and procaspase 9 to create a complex called an
apoptosome. The apoptosome cleaves procaspase 9 to its active form – caspase 9 – which then
activates the effector caspase 3. Caspase 3 is responsible for chromatin condensation and DNA
fragmentation (Bossy-Wetzel, 2000). Cytochrome c release from the mitochondria is considered
an early event in the apoptotic process (Bossy-Wetzel, 2000).
AUTOPHAGY
Autophagy is a tightly regulated pathway involving the lysosomal degradation of
cytoplasmic organelles or components. Studies have noted the connection between autophagy
and mitochondrial turnover. Mitochondrial quality control is the process whereby mitochondria
undergo successive amounts of fusion and fission with a dynamic exchange of components to
segregate functional components from damaged components (Gottlieb, 2010). During autophagy,
a double membrane vesicle called an autophagosome sequesters organelles for delivery to the
lysosome. The sequestered contents are degraded in the lysosome, allowing cells to eliminate
damaged components through catabolism and maintain nutrient and energy homeostasis
(Kroemer, 2008). When mitochondria are selectively degraded, the process is known as
mitophagy.

11
Several proteins are involved in the autophagic process. The molecule named Autophagy
1 (APG1) stimulates autophagy, leading to autophagy-dependent restriction of cell growth and
ultimately high levels of apoptotic activity. It is also a negative regulator of mTOR (mammalian
target of rapamycin) signaling (Scott, 1997). The molecule named mTOR is a protein that
regulates vital cell growth processes (Chen, 2009). Beclin 1 (BECN) plays a role in two
fundamentally important cellular pathways: autophagy and apoptosis. It is thought to function as
an autophagy protein as part of a complex with a Class III PI3 kinase (Phosphoinositide-3), and
Vps34, which regulates endolytic processes that occur during late stage autophagy (Scott, 1997).
The molecules APG16L and APG5L are expressed during autophagosome formation and the
GTPase RAB 24 is expressed during the formation and regulation of autophagic vacuoles (Scott,
1997). The APG5L and APG16L complex is essential for the elongation of autophagic isolation
membranes. This complex (APG5L and APG16L) initially associates in uniform distribution
with small vesicle membranes (Scott, 1997).
Although autophagy is a natural process that removes damaged organelles, it may also be
stimulated by multiple forms of cellular stress, including nutrient deprivation, insufficient growth
factors, hypoxia, reactive oxygen species, DNA damage, and pathogens (Kroemer, 2008).
Nutrient stress is the most potent inducer of autophagy and is known to start the pathway within
minutes of starvation. In mice, within 24-48 hours of starvation, most cells in most tissues
displayed an increased number of autophagic proteins (Kroemer, 2008). A diagram of the
autophagic process is shown in Figure 1.5.
Autophagy is a major degradative pathway for organelles and long lived proteins and is
essential for the survival of neurons. Previous studies implicated defective autophagy in the
pathogenesis of Alzheimer’s disease, particularly the massive buildup of incompletely digested

12
Figure 1.5. Autophagic pathway
Several proteins are involved in the autophagic process. The molecule named APG (autophagy) 1 stimulates autophagy, leading to autophagy-dependent restriction of cell growth and ultimately high levels of apoptotic activity. It is also a negative regulator of mTOR (mammalian target of rapamycin) signaling (Scott, 1997). The molecule named mTOR is a protein that regulates vital cell growth processes (Chen, 2009) BECN (Beclin 1) plays a role in two fundamentally important cellular pathways: autophagy and apoptosis. It is thought to function as an autophagy protein as part of a complex with a Class III PI3 kinase, Vps34, which regulates endolytic processes that occur during late stage autophagy (Scott,1997). The molecules APG16L and APG5L are expressed during autophagosome formation and the GTPase RAB 24 is expressed during the formation and regulation of autophagic vacuoles (Scott, 1997). The APG5 and APG16L complex is essential for the elongation of autophagic isolation membranes. This complex initially associates in uniform distribution with small vesicle membranes (Scott, 1997).
Graphic redacted. Paper copy available upon request to home institution

13
substrate within the axon and dendrites (Nixon, 2011). Other neurodegenerative diseases,
including Huntington’s disease and Parkinson’s disease, may be caused by the failure of
autophagosomes to recognize their correct cargo, incorrectly sequestering proteins (Martinez-
Vicente et al., 2010).
MONOCARBOXYLATE TRANSPORTERS
The isolated mammalian retina is known for its large production of lactate, both in the
presence and absence of oxygen. This conclusion is bolstered by in vitro studies of isolated
retinas, which release large quantities of lactate into the medium in response to light (Gerhart,
1999). Cellular respiration includes the conversion of glucose to pyruvate via glycolysis and
subsequent Krebs cycle and oxidative phosphorylation to produce energy stored in the form of
ATP (Su, 2009). The production of lactate when glycolysis outpaces the remaining aerobic
process enables the electron acceptor NAD+ to be regenerated (Poitry-Yamate, 1995). Highly
glycolytic cells, like Müller cells of the retina and skeletal muscle fibers can release lactate and a
proton to prevent acidification of the cell interior (Poitry-Yamate, 1995).
Monocarboxylates are charged species that cannot pass the plasma membrane by free
diffusion but require a proton linked monocarboxylate transporter (MCT). These MCT
transporters catalyze facilitated diffusion of lactate with a proton. Fourteen MCT members have
been identified (Wilson et al., 2009), with characteristic shared motifs (Halestrap and Price ,
1999). For instance, MCT2 has ~60 % amino acid sequence identity to MCT 1, while MCTs 5-7
have ~ 30% amino acid sequence identity to MCT 1.

14
Figure 1.6. Schematic of MCT 1 within the plasma membrane
MCT 1 is made of twelve transmembrane helices with a long loop between
transmembranes 6 and 7, and both the carboxy- (C-) and amino- (N-) termini facing the cytosol
(Halestrap and Price, 1999). Cuff and Shirazi-Beechey (2005) determined the site of
transcription initiation for the MCT 1 gene (3410 bp) and demonstrated that its gene structure to
comprise of five exons interrupted by four introns.
Graphic redacted. Paper copy available upon request to home institution

15
The MCT 1 protein consists of twelve transmembrane helices with a long loop between
transmembranes 6 and 7, and both the carboxy- (C-) and amino- (N-) termini facing the cytosol
(Halestrap and Price, 1999; Figure 1.6). Transport is proton-linked by a symport mechanism that
affects cellular concentration of both monocarboxylates and hydrogen ions (Gerhart, 1999). In
addition
to MCT 1, MCT isoforms 2-4 also catalyze the transport of monocarboxylates such as L-lactate
across the plasma membrane. MCT 8 is a high affinity thyroid hormone transporter, whereas
MCT 10 (TAT1) is an aromatic amino acid transporter. The other members of the MCT family
remain to be characterized (Wilson et al., 2009)
The MCT 1 protein is detected in four retinal cell types including pigmented epithelial
cells, photoreceptor cells, Müller cells, and blood vessel endothelial cells (Gerhart, 1999; Philp et
al., 2003). The occurrence of MCT 1 in the Müller cell plasma membrane is consistent with the
proposed role of these cells as net producers and transporters of lactate (Gerhart, 1999).
Furthermore, studies have shown that there is a high concentration of lactic acid and low pH near
the Müller cell microvilli that extends into the subretinal space and the outer nuclear membrane
(Gerhart, 1999). MCT 1 in the inner segments of photoreceptors, the region of the cell that
contains mitochondria, also functions to move lactate across the membrane and into the cell.
BASIGIN
Basigin was first described by Linser in 1986 as the 5A11 antigen and was originally
thought to be Müller cell specific (Linser et al., 1986). It has since been localized to the plasma
membrane of the retinal pigment epithelium (RPE), photoreceptor cells and their inner segments,
and blood vessel endothelial cells of the retina, in addition to the Müller cells (Ochrietor et al,
2001). This protein has been subsequently identified in various tissues and cell lines, and it is

16
known as CE9 in rats (Finneman et al., 1997), 5A11 or HT7 in chicken (Seulberger et al., 1990)
and extracellular matrix metalloproteinase inducer (EMMPRIN) or leukocyte activation antigen
in humans (Biswas et al , 1995). These proteins, with different names, are identical in form.
The Basigin gene is located on chromosome 10 in mice and the protein is synthesized by
a secretion system including the rough endoplasmic reticulum (rER) and the Golgi apparatus
(Ikagura et al., 1998). The gene consists of eight exons spanning 7.5 kb of DNA (Miyauchi et al.,
1995; Ochrietor et al., 2003). The Basigin protein is 27 kDa that becomes a 50 kDa integral
membrane glycoprotein belonging to the immunoglobulin (Ig) superfamily. The protein
possesses two Ig domains, a hydrophobic transmembrane domain and a short cytoplasmic tail
(Figure 1.7). The first immunoglobulin-like domain of the Basigin molecule is encoded by the
second and third exons and the second immunoglobulin-like domain by the fourth and fifth
exons. The fifth exon encodes not only the C proximal portion of the second immunoglobulin-
like domain, but also the transmembrane domain and a small portion of the cytoplasmic domain
(Miyauchi et al., 1995).
Studies done by Ochrietor et al.(2003) identified a second form of Basigin, named
Basigin-2. Basigin-2 is a transcript of ∼1.8 kb and is the result of the splicing of an exon into the
Basigin transcript (Ochrietor et al., 2003). The Basigin-2 protein has a similar structure to the
Basigin protein with an additional Ig domain in the extracellular portion composed of 116 amino
acids (Ochrietor et al., 2003; Figure 1.7). Basigin-2 is found only in the retina, specifically the
surface of photoreceptor cells and their inner segments (Ochrietor et al., 2003).
In terms of function, Basigin is a cell-adhesion molecule known to be involved in a
variety of cell and tissue processes. As reviewed by Ochrietor and Linser (2004), Basigin plays a

17
Figure 1.7. Basigin gene products
Basigin and Basigin-2 are members of the immunoglobulin superfamily (IGSF) and have
Ig-like structures. Basigin is a 50 kDa integral plasma membrane glycoprotein belonging to the
immunoglobulin (Ig) superfamily and possess two Ig domains, a hydrophobic transmembrane
domain and a short cytoplasmic tail. Basigin-2 has a similar structure to Basigin with an
additional Ig domain (open circles) in the extracellular portion composed of 116 amino acids,
making the protein 55 kDa (Ochrietor et al., 2003).
Graphic redacted. Paper copy available upon
request to home institution

18
role in metalloproteinase induction required for wound healing and tumor progression. Basigin
has also been implicated in mammalian oocyte maturation, spermatogenesis, blastocyst
implantation, as well as thymic development and HIV infection (Ikagura et al.,1998; Renno et
al., 2002; Pushkarsky et al., 2001).
More than a decade ago, a strain of mice was generated in which the gene for Basigin
was deleted by molecular means (Ikagura et al., 1998). Basigin null animals have several
deficiencies. For example, Basigin null mice exhibit infertility and disruptions in fertilization
(Ikagura et al, 1998). Approximately 96% of Basigin null embryos are lost around the time of
uterine implantation (Ikagura et al, 1998; Kuno et al, 1998). In addition, these animals exhibited
lower sensitivity to irritating odors (Ikagura et al., 1998), have a reduced response to foot shock
(Naruhashi et al., 1997) and are blind (Hori et al., 2000; Ochrietor et al., 2002).
Studies have shown that Basigin and Basigin-2 are both absent in Basigin null mice
(Ochrietor et al., 2003). The null animals are visually impaired at the time of eye opening (2
weeks of age) despite normal retina architecture at that age (Ochrietor et al., 2002). At visual
maturity (3 weeks of age), the photoreceptor outer segments appear less dense and shorter than
those of control animals, and at 8 weeks, retinal degeneration is first observed (Ochrietor et al.,
2001). Degeneration of the photoreceptors continues such that by 8 months of age, the entire
photoreceptor layer is missing (Hori et al., 2000; Ochrietor et al., 2001).
Philp et al., (2003) demonstrated that Basigin is necessary for the targeting of MCTs to
the plasma membrane and is essential for normal retinal function. A model showing the
interaction of MCT 1 and Basigin is shown in Figure 1.8. When Basigin is absent, MCT 1
expression is not observed at the plasma membrane, but rather observed in intracellular vesicles
(Philp et al., 2003). MCT 1 is the primary lactate carrier found in the Müller cells and inner
19
Figure 1.8. A model of the Basigin and MCT 1 complex (Kirk et al., 2000)
Basigin is shown as the black molecule, whereas MCT 1 is shown as the gray molecule.
Basigin exists as a dimer within the membrane and each polypeptide also associates with MCT 1.
The transmembrane domain of Basigin interacts with MCT 1 via hydrophobic interactions (Finch
et al., 2009).
Graphic redacted. Paper copy available upon request to home institution

20
segments of the retinal photoreceptors. It was hypothesized that a lactate shuttle exists in the
retina. It is thought that the Basigin gene products adhere Müller cells to photoreceptors so that
MCT 1 can efficiently transfer lactate from the Müller cells to the photoreceptors which then use
lactate as an energy source (Ochrietor et al., 2009). In the absence of MCT 1, lactate from Müller
cell metabolism is no longer available for energy metabolism in the photoreceptors, which could
lead to the blindness phenotype (Philp et al., 2003).
Since lactate is not being transported out to the photoreceptors in Basigin null mice, there
is a possible accumulation of this monocarboxylate in the Müller cells. In a study done by Su et
al (2009), it was determined that high concentrations of lactate reduces the extracellular pH in
tumor cells. The purpose of this present study was to determine whether mitochondrial
metabolism or overall health is compromised in Basigin null photoreceptors. It has been
hypothesized that the mitochondria in Basigin null mice photoreceptors are less active than those
of littermate controls due to the lack of lactate presentation to those cells.

21
Chapter 2: Materials and Methods
Generation of mouse retina cell extracts
Basigin null mice and heterozygous littermate controls were sacrificed according to an
accepted protocol (UNF IACUC #10-009) and the eyes were immediately removed. Neural
retinas were isolated from individual eye cups in Phosphate-buffered Saline (PBS; 50 mM
potassium phosphate, 150 nM NaCl, pH 7.2) in a Petri dish. The tissue was transferred to a 1.5
mL centrifuge tube (USA Scientific, Ocala, FL) and centrifuged in an Eppendorf 5415
Centrifuge for 1 minute at 16,100 ×g. The residual PBS was removed and discarded with a fine
tip transfer pipette (SAMCO Scientific, San Fernando , CA). The pelleted tissue was lysed using
200 µl of Cell extraction solution (10 mM Tris, pH 7.4, 100 mM NaCl, 1mM EDTA, 1mM
EGTA, 1mM NaF, 20 mM Na4P2O7, 2mM Na3VO4, 1% Triton X-100, 10% glycerol, 0.1% SDS,
0.5% deoxycholate; Invitrogen Corporation, Carlsbad, CA) containing 1mM
phenylmethanesulfonylfluoride (PMSF; Sigma-Aldrich, St. Louis, MO) and protease inhibitor
cocktail (Pierce/Thermo Scientific, Rockford, IL) . The tissue was incubated on ice for 30
minutes with vortex mixing every 10 minutes, followed by centrifugation in an Eppendorf
Centrifuge 5415 at 13,000 rpm for 10 minutes at 4°C. Cleared lysates (supernatants) were
transferred to clean .5 mL centrifuge tubes using fine tip transfer pipettes. The protein
concentration was determined via a protein assay.
22
Protein assay of mouse retina cell extracts
Bovine Serum Albumin (BSA; Pierce/Thermo Scientific) standards were prepared in 1.5 mL
centrifuge tubes, as described in Table 2.1. Each of the mixtures was vortex mixed and 5 µl of
each mixture was transferred to duplicate wells of a 96 well plate (Corning Incorporated,
Corning, NY). Samples (2.5 µl) of mouse retina cell extracts were added to 2.5 µl of deionized
water, vortex mixed, and transferred to other wells of the same 96 well plate. Coomassie
(Bradford) stain (250 µl; Pierce/Thermo Scientific) was added to the wells containing the BSA
standards and the mouse retina samples. The absorbance of the solution in each well of the plate
was measured at 595 nm using a Bio-Tek platereader (Winooski, VT) and a standard curve for
BSA was generated using Microsoft Excel software (Redmond, WA). The concentrations of the
mouse retina cell extracts were calculated from the equation of the standard curve.
Cytochrome c assay
Cytochrome c standard (10 ng; Invitrogen Corporation, Carlsbad, CA) was reconstituted
with 2 mL of the Standard Diluent Buffer (Invitrogen Corporation) and allowed to incubate for
10 minutes at room temperature. Standard Diluent Buffer (0.25 mL) was added to six 1.5 mL
centrifuge tubes, and 1:2 serial dilutions of the standard were made as described in Table 2.2.
Solutions were vortex mixed between dilutions.
The Cytochrome c standards generated were transferred to wells commercially coated
with an antibody to Cytochrome c (Invitrogen Corporation). The normal and Basigin null mouse
retina cell extracts were diluted 1:10 in Standard Diluent Buffer (100 µl total volume) in 1.5 mL
centrifuge tubes and then transferred to other commercially coated wells.

23
Table 2.1. BSA Standard Preparation
Tube # BSA (µl) Deionized water(µl) BSA concentration
(mg/mL)
1 0 20 0
2 2 18 0.2
3 4 16 0.4
4 6 14 0.6
5 8 12 0.8
6 10 10 1.0
7 12 8 1.2
8 14 6 1.4
9 16 4 1.6
10 18 2 1.8
11 20 0 2.0

24
Table 2.2. Dilution of Cytochrome c Standard
Concentration Standard Diluent Buffer
5 mg/mL 0.25 ml of 5 mg/mL
Standard
0 mL
2.5 ng/mL 0.25 mL of the 5 mg/mL
standard
0.25 mL
1.25 ng/mL 0.25 mL of the 2.5 ng/mL
standard
0.25 mL
0.625 ng/mL 0.25 mL of the 1.25 ng/mL
standard
0.25 mL
0.312 ng/mL 0.25 mL of the 0.625 ng/mL
standard
0.25 mL
0.156 ng/mL 0.25 mL of the 0.312 ng/mL
standard
0.25 mL
0.078 ng/mL 0.25 mL of the 0.156 ng/mL
standard
0.25 mL
0 ng/mL 0 mL 0.25 mL

25
Wells were covered with Parafilm (Pechiney Plastic Packaging, Menasha, WI) and
incubated at room temperature for 2 hours. Excess solutions were aspirated from the wells with a
fine tipped transfer pipette and discarded. A working wash solution was prepared in a 50 mL
Corning tube (Corning Incorporated) using 1 mL of the 25x wash Buffer concentrate (Invitrogen
Corporation) diluted in 24 mL of deionized water. Wells were washed four times each with 0.4
mL of the working wash solution for 15-30 seconds each. The wash buffer was removed with a
fine tipped transfer pipette. Next, each well received 100 µl of the anti-Cytochrome c (Biotin
Conjugate), except for the chromogen blank. The wells were covered with Parafilm and
incubated for one hour at room temperature. The solution was removed from each well with a
fine tipped transfer pipette and the wells were washed four times with 0.4 mL of the working
wash solution for 15-30 seconds. The Streptavidin -horseradish peroxidase (HRP) working
solution was prepared by diluting the Streptavidin HRP (Invitrogen Corporation) 1:100 in HRP
diluent buffer (Invitrogen Corporation). The Streptavidin HRP working solution (100 µl) was
added to each well except the chromogen blanks. Wells were covered with Parafilm and
incubated for 30 minutes at room temperature. The solution was removed from each well with a
fine tipped transfer pipette and the wells were washed four times as previously described.
Stabilized chromogen (100 µl) was added to all of the wells and incubated for 30 minutes at
room temperature. Stop solution (10 µl; Invitrogen Corporation) was added to all the wells and
the absorbance was measured at 450 nm using a Bio-Tek platereader.
A standard curve for Cytochrome c was generated using Microsoft Excel software so that
the Cytochrome c concentrations for the normal and Basigin null mouse retina cell extracts and
controls could be determined.

26
Autophagy assay
Mouse retina cell extracts from normal and Basigin null animals were diluted to 100
ug/mL in PBS in a 1.5 mL centrifuge tube and transferred to wells (100 µl to each) of a 96-well
plate (Corning Incorporated). Wells designated as the spectrophotometric blanks received 100 µl
of PBS. The plate was covered with Parafilm and incubated for two days at 4°C. The protein
samples and PBS were removed from respective wells with a transfer pipette. Primary
antibodies specific for RAB 24, APG1, APG16L, BECN1 and APG5L (Abgent Antibodies, San
Diego, CA) were each diluted 1:100 in PBS in a 1.5 mL centrifuge tube and transferred (100 µl
each) to appropriate wells of the assay plate. The wells were covered with Parafilm and
incubated for 30 minutes at 37°C. The solutions were removed from the wells with fine tipped
transfer pipettes and the wells were washed three times with 0.3 ml of PBST (PBS containing
0.05% Tween 20). Alkaline phosphatase-conjugated goat-anti-rabbit secondary antibody
(Pierce/Thermo Scientific) was diluted 1:1000 in PBS in a 1.5 mL centrifuge tube and 100 µl
was added to each appropriate well. The wells were covered with Parafilm and incubated for 30
minutes at 37°C. The solution was removed to Alkaline phosphatase Substrate (PNPP;
Pierce/Thermo Scientific; 100 µl) and was added to all the wells and the plate was incubated for
approximately 30 minutes at room temperature. The reactions were stopped by adding 50 µl of
2N NaOH to each well. The absorbance of the solutions in each well was measured using a Bio-
Tek platereader at 405 nm. The absorbance measured was directly correlated to the relative
concentration of the target protein present the samples. All runs were performed in duplicate.
Microsoft Excel software was used to generate the graphical representation of the data.

27
Mitotracker Assay
Mitotracker Red FM and Green FM (Invitrogen Corporation) dyes were diluted in DMSO
to a working concentration of 1mM and incubated for 30 minutes at 37°C.
Basigin null mice and heterozygous littermate controls were sacrificed at post natal day
18 (P18) according to an accepted protocol and the eyes were immediately removed. Neural
retinas were isolated from individual eye cups in PBS and then transferred to 1.5 mL centrifuge
tubes containing both Mitotracker Red and Mitotracker Green, each diluted 1:1000 in PBS (500
µl total volume). The tissues were disrupted by passing through a 1-200 µl volume micropipette
tip and incubated for 2 hours at 37°C. The tissues were pelleted by centrifugation in an
Eppendorf 5415D Centrifuge at 13,000 rpm for 10 minutes. The supernatant was removed with
a fine tipped transfer pipette and the tissue was resuspended in 200 µl of 37oC PBS. The solution
was mixed by vortexing and 100 µl of each solution was transferred to a black Nunc 96 well
plate (Thermo Scientific, Rochester, NY). The absorbance was measured using a Biotek
Fluorescence FLx800 plate reader at 550-650 nm for Mitotracker Red and 400 nm for
Mitotracker Green.
Microsoft Excel Software was used to determine the relative percentages of active
mitochondria in each sample and generate a graph of the results.

28
Chapter 3: Results
The Basigin null mouse is characterized as possessing several phenotypic abnormalities.
Both male and female null mice are sterile, as Basigin is necessary for spermatogenesis and
embryo implantation into the endometrial layer of the uterus (Igakura et al., 1998). Basigin null
mice do not run from offensive odors like their control littermates (Ikagura et al., 1998), they
have a high threshold for pain (Naruhashi et al., 1997), and they are blind from the time of eye
opening (Hori et al., 2000; Ochrietor et al., 2002). It has been proposed that the blindness
observed in these animals stems from faulty metabolism in the retina in the absence of Basigin
gene product expression in that tissue (Philp et al., 2003).
It has been proposed that a lactate shuttle exists within the retina, in which Basigin gene
products interact with MCTs 1 and 4 to deliver lactate from the Müller cells to the photoreceptor
cells. Lactate is a monocarboxylate that serves as a source of pyruvate for metabolism in
vertebrate nervous tissues, which is subsequently converted to acetyl CoA and fuels oxidative
phosphorylation (Lewandowski et al., 1995). Basigin null mice do not express MCT 1 and
MCT4 on the plasma membranes of Müller cells or photoreceptor cells (Philp et al., 2003). It
has therefore been proposed that in the absence of the lactate shuttle complex, in the Basigin null
mouse retina, the photoreceptor cells are not sufficiently nourished by the Müller glial cells and
they never function (Ochrietor and Linser, 2004). Since mitochondria are the organelles
responsible for cellular respiration, the aim of this project was to assess mitochondrial health in
the Basigin null mouse retina.

29
Assay of Cytochrome c
Initially, mitochondrial health was assessed via a Cytochrome c assay. Basigin null and
littermate control retinas were harvested at three weeks and three months of age and protein
lysates were isolated. The assay uses an ELISA format to compare Cytochrome c concentration
in samples relative to a standard curve of Cytochrome c at known concentrations at the ages of 3
and 12 weeks. It was determined that the concentration of Cytochrome c was reduced in the
Basigin null mouse retinas compared to the concentrations observed in retinas of littermate
controls (Figure 3.1).
Assay of autophagy induction
The results of the initial assay, in which it was determined that Cytochrome c
concentrations were lower in Basigin null mice compared to littermate controls, suggested that
mitochondria and Cytochrome c may be sequestered via mitophagy within the Basigin null
mouse retinas. Mitophagy is a specific form of autophagy, which is a tightly regulated pathway
involving the lysosomal degradation of mitochondria (Yue at al., 2003). Although it is a natural
process that removes damaged organelles, autophagy is also stimulated by multiple forms of
cellular stress, including nutrient deprivation, insufficient growth factors, hypoxia, reactive
oxygen species, DNA damage, and pathogens (Kroemer, 2008). Therefore, it is plausible to
suggest that autophagy occurs in the Basigin null mouse retina. The same normal and Basigin
null mouse retina lysates (post-natal day [P] 18) generated for the Cytochrome c analyses were
subjected to ELISA analyses using antibodies specific for proteins known to be expressed within
the autophagy pathway. The proteins assayed are expressed at various points of autophagosome

30
Figure 3.1. Cytochrome c assay
Cytochrome c concentrations (ng/mL) in Basigin normal and null mice retinas were
determined using a Cytochrome c assay (Invitrogen Corporation). Samples of normal and
Basigin null mouse retina lysates were compared to a standard curve of known Cytochrome c
concentrations to determine the concentration of Cytochrome c within each sample. Runs were
performed in duplicate. The average concentration at each age is plotted and the error bars
indicate the standard deviation. Normal animals are indicated by the blue bars, whereas the
Basigin null animals are indicated by the gray bars. * p < 0.05 via Student t-Test (comparison of
normal to null at each age)

31
formation. Specifically, the assay measured relative amounts of APG1, which stimulates
autophagy; APG16L and APG5L , which are expressed during autophagic vesicle formation;
BECN1, which regulates endolytic processes during late stage autophagy; and the GTPase
RAB24, which is expressed during the formation and regulation of autophagic vacuoles (Scott,
1997). As shown in Figure 3.2, no significant increase in expression of any autophagy proteins
was observed in the Basigin null mice as compared to the littermate controls. Indeed, the
expression levels of autophagy proteins APG16L, RAB24 and BECN1 were actually reduced
when compared to the normal animals.
Assay of mitochondrial activity
Since the first two assays gave perplexing results, the next step was to directly determine
the relative activities of mitochondria in normal and Basigin null mice using Mitotracker dyes
(Invitrogen Corporation). Retinas from postnatal day 12 Basigin null mice and littermate controls
were isolated and mechanically dissociated in a saline buffer. The retinas were then incubated
with a mixture of Mitotracker Red, which stains metabolically active mitochondria, and
Mitotracker Green, which stains all mitochondria. The red fluorescence measured at 650 nm
provided a relative measure of mitochondria activity, since the dye is only taken up by
mitochondria that possess a membrane potential. The green fluorescence measured at 510 nm
allowed the total numbers of mitochondria to be normalized between the normal and null
samples. It was determined that the percentages of active mitochondria are similar between the
normal and Basigin null samples, as shown in Figure 3.3A. However, the percentages of total
mitochondria are reduced by ~50% in the Basigin null mice when compared to those of control
animals (Figure 3.3B).

32
Figure 3.2. Relative expression of autophagy proteins in normal and Basigin null mouse
retinas
Samples of normal and Basigin null mouse retina protein lysates were compared for the
relative expression of autophagy proteins via ELISA analysis. Runs were performed in duplicate
and the average absorbance at 405 nm was plotted. Error bars indicate the standard deviation for
each sample. Normal mice are indicated by the blue bars, whereas Basigin null mice are
indicated by the gray bars.

33
Figure 3.3. Mitotracker analyses of mitochondria from normal and Basigin null mouse
retinas
The percentage of active mitochondria (A) were measured using Mitotracker Red FM dye
(Invitrogen Corporation) and the percentage of total mitochondria (B) were measured using
Mitotracker Green FM dye (Invitrogen Corporation). Runs were performed in triplicates. The
value obtained for normal mouse retinas was set to 100% and those for Basigin null mouse
retinas were compared. The error bars represent the standard deviations. Normal mice are
indicated by the blue bars, whereas Basigin null mice are indicated by the gray bars.
34
To assess mitochondrial activity and numbers during postnatal development of the mouse
retina, an additional assay was carried out. Retinas from normal mice at postnatal days 1, 7, 14,
21 and 28 were isolated and mechanically dissociated in a saline buffer. The retinas were then
incubated with a mixture of Mitotracker Green and Mitotracker Red, as described. Figure 3.4
shows the results of the study. It was determined that the number of active mitochondria within
a mouse retina is greatest at visual maturity (postnatal day 21).

35
Figure 3.4. Mitotracker assay of mouse retina
Mitotracker Green was used to determine the concentration of the total number of
mitochondria (blue) while Mitotracker red was used to determine the concentration of
active mitochondria (gray). Runs were performed in triplicate. Absorbance was adjusted
to reflect percentages of concentrations relative to P21 (retinal visual maturity). The
error bars represent the standard deviations.

36
Chapter 4: Discussion
Basigin gene products are found on the surface of Müller cells, photoreceptor cell bodies
and a portion of the inner segment of the retina (Ochrietor et al., 2001). It was reported that the
retinas of Basigin null mice undergo retinal degeneration preceded by the retardation of
photoreceptor maturation, and the blindness phenotype in these animals (Ochrietor et al., 2001).
The purpose of this study was to determine the possible cause of blindness in the Basigin null
mice by examining the mitochondrial health of the retina. It was hypothesized that the lack of a
lactate shuttle in the Basigin null mouse retina causes the inactivity of the photoreceptors,
leading to blindness.
Lactate has been shown to constitute an adequate energy substrate for skeletal muscles,
testis, and various nervous tissues (Pellerin, 2003). Poitry-Yamate et al., (1995) proposed that
the net production and release of lactate by Müller cells serves to fuel mitochondrial oxidative
metabolism and glutamate resynthesis in photoreceptors. The spatial relationship of Müller cells
and the photoreceptors makes the trafficking of metabolites possible (Poitry-Yamate, 1995),
likely mediated by MCT 1 and Basigin (Philp et al., 2003).
Initially, Cytochrome c and autophagy assays were performed to assess mitochondrial
health in the Basigin null mouse retina. Mitochondrial Cytochrome c is a water soluble protein
that functions as an electron carrier in the respiratory chain. The release of Cytochrome c from
the mitochondria – the organelle that regulates apoptosis- precedes caspase activation and is
considered an early event in the apoptotic process (Finucane et al., 1999). These characteristics
make the detection of this protein an effective tool in determining whether apoptosis is occurring

37
in a tissue. In this study , it was used to determine whether apoptosis in Basigin null mouse
retinas could be detected prior to photoreceptor degeneration . Using ELISA, it was shown that
there is a significant decrease in the concentration of Cytochrome c in the Basigin null mice
compared to normal counterparts. These data suggest that apoptosis is not upregulated in the
Basigin null mouse retina, as compared to its littermate controls.
Autophagy, like apoptosis, is a natural and tightly regulated pathway, but involves the
lysosomal degradation of whole cytoplasmic organelles and their components. Several
neurodegenerative diseases are caused by defective autophagy, including Alzheimer’s disease, in
which a massive buildup of undigested substrate is seen within the axons and dendrites (Nixon,
2011). Failure of autophagosomes to recognize their correct cargo can lead to incorrect
sequestration of proteins which in turn leads to Huntington’s and Parkinson’s disease (Martinez-
Vicente et al., 2010). Autophagy can be triggered by multiple forms of cellular stress including
nutrient deprivation (Kroemer, 2008). It was proposed, based on the low levels of Cytochrome c
in the null mouse retinas, as compared to the controls, that mitophagy, a specialized form of
autophagy in which whole mitochondria and their components are destroyed may occur in the
Basigin null mouse retina. Using ELISA, it was shown that there was not a significant increase in
the levels of autophagy proteins in the null animals compared to their normal counterparts. These
data suggest that autophagy is not upregulated in the Basigin null mouse retina.
Mitotracker dyes (red and green) were used to directly detect the mitochondrial metabolic
activity in the Basigin null and normal retinas. Mitotracker Green is a fluorescent mitochondrial
dye that localizes to the mitochondria regardless of mitochondrial membrane potential.
Mitotracker Red is a fluorescent dye that stains mitochondria in live cells and its accumulation
depends on the presence of membrane potential (Invitrogen Corporation). Dissociated retinas

38
were stained with both Mitotracker Red and Green so that mitochondrial activity (Mitotracker
Red) could be compared using samples that have been normalized for total number of
mitochondria (Mitotracker Green). While it was determined that there was no significant
difference in the percent of active mitochondria between the two groups, it was revealed that
Basigin null mice have a ~ 50% less mitochondria in their retinas than age matched controls.
This is a significant finding, since the ages tested are before retinal degeneration begins in these
animals (Ochrietor et al., 2001), meaning that the two groups should have comparable numbers
of photoreceptors. This finding also explains the results of the Cytochrome c assay, as lower
numbers of mitochondria will yield a lower concentration of Cytochrome c.
It is of interest to note that mitochondrial numbers increase during post natal eye
development and peak at retinal maturity ( P21 , Figure 3.4) . The numbers of mitochondria then
decrease by half at the adult age tested. The majority of mitochondria present are active at all
ages tested, except P14 and P28, in which only ~ 50% of mitochondria are active. Since
mitochondria turnover approximately every ten days (Alberts, 1994), it is likely that newly
“born” mitochondria that are not yet active were detected at those ages.
Although the Mitotracker assay indicates a reduction in total numbers of mitochondria in
Basigin null mouse retinas, it is not known which cells of the retina have low numbers of
mitochondria. A recent study in which Basigin expression within a human malignant melanoma
cell line was knocked down indicated that glycolytic output diminishes in the absence of Basigin
(Su et al., 2009). Similar to what occurs in the Basigin null mouse retina, Basigin
downregulation in the cell line led to downregulation of the expression of MCT 1 at the plasma
membrane. Lactate produced by the Basigin knockdown melanoma cells cannot be exported
from the cells and feedback inhibition reduces the rate of glycolysis (Su et al., 2009). It is

39
therefore likely that Müller cells of the Basigin null retina undergo a similar phenomenon.
Glycolysis rates would not likely affect total numbers of mitochondria within the same cell. It is
therefore plausible to propose, based on studies by Poitry-Yamate (1995), that the reduction in
mitochondrial numbers is attributed to the photoreceptors.
In conclusion, a model for the metabolic uncoupling that is proposed to occur in the
Basigin null mouse retina is shown in Figure 4.1. Müller cells and photoreceptors are in close
association with each other. Blindness in the Basigin null mice is thought to be attributed to the
lack of a lactate shuttle between these cells (Philp et al., 2003). In the Basigin null Müller cells,
lactate is being produced and is not transported to the photoreceptors because of the absence of
MCT 1 and MCT 4 on the plasma membrane, which may lead to the acidification of the cell and
decrease in the glycolysis rate. The Basigin null photoreceptors are not likely receiving lactate
for oxidative phosphorylation, leading to the decrease in the number of mitochondria, as seen in
the Mitotracker assay. Mitochondrial numbers are dictated by the metabolic activity of the cells
or tissues (Alberts, 1994). Since little lactate –mediated metabolism is thought to occur in
Basigin null photoreceptors, it is likely that these cells have reduced numbers of mitochondria.
Less mitochondria means less cellular energy and therefore depressed synaptic activity. As
synaptic activity decreases, neuronal degeneration occurs. It is clear that this examination of the
mitochondrial health in the Basigin null retina proved to be essential in understanding the
mechanism of retinal dystrophy and degeneration seen in these animals.

40
Figure 4.1. Metabolic uncoupling in the Basigin null mouse retina
Lactate is not delivered from Muller cells to photoreceptors, which results in
decreased oxidative phosphorylation and subsequent decreases in mitochondria. The lack
of energy in photoreceptors may account for depressed ERGs in Basigin null mice, and
hence their blindness from the time of eye opening. Neurons that do not work well die,
therefore, degeneration of the photoreceptors is eventually observed. Lactate buildup in
Muller cells leads to acidification of those cells and likely decreased glycolytic activity.

41
References
Alberts, B., ( 1994). Molecular biology of the cell. New York, NY: Garland Publishing.
pp. 704-716.
Andrews, R.M., Griffiths, P.G., Johnson, M.A., Tumbull, D.M. (1999). Histochemical
localisation of mitochondrial enzyme activity in human optic nerve and retina
J. Opthalmol. 83, 231-235.
Artal, P., Tabernero, J. (2008). The eye’s aplanatic answer. Nature Photonics, 2, 586-589.
Barton, R. A. (2007). Evolutionary specialization in mammalian cortical structure.
J Evol. Bio., 20, 1504–1511.
Biswas, C., Zhang Y., DeCastro, R. (1995). The human tumor cell-derived collagenase
stimulatory factor (renamed EMMPRIN) is a member of the immunoglobulin
superfamily. Cancer Res., 55, 434-439.
Bossy-Wetzel, E., Green, D.R. (2000). Detection of apoptosis by Annexin V labeling. Methods
Enzymol. 322, 15–18.
Cajal, S.R. (1893). La retine des vertebres. La Cellule, 9, 17-25.
Chen, C., Liu, Y., Zheng, P. (2009). mTOR regulation and therapeutic rejuvenation of
aging hematopoietic stem cells. Sci. Signal., 2, 75.

42
Cuff, M.A., Shirazi-Beechey, S.P. (2005). The human Monocarboxylate Transporter MCT 1:
Gene structure and regulation. Gastrointestinal and Liver Physiol., 289, 977.
Dowling, J.E. (1987). The Retina: An Approachable Part of the Brain. Cambridge, MA.
Bellknap Press.
Finch, N.A., Linser, P.J., Ochrietor, J.D. (2009). Hydrophobic interactions stabilize the Basigin-
MCT 1 complex. Protein J. 28, 362-368.
Finneman, S.C., Marmorstein, A.D., Neill, J.M., Rodriguez-Boulan, E. (1997). Identification
of the Retinal Pigment Epithelium protein RET-PEZ as CE-9/OX-47, a member of the
immunoglobulin superfamily. Invest. Opthalmol. Vis. Sci., 38, 2366-2374.
Finucane, DM, Bossy-Wetzel, E. Waterhouse, NJ., Cotter, TG., Green, DR. (1999). Bax-
induced caspase activation and apoptosis via Cytochrome release from
mitochondria is inhibitable by Bcl-xL. J. Bio..l Chem., 274,
2225-2233.
Gerhart, D.Z., Leino, R.L., Drewes, L.R. (1999). Distribution of Monocarboxylate Transporters
MCT 1 and MCT 2 in rat retina. Neuroscience, 92, 367-375.

43
Gottlieb, R. A., Carreira, R. S. (2010). Autophagy in health and disease; Mitophagy as a way
of life. Am. J. Physiol. Cell Physiol., 299, 203-210.
Halestrap, A.P., Price, N.T. (1999). The proton linked monocarboxylate transporter (MCT)
family: structure, function and regulation, J. Biochem., 343, 281-299.
Henze, M.W. (2003). Evolutionary Biology: essence of the mitochondria. Nature,426, 127-128.
Hoang, Q.V., Linsenmeier, R.A., Chung, C.K., Curcio, C.A. (2002). Photoreceptor inner
segments in monkey and human retina: Mitochondrial density, optics and regional
variation. Vis Neuro., 19, 395-407.
Hori, K., Katayama, N., Kachi, N., Kondo, M., Kadomatsu, K., Usukura, J., Muramatsu, T.,
Mori, S., Miyake, Y. (2000). Retinal dysfunction in Basigin deficiency. Invest.
Opthalmol.Vis. Sci., 41, 3128-3133.
Ikagura, T., Kadomatsu, K., Kaname, T., Muramatsu, H., Fan, Q., Miyauchi, T., Toyama, Y.,
Kuno, N., Yuasa, S., Takahashi, M., Senda, T., Taguchi, O., Yamamura, K., Aimura, K.,
Muramatsu, T. (1998). A null mutation in Basigin, an immunoglobulin superfamily
member, indicates its important role in peri-implantation, development and
spermatogenesis. Dev. Biol., 194, 152-165.

44
Karp, G. (2008). Cell and Molecular Biology. Hoboken, NJ: John Wiley & Sons. 5th edition
pp. 194.
Kirk P, Wilson MC, Heddle C, Brown MH, Barclay AN, and Halestrap AP. (2000). CD147 is
tightly associated with lactate transporters MCT1 and MCT4 and facilitates their cell surface expression. Embo J. 19. 3896-3904.
Kuno, N., Kadomatsu, K., Fan, Q., Hagihara, M., Senda,T., Mizutani, S., Muramatsu, T.,
(1998). Female sterility in mice lacking the Basigin gene , which encodes the
transmembrane glycoprotein belonging to the immunoglobulin superfamily. FEBS
Letters, 425, 191-194.
Kroemer, G., Levine, B. (2008) Autophagic cell death: The story of a misnomer. Nat. Rev. Mol.
Cell Bio., 9, 1004-1010.
Lewandowski, ED., Damico, LA., White LT., Yu, X. ( 1995) Cardiac response to induced lactate
Oxidation: NMR analysis of metabolic equilibria. Am. J Physiol,. 269, 60-68.
Linser, P. J., Andreae, M., and Perkins, M. S. (1986) Developmental analysis of an antigen localized predominantly in the Muller glial cell plasma membrane in the avian neural retina. J. Cell Biol., 103, 477.

45
Martinez-Vicente, M., Talloczy, Z., Wong, E., Tang, G., Koga, H., Kaushik, S., de Vries, R.,
Arias, E., Harris, S., Sulzer, D. and Cuervo, A.M. (2010) Cargo recognition failure is
responsible for inefficient autophagy in Huntington’s Disease. Nat. Neurosci. 13 , 567-
576.
Martini, F.H. (1999) . Anatomy and Physiology. 7th Edition. Prentice Hall Inc.
Miyauchi, T., Jimma, F., Ikagura, T., Yu, S., Osazawa, M., Muramatsu, T. (1995). Structure of
the mouse Basigin gene, a unique member of the immunoglobulin superfamily.
J. Biochem., 118, 717-724.
Naruhashi K, Kadomatsu K, Igakura T, Fan Q-W, Kuno N,Muramatsu H, Miyauchi T, Hasegawa T, Itoh A, Muramatsu T, Nabeshima T.(1997). Abnormalities of sensory and
memory functions in mice lacking Bsg gene. Biochem. Biophys. Res. Comm., 236, 733– 737.
Nixon, R.A., Yang, D.S. (2011). Autophagy failure in Alzheimer’s disease-locating
the primary defect. Neurobiol. of Disease, 43, 38-45.
Ochrietor, J.D., Moroz, T.M., Kadamatsu, K., Muramatsu, T., Linser, P.J., (2001). Retinal
degeneration following failed photoreceptor maturation in 5A11/Basigin null mice.
Exp. Eye Res., 72, 467-477.

46
Ochrietor, J.D., Moroz, T.P., Clamp, M.F., Timmers, A.M., Muramatsu, T., Linser, P.J., (2002).
Inactivation of the Basigin gene impairs normal retinal development and maturation.
Vis. Res., 42, 447-453.
Ochrietor, J. D., Moroz, T. P., van Ekeris, L., Clamp, M. F., Jefferson, S. C., deCarvalho, A. C.,
(2003). Retina-specific expression of 5A11/Basigin-2, a member of the immunoglobulin gene superfamily. Invest. Ophthal. & Vis. Sci., 44, 4086-4096.
Ochrietor, J.D., Linser, P.J., (2004). 5A11/Basigin gene products are necessary for proper
maturation and function of the retina. Dev. Neurosci., 26, 380-387.
Ochrietor, J.D., Selfridge, J., McGarrell, D,. Mince, K., McCormack, A.D., (2009). Basigin
gene products form a novel adhesion system between photoreceptors and Müller glia in
the vertebrate neural retina. Mol. Biol. Cell 19: Abstract #481.
Pellerin, L. (2003). Lactate as a pivotal element in neuron-glia metabolic cooperation.
Eurochemistry International, 43, 331-338.

47
Philp, N.J., Ochrietor, J.D., Rudoy, C., Muramatsu, T., Linser, P.J. (2003) Loss of MCT 1,
MCT 3 and MCT 4 expression in the retinal pigment epithelium and neural retina of
the 5A11/Basigin null mouse. Invest. Opthalmol. Vis. Sci., 44, 1305-1311.
Poitry-Yamate, C.L., Poitry, S., Tsacopoulos, M. (1995). Lactate released by Müller cells
is metabolized by photoreceptors of the mammalian retina, J. Neurosci., 20, 1809-1821.
Pushkarsky, T., Zybarth, G., Dubrovsky, L., Yurchenko, V., Tang, H., Guo, H., Toole, B.,
Sherry, B., Bukrinsky, M. (2001). CD147 facilitates HIV-1infection by interacting with
virus-associated cyclophilin Acad.Sci., 6360 – 6365.
Renno, T., Wilson, A., Dunkel, C., Coste, I., Maisnier-Patin, K., Benoit, D.C., Aubry, J.P.,
Lees, R.K., Bonnefoy, J.Y., MacDonald, H.R., and Gauchat, J.F. (2002). A role for
CD147 in thymic development. J. Immunol., 168, 4946 – 4950
Ribelayga, C., Cao, Y., Stewart, C.M. (2008). The circadian clock in the retina controls rod-
cone coupling. Neuron, 59, 790-801.
Robinson, J.P. 2006. Purdue Cytometry CD ROM Series , Volume 4.
Scott, S.V., Baba, M., Osumi, M. (1997). Two distinct pathways for targeting proteins from the
cytoplasm to the vacuole/lysosome. J. Cell Biol., 139, 1687–1695.
48
Seulberger, H., Lottspeich, F., Risau, W. (1990). The inducible blood brain barrier specific
molecule HT7 is a novel immunoglobulin-like cell surface glycoprotein. EMBO J.
9, 2151-2158.
Sharma, R.K., O’Leary, T.E., Fields, C.M., Johnson, D.A. (2003). Development of the outer
retina in the mouse. Dev. Brain Res., 145, 93-105.
Simos, P.G. (2001). Vision in the Brain: Organization and plastivity in the visual system. Lisse,
The Netherlands. Swers and Zeitlinger Publishers. Ist edition , pp. 44.
Spira, A.W., Huang, P.T. (1978). Phagocytosis of photoreceptor outer segments during
retinal development in utero, Am. J. Anat., 152, 523-527.
Stone, J., Van Driel, D., Valter, K., Rees, S., Provi, J. (2008). The locations of mitochondria
in mammalian photoreceptors and its relation to retinal vasculature, Brain Res., 1189,
58-69.
Su, J., Chen, X., Kanekura, T. (2009). A CD147 targeting sIRNA inhibits the proliferation,
invasiveness and VEGF production of human malignant melanoma cells by down
regulating glycolysis, Cancer Lett., 273, 140-147.

49
Wilson, M.C., Meredith, D., Bunnun, C., Sessions, R.B., Halestrap, A. (2009). Studies on
DIDS-binding site of Monocarboxylate Transporter 1 suggest a homology model
of the open conformation and a plausible translocation cycle. Bio. Chem., 284,
20011-20021.
Young, R.W. (1971). The renewal of rod and cone outer segments in the rhesus monkey, J. Cell
Bio., 49, 303-318.
Yue,Z., Jin,S., Yang,C., Levine,A.J., and Heintz,N. (2003). Beclin 1, an autophagy gene
essential for early embryonic development, is a haploinsufficient tumor suppressor. Natl. Acad. Sci., 100, 15077-15082.

50
VITA
Name of author
Kristine Anne V. Pablo
Date and place of birth
Degrees awarded
B.S, Biology, University of North Florida, May 2007, Cum Laude
Honors and awards
Graduate Scholars Program Grant, Fall 2009
Graduate Scholars Program Grant, Spring 2010
SENN/GASCNC Travel Grant Award, Spring 2010
Professional Experience
Graduate Teaching Assistant, University of North Florida, January 2009- May 2011
Presentations
2010 South East Nerve Net (SENN) and Georgia/South Carolina Neuroscience Consortium
(GASCNC) conference. Atlanta, Georgia, USA, March 05 - 07, 2010