examining mathematical representation to solve problems in
TRANSCRIPT

International Journal of Education in Mathematics, Science, and Technology (IJEMST) affiliated with
International Society for Technology, Education, and Science (ISTES): www.istes.org
www.ijemst.net
Examining Mathematical Representation
to Solve Problems in Trends in
Mathematics and Science Study: Voices
from Indonesian Secondary School
Students
Dwi Priyo Utomo
Universitas Muhammadiyah Malang, Indonesia
Dita Latifatu Syarifah
Universitas Muhammadiyah Malang, Indonesia
To cite this article:
Utomo, D. P., & Syarifah, D. L. (2021). Examining mathematical representation to solve
problems in trends in mathematics and science study: Voices from Indonesian secondary
school students. International Journal of Education in Mathematics, Science, and
Technology (IJEMST), 9(3), 540-556. https://doi.org/10.46328/ijemst.1685
The International Journal of Education in Mathematics, Science, and Technology (IJEMST) is a peer-
reviewed scholarly online journal. This article may be used for research, teaching, and private study
purposes. Authors alone are responsible for the contents of their articles. The journal owns the copyright of
the articles. The publisher shall not be liable for any loss, actions, claims, proceedings, demand, or costs or
damages whatsoever or howsoever caused arising directly or indirectly in connection with or arising out of
the use of the research material. All authors are requested to disclose any actual or potential conflict of
interest including any financial, personal or other relationships with other people or organizations regarding
the submitted work.
This work is licensed under a Creative Commons Attribution-NonCommercial-ShareAlike 4.0 International License.

International Journal of Education in Mathematics, Science and Technology
2021, Vol. 9, No. 3, 540-556 https://doi.org/10.46328/ijemst.1685
540
Examining Mathematical Representation to Solve Problems in Trends in
Mathematics and Science Study: Voices from Indonesian Secondary School
Students
Dwi Priyo Utomo, Dita Latifatu Syarifah
Article Info Abstract
Article History
Received:
21 July 2020
Accepted:
11 March 2021
This study describes the mathematical processes in TIMSS (Trends in
Mathematics and Science Study) to reflect issues. A descriptive qualitative
methodology was used in this analysis as the research approach. The research
allocated the respondent to the 6th grade students of Muhammadiyah 6 in the
sub-district of Dau, Malang regency, East Java, Indonesia. Using a TIMSS 2011
test and interview, data was obtained. The results of the study showed that visual
representation took place in both classes of high, medium, and low capacity.
Students of high and low capacity conducted the symbolic representation process
at the comprehension level, while students of medium capacity performed the
symbolic representation process at the problem-solving stage. In addition, as
they wrote topics, the writing of the conclusions was done by students who had
high skill. Students who had medium potential when they wrote questions
completed the writing of the conclusions. The students with a low level of skill
wrote what was understood and asked about the issues.
Keywords
Mathematical representation
Trends in Mathematics
Indonesia
Secondary school
Students
Introduction
Over the last decade, the achievement of Indonesian students in mathematical lessons has not been fulfilled. A
study of TIMSS scores between 1999 and 2004 by the OECD revealed that scores were significantly low. We
have to improve students' mathematical learning processes so that they can meet the goal (Skoumios &
Skoumpourdi, 2021). TIMSS is a math and science examination for students 15 years of age and older. The
purpose of this program is to gather international assessments of the abilities of students in math and science
(Mullis et al., 2016).
The TIMSS needs a high level thinking ability for evaluation because the assessment includes cognitive and
content dimensions. The content dimension influences the cognitive process of evaluating information. The
content dimension for grades eight in Singapore is arithmetic, algebra, geometry, data and opportunity (Ebersole
& Kanahele-Mossman, 2020). The high thinking ability level in mathematics would be useful in problem
solving, reasoning, proof, and talking about mathematics (NCTM, 2000). Representation is one of the process of

International Journal of Education in Mathematics, Science, and Technology (IJEMST)
541
constructing and abstracting mathematical knowledge considered important in developing the understanding and
optimizing students' thinking skills, especially in learning mathematics.
Representation is a method one uses to clarify what one is saying and how one is saying it (NCTM, 2000;
Rangkuti, 2014; Widakdo, 2017). Mathematical representation is an essential skill a student should develop
when learning mathematics (NCTM, 2000). It allows for mathematics to be translated into language that makes
sense to the reader (NCTM, 2000; Tripathi, 2008). The most important function of mathematical representation
is to visualize mathematical ideas from one’s own thoughts using a configuration of symbols (Golding & Kaput,
1996; Yuniawatika, 2015; Polat, 2020).
A graph or a picture represents or symbolizes aspects of concepts. Representation in mathematics is merely a
supplement to solve mathematical problems and they have a very narrow range of representation abilities
(Utomo, 2021). The result of interviews made by Hudiono (2005) with one of the teachers showed that display
methods such as tables and pictures have no impact on students' knowledge acquisition. The 2012 released
results from the TIMSS tests also reveal that Indonesian students are not doing very well with the skills of
representing math ideas and concepts (Armadan, Somakin & Indrayanti, 2017; Mullis, Martin, Foy & Arora,
2012).
Based on the above rational explanation, if students were in grade four and eight, they should possess skills in
mathematical representation in order to be able to compete in TIMSS. According to Piaget, students at the age
of 11 years or older enter into a formal operation stage where they start being able to think abstractly. During
this stage, one of the key characteristics that begins to emerge is the students' ability to think about problems in
a daily life context. Hence, it was decided that the subject of the research that had the advanced study stage
(Grade 8) and whose performance in the TIMSS Advanced Studies test was better than that of the grade VIII
subjects in Korea was chosen because these subjects are at the formal operation stage and they might make a
variety of representation so that it is necessary to know how they consider mathematical problem solving
(Munalikatasari & Rosyidi, 2016; Mullis et al., 2016).
The primary objective of this study was to discover how students created TIMSS problems. Research has
generally been more focused on mathematical abilities and there are few studies that use TIMSS problems in the
students' process of mathematical representation. The previous research conducted by Yumiati & Noviyanti
(2017) was focused on the differences in abilities in mathematical representation among Junior High School
(SMP) students taught using inquiry and conventional methods. A research was made by Minarni & Napitupulu
(2017) that was focused on developing educational materials to improve students' mathematical reasoning
ability. A research performed by Widakdo (2017) showed how students can improve mathematical
representations using project-based learning. Agasi & Rudhito's (2014) study focused on the problem solving
abilities of eighth graders. Cahyati and Kriswandani (2017) examined students' understanding of mathematical
concepts in solving TRMS problems. Just as Witri, Putra & Gustina (2014) demonstrated, students'
mathematical abilities were also measured by TIMSS.

Utomo & Syarifah
542
The study has found a correlation between mathematics representation and learning models. In the type of
representation, we selected TIMSS mathematical problems and asked students to address problems in a
problem-oriented way. Students' process of representation may inform the teachers about the forms and
processes of representations used by students to solve TIMSS problems, which might be used by the teachers to
prepare TIMSS problems. Representation develops the understanding of students but also serves as a
communication tool for the teachers. Teachers should witness their pupils' understanding of the material they
have studied.
Research Question
The question we were trying to answer is described as: "What is the mathematical representation process carried
out by students of Junior High School with high, medium and low ability in solving TIMSS issues?"
Literature Review
Mathematical Representation
It is another means to understand the importance of law (Asmara, 2014; NCTM, 2014). Modelling mathematics
helps students grasp the meaning of mathematical concepts better. Some forms of mathematical representation
are diagrams, pictures, numbers, graphics, symbols, tables, expressions, and mathematical notations (Rahmawati
et al., 2017; Yudhanegara & Lestari, 2015). Representation is more than a method used as a way to learn and
teach mathematics, according to Antonio Soares et al. (2016), but it also important factor for students to
understand mathematical knowledge and skill, and a criterion for teachers to evaluate their students’
mathematics abilities and performance. The teachers may also instruct their students to use forms of analogy,
visual images, or other representations to clarify mathematical ideas (Fennell & Rowan, 2015). In different
ways, mathematical concepts can be interpreted. Mathematical representations create the basis of how one can
perceive and apply their ideas. Representation aids students in illustrating maths or concepts (Minarni &
Napitupulu, 2017).
NCTM (2014) expresses that: a) A process of representation involves the translations of problems or ideas into
new forms in which the translation involves the use of diagrams or physical models into symbols and phrases
that represent the ideas. b) A process of representation also includes changes of diagrams or physical models
into words and phrases that represent the ideas. And c) The process of representation may also be used by
translators as a vehicle to analyze verbal problems and make their meanings clear. In Fadillah (2011) and
Budiharso & Tarman (2020), there are two reasons why representation is required. Firstly, fluency in translating
between different representations is the fundamental skill of students to grow, which will have a significant
impact on students learning mathematics. Secondly, students should be prepared to develop their own
representation in order to have good skill and understanding and versatile ideas that can be used to solve
problems.
Goldin and Koput (1996) say that representation is either indirect or direct. Internal representation is an integral

International Journal of Education in Mathematics, Science, and Technology (IJEMST)
543
part of the development of the architecture of algebraic thoughts (Minarni & Napitupulu, 2017; Pape &
Tchoshanov, 2001; Solikhah & Budiharso, 2020). Another example that mathematical concepts require internal
(mental) representation to refer to Configurations in internal representation can not be observed directly.
External representation is one's interior reflection or one's visual system (Debrenti, 2013; Goldin & Kaput,
1996; Minarni & Napitupulu, 2017; Pape & Tchoshanov, 2001; Solikhah & Budiharso, 2019). The degree to
which students' ideas are expressed into verbal, visual, and symbolic forms is a representation of the solutions
students find to problems they encounter.
Indicator of Mathematical Representation
In 2000, the National Council of Teachers of Mathematics (NCTM) said that mathematics programs in
preschool to college-level students should allow students to develop and use representation to organize,
document and communicate mathematical ideas. They should identify, choose, and apply a mathematical
representation, to solve a problem, and use representation to model and interpret physical, social and computer
concepts. Elsewhere, Suryana (2012) tells us that the following mathematical representation should be used.
Indicators of visual representation include the representation of diagrams, graphics, or tables to aid problem
solving, and the use of visual representation to make things clearer. Indicators of symbolic representation
consist of making equations or mathematical models from other kinds of representation; making statements or
conjectures from numeric representations; including mathematical expressions in solving problems. The
indicators of verbal representation comprise of making questions based on data or representations; and
answering problems with verbal representation.
The research will be classified as visual, mathematical and verbal (words or written texts). Table 1 shows
mathematically represent the objective of his research.
Table 1. Mathematical Representation Indicator
Representation Indicator
Visual Representation Students present problems into the forms of pictures to solve them.
Symbolic Representation Students use mathematical expressions using symbols or numbers
to solve problems.
Verbal Representation Students write interpretations of problems presented.
Solutions of TIMSS Problems
TIMSS does a study of math and science high school graduates (Mullis et al., 2016). TIMSS is like international
test which is made by the International Association for the Evaluation of Educational Achievement (IEEA).
Integrated Environmental Assessment is a certain organization that takes care of global environmental issues.
NRC was established in 1958 (Mullis & Martin, 2013). In TIMSS studies of mathematics and science, they are
divided into two domains: contents and cognitive (Mullis et al., 2013, 2008, 2004, 2000). Mathematics has four
subjects: number, algebra, geometry and opportunity. The number domain contains all integer numbers, even

Utomo & Syarifah
544
numbers, fraction numbers, ratios, decimal numbers, percentages and proportions. Algebra is concerned with
equations and inequalities, algebraic operations and expressions and/or relations and functions. Geometry
measurements, forms, and positions and transfers are part of geometry content. Besides, LUCC will cover
interpreting data, data characteristics and opportunities.
TIMSS problems, which are an international level that measure student success in the field of mathematics and
science of all over the worlds, are used to determine student's ability. Solutions to the problems in this report can
be described as a lengthy process of chasing the largest possible understanding, afterwards working on
possible/important planning, followed by a long process of implementation and then short reviews on results
(NCTM, 2014). One way to look at this question is to think of a hypothetical situation like someone who
understands a problem if they can know what is known and asked by the problem. After everyone has already
discussed the solution to the problem and everyone has agreed on the approach to taking, then it can be called
the stage of planning. At the start of a project, a student might think of a method to use or method concept
(concept of a way to do something) that has been thought before such as, "I'll choose the stone method." At the
stage of reviewing, a student retests the result of the answer she/he has got and observes the steps used in
solving it.
Methods
Design
A case study design and qualitative methodology were used in this recent study (Yin, 2003). A case study was
chosen because it focuses on a small group of students and allows for in-depth examination of a specific case. A
descriptive qualitative analysis is a survey or study that focuses on identifying, exploring, assessing, and
observing the subject's situation based on the available information. The aim of this recent study was to see how
students performed during the teaching process in terms of mathematical representation. The argument for this
analysis was compelling because the researchers were able to delve deeper into the phenomena rather than
merely generalizing results (Yin, 2009). A case may be interesting because of its unique characteristics or
because it is mundane. This study used qualitative methods to explain themes based on evidence identified by
the researchers in terms, phrases, sentences, and paragraphs (Cresswell & Miller, 2000).
Participants
Participants in this study were 6 (six) students in the 4F class of Muhammadiyah School in the Dau Subdistrict,
Malang Regency, East Java Province. They had average, medium, and low IQ, or they had above average to
subpar, intelligence for their age. The participants of the study were picked from a group of middle schoolers in
an equal amount of math classes. We decided to use the sampling approach, in which we used an act of
convenience to include six participants (e.g., Creswell & Miller, 2000). There are preferred here. It turned out
that optimizing the efficiency of searching for emerging themes and evaluating their relative importance
according to contextual conditions provided an/do better answers (Erlandson et al. 1993, p. 82). The team of
researchers was worried that the participants they could not represent the middle school mathematics teachers in

International Journal of Education in Mathematics, Science, and Technology (IJEMST)
545
the district well by himself and him only serving as examples. We defined the participants in groups of the first,
second, third, fourth, and fifth in this instance. The participants in this experiment were T5 and T6 girls.
Data Collection Technique
With the use of various approaches, this qualitative analysis focused on numerous sources of evidence in pursuit
of convergence and corroboration (Yin, 1994). This research examined data derived from data gathering and
instructional techniques. Several students with a portion of their video lessons recorded, and all of their lesson
plans were made available to the principals, as well (Co-PIs). One of the PI's obligations was asking for access
to data (in this case, the video lessons and lesson plans) to be made available (so, these could be used) This
study relied on a total of 10 videos of 6 students, of the highest quality, and every video was recorded by 6
different students.
Video observations were our primary data source because videos allowed us to pause and rewind for extensive
analyses of lessons. The tests were taken, and the answers provided, the results were analyzed, and the questions
were asked. Based on the national curriculum, the tests in this study were tweaked. specially from the content on
the previous version of the program of the Program for International Student Assessment (PISA) Tasks such as
these are used to obtain a representation of students' mathematical understanding. Lecturer of math: The
problems for the experiment were discovered through experience in the course before data collection began. For
a better understanding of the process of using mathematics in TIMSS problems, we conducted interviews. They
also recorded everything that was said and will be incorporated into future discussions. In a series of interviews
between students and teachers, the questions were based on the answers provided by the students.
Observation
As far as research is concerned, gathering information and observations is concerned; this is the major factor
(Merriam & Tisdell, 2016). The use of filmed examples of the mathematics lessons was a key to the success of
this study, for those were viewed as significant variables. The two videos that were recorded verbatim by the
study's first author were observed and filmed verbiage was used for the transcripts. it was estimated that the
duration of each video was between 45 and 50 minutes
Documents
Artifacts such as bone and antlers provided the second possible study data. The university professors recorded
their lessons and uploaded and shared the information about lesson plans and other teaching materials with the
students who took part in the video. Examination of all related documents (e.g., lesson plan, handouts) during
the data analysis was performed to guarantee the research object's credibility. Students spend their time
investigating the environment (investigating the classroom), the people who teach there (specifically) and what
they are investigating (specifically), and that which aspect is being examined (intently) (Merriam & Tisdell,
2016). Students received lesson plans and handouts to aid them in their understanding of the various objectives

Utomo & Syarifah
546
of the class as well as narrative information about what the teacher was hoping to accomplish during class time.
Artifacts developed by these teachers were of their own volition and were not made to satisfy test design
requirements. Artifacts, however, were invaluable for triangulation of data.
Field Notes
Each video observation was documented with field notes, which included a general overview of the lesson (e.g.,
the instructor spent 5 minutes on engagement) as well as reflective notes detailing the researchers' viewpoints
and observations of the lesson (e.g., teacher spent more time in phase of exploration). in their classrooms. True,
though all of the information had been gathered from a videotape of the lesson, there were still some additional
details that could not be found out by looking at the clips.
Technique of Data Analysis
As descriptive as possible, qualitative data on subjects' observations and/commentaries were used in this
study, this research utilized subjects' creative observations and commentary. When the quantitative data
has been first obtained, it is sifted through numerous examples to arrive at the final answer. The collective
efforts of everyone on the team dramatically reduced the available data. The skat effect is where, after each
three points is made, one roll of the dice is followed by two consecutive points in the direction of bank,
which is ideal in this case, followed by three points in the opposite direction to the bank (and results in a
new points being added in bank) as long as the pattern holds. This research was done by showing the
results of the interviews and experiments as well as the results in a written format. The last stage of the
TIMSS mathematical representations occurs following the completion of the student mathematical student
responses and interviews.
Finally, the researchers advised that students complete a sequence of tasks that include interacting with a new
concept, doing more practice, and examining progress in a new environment, or environment. Data analysis
looked at this pattern. to ensure the credibility of the data The researcher recorded and edited each video using
the 5E coding rubric During the rubric grading process, each lesson received a score of 1 (present) or 0 (absent).
each lesson earned an overall grade, which was equal to the total of the numbers of their descriptor scores
However, video-recorded evidence demonstrated why each descriptor's score was correct. a carefully selected
and random-sampled video lessons were pre-coded to control for observer inference while maintaining semantic
precision to determine inter-reliability.
Results
Process of Representation Made by the Student with High Ability
The student with high ability in the process of representation and communication is ST (the abbreviation of the
name of the student studied). The researcher conducted an in-depth analysis of the topic, introducing contrasting
arguments to satisfy the need for scientific representation.

International Journal of Education in Mathematics, Science, and Technology (IJEMST)
547
Based on the student's preceding work done in Picture 1, the student undertook the process of visual
representation of this problem on the basis of a straight line provided by ert and positioning at the point B with
the distances so that the sign is that ert the midpoint A is between the point A and B, with the distance of the
midpoint B is between B and C. This shows that the student was able to visualize a picture and therefore solve
the math problem given.
Picture 1. Process of ST’s Visual Representation
The student's interpretations about the interview during the semester are as follows: The student views those
materials as representation of a problem solving tools. In the above interview, ST reports about that he has many
symptoms.
P : “What do you know about this problem?”
ST : “There is a line k with points of and the distance between the point A the
point B is and the distance the point to the point is ”
P : “Can you understand the question of the problem?”
ST : “Yes mam, I can, here it is instructed to look for the midpoint between the
points and “
P : “What did you do after understanding the problem?”
ST : “I drew the line, mam.”
P : “Why did you draw the line first before solving this problem?”
ST : “Because by drawing the line it is easier to solve the roblem given especially in
putting the points in the line”.
The symbolic representation made by ST is given in Picture 2.
Picture 2. Process of ST’s Symbolic Representation
In Picture 2, the student undertook symbolic representation, at the stage of solving the problem, by writing a
symbol for the unit of length in the straight line with the distance between the point to the point of then that
visual
Representation
Symbolic
Representation

Utomo & Syarifah
548
from the point to the point of and writing the symbol for the name of the line with. ST also wrote the symbols
for the distance between two points and, and, and the change of units from to, to, and from to. The cause of the
writing of symbols was that he was used to writing symbols at the process of solving problems and he
understood the symbol he wrote.
Then, the process of the verbal representation conducted by ST is given in Picture 3.
Picture 3. Process of ST’s Verbal Representation
At the stage of writing a statement in finding the distance between the midpoint O and O as shown in Figure 3.
Furthermore, ST also wrote the final result of his research. This is supported by the statement ST wrote in order
to clarify what he/she had done in order to solve the problem. The following is ST's results from the interview.
P : “What did you write the statement about the distance between the midpoint
and in the process of the solution to the problem?”
ST : “To make it more clearly mam if I found the distance between the midpoint
and in line with the question given in the problem”
Process of the Representation in the Student with Medium Ability
The subject with an average of medium ability in the process of representation is Susan. See the group of things,
not made by hand, which produce a variety of relations. The process of visual representation used by SS to solve
the problem is made by making a straight line and determining the points where the point is located between the
points and as shown in Picture 4.
Picture 4. Process of SS’s Visual Representation
In the figure, SS determined the distance between the point A to B and between the point A and B by measuring
the distance from the point A to B, then he decided which midpoint would be between the points A and B, and
determined that the point between A and B should be the midpoint. The midpoint of the points is intended to
know the position of the point asked in the problem. In SS's visualization, A shows how to solve the problem.
This information is derived from the interview. Interview with SS is aimed to get information from the answer
to the written questions.
P : “Why did you draw the line?”
Verbal
Representation
Visual
Representation

International Journal of Education in Mathematics, Science, and Technology (IJEMST)
549
SS : “To help me do the problem, mam.”
P : “Do you always draw first before doing a problem?”
SS : “Yes mam, because by drawing, I understand what is the form like”
P : “Do you know how to draw a straight line?”
SS : “Yes mam, like my picture”
The process of symbolic representation conducted by SS is given in Picture 5.
Picture 5. Process of SS’s Symbolic Representation
It was made by Jean Benac when he understood the problem, and drawing a straight line when he solved the
problem. When he wrote out the symbols he understood the problem in terms of a line with a unit of length. The
symbol for the point A of the line (k) was drawn near the straight line (k). The post, which is centered at point
B, was written with the symbol for the point overhead, and the symbol for the length of the object between the
point B and the C as showing. In the response, SS wanted to symbolize the length and unit of the line segment in
terms of another unit and for the question/problem, he used another symbol and he would need to surround the
other symbols. The spelling of the symbol for the unit of length could be seen in the distance between the
midpoint of and where he merely wrote as shown in Picture 4.5. There is a need to have a "x" in the middle of
the results in the interview because the writer thinks it is not necessary.
The process of the verbal representation made by SS is given in Picture 6.
Picture 6. Process of SS’s Verbal Representation
Based on Figure 6, SS wrote a question about the location of P(2,2), and then he constructed a conclusion in the
form of a statement about the value of the distance between P(2,2) and Q(2,2). The interview with SS revealed
that he wrote a conclusion to explain the end result of all the processes used in solving the problem.
Process of Representation Made by the Student with Low Ability
The significant topic of the student's work in the process of creating the portrait is SR. The blink of an eye in
Symbolic
Representation
Verbal
Representation
Utomo & Syarifah
550
time represents the process of representation. Picture 7 shows that SR's plan worked because he drew a straight
line k and determined the location of the points namely the point B between the point A and the point C. It can
be seen that the distance between point A and point B is farther than the distance between point B and point C,
therefore the answer is yes. From results of the interview, SR determined that is longer than; therefore, is higher
in decimal numbers.
Picture 7. Process of SR’s Visual Representation
The results of the interview are reinforced by the answer. The interview with SR is below.
P : “Why did you draw the line ?”
SR : “To make easy to determine the positions of the points mam”
P : “Does the distance between the point A and the point B is equivalent with the
distance between the point B and the point A?”
SR : “Different, mam”
P : “Which one is longer, the distance from the point A to the point B or the point
B to the point C?”
SR : “The distance from the point B to the point C”
P : “Why is the distance between the point A and the point B is shorter than that of
the point B to the point C?”
SR : “Because is smaller than ”
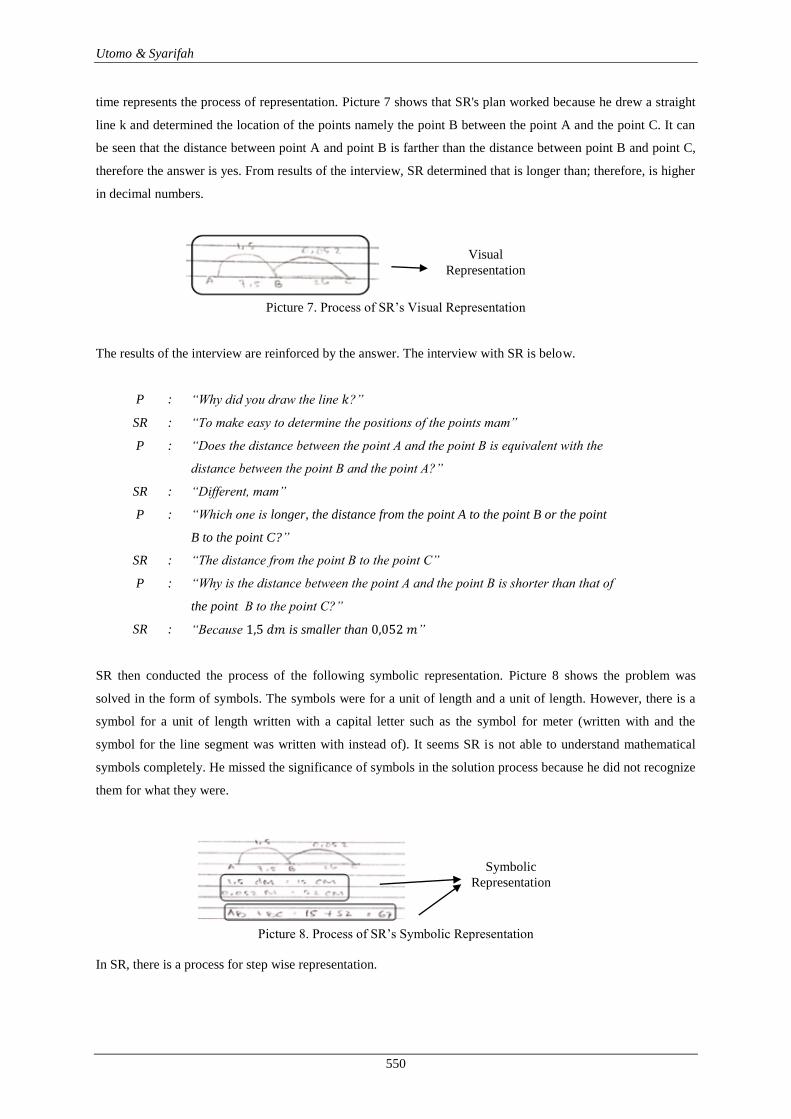
SR then conducted the process of the following symbolic representation. Picture 8 shows the problem was
solved in the form of symbols. The symbols were for a unit of length and a unit of length. However, there is a
symbol for a unit of length written with a capital letter such as the symbol for meter (written with and the
symbol for the line segment was written with instead of). It seems SR is not able to understand mathematical
symbols completely. He missed the significance of symbols in the solution process because he did not recognize
them for what they were.
Picture 8. Process of SR’s Symbolic Representation
In SR, there is a process for step wise representation.
Visual
Representation
Symbolic
Representation

International Journal of Education in Mathematics, Science, and Technology (IJEMST)
551
Picture 9. Process of SR’s Verbal Representation
In picture 9, SR did the verbal processing which was to understand the problem, rewriting the problem, and
generating what is asked. SR wrote about his conclusion regarding the result of his work. In order to clarify the
cause of the illness, the patient informed the doctor about her family background. This response came from a
male participant whom I had interviewed.
P : “Why did you rewrite the problem and the question of the problem?”
SS : “I don’t know, mam”
P : “Why did you write a conclusion in the form of a statement “the distance
between the midpoint is ?”
SS : “To make the teacher if the result I obtained is ”
Students of the TIMS student can represent themselves, however they are not in control of solving the EPT
problems themselves. Instead, teachers and staff can devise a method for solving a particular thing in particular
ways.
Table 2. Process of Students’ Representation Based on Ability
Representation
Ability
Visual Symbolic Verbal
High Presenting a picture
at planning the
problem solving.
Writing a symbol
completely at the stage
of problem solving.
Writing a conclusion
from the result of the
calculation obtained.
Medium Presenting a picture
at planning the
problem.
Writing a symbol
when understanding
the problem and
solving the problem.
Writing a question at
understanding the
problem and writing a
conclusion from the
result of the
calculation obtained.
Low Presenting a picture
at planning the
problem solving.
Writing a symbol at
the problem solving.
Rewriting the problem
and question of
understanding the
problem.
Symbolic
Representation

Utomo & Syarifah
552
Discussion
Our findings show that the students' mathematics abilities demonstrated in this study are high, medium, and low
performances in solving the TIMSS problems. Students with high intellect do visual representation in their
heads. According to Arcavi (2003), visualization makes an important part in constructing mind, understanding
and concretize abstracts thoughts to solve math problems. At the end of the class, students are making symbolic
representation by writing a complete symbolic representation showing the solution to the problems as a process
of verbal representation. According to Mahardiningrum and Ratu (2018), the students with high abilities in
mathematics may be able to propose their ideas well for solving problems.
In the process of there being helpful questions given by the students with a medium level of ability, then they
would represent and solve problems by writing symbols as a symbolic representation process. On the down side,
their writing of symbols is missing of completeness. Students who are good readers may be influenced to be
more proficient in the way they interpret TIMSS issues are created as a comparison of the outcomes of the
students' responses and interviews, and analyze textual material. Students are asked what is wrong with a
specific situation and they would have to make a conclusion by using example sentences from the problem.
Before actually solving the problem, they try to visualize each piece of the puzzle so that each fits into the
whole.
Students with low ability might act out the process of solving the problem by writing symbols such as math
symbols and sentence symbols on the board. When students are doing their homework, they often make a visual
representation by visualizing a picture. We need to work on keeping students' visual skills intact so they can
produce good visualization (Bal, 2014). As they were asked to take a problem and rewrite it as an embodiment
of their understanding, they can substantially increase their problem-solving crafts. Those students who have
difficulty in making representation, or can't represent a number of different values, will experience difficulty in
solving difficult problems since representation is one of the things that is necessary in solving problems
(Aryanti, Zubaidah & Nursangaji, 2013; Montague, 2004).
Conclusion
As a result of the TIMSS testing, it has been determined that students' ability to perform in class is greatly
improved, and along with this the use of laptops, smartboards, and e-notebooks is also said to greatly improve
student's performance in class. When exemplifying a visual representation task, students of varying ability
needed to use their strengths, while students with low ability used their weaknesses, and students with high
ability used their strengths to solve the problem. Processing is completed at two separate points: once at the
level of comprehension, and once at the problem solving stage. Students with high and low skills are
automatically identified at the stage of comprehension during the symbolic representation process, while
students with intermediate skills perform the symbolic representation process at the solving stage. First, when
they are reading the problems themselves as well as reading the answers and questions, the answers are
presented in the form of these final written products. Second, when students read the problems, questions, and

International Journal of Education in Mathematics, Science, and Technology (IJEMST)
553
answers, they easily learn to convert these into verbal speech by themselves and make conclusions with the help
of this process. When people's utterances are transformed into written characters by them and read by others,
they can easily understand these. This method has the most advantage for learning to understand the problems
and the answers to them, but it is difficult for people with low ability of verbal expression, who have reading
problems that make it difficult for them to understand the written characters and write the answers or write
questions.
References
Agasi, G. R., & Rudhito, M. A. (2014). Kemampuan Siswa Kelas VIII dalam Menyelesaikan Soal-Soal TIMSS
Tipe Penalaran. Prosiding Seminar Nasional Sains Dan Pendidikan Sains IX, 5(1), 879–888.
Arcavi, A. (2003). The role of visual representation in the learning of mathematics . Educational Studies in
Mathematics. Proceedings of the XXI Conference on the Psychology of Mathematics Education, North
American Chapter, Mexico, 52(3), 215–241. https://doi.org/10.1023/A
Armadan, Somakin, & Indrayanti. (2017). Kemampuan Representasi Matematis Siswa Pada Pembelajaran
Berbasis Teori Van Hiele di Materi Segiempat Kelas VII SMP Negeri 1 Indralaya Utara. Jurnal Elemen,
3(1), 49–57.
Aryanti, D., Zubaidah, & Nursangaji, A. (2013). Kemampuan Representasi Matematis Menurut Tingkat
Kemampuan Siswa Pada Materi Segi Empat dI SMP. Jurnal Pendidikan Dan Pembelajaran, 2(1), 1–8.
Asmara, A. (2014). Mathematical Representation Ability and Self Confidence Students Through Realistic
Mathematics Approach. In International Seminar on Innovationin Mathematics and Mathematics
Education (pp. 137–144).
Bal, A. P. (2014). The Examination of Representation used by Classroom Teacher Candidates in Solving
Mathematical Problems. Educational Science: Theory and Practice, 14(6), 1–17.
https://doi.org/10.12738/estp.2014.6.2189
Budiharso, T. & Tarman, B. (2020). Improving Quality Education through Better Working Conditions of
AcademicInstitutes, Journal of Ethnic and Cultural Studies, 7(1), 99-115.
http://dx.doi.org/10.29333/ejecs/306
Cahyati, A. M. D., & Kriswandani. (2017). Lapisan Pemahaman Konsep Matematika dalam Menyelesaikan
Soal TIMSS Bagi Siswa SMP kelas VIII. Jurnal Inovasi Pendidikan dan Pembelajaran Matematika,
3(2), 83–97.
Creswell, J. W., & Miller, D. L. (2000). Determining validity in qualitative inquiry. Theory into Practice, 39(3),
124–131.
Debrenti, E. (2013). Representation in Primary Mathematics Teaching. Acta Didactica Napocensia, 6(3), 55–64.
Dündar, S. (2015). Mathematics Teacher- Candidates’ Performance in Solving Problems with Different
Representation Styles: The Trigonometry Example. Eurasia Journal of Mathematics, Science and
Technology Education, 11(6), 1363–1378. https://doi.org/10.12973/eurasia.2015.1396a.
Ebersole, M. & Kanahele-Mossman, H. (2020). Broadening understandings of the cultural value of aloha in a
teacher education program. Journal of Culture and Values in Education (JCVE), 3(2), 81-99.
doi.org/10.46303/jcve.2020.14.

Utomo & Syarifah
554
Erlandson, D. A., Harris, E. L., Skipper, B. L., & Allen, S. D. (1993). Doing naturalistic inquiry: A guide to
methods. SAGE.
Fadillah, S. (2011). Meningkatkan Kemampuan Representasi Multipel Matematika Siswa SMP Melalui
Pembelajaran Dengan Pendekatan Open Ended. Jurnal Pendidikan Matematika, 2(2), 100–107.
Fennell, F. S., & Rowan, T. (2015). Principles and Standards: Representation An Important Process for
Teaching and Learning Mathematics. In Teaching Children Mathematics (pp. 288–292).
Goldin, G., & Kaput, J. (1996). A Joint Perspective on the Idea of Representation in Learning and Doing
Mathematics. Theories of Mathematical Learning, 1(9), 397–430.
Hudiono. (2005). Peran Pembelajaran Diskursus Multi Representasi terhadap Pengembangan Kemampuan
Matematik dan Daya Representasi pada Siswa SLTP. Universitas Pendidikan Indonesia.
Madrid, M. J., Maz-machado, A., & León-mantero, C. (2015). Representation in the Sixteenth-Century
Arithmetic Books. Universal Journal of Educational Research, 3(6), 396–401.
https://doi.org/10.13189/ujer.2015.030607
Mahardiningrum, A. S., & Ratu, N. (2018). Profil Pemecahan Masalah Matematika Siswa SMP Pangudi Luhur
Salatiga Ditinjaudari Berpikir Kritis. Jurnal Mosharafa, 7(1), 75–84.
Merriam, S. B., & Tisdell, E. J. (2016). Qualitative research: A guide to design and implementation (4th ed.).
Jossey-Bass.
Minarni, A., & Napitupulu, E. E. (2017). Developing Instruction Materials Based on Joyful PBL to Improve
Students Mathematical Representation Ability. International Education Studies, 10(9), 23.
https://doi.org/10.5539/ies.v10n9p23
Montague, M. (2004). Math Problem Solving for Middle School Students with Disabilities. American Institutes
for Research, 1(7), 1–13.
Mufidah, S., & Wijaya, A. (2017). Pengembangan Kemampuan Berpikir Tingkat Tinggi Siswa Melalui
Pembelajaran Matematika Realistik. Seminar Matematika Dan Pendidikan Matematika UNY, 675–680.
Mullis, I. V. ., Martin, M. O., & Foy, P. (2008). TIMSS 2007 International Mathematics Report.
Mullis, I. V. ., Martin, M. O., Gonzalez, E. J., & Chrostowski, S. J. (2004). TIMSS 2003 International
Mathematics Report.
Mullis, I. V. ., Martin, M. O., Gonzalez, E. J., Connor, K. M. ., & Chrostowski, S. J. (2000). TIMSS 1999
International Mathematics Report.
Mullis, I. V. S., & Martin, M. O. (2013). TIMSS 2015 Evaluation Framework. Retrieved from
http://search.ebscohost.com/login.aspx?direct=true&db=eric&AN=ED545250&site=ehost-live
Mullis, I. V. S., Martin, M. O., Foy, P., & Arora, A. (2012). TIMSS 2011 International Results in Mathematics.
Mullis, I. V. S., Martin, M. O., Foy, P., & Martin, H. (2016). The TIMSS 2015 International Results in
Mathematics. https://doi.org/10.1002/yd.20038
Munalikatasari, A. D., & Rosyidi, H. A. (2016). Representasi Siswa SMP dalam Memecahkan Masalah
Matematika Berdasarkan Kemampuan Matematika. Jurnal Ilmiah Pendidikan Matematika, 3(5), 112–
121.
NCTM. (2000). Priciples and Standars for School Mathematics. (K. Beall, Ed.). United States of America:
Library of Congress Cataloguing-in-Publication Data.
Neria, D., & Amit, M. (2004). Students Preference of Non-Algebraic Representation in Mathematical

International Journal of Education in Mathematics, Science, and Technology (IJEMST)
555
Communication. Proceedings of the 28th Conference of the International Group for the Psychology of
Mathematics Education, 3, 409–416.
Pape, S. J., & Tchoshanov, M. A. (2001). Learing toTeach Mathematics: Focus on Student Thinking. Theory
into Practice, 40(2), 102–109. https://doi.org/10.1207/s15430421tip4002
Polat, S. (2020). Multidimensional analysis of the teaching process of the critical thinking skills. Research in
Social Sciences and Technology (RESSAT), 5(2), 134-157. doi.org/10.46303/ressat.05.02.8
Rahmawati, D., Purwanto, Subanji, Hidayanto, E., & Anwar, R. B. (2017). Process of Mathematical
Representation Translation from Verbal into Graphic. IEJME-Mathematics Education, 12(4), 367–381.
Rangkuti, N. A. (2014). Representasi Matematis. Forum Paedagogik, 6(1), 110–127
Soal TIMSS 2011. https://erikvalentinomath.files.wordpress.com/2015/04/timss2011_g8_math.pdf
Solikhah, I. & Budiharso, T.. (2020). Exploring Cultural Inclusion in the Curriculum and Practices for Teaching
Bahasa Indonesia to Speakers of Other Languages. JSSER: Journal of Social Studies Education
Research, 11(3), 177-197. www.jsser.org.
Solikhah, I. & Budiharso, T. (2019). Investigating the Learning Outcomes of an INQF Based English Language
Teaching Curriculum in Indonesia. JSSER: Journal of Social Studies Education Research, 10(4), 153-
175. www.jsser.org.
Supandi, Waluya, B. S., & Rochmad. (2016). Analysis Of Mathematical Representation By React Strategy On
The Realistic Mathematics Education. In Anatolian Journal of Education (pp. 1–13).
Suryana, A. (2012). Kemampuan Berpikir Matematis Tingkat Lanjut (Advanced Mathematical Thinking) dalam
Matematika Kuliah Statistika Matematika 1. In Seminar Nasional Matematika dan Pendidikan
Matematika (pp. 1–12).
Sukayasa. (2014). Karakteristik Penalaran Siswa SMP dalam Memecahkan Masalah Geometri Dtinjau dari
Perbedaan Gender. Jurnal Pendidikan Matematika, 3(1), 81–90.
Skoumios, M. & Skoumpourdi, C. (2021). The use of outside educational materials in mathematics and
science: Teachers’ conceptions. International Journal of Education in Mathematics, Science, and
Technology (IJEMST), 9(2), 314-331. https://doi.org/10.46328/ijemst.1150
Tripathi, N. P. (2008). Developing Mathematical Understanding through Multiple Representation. Mathematics
Teaching in the MIiddle School, 13(8), 438–445. https://doi.org/10.1037/034585
Utomo, D. P. (2021). An analysis of the statistical literacy of middle school students in solving TIMSS
problems. International Journal of Education in Mathematics, Science, and Technology (IJEMST), 9(2),
181-197. https://doi.org/10.46328/ijemst.1552
Widakdo, W. A. (2017). Mathematical Representation Ability by Using Project Based Learning on the Topic of
Statistics. In International Conference on Mathematics and Science Education (ICMScE) (pp. 1–7).
Witri, G., Putra, Z. H., & Gustina, N. (2014). Analisis Kemampuan Siswa Sekolah Dasar Dalam Menyelesaikan
Soal-Soal Matematika Model the Trends For International Mathematics and Science Study (TIMSS) di
Pekanbaru. Jurnal Primary Program Studi Pendidikan Guru Sekolah Dasar, 3(April), 32–39.
Yin, R. K. (2003). Case study research, design and methods (3rd ed.). London: SAGE.
Yin, R. K. (1994). Case study research: Design and methods (2nd ed.). London: SAGE.
Yin, R. K. (2009). Doing case study research (4th ed.). SAGE.
Yudhanegara, M. R., & Lestari, K. E. (2015). Meningkatkan Kemampuan Representasi Beragam Matematis

Utomo & Syarifah
556
Siswa Melalui Pembelajaran Berbasis Masalah Terbuka. Jurnal Ilmiah Sosial, 1(4), 97–106.
Yumiati, & Noviyanti, M. (2017). Analysis of Mathematic Representation Ability of Junior High School
Students in the Implementation of Guided Inquiry Learning. Journal of Mathematics Education, 6(2),
137–148. https://doi.org/10.22460/infinity.v6i2.p137-148
Yuniawatika. (2011). Penerapan Pembelajaran Matematika dengan Strategi REACT untuk Meningkatkan
Kemampuan Koneksi dan Representasi Matematik Siswa Sekolah Dasar. Jurnal Ilmu Pendidikan, (2),
107–120. https://doi.org/http://dx.doi.org/10.17509/eh.v4i2.2830
Yuniawatika. (2015). Upaya Meningkatkan Kemampuan Menulis Matematis Siswa dalam Pembelajaran
Matematika. In L. Wahyuni, U. Salamah, & P. Wiyanto (Eds.), Prosiding Seminar Internasional
Membudayakan Menulis Kelas Dunia untuk Membangun Kualitas Pustaka (pp. 67–72). Malang: Surya
Pena Gemilang.
Zhe, L. (2012). Survey of Primary Students’ Mathematical Representation Status and Study on the Teaching
Model of Mathematical Representation. Journal of Mathematics Education, 5(1), 63–76.
Author Information
Dwi Priyo Utomo
https://orcid.org/0000-0002-9925-7222
Universitas Muhammadiyah Malang
Malang City, East Java
Indonesia
Contact e-mail: [email protected]
Dita Latifatu Syarifah
https://orcid.org/0000-0002-8670-6666
Universitas Muhammadiyah Malang
Malang City, East Java
Indonesia