example 2 - files.transtutors.com€¦ · example 2. framingham analysis project 2 abstract in this...
TRANSCRIPT
Running head: FRAMINGHAM ANALYSIS PROJECT 1
Framingham Analysis Project: Faster Death with Smoking
{Student Name}
COH 602: Biostatistics
Professor Wosu
{Date}
EXAMPLE 2

FRAMINGHAM ANALYSIS PROJECT 2
Abstract
In this analysis I aim to collate statistical facts on cardiovascular disease by examining effects of
smoking on all participants of the Framingham Heart Study and how it affects their level of
blood pressure that could increase their risk of attaining Cardiovascular Disease through their
lifetime. Smokers in this analysis will be compared to non-smokers and both will be analyzed at
death. This project utilizes the “Heart” dataset, which according to Sullivan (2012), is a
longitudinal cohort study that began in 1948 with a cohort enrollment of over five thousand
participants whom were free of cardiovascular disease in the town of Framingham Massachusetts. It
will be used to identify the risk factors for cardiovascular disease such as smoking and blood
pressure.
Commented [KW1]: It is not necessary to write an
abstract.
FRAMINGHAM ANALYSIS PROJECT 3
Framingham Analysis Project: Faster Death with Smoking
Cardiovascular disease (CVD) is a disease of the heart and blood vessels as it restricts the
supply of blood to the brain. They are the number one cause of death globally as more people die
yearly from CVD’s than from any other disease. “An estimated 17.5 million people died from
CVDs in 2012, representing 31% of all global deaths” (WHO, 2014). CVDs are non-
communicable diseases caused by poor lifestyle choices and risk related factors, they can easily
be prevented if these risk factors like heavy tobacco use are addressed. Because these risk factors
are modifiable, it has become a great task and concern for public health prevention management
task force. “The current focus is providing information on the impact of unhealthy lifestyle
choices as risk factors for preventable chronic diseases and encouraging individual responsibility
for one's health” (Koenig, 2014). Education on these risk factors and the need to reduce
consumption of tobacco have aided in the prevention of CVD but a large scale is yet to be done
to prevent tremendous deaths and encourage lifestyle changes that may decrease morbidity.
Analysis introduction
To answer the question on how smoking increases the risk of CVD via increases in
systolic blood pressure, and diastolic blood pressure and weather smokers will die earlier with
cardiovascular disease due to the risk; data from the original Framingham Heart Study Cohort
will be calculated using SAS analysis to run PROC FREQ, PROC MEANS, and PROC
UNIVARIATE to retrieve descriptive and inferential statistics. The data analysis presented will
focus on the represented individuals in this study, their smoking status and the levels of blood
pressure and how it decreases their length of life.

FRAMINGHAM ANALYSIS PROJECT 4
Descriptive Analysis Methods
To produce the total variables based on crude analysis that focuses on the associations
between smoking and cardiovascular disease in the Framingham data set, SAS will be used to
run PROC CONTENTS which is used to view the contents of the data “heart” which is to be
analyzed. The inputted code provides information on the total 5209 observed participants in the
Framingham study and the 17 variables within the data set. To answer the study question, focus
for this study will be on the provided variables on age at death, blood pressure status, cause of
death, and smoking status. To determine the response values of all 5209 observed participants
from the chosen variables, SASHELP.HEART – Framingham Heart Study Data dictionary as
shown below was used to help gather a general response of preferred variables data: Age at
Death (36-93); Smoking Status for each participant categorized as Heavy (16-25), Light (1-5),
Moderate (6-15), Non-smoker, and Very Heavy (>25); Systolic Blood Pressure (82-300);
Diastolic Blood Pressure (50-160).
Data from Framingham Heart Study Data dictionary
Variable Title Variable Label Response Values
AGEATDEATH Age at Death 36-93
SMOKING Number of cigarettes smoked 0-60
SMOKING_STATUS Smoking Status
1 = Heavy (16-25)
2 = Light (1-5)
3 = Moderate (6-15)
4 = Non-smoker
5 = Very Heavy (>25)
DIASTOLIC Diastolic Blood Pressure 50-160
SYSTOLIC Systolic Blood Pressure 82-300
Commented [KW2]: Good job on the tables!
FRAMINGHAM ANALYSIS PROJECT 5
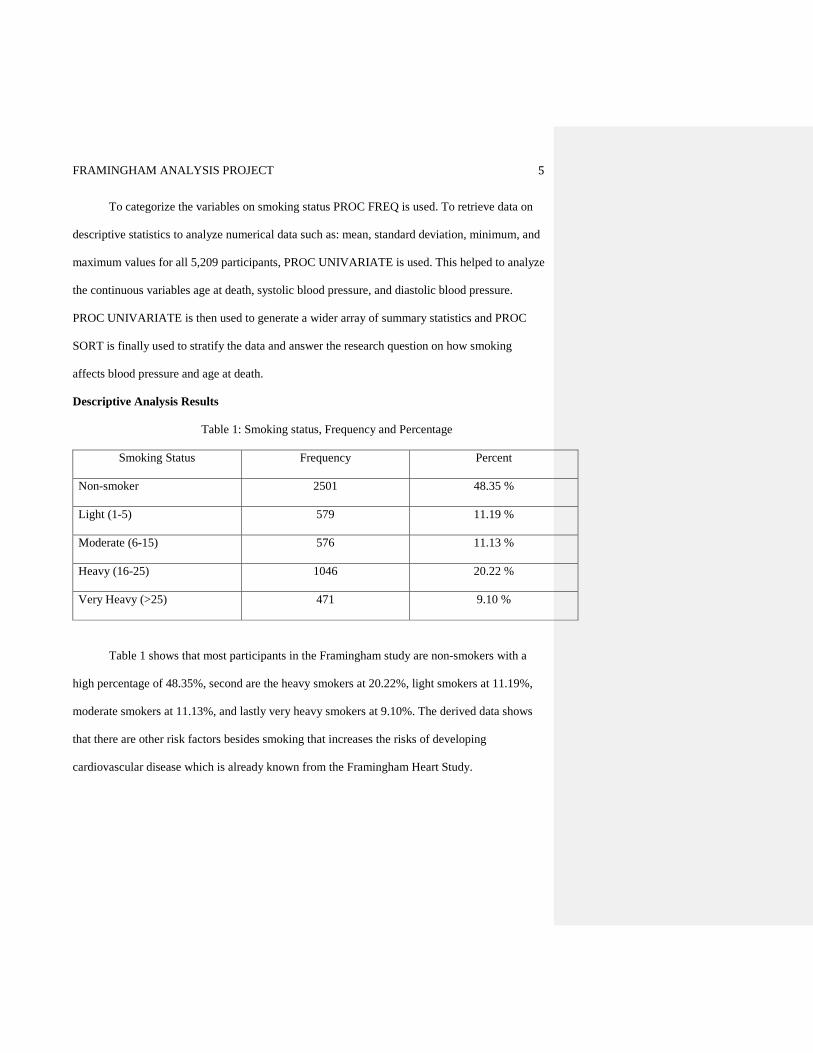
To categorize the variables on smoking status PROC FREQ is used. To retrieve data on
descriptive statistics to analyze numerical data such as: mean, standard deviation, minimum, and
maximum values for all 5,209 participants, PROC UNIVARIATE is used. This helped to analyze
the continuous variables age at death, systolic blood pressure, and diastolic blood pressure.
PROC UNIVARIATE is then used to generate a wider array of summary statistics and PROC
SORT is finally used to stratify the data and answer the research question on how smoking
affects blood pressure and age at death.
Descriptive Analysis Results
Table 1: Smoking status, Frequency and Percentage
Smoking Status Frequency Percent
Non-smoker 2501 48.35 %
Light (1-5) 579 11.19 %
Moderate (6-15) 576 11.13 %
Heavy (16-25) 1046 20.22 %
Very Heavy (>25) 471 9.10 %
Table 1 shows that most participants in the Framingham study are non-smokers with a
high percentage of 48.35%, second are the heavy smokers at 20.22%, light smokers at 11.19%,
moderate smokers at 11.13%, and lastly very heavy smokers at 9.10%. The derived data shows
that there are other risk factors besides smoking that increases the risks of developing
cardiovascular disease which is already known from the Framingham Heart Study.
FRAMINGHAM ANALYSIS PROJECT 6
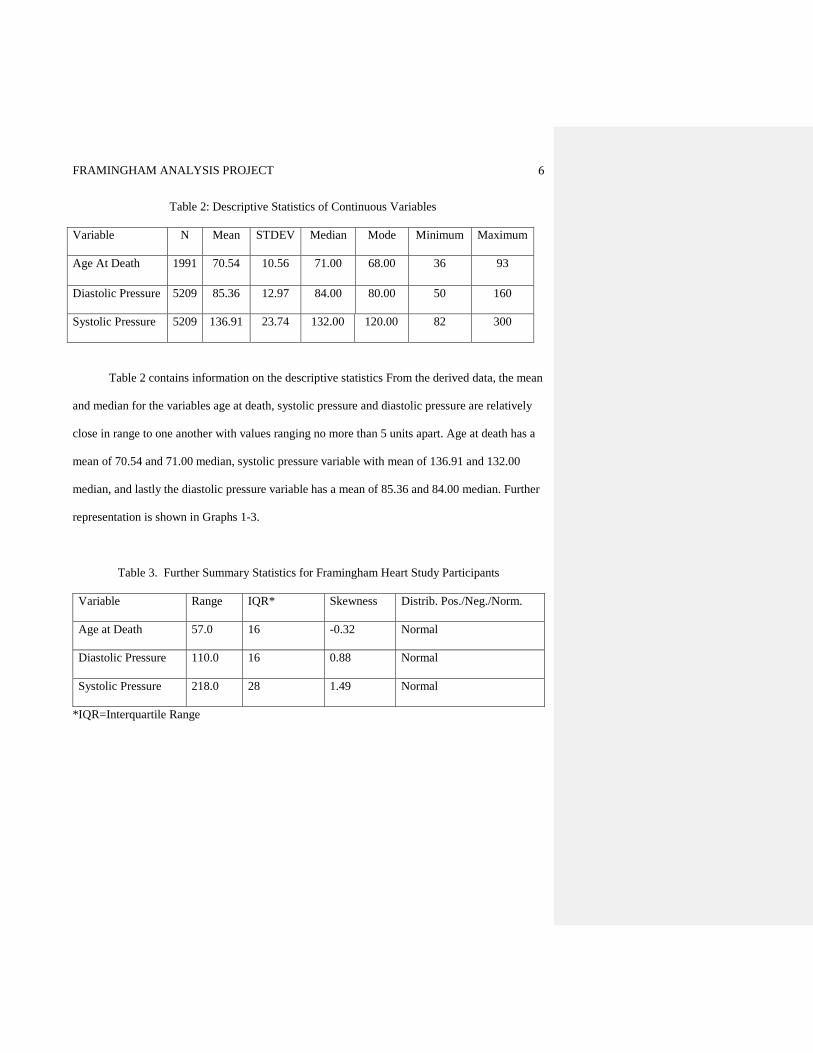
Table 2: Descriptive Statistics of Continuous Variables
Variable N Mean STDEV Median Mode Minimum Maximum
Age At Death 1991 70.54 10.56 71.00 68.00 36 93
Diastolic Pressure 5209 85.36 12.97 84.00 80.00 50 160
Systolic Pressure 5209 136.91 23.74 132.00 120.00 82 300
Table 2 contains information on the descriptive statistics From the derived data, the mean
and median for the variables age at death, systolic pressure and diastolic pressure are relatively
close in range to one another with values ranging no more than 5 units apart. Age at death has a
mean of 70.54 and 71.00 median, systolic pressure variable with mean of 136.91 and 132.00
median, and lastly the diastolic pressure variable has a mean of 85.36 and 84.00 median. Further
representation is shown in Graphs 1-3.
Table 3. Further Summary Statistics for Framingham Heart Study Participants
Variable Range IQR* Skewness Distrib. Pos./Neg./Norm.
Age at Death 57.0 16 -0.32 Normal
Diastolic Pressure 110.0 16 0.88 Normal
Systolic Pressure 218.0 28 1.49 Normal
*IQR=Interquartile Range
FRAMINGHAM ANALYSIS PROJECT 7
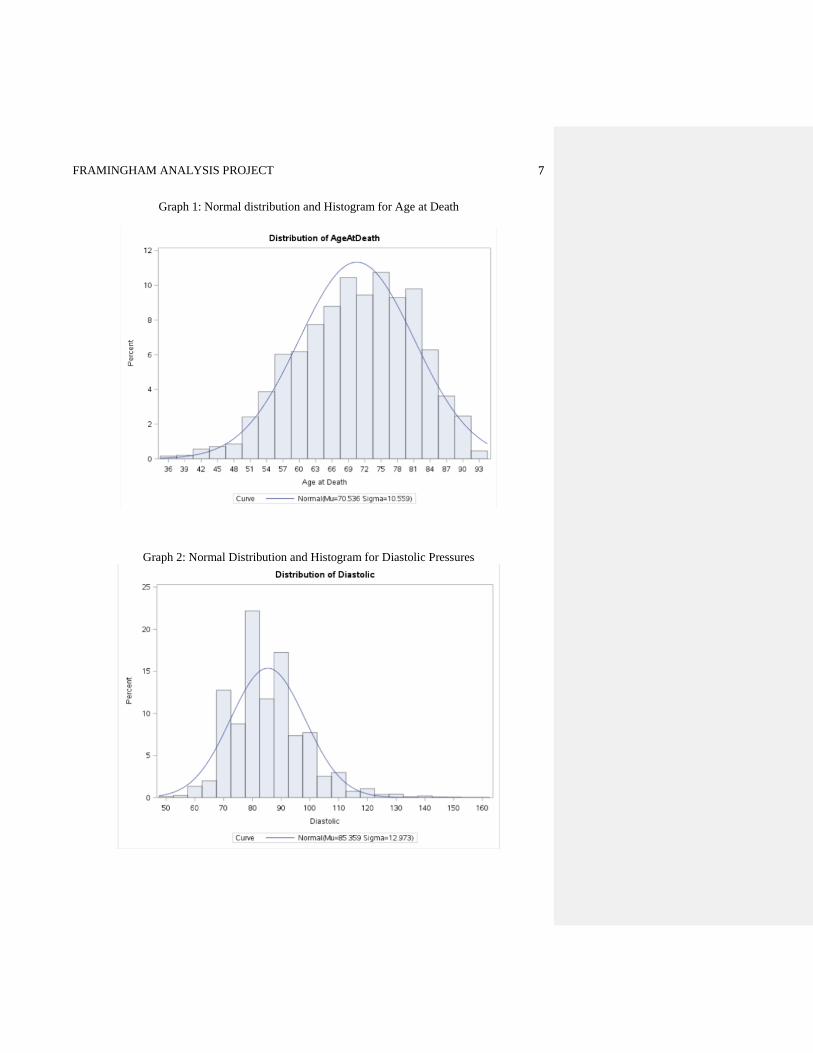
Graph 1: Normal distribution and Histogram for Age at Death
Graph 2: Normal Distribution and Histogram for Diastolic Pressures

FRAMINGHAM ANALYSIS PROJECT 8
Graph 3: Normal Distribution and Histogram for Systolic Pressures
In Graph 1-3 we observe the Skewness and the direction of asymmetry for each distribution.
Table 3 also aids in understanding the graphs skewness and distribution. Although all the graphs
have a normal distribution due to the mean and median being similar, Graph 1 for Age at Death
shows a normal distribution that is skewed to the left with a skewness of -0.32. while Diastolic
Pressure in graph 2 has a normal distribution and table 3 column 3 line 2 has a skewness of 0.88 .
Lastly Systolic Pressure in graph 3 has a normal distribution and a skewness od1.49 in graph 2
and 3 respectively has a positive skewness.
FRAMINGHAM ANALYSIS PROJECT 9
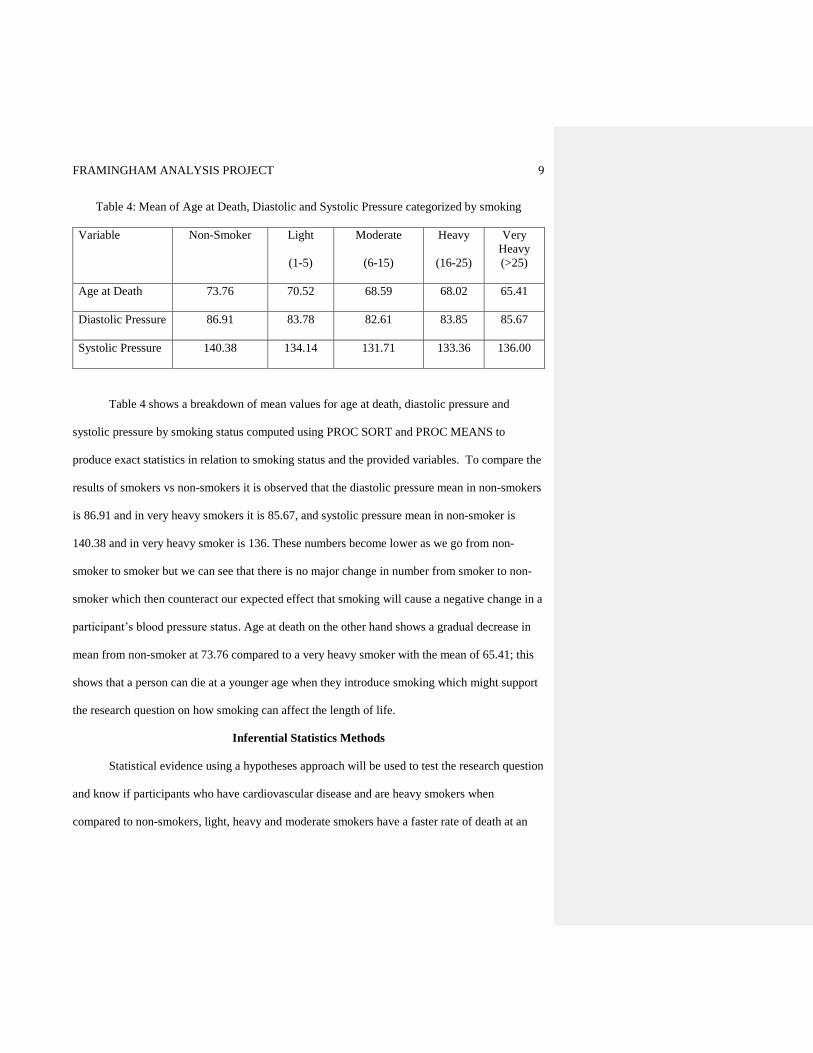
Table 4: Mean of Age at Death, Diastolic and Systolic Pressure categorized by smoking
Variable Non-Smoker
Light
(1-5)
Moderate
(6-15)
Heavy
(16-25)
Very
Heavy
(>25)
Age at Death 73.76 70.52 68.59 68.02 65.41
Diastolic Pressure 86.91 83.78 82.61 83.85 85.67
Systolic Pressure 140.38 134.14 131.71 133.36 136.00
Table 4 shows a breakdown of mean values for age at death, diastolic pressure and
systolic pressure by smoking status computed using PROC SORT and PROC MEANS to
produce exact statistics in relation to smoking status and the provided variables. To compare the
results of smokers vs non-smokers it is observed that the diastolic pressure mean in non-smokers
is 86.91 and in very heavy smokers it is 85.67, and systolic pressure mean in non-smoker is
140.38 and in very heavy smoker is 136. These numbers become lower as we go from non-
smoker to smoker but we can see that there is no major change in number from smoker to non-
smoker which then counteract our expected effect that smoking will cause a negative change in a
participant’s blood pressure status. Age at death on the other hand shows a gradual decrease in
mean from non-smoker at 73.76 compared to a very heavy smoker with the mean of 65.41; this
shows that a person can die at a younger age when they introduce smoking which might support
the research question on how smoking can affect the length of life.
Inferential Statistics Methods
Statistical evidence using a hypotheses approach will be used to test the research question
and know if participants who have cardiovascular disease and are heavy smokers when
compared to non-smokers, light, heavy and moderate smokers have a faster rate of death at an
FRAMINGHAM ANALYSIS PROJECT 10
early age. Because the data contains one continuous variable and one categorical variable with
more than two categories, a hypotheses test using Analysis of variance (ANOVA) will be used.
According to Sullivan (2012), the ANOVA technique applies when there are more than two
independent comparison groups, it is used to compare the means of the comparison groups and is
conducted using a five-step approach. Under ANOVA the one-factor approach will be used to
compare the means of different variables of the factor representing different smoking levels.
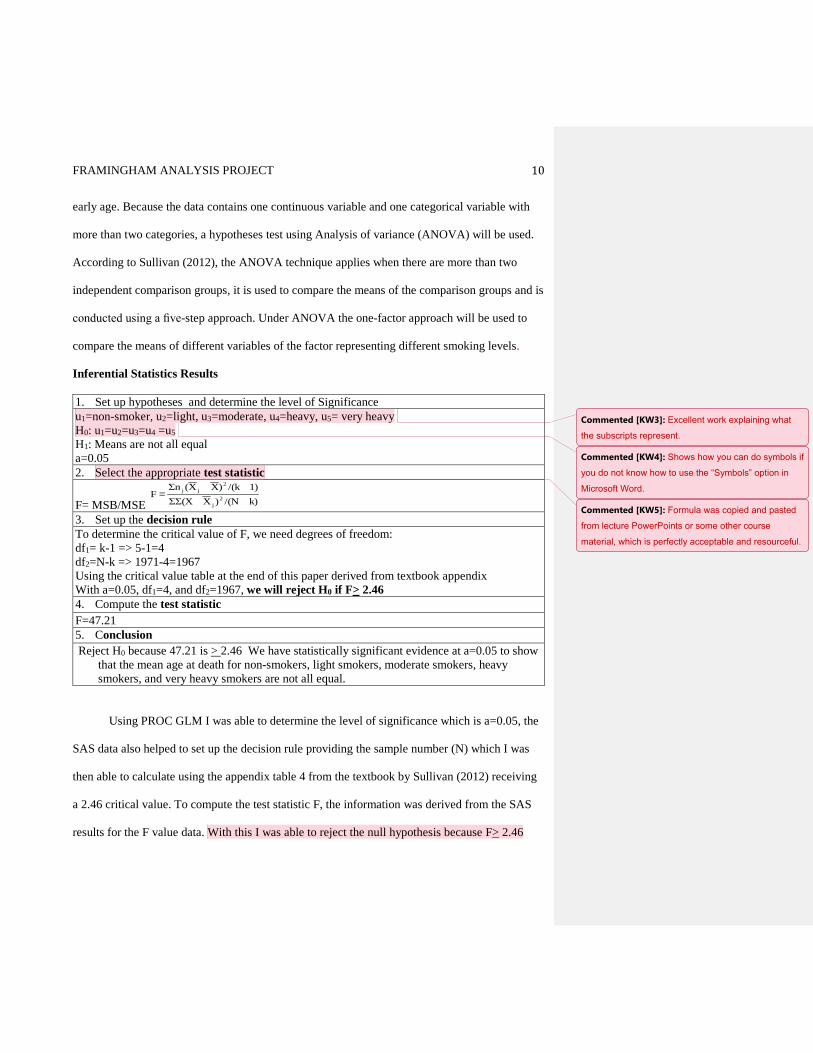
Inferential Statistics Results
1. Set up hypotheses and determine the level of Significance
u1=non-smoker, u2=light, u3=moderate, u4=heavy, u5= very heavy
H0: u1=u2=u3=u4 =u5
H1: Means are not all equal
a=0.05
2. Select the appropriate test statistic
F= MSB/MSE
3. Set up the decision rule
To determine the critical value of F, we need degrees of freedom:
df1= k-1 => 5-1=4
df2=N-k => 1971-4=1967
Using the critical value table at the end of this paper derived from textbook appendix
With a=0.05, df1=4, and df2=1967, we will reject H0 if F> 2.46
4. Compute the test statistic
F=47.21
5. Conclusion
Reject H0 because 47.21 is > 2.46 We have statistically significant evidence at a=0.05 to show
that the mean age at death for non-smokers, light smokers, moderate smokers, heavy
smokers, and very heavy smokers are not all equal.
Using PROC GLM I was able to determine the level of significance which is a=0.05, the
SAS data also helped to set up the decision rule providing the sample number (N) which I was
then able to calculate using the appendix table 4 from the textbook by Sullivan (2012) receiving
a 2.46 critical value. To compute the test statistic F, the information was derived from the SAS
results for the F value data. With this I was able to reject the null hypothesis because F> 2.46
k)/(N)XΣΣ(X
1)/(k)XX(ΣnF
2
j
2
jj=
Commented [KW3]: Excellent work explaining what
the subscripts represent.
Commented [KW4]: Shows how you can do symbols if
you do not know how to use the “Symbols” option in
Microsoft Word.
Commented [KW5]: Formula was copied and pasted
from lecture PowerPoints or some other course
material, which is perfectly acceptable and resourceful.

FRAMINGHAM ANALYSIS PROJECT 11
which helped to prove that the mean age at death for non-smokers, light smokers, moderate
smokers, heavy smokers, and very heavy smokers are not all equal.
Conclusion
This paper shows the cardiovascular participant data of the Framingham Heart Study
cohort by smoking status. As shown in table 4, smoking shortens the duration of life as we
observed the decrease in death at age between different levels of smokers and non-smoker. The
statistics proves that overtime; non-smokers can live longer with cardiovascular disease as the
mean age of death for non-smokers is higher than that of smokers’. To relate this back to public
health, this research can help provide support for anti-smoking education to help reduce diseases
caused by lifestyle choices like smoking; It is important for those individuals to learn that life
expectancy will increase if an individual stops smoking.
Commented [KW6]: The major issue with this part is
that after ANOVA result is to reject the null hypothesis,
there is no further discussion of the Tukey post-hoc
multiple comparisons test, which tells us specifically
which groups have means that are not equal. This part
is necessary, and you can see how it’s supposed to be
done in the third example paper.

FRAMINGHAM ANALYSIS PROJECT 12
References
Koenig, P. (2014, October, 10). Chronic disease as a result of poor lifestyle choices. Retrieved
August 21, 2016, from https://www.eastporthealth.org/articles/detail.php?Chronic-
Disease-As-a-Result-of-Poor-Lifestyle-Choices-6
Lisa, S. (2012). Essentials of biostatistics in public health. 2nd Edition. Sudbury, MA: Jones
&Bartlett Learning.
WHO. (May 2014). Cardiovascular diseases (CVDs). Retrieved August 21, 2016, from
http://www.who.int/mediacentre/factsheets/fs317/en/

FRAMINGHAM ANALYSIS PROJECT 13
Appendix
SAS Codes
Descriptive Analysis Codes For Categorical Variable
title "Sashelp.heart --- Framingham Heart Study";
PROC CONTENTS DATA = sashelp.heart;
RUN;
PROC FREQ DATA =sashelp.heart;
tables Status;
tables smoking;
run;
Descriptive Analysis Codes for Continuous Variables
PROC UNIVARIATE DATA = sashelp.heart;
VAR ageatdeath diastolic systolic ;
RUN;
PROC UNIVARIATE DATA = sashelp.heart;
VAR diastolic systolic ageatdeath;
HISTOGRAM / NORMAL;
RUN;
PROC SORT DATA = sashelp.heart OUT = temp;
BY smoking;
RUN;
PROC UNIVARIATE DATA = temp;
VAR ageatdeath diastolic systolic diastolic systolic;
BY smoking_status;
RUN;
PROC MEANS DATA = temp2;
VAR AgeAtDeath Smoking Systolic Diastolic;
BY smoking;
RUN;
Inferential Analysis Codes
PROC GLM DATA = sashelp.heart;
CLASS smoking_status;
MODEL ageatdeath = smoking_status;
MEANS smoking_status / TUKEY;
RUN;