example solar proton event data - emmrem.unh.edu
TRANSCRIPT

M. Kim and F. Cucinotta
Example Solar Proton Event Data
NASA JSCAugust 30, 2006

M. Kim and F. Cucinotta
Times of Occurrence of Large SPE’s
GCR Deceleration Potential
200
400
600
800
1000
1200
1400
1600
1800
1950 1955 1960 1965 1970 1975 1980 1985 1990 1995 2000 2005 2010 2015 2020Year
Φ, M
V
+ + + +- - -
1/1/1950 1/1/1960 1/1/1970 1/1/1980 1/1/1990 1/1/2000 1/1/2010 1/1/2020
F(>3
0 M
eV),
Pro
tons
/cm
2
108
109
1010F>108 solar protonevents only
Recent Era (1550-2000)McKracken et al.Modern Era (1956-2005)

M. Kim and F. Cucinotta
Projections of Cycles and Mean Occurrence Frequency of SPE
0
20
40
60
80
100
120
140
160
180
200
1996 2001 2006 2011 2016
Year
Suns
pot n
umbe
r
0
2
4
6
8
10
12
14
< ν(t
)>, E
vent
s/ye
ar
Population distribution level, percent90
70
50
30
10
Measured sunspot number
Smoothed sunspot number
Projected smoothedsunspot number at level, percent
807570
Cycle 23 Cycle 24
<ν(t)> :Φ30>=105
Φ30>=106

M. Kim and F. Cucinotta
Cycle Onset Time Φ30, protons/cm2 Time to Peak Flux, hr Comment19 11/12/1960 9.00 x 10⁹ 14 (a), note 120 8/2/1972 5.00 x 10⁹ 69 (a)22 10/19/1989 13:05 4.23 x 10⁹ 26.9 (b)
23 7/14/2000 10:45 3.74 x 10⁹ 25.8 (b)
23 10/26/2003 18:25 3.25 x 10⁹ 4.2 (b), note 223 11/4/2001 17:05 2.92 x 10⁹ 33.2 (b)
19 7/10/1959 2.30 x 10⁹ note 3 (a)
23 11/8/2000 23:50 2.27 x 10⁹ 16.1 (b)
22 3/23/1991 8:20 1.74 x 10⁹ 19.5 (b)
22 8/12/1989 16:00 1.51 x 10⁹ 15.2 (b)
22 9/29/1989 12:05 1.35 x 10⁹ 14.1 (b)
23 1/16/2005 2:10 1.04 x 10⁹ 39.7 (b)19 2/23/1956 1.00 x 10⁹ note 4 (a)
Large Solar Proton Events during Solar Cycles 19-23 with Φ30 > 109 protons/cm2
(a) Φ30 for solar cycle 19-21: data taken from Shea and Smart.(b) Φ30 for solar cycle 22 and 23: calculated using corrected 5-min average proton flux of GOES measurements.Note 1: There are large differences in the estimate of fluence in November 1960 SPE.
Data given by others are significantly smaller than this value (1.3 x 10⁹ protons/cm2 by Freier and Webber).Note 2: Φ30 for the combined 3 major peaks occurred during 10/26-11/6/2003: 3.42 x 10⁹ protons/cm2.Note 3: one day later on July 11, 1959 Note 4: in the same day on February 23, 1956

M. Kim and F. Cucinotta
Proton Integral FluxAugust 2-11, 1972 SPE
10
100
1,000
10,000
100,000
1,000,000
0 50 100 150 200 250
Time, h
Flux
, Pro
tons
/cm
2 -s
E > 10 MeV
E > 30 MeV
E > 60 MeV
M. Kim and F. Cucinotta
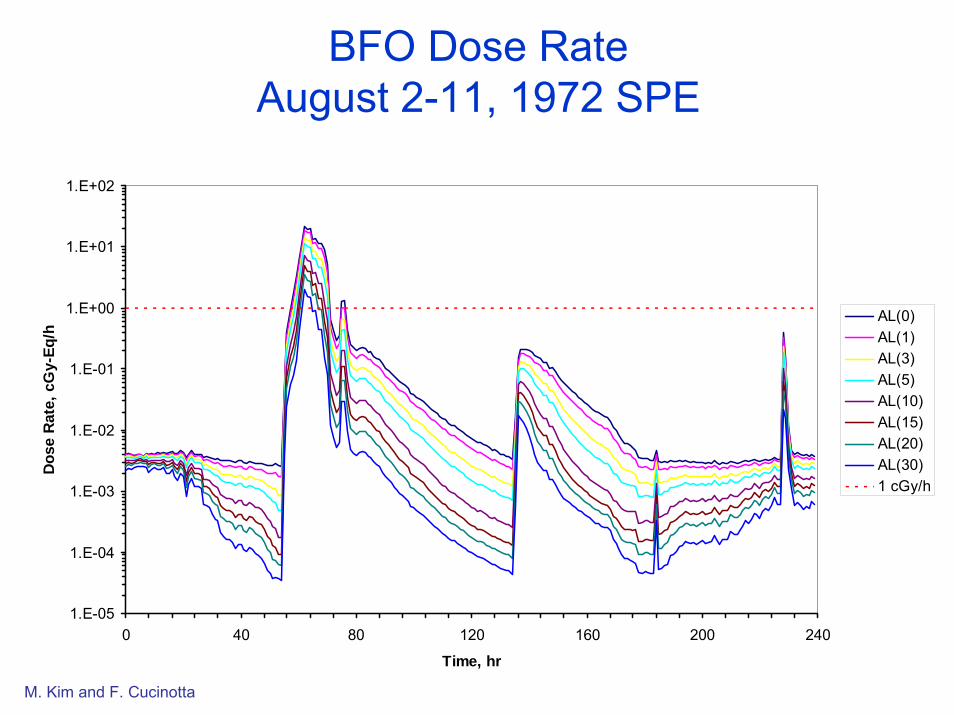
BFO Dose RateAugust 2-11, 1972 SPE
1.E-05
1.E-04
1.E-03
1.E-02
1.E-01
1.E+00
1.E+01
1.E+02
0 40 80 120 160 200 240
Time, hr
Dos
e R
ate,
cG
y-Eq
/h
AL(0)AL(1)AL(3)AL(5)AL(10)AL(15)AL(20)AL(30)1 cGy/h

M. Kim and F. Cucinotta
BFO Cumulative DoseAugust 2-11, 1972 SPE
1.E-03
1.E-02
1.E-01
1.E+00
1.E+01
1.E+02
1.E+03
0 40 80 120 160 200 240
Time, h
Cum
ulat
ive
Dos
e Eq
uiva
lent
, cSv Current 30-day limit
Al thickness, g/cm2:0135
10152030

M. Kim and F. Cucinotta
82 BFO Locations
● 32 location set● 50 location set

M. Kim and F. Cucinotta
August 1972 SPE (1 g/cm2 Al shield)
BFO Location0 5 10 15 20 25 30 35 40 45 50
BFO
Dos
e E
q, c
Gy-
Eq
0
100
200
300
400
500
Marrow location, jHead and NeckUpper TorsoMiddle TorsoThighsAverage

M. Kim and F. Cucinotta
Hourly-Averaged Proton Integral Flux during Oct 26 - Nov 6, 2003 SPE
0.1
1
10
100
1000
10000
100000
0 50 100 150 200 250 300
Time, h
Flux
, pro
tons
/cm
2 -s
E ≥ 30 MeVE ≥ 60 MeVE ≥ 100 MeV

M. Kim and F. Cucinotta
0.000001
0.00001
0.0001
0.001
0.01
0.1
1
10
0 50 100 150 200 250 300
Time, h
Dos
e R
ate,
cSv
/h
1 rem/h
Al thickness,g/cm2:
0135
10152030
BFO Dose Rate during Oct 26 - Nov 6, 2003 SPE

M. Kim and F. Cucinotta
0.1
1
10
100
1000
10000
100000
0 50 100 150 200 250 300
Time, h
Flux
, pro
tons
/cm
2 -s
E ≥ 30 MeVE ≥ 60 MeVE ≥ 100 MeV
Hourly-Averaged Proton Integral FluxOct 26 - Nov 6, 2003 SPE

M. Kim and F. Cucinotta
BFO Dose RateOctober 26- November 6, 2003 SPE
0.000001
0.00001
0.0001
0.001
0.01
0.1
1
10
0 50 100 150 200 250 300Time, h
Dos
e R
ate,
cG
y-Eq
/h
1 cGy/h
Al thickness,g/cm2:
0135
10152030

M. Kim and F. Cucinotta
BFO Cumulative DoseOctober 26- November 6, 2003 SPE
1.E-05
1.E-04
1.E-03
1.E-02
1.E-01
1.E+00
1.E+01
1.E+02
0 50 100 150 200 250 300Time, h
Cum
ulat
ive
Dos
e Eq
uiva
lent
, cSv
AL(0)AL(1)AL(3)AL(5)AL(10)AL(15)AL(20)AL(30)
Current 30-day limit
M. Kim and F. Cucinotta
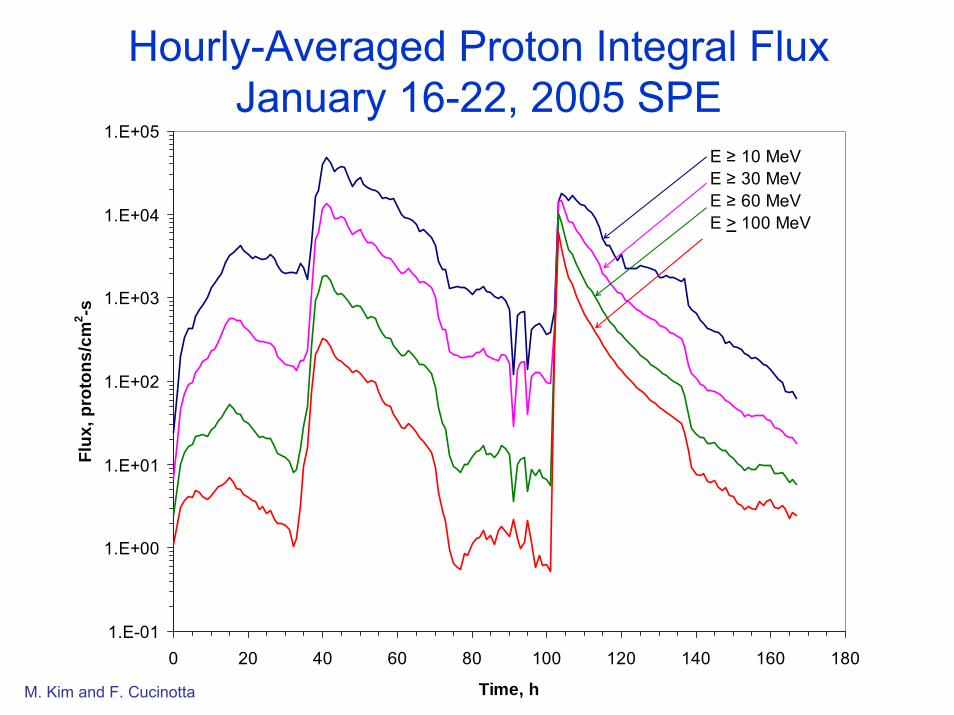
1.E-01
1.E+00
1.E+01
1.E+02
1.E+03
1.E+04
1.E+05
0 20 40 60 80 100 120 140 160 180
Time, h
Flux
, pro
tons
/cm
2 -s
E ≥ 10 MeVE ≥ 30 MeVE ≥ 60 MeVE > 100 MeV
Hourly-Averaged Proton Integral FluxJanuary 16-22, 2005 SPE

M. Kim and F. Cucinotta
BFO Dose RateJanuary 16-22, 2005 SPE
1.E-05
1.E-04
1.E-03
1.E-02
1.E-01
1.E+00
1.E+01
0 20 40 60 80 100 120 140 160 180
Time, h
Dos
e R
ate,
cG
y-Eq
/h
1 cGy/h
Al thickness, g/cm2
0 1 3 5
10 15 20 30

M. Kim and F. Cucinotta
1.E-05
1.E-04
1.E-03
1.E-02
1.E-01
1.E+00
1.E+01
1.E+02
0 20 40 60 80 100 120 140 160 180
Time, h
Cum
ulat
ive
Dos
e Eq
uiva
lent
, cSv
AL(0)AL(1)AL(3)AL(5)AL(10)AL(15)AL(20)AL(30)
Current 30-day limit
BFO Cumulative DoseJanuary 16-22, 2005 SPE

M. Kim and F. Cucinotta
Role of Dose-Rate and ShieldingShielding mitigates most SPE events
High-energy component (>100 MeV) often poorly knownProton biological damage is dependent on dose-rate
Effects increase above ~5 rad/hr
EVA Today (Y/N?)IVA (time to storm shelter)

M. Kim and F. Cucinotta
216 Particle Events (1976-2005)
0
5
10
15
20
250
1.5 3
4.5 6
7.5 9
10.5 12
13.5 15
16.5 18
19.5 21
22.5 24
25.5 27
28.5 30
31.5 33
34.5 36
37.5 39
40.5 42
43.5 45
46.5
Time to Max Proton Flux, hr
Freq
uenc
y
.00%
10.00%
20.00%
30.00%
40.00%
50.00%
60.00%
70.00%
80.00%
90.00%
100.00%
FrequencyCumulative %
M. Kim and F. Cucinotta
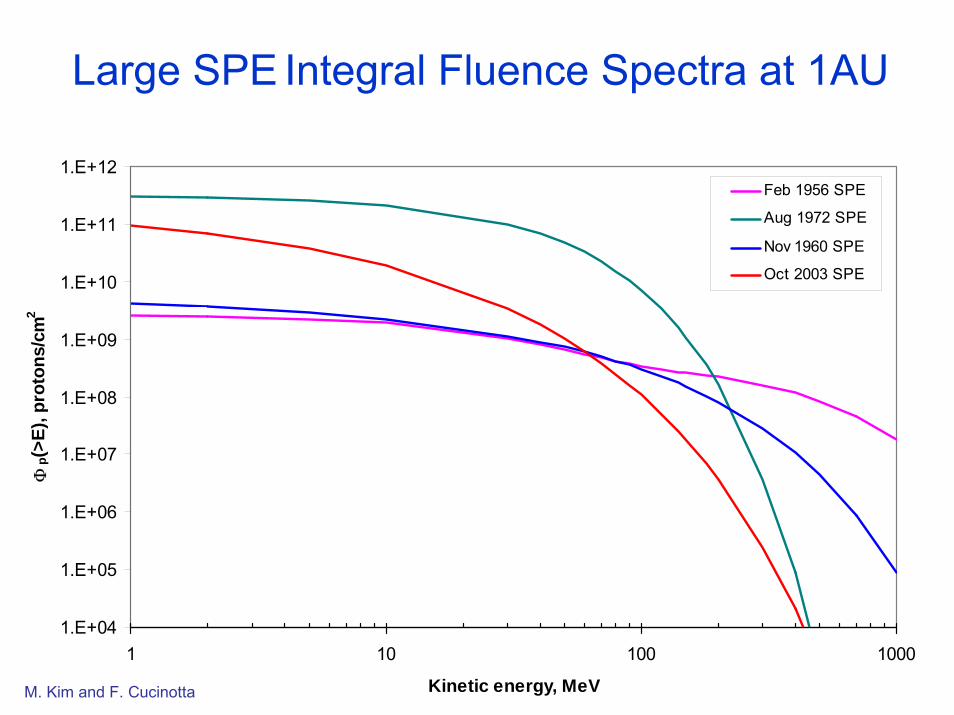
Large SPE Integral Fluence Spectra at 1AU
1.E+04
1.E+05
1.E+06
1.E+07
1.E+08
1.E+09
1.E+10
1.E+11
1.E+12
1 10 100 1000
Kinetic energy, MeV
Φp(
>E),
prot
ons/
cm2
Feb 1956 SPE
Aug 1972 SPE
Nov 1960 SPE
Oct 2003 SPE

M. Kim and F. Cucinotta
Big SPEs (Cycles 22-23)
1.00E-08
1.00E-06
1.00E-04
1.00E-02
1.00E+00
1.00E+02
1.00E+04
1.00E+06
1.00E+08
1.00E+10
1.00E+12
1 10 100 1000
E, MeV/amu
Φ (>
E), c
m-2
10/19/1989 SPE7/14/2000 SPE9/29/1989 SPE11/8/2000 SPE10/26/2003 SPE11/4/2001 SPE1/16/2005 SPE8/12/1989 SPE10/30/1992 SPE6/4/1991 SPE9/24/2001 SPE11/6/1997 SPE6/14/1991 SPE3/23/1991 SPE4/21/2002 SPE11/2/2003 SPE11/22/2001 SPE4/20/1998 SPE11/30/1989 SPE
M. Kim and F. Cucinotta
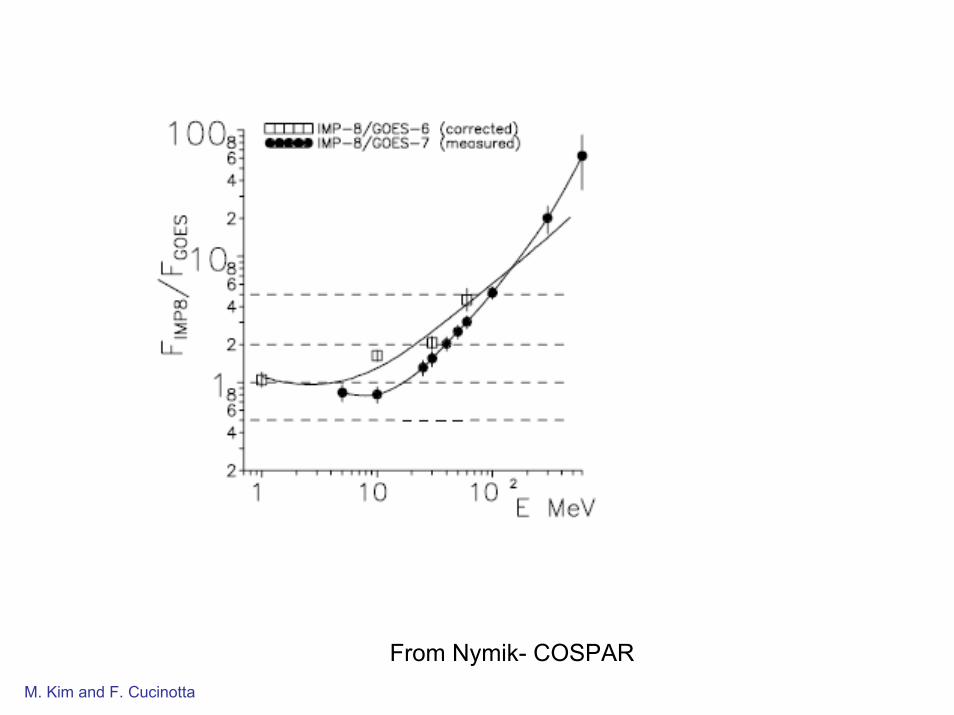
From Nymik- COSPAR

M. Kim and F. Cucinotta
The Average BFO Doses of the Regions at 6 DLOCs from 1972 SPE
0
20
40
60
80
100
120
140
DLOC1 DLOC2 DLOC3 DLOC4 DLOC5 DLOC6
BFO
Dos
e, c
Gy-
Eq
Head & NeckChestAbdomenPelvisThighsLower LegsArms

M. Kim and F. Cucinotta
Was Carrington Event (1859) Lethal?1859 event has largest F>30 Flux known
Proton Fluence >30 MeV per cm2
108 109 1010
% P
roba
bilit
y in
2-W
eek
Mis
sion
s
0.001
0.01
0.1
1
10
100
Blood Forming Organ Dose, cGy-Eq1 10 100
30-d
ay D
ose
Lim
it Vi
olat
ion
5% P
rodr
omal
Si
ckne
ss Mission disruption-days lost?
Increased fatal cancer riskand other late effects
Modern data(1956-2005)
Arctic ice-core data
5% A
cute
Let
halit
y U
nifo
rm D
ose
Single Mission
3 missions/year for5-yr Program
Conditions underApollo Spacecraft -type shielding
Ice-Core data-F>30MeV flux from1450-1990

M. Kim and F. Cucinotta
Large SPE’s
M. Kim and F. Cucinotta
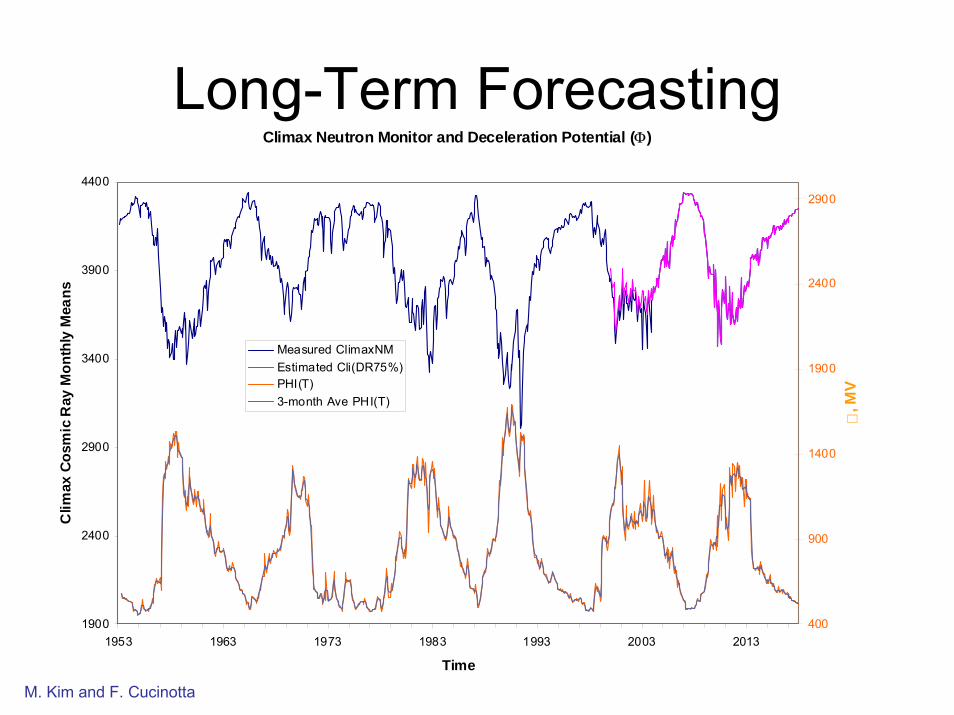
Long-Term ForecastingClimax Neutron Monitor and Deceleration Potential (Φ)
1900
2400
2900
3400
3900
4400
1953 1963 1973 1983 1993 2003 2013
Time
Clim
ax C
osm
ic R
ay M
onth
ly M
eans
400
900
1400
1900
2400
2900
, MV
Measured ClimaxNMEstimated Cli(DR75%)PHI(T)3-month Ave PHI(T)

M. Kim and F. Cucinotta
SPE Probability in 1-Week Missionand
BFO Exposure Level inside a Typical Equipment Room in Free Space
1.E-05
1.E-04
1.E-03
1.E-02
1.E-01
1.E+00
1.E+03 1.E+04 1.E+05 1.E+06 1.E+07 1.E+08 1.E+09 1.E+10 1.E+11
Size of Event (>Φ30)
SPE/
Mis
sion
0.1
1
10
100
1000
BFO
Dos
e, c
Gy-
Eq Average Probability of Space Era Extended Average ProbabilityImpulsive Nitrate EventsBFO Dose of Worst Case SPE ModelBFO Dose of SPE during Space Era
NCRP 30-day limit at BFO for LEO mission
M. Kim and F. Cucinotta
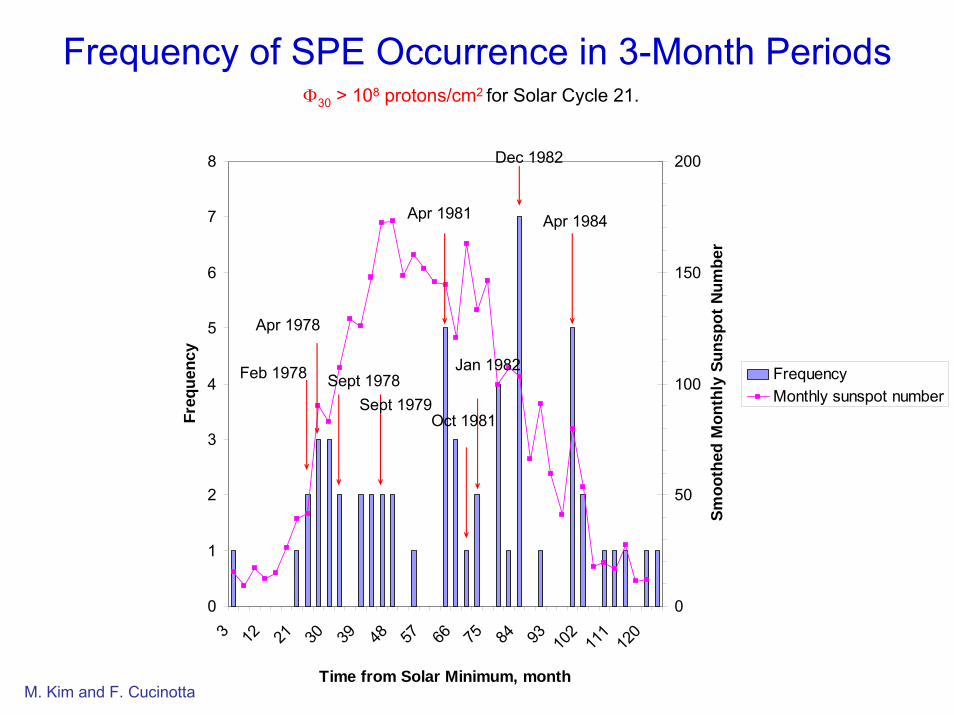
Frequency of SPE Occurrence in 3-Month PeriodsΦ30 > 108 protons/cm2 for Solar Cycle 21.
0
1
2
3
4
5
6
7
8
3 12 21 30 39 48 57 66 75 84 93 102
111
120
Time from Solar Minimum, month
Freq
uenc
y
0
50
100
150
200
Smoo
thed
Mon
thly
Sun
spot
Num
ber
FrequencyMonthly sunspot number
Feb 1978
Apr 1978
Sept 1978Sept 1979
Apr 1981
Jan 1982
Oct 1981
Dec 1982
Apr 1984

M. Kim and F. Cucinotta
Frequency of SPE Occurrence in 3-Month PeriodsΦ30 > 109 protons/cm2 for Solar Cycle 22.
0
1
2
3
4
5
6
7
8
3 12 21 30 39 48 57 66 75 84 93 102
111
120
Time from Solar Minimum, month
Freq
uenc
y
0
50
100
150
200
Smoo
thed
Mon
thly
Sun
spot
Num
ber
FrequencyMonthly sunspot number
Sept 1989Oct 1989Aug 1989
Mar 1991

M. Kim and F. Cucinotta
Frequency of SPE Occurrence in 3-Month PeriodsΦ30 > 109 protons/cm2 for Solar Cycle 23.
0
1
2
3
4
5
6
7
8
3 12 21 30 39 48 57 66 75 84 93 102
111
120
Time from Solar Minimum, month
Freq
uenc
y
0
50
100
150
200
Smoo
thed
Mon
thly
Sun
spot
Num
ber
FrequencyMonthly sunspot number
Jul 2000
Nov 2000
Nov 2001
Oct 2003
Jan 2005

M. Kim and F. Cucinotta
GCR and SPE Dose: Materials & TissueGCR higher energy >> secondary radiation
With Tissue ShieldingNo Tissue Shielding
Shielding Depth, g/cm2
0 5 10 15 20 25 30 35
Dos
e E
quiv
alen
t, cS
v/yr
1
10
100
1000
10000
GCR HydrogenGCR PolyethyleneGCR GraphiteGCR AluminumGCR RegolithSPE GraphiteSPE Regolith
Shielding Depth, g/cm2
0 5 10 15 20 25 30 35
Dos
e E
quiv
alen
t, cS
v/yr
1
10
100
1000
GCR HydrogenGCR PolyethyleneGCR GraphiteGCR AluminumGCR RegolithSPE GraphiteSPE RegolithSPE Hydrogen

M. Kim and F. Cucinotta
Risk and Uncertainties increase with Linear Energy Transfer (LET)
LET, keV/µm1 10 100 1000
REI
D(%
) 0
1
2
3
4
5
6
7
8
Fold uncertainty
Dose = 0.01 Gy
TEPC Data on NASA-MIR 7 (1/21/1998 to 5/28/1998)
y (~LET), keV/µm0.1 1 10 100 1000
F(>y
), (d
ay c
m2 )-1
0.01
0.1
1
10
100
1000
10000
GCRTrappedTotal
95% CL of Risk Model
Dose = Flux x LETBiological Dose H = Dose X Q(L)REID = Risk of exposure induced death = H x R0(sex,age)
M. Kim and F. Cucinotta
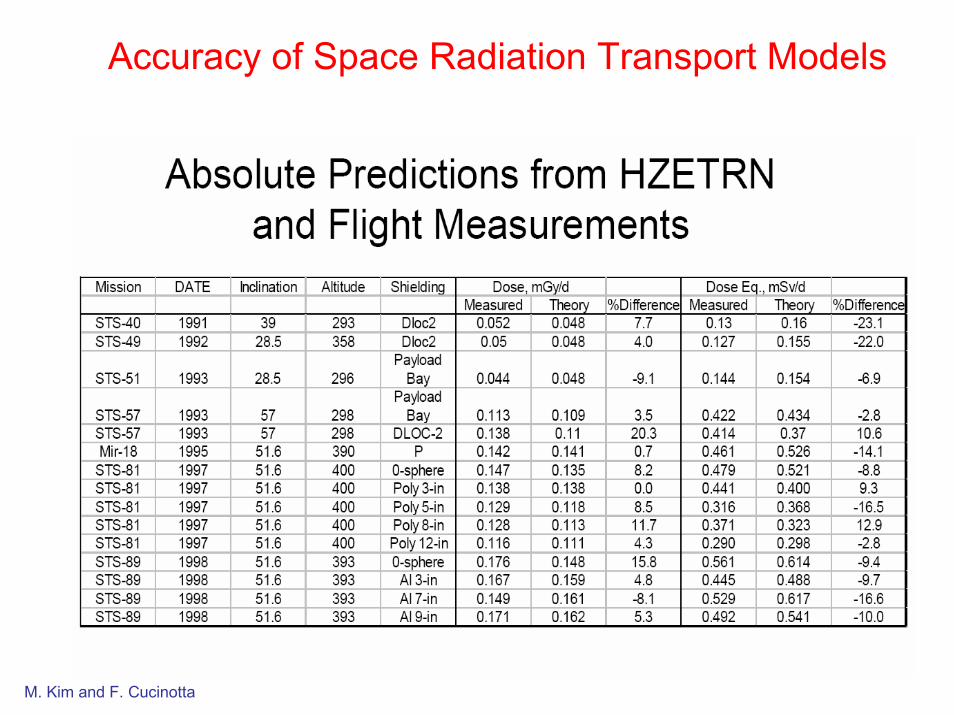
Accuracy of Space Radiation Transport Models
M. Kim and F. Cucinotta
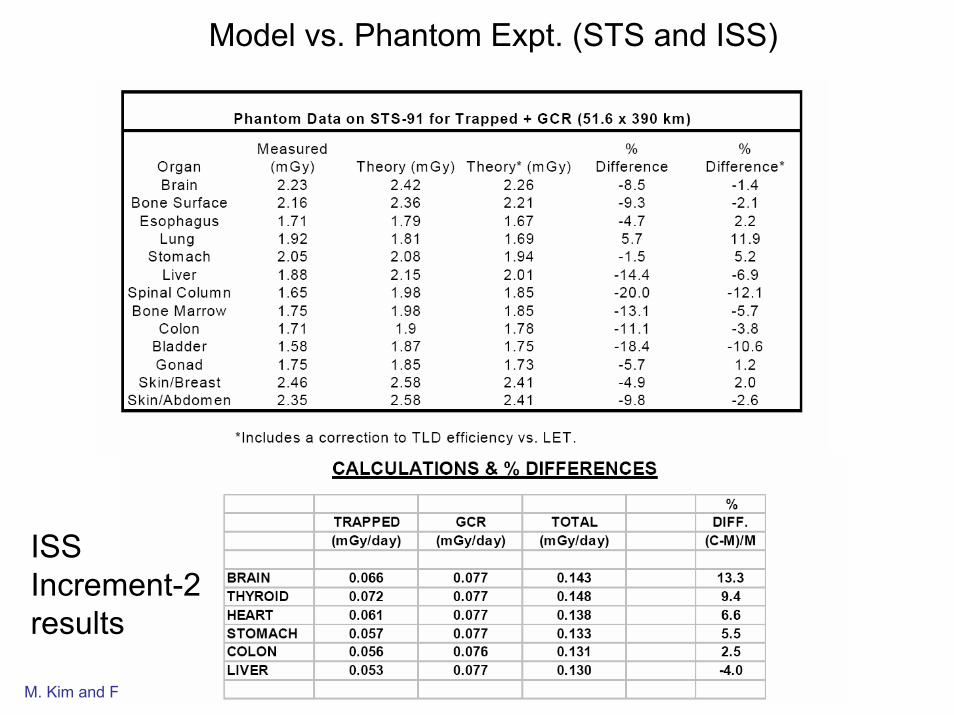
Model vs. Phantom Expt. (STS and ISS)
ISS Increment-2results

M. Kim and F. Cucinotta

M. Kim and F. Cucinotta

M. Kim and F. Cucinotta
Phantom Torso TEPC Trapped + GCR Differential FluxJune 25 - July 3, 2001
Lineal Energy (Tissue, keV/µm)
10-1 100 101 102 103 104
Diff
eren
tial F
lux,
Num
ber/c
m2 s
r day
keV
/µm
10-5
10-4
10-3
10-2
10-1
100
101
102
103
104
105
M. Kim and F. Cucinotta
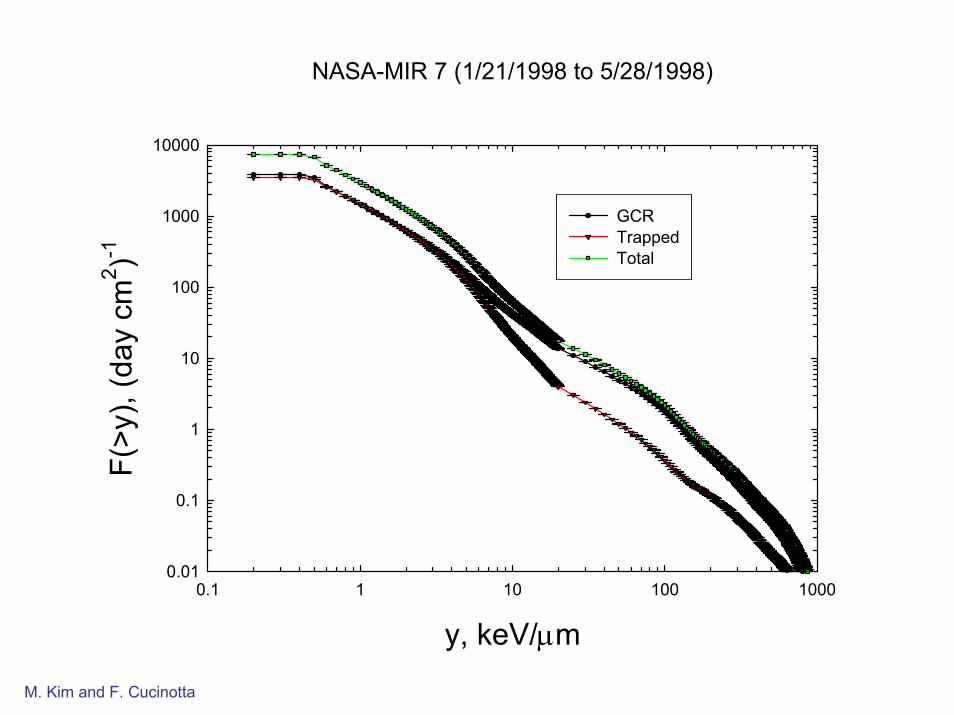
NASA-MIR 7 (1/21/1998 to 5/28/1998)
y, keV/µm0.1 1 10 100 1000
F(>y
), (d
ay c
m2 )-1
0.01
0.1
1
10
100
1000
10000
GCRTrappedTotal

M. Kim and F. Cucinotta
1.E-05
1.E-03
1.E-01
1.E+01
1.E+03
1.E+05
1.E+07
0.01 0.1 1 10 100 1000
0" (x100)
5" (x10)
7" (x1)
9" (x0.1)
1.E-05
1.E-03
1.E-01
1.E+01
1.E+03
1.E+05
1.E+07
0.01 0.1 1 10 100 1000
0" (x100)
5" (x10)
7" (x1)
9" (x0.1)
LET vs TEPC
TEPC model Vs TEPC (no TF)
M. Kim and F. Cucinotta