exceptional value in healthcare - medicine.utah.edu · objectives understand the ‘value’...
TRANSCRIPT

Exceptional Value in Healthcare The "New" (Old) Quality & Safety
Bob Pendleton, MD
Associate Professor of Medicine
Chief Medical Quality Officer
University of Utah Healthcare
@MDBobP #UUPMR14

Objectives
Understand the ‘Value’ imperative & associated drivers
of our current national health system performance
Review specific strategies to improve value at the
system level
Translate these strategies to clinical practice
@MDBobP #UUPMR14

A Case…
Clinical
Research
Education
Clinical
(85%)
Grants (12%)
Tuition (1%) Gifts/Other (2%)
Patient care
Teaching
Research
Source Use
IME 70% DSH 75% 13% for poor Value Medicaid as source 37% Payment model changes
1/3 of Hospitals
Headed for Bankruptcy
Payment constraints:
The future of AMC: strategies to avoid margin meltdown. Health Research Institute Feb 2012
@MDBobP #UUPMR14

1 CRAFT-BASED
MEDICINE: CARE ORGANIZED IN
SILOS
4 FEE-FOR-SERVICE
PAYMENTS BASED ON VOLUME & INTENSITY
OF SERVICES DELIVERED
5 EACH PRACTICE
SETTING OFFERS A FULL LINE OF
SERVICES & FOCUS IS ENCOUNTERS
6 PROVIDERS SERVE
ONLY THEIR IMMEDIATE
GEOGRAPHIC AREA
US HEALTHCARE
SYSTEM The barriers to change in health care have been mutually reinforcing
7 IT SYSTEMS NON-EXISTENT OR THERE ARE MULTIPLE SYSTEMS FOR SPECIALTIES, SERVICES, PROCEDURES, AND BILLING
3 OUTCOMES & COSTS ARE NOT ROUTINELY
MEASURED OR UNDERSTOOD
2 AGE OF
SCIENTIFIC DISCOVERY
Adapted from: Porter MP. (http://hbrblogs.files.wordpress.com/2013/09/portercircles1.jpeg)
@MDBobP #UUPMR14

Bob Pendleton M.D.
Marcus Welby...
Focus is on the What…
@MDBobP #UUPMR14

The Age of Scientific Discovery
0
10000
20000
30000
40000
50000
1965 1975 1985 1995 2005 2015
Annual published RCTs
To personally keep up with progress:
1980: Read 1 RCT daily
2010: Read 100 RCT daily
Adapted from: Medline Trend: http://dan.corlan.net/medline-trend.html (accessed Jan 4 2013)
@MDBobP #UUPMR14

Foundational Problem: Value NOT Measured
“… A fundamental and largely unrecognized problem: We don’t know what it costs to deliver health care to individual patients, much less how those costs compare to the outcomes achieved.”
“Understanding costs could be the single most powerful lever to transform the value of health care.”
- Robert S. Kaplan, Michael E. Porter
@MDBobP #UUPMR14

From Reinhardt blog, NY Times, 12/24/2010 @MDBobP #UUPMR14

More intense (unnecessary) care in U.S.
Service U.S. Non-U.S. OECD
Hospital DC / 100,000 persons 13,086 16,243
Average hospital LOS, d 5.4 6.1
Physician consultation per capita 3.9 6.5
Charges per hospital stay $15,000 $4,000
CT Scans / 1000 persons 228 115
MRI Scans / 1000 persons 91 25
Cardiac Cath / 100,000 persons 358 172
C-section / 1000 live births 323 234
Tonsillectomies / 100,000 persons 254 136
Ann Intern Med 2012; 157 (8): 586
@MDBobP #UUPMR14

Stress Testing Within 30 Days of Outpatient Visit After Coronary
Revascularization (%)
0
5
10
15
20
25
30
NoSymptoms
Symptoms CABG PCI Overall
Tech+Prof Fee
Prof Fee Only
No Billing
Source: Shah BR et al. JAMA. 2011; 306:1993
Financial Incentives Influence Behavior @MDBobP #UUPMR14

U.S. Spends Most $ on Healthcare of OECD
$8,047/person in 2009 19.5% of GDP by 2017 (?)
*17.2% in 2012
@MDBobP #UUPMR14

U.S. Healthcare Performance Scorecard
17% thirty-
day readmission
440,000 die a preventable
healthcare related death each yr.
1:2 patients do not receive basic
recommended care
5% hospitalized patients will have a
medication related adverse event
Average
clinical
LOS
$210B wasted annually on
unnecessary services
Diagnostic Errors are most common cause of medical errors
LAST in OECD in
mortality amenable
to healthcare
Wachter RM. Understanding Patient Safety (2012). & McGlynn et al. N Engl J Med 2003; 348:2635-2645; Health Affairs (2008); 27(1): 58-71. The
Institute of Medicine (IOM). 2010. The Healthcare Imperative. Therani et al BMJ Qual Saf (2103( doi:10.1136/bmjqs-2012-001550.
@MDBobP #UUPMR14

@MDBobP #UUPMR14

Change has become an OOWAA …Ocean Of
Words, Abbreviations, and Acronyms
IQR IPPS
OQR
HCAHPS MU
H-IT PROs PSIs
VBP
PPACA PSN HAC CGCAHPs
SGR
P4P NSQIP
MOC PQRS
@MDBobP #UUPMR14

2 AGE OF
SCIENTIFIC DISCOVERY
1 CRAFT-BASED
MEDICINE: CARE ORGANIZED IN
SILOS
3 OUTCOMES & COSTS ARE NOT ROUTINELY
MEASURED OR UNDERSTOOD
4 FEE-FOR-SERVICE
PAYMENTS BASED ON VOLUME & INTENSITY
OF SERVICES DELIVERED
3 VALUE
MEASURED & UNDERSTOOD FOR
EVERY PATIENT
4 BUNDLED PAYMENTS
FOR CARE CYCLES THAT ARE ALIGNED WITH VALUE
A VALUE SYSTEM A high-value delivery system has seven mutually supportive elements
1 CARE IN TEAMS
WITH EMPIRICAL & PRECISION BASED
CARE
6 PROVIDERS SERVE
ONLY THEIR IMMEDIATE
GEOGRAPHIC AREA
6 EXCELLENT SERVICES
ARE LEVERAGED ACROSS GEOGRAPHY
5 EACH PRACTICE
SETTING OFFERS A FULL LINE OF
SERVICES & FOCUS IS ENCOUNTERS
5 CARE DELIVERY
INTEGRATED (INCLUDING VIRTUAL)
FOCUS: EPISODES & POPULATIONS
7 SYSTEMS NOT EXISTENT OR THERE ARE MULTIPLE SYSTEMS FOR SPECIALTIES, SERVICES, PROCEDURES, AND BILLING 7 ENABLING INFORMATION TECHNOLOGY PLATFORM SUPPORTS
EFFICIENCY, KNOWLEDGE INTEGRATION, & OUTCOMES
2 AGE OF
SYSTEMNESS
Adapted from: Porter MP. (http://hbrblogs.files.wordpress.com/2013/09/portercircles2.jpeg)
@MDBobP #UUPMR14

“This move towards team-based care requires fresh thinking about clinical leadership responsibilities to ensure that the unique skills of each clinician are used to provide the best care…while the team as a whole must work together to ensure that all aspects of a patient’s care are coordinated…”
@MDBobP #UUPMR14

o Uncertainty
o Probabilities
o Certainty
o Automation
o Decision support
o Care teams
o Autonomy
Lean Six Sigma TQM CQI PDSA
Improvement Science:
@MDBobP #UUPMR14

Standard Work
Explore Variation Reduce Waste
Data & Process driven Front Line Leadership
Culture
@MDBobP #UUPMR14

PSI
process measures
VALUE
Measuring Value… @MDBobP #UUPMR14

COST ($)
EQUITABLE (S)
EFFECTIVE (Q)
EFFICIENT (Q)
SERVICE (S)
SAFE (Q)
Hospital Acquired Infections
Patient Safety
Indicators
Safety Event
Reporting
Hospital Acquired
Conditions
Patient access
HCAHPs CGCAHPs
utilization
flow
readmissions
appropriateness
LOS
Mortality
Process measures
Patient Reported Outcomes
Clinical outcomes
VALUE
VALUE
Dimensions of Value…
@MDBobP #UUPMR14

CMS: Inpatient Quality Reporting
2003 2006 2008 2010 2014
$: MSPB
Q: Readmission
S: HCAHPs
Q: Mortality
Q: Clinical Process Measures
@MDBobP #UUPMR14

@MDBobP #UUPMR14

2012 2013 2014 2015 2016 2017 2018
1%
1%
1.25%
2%
0.5%
1.5%
3%
0.5%
1%
1.75%
3%
1.5%
2%
2%
3%
2.0%
3%
2.0%
4%
2.0%
5%
HOSPITAL QUALITY REPORTING 2% OF APU
2% BASE DRG PMTS VALUE-BASED PURCHASING
READMISSIONS 3% BASE DRG PMTS
PHYSICIAN QUALITY REPORTING 2% PROFESSIONAL PMTS
HOSPITAL-ACQUIRED 1% TOTAL PMTS CONDITIONS
MEANINGFUL USE 5%
@MDBobP #UUPMR14

?
@MDBobP #UUPMR14

@MDBobP #UUPMR14

Case Study:
University of Utah Healthcare
@MDBobP #UUPMR14

Improve Clinic Access Meaningful Use Patient Satisfaction Hospital-acquired Infections Core Process Measures Improve efficiency; cost effectiveness
@MDBobP #UUPMR14
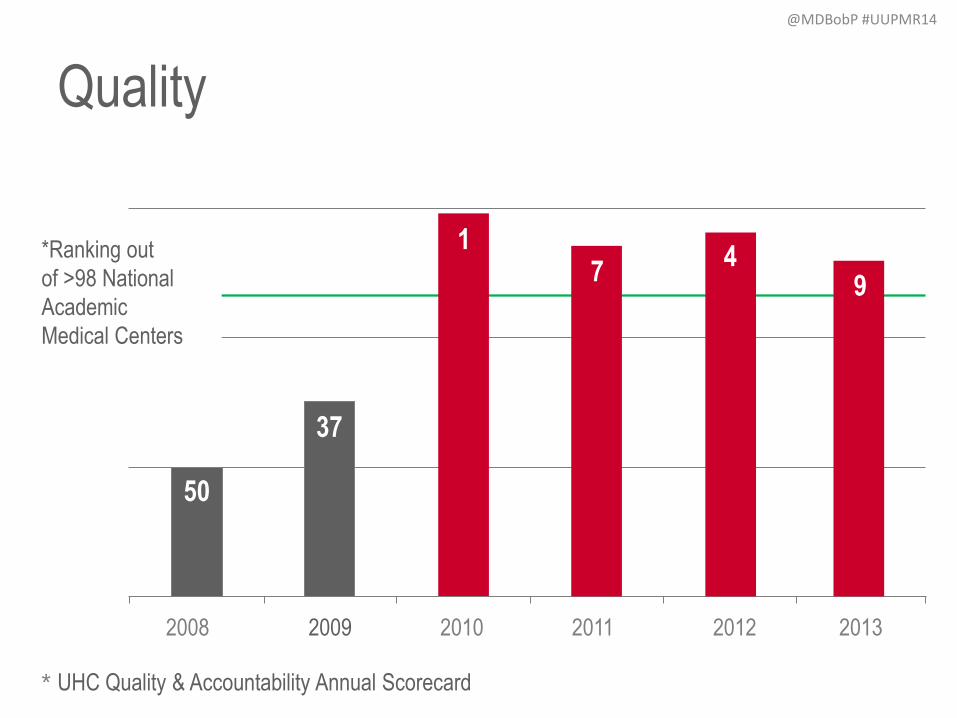
Quality
* UHC Quality & Accountability Annual Scorecard
2008 2009 2010 2011 2012 2013
9 4
7 1
37
50
*Ranking out
of >98 National
Academic
Medical Centers
@MDBobP #UUPMR14

Service Ambulatory Clinic Overall Satisfaction
39
53
75
0
50
100
FY11 FY12 FY13
Nat
iona
l Ran
k @MDBobP #UUPMR14

Cost Total Expense per CMI Adjusted Discharge
$8,947
$9,143
$9,407
$8,874
$9,221
$9,562
$9,859
$8,000
$8,400
$8,800
$9,200
$9,600
$10,000
FY10 FY11 FY12 FY13
US Health Care Inflation 3.5%
UUHC Inflation 1.9%
@MDBobP #UUPMR14

Foundational Problem: Value NOT Measured
“… A fundamental and largely unrecognized problem: We don’t know what it costs to deliver health care to individual patients, much less how those costs compare to the outcomes achieved.”
“Understanding costs could be the single most powerful lever to transform the value of health care.”
- Robert S. Kaplan, Michael E. Porter
@MDBobP #UUPMR14

Opportunity: Build a foundation to understand care delivery COSTS in the context of
outcomes in order to direct improvement and prepare the institution for the future.
Data must be: accessible, understandable, and actionable
Cost Type Groupings
Laboratory
Supply
Pharmacy
Diagnostic Imaging
Other
Operating Room Utilization
Accommodation
Value Driven Outcomes (VDO) @MDBobP #UUPMR14

Emergency Appendectomy
(47.01 Laparoscopic Appendectomy),
3.12 Clinical LOS
91066 - UUH OPC
29A EMERGENCY
RM
91275 - UUH ANC
13A CLINICAL
LABS
91259 - UUH ANC
12C CT IMAGING
91238 - UUH ANC
22A
ANESTHESIOLOGY
91237 - UUH ANC
22A POST
ANESTHESIA
91031 - UUH IPC
24A SURG ICU
91271 - UUH IPC
11C PHARMACY
IP
91607 - UUH ANC
14A NONINV
CARD MON
91665 - UUH IPC
24A
INTERMEDIATE
CARE
91239 - UUH ANC
13A
RESPIRATORY
THRPY
91054 - UUH ANC
37A DISTRO
INVENTORY
91642 - UUH IPC
21A SURG SPEC
TRANSPL
91040 - UUH IPC
33A GEN ACUTE
REHAB
91236 - UUH ANC
22A OPERATING
RM
91243 - UUH ANC
13A PULMONARY
LAB
91277 - UUH ANC
13A BLOOD
PRODUCTS
Cost Source: 16 Orgs
Anesthesiology
Surgery
Neurology
Radiology
Cost Source: 5 Depts
Pathology
@MDBobP #UUPMR14

91066 - UUH OPC
29A EMERGENCY
RM
91275 - UUH ANC
13A CLINICAL
LABS
91259 - UUH ANC
12C CT IMAGING
91238 - UUH ANC
22A
ANESTHESIOLOGY
91237 - UUH ANC
22A POST
ANESTHESIA
91031 - UUH IPC
24A SURG ICU
91271 - UUH IPC
11C PHARMACY IP
91607 - UUH ANC
14A NONINV CARD
MON
91665 - UUH IPC
24A
INTERMEDIATE
CARE
91239 - UUH ANC
13A
RESPIRATORY
THRPY
91054 - UUH ANC
37A DISTRO
INVENTORY
91642 - UUH IPC
21A SURG SPEC
TRANSPL
91040 - UUH IPC
33A GEN ACUTE
REHAB
91236 - UUH ANC
22A OPERATING
RM
91243 - UUH ANC
13A PULMONARY
LAB
91277 - UUH ANC
13A BLOOD
PRODUCTS
Facility Direct Cost
$X,XXX.00
Facility Cost Allocations Emergency Appendectomy
(47.01 Laparoscopic
Appendectomy), 3.12 Clinical
LOS
@MDBobP #UUPMR14

Plot the relative
size of variation
opportunities
Click on a bubble
and the detail
appears below
Opportunity Identification @MDBobP #UUPMR14

Drill into Direct Costs to
view cost variation by
cost categories
Average Cost per Case @MDBobP #UUPMR14

(Q): Hospital Acquired Conditions A Hospital Acquired Condition (HAC) is a medical condition or complication that a patient develops during a hospital stay, which was not
present at admission (www.ahd.com). This report trends the frequency of HACs over time. Users can filter the report on a si te or
department of interest and then click on the chart to get detailed information about the selected HAC.
Outcomes over time
Type of event
@MDBobP #UUPMR14

(V): Outcomes vs. Cost Scatterplot This report allows the user to analyze the relationship between cost and outcome metrics. The user can toggle between several
outcome metrics and plot the relationship with cost on the bubble chart. The report can be filtered by provider department, provider
division, site, and “care classifiers” (e.g., MS-DRG, diagnosis, procedure).
Selected Outcome
(or composite)
Cost
Individual Providers
@MDBobP #UUPMR14

Making VALUE Driven Decisions
Outcomes vs. Cost Trend
Perfect Care Costs
Outcomes Report Card
Outcomes vs. Cost Scatter plot
@MDBobP #UUPMR14

Improving Our Competency
Understand & apply lean principles
Discipline & alignment
Structuring teams for success
Monitoring and continuous improvement
@MDBobP #UUPMR14

FY13 Participation by Training Program
40
13
85
116
0
40
80
120
DESB UUMG Lean Principles PerformanceExcellenceFacilitation
@MDBobP #UUPMR14

Application
@MDBobP #UUPMR14

Opportunity: Patients with cellulitis have high variation in total costs
– Direct costs higher than expected
– Unwarranted variation in use of broad spectrum antibiotics and advanced imaging
– Unacceptable 30day return to ED rates
Goal
Create value-driven clinical process model to improve the value of care
delivery for patients with cellulitis.
Results:
Care process model designed and implemented
Broad spectrum antibiotic use decreased by 20%
Cost per case decreased by 23.3 %
30d readmission/return to ED decreased from 10% to 4%
Improve Care for Patients with Cellulitis
@MDBobP #UUPMR14

Opportunity: Average direct cost for labs are high.
– Patients do not like laboratory draws.
– 30-50% of labs deemed to be unnecessary.
– 20-40% reduction obtainable without change in mortality or readmissions.
Barie et al. Jo of Trauma 1996;41:714-720.
Goal
Reduce average direct cost per discharge for hospitalist labs by 30%.
Measures
Average direct cost per discharge
CMI adjustment as required
Monthly feedback at hospitalist meeting regarding costs per discharge
Hospitalist Laboratory Utilization Peter Yarbrough, MD & Team
@MDBobP #UUPMR14

Decision to Perform Test
Order
Specimen Obtained
Specimen Analyzed
Lab Values Available
Data Interpreted
Clinical Response
Project Focus
Estimated savings
$600,000/year
Action Plan Action Plan
Educate residents and interns
about costs of labs using
reference cards
Use checklist during rounds to
discuss laboratory orders
@MDBobP #UUPMR14
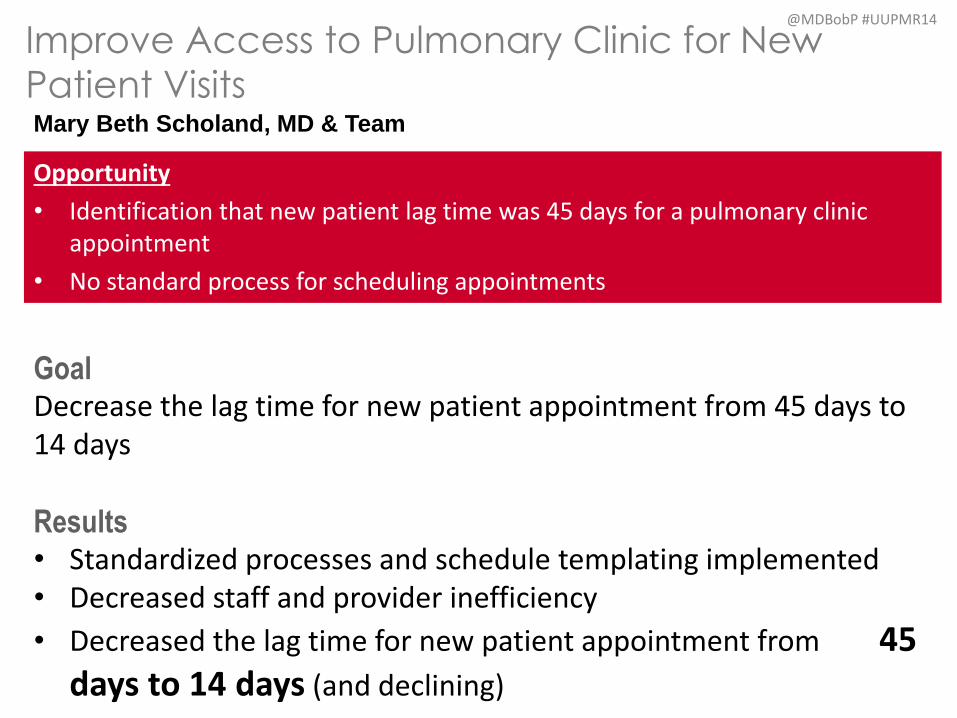
Opportunity
• Identification that new patient lag time was 45 days for a pulmonary clinic appointment
• No standard process for scheduling appointments
Goal Decrease the lag time for new patient appointment from 45 days to 14 days
Results • Standardized processes and schedule templating implemented • Decreased staff and provider inefficiency
• Decreased the lag time for new patient appointment from 45 days to 14 days (and declining)
Improve Access to Pulmonary Clinic for New
Patient Visits Mary Beth Scholand, MD & Team
@MDBobP #UUPMR14

Opportunity
• Gi Lab turnover process not standardized leading to ineffeciency
• No standard process for scheduling appointments
Goal Decreased GI Lab room turnover time by 20%
Results
• Implementation of “Turnover time on a dime” • Checklists for Consistent Process
• Turnover time reduced from 28.5min to 21.5min (24.5% decrease) • Increased capacity creation of $1324 per day
Improve GI Endoscopy Room Turnover
John Fang MD, Doug Adler MD & Team
@MDBobP #UUPMR14

2 AGE OF
SCIENTIFIC DISCOVERY
1 CRAFT-BASED
MEDICINE: CARE ORGANIZED IN
SILOS
3 OUTCOMES & COSTS ARE NOT ROUTINELY
MEASURED OR UNDERSTOOD
4 FEE-FOR-SERVICE
PAYMENTS BASED ON VOLUME & INTENSITY
OF SERVICES DELIVERED
3 VALUE
MEASURED & UNDERSTOOD FOR
EVERY PATIENT
4 BUNDLED PAYMENTS
FOR CARE CYCLES THAT ARE ALIGNED WITH VALUE
A VALUE SYSTEM A high-value delivery system has seven mutually supportive elements
1 CARE IN TEAMS
WITH EMPIRICAL & PRECISION BASED
CARE
6 PROVIDERS SERVE
ONLY THEIR IMMEDIATE
GEOGRAPHIC AREA
6 EXCELLENT SERVICES
ARE LEVERAGED ACROSS GEOGRAPHY
5 EACH PRACTICE
SETTING OFFERS A FULL LINE OF
SERVICES & FOCUS IS ENCOUNTERS
5 CARE DELIVERY
INTEGRATED (INCLUDING VIRTUAL)
FOCUS: EPISODES & POPULATIONS
7 SYSTEMS NOT EXISTENT OR THERE ARE MULTIPLE SYSTEMS FOR SPECIALTIES, SERVICES, PROCEDURES, AND BILLING 7 ENABLING INFORMATION TECHNOLOGY PLATFORM SUPPORTS
EFFICIENCY, KNOWLEDGE INTEGRATION, & OUTCOMES
2 AGE OF
SYSTEMNESS
Adapted from: Porter MP. (http://hbrblogs.files.wordpress.com/2013/09/portercircles2.jpeg)
@MDBobP #UUPMR14

Exceptional value is a journey and not
just a destination.
@MDBobP #UUPMR14