executive summary 4 - university of … · scorers, trainers, and supervisors as well as educator...
TRANSCRIPT

1

edTPA ANNUAL ADMINISTRATIVE REPORT Data range: 1/1/2014 - 12/31/2014
2
Preface and AcknowledgementsedTPA is a performance assessment for pre-service teacher candidates, which was developed and field tested beginning in 2009 and has been used operationally since September 2013. This report reviews the development of the assessment, previously described in detail in the 2013 edTPA Field Test Summary Report and presents analyses based on teacher candidate performance from January 1st to December 31st, 2014.
This administrative report was authored by: Irena Nayfeld, Postdoctoral Fellow, Stanford Center for Assessment, Learning and Equity (SCALE); Raymond L. Pecheone, Executive Director, SCALE; Andrea Whittaker, Director, Teacher Performance Assessment, SCALE; Ben Shear, Graduate Student, Stanford Graduate School of Education; and Heather Klesch, Director, Educator Solutions for Licensing and Learning, Evaluation Systems.
SCALE is the sole developer of edTPA, and Stanford University is the exclusive owner of edTPA. The university has an agreement with Evaluation Systems, a unit of Pearson, to provide operational support for the national administration of edTPA.
The analyses contained in this report were reviewed by technical committee members and advisors. See Appendix I for a complete list of members.
We are grateful to them for their advice and recommendations, which strengthened the development and analyses of edTPA. We also are grateful to the funders of the research and development process, including the Ford Foundation, the MetLife Foundation, the Morgan Family Foundation, the Stuart Foundation and the Hewlett Foundation. We are also grateful for the input and critique of the hundreds of teachers and teacher educators who participated in handbook and support resource development as design team members, content validation participants, bias and sensitivity reviewers, scorers, trainers, and supervisors as well as Educator Preparation Program (EPP) faculty who have piloted, field tested, and implemented edTPA since 2009.
As developers of edTPA, we welcome all comments regarding this report and its data and will carefully consider such comments as we continue to research, enhance, and improve edTPA as a support and assessment system.
¡ edTPA is exclusively owned by Stanford University, and is both a support and assessment program.

edTPA ANNUAL ADMINISTRATIVE REPORT Data range: 1/1/2014 - 12/31/2014
3
Table of Contents EXECUTIVE SUMMARY .................................................................................................................................................................................................................................................... 4
INTRODUCTION .............................................................................................................................................................................................................................................................. 9
edTPA SCORING 2014 .................................................................................................................................................................................................................................................. 14
VALIDITY EVIDENCE ...................................................................................................................................................................................................................................................... 18
CANDIDATE PERFORMANCE ....................................................................................................................................................................................................................................... 28 OVERALL TASK AND RUBRIC SCORES ................................................................................................................................................................................................................................. 28 PERFORMANCE BY CONTENT FIELD ................................................................................................................................................................................................................................... 30 PERFORMANCE BY CONSEQUENTIAL USE ........................................................................................................................................................................................................................... 33 PERFORMANCE BY DEMOGRAPHIC SUBGROUPS .................................................................................................................................................................................................................. 34
RELIABILITY EVIDENCE ................................................................................................................................................................................................................................................. 38
STANDARD ERROR OF MEASUREMENT ..................................................................................................................................................................................................................... 41
CANDIDATE PASSING RATES ....................................................................................................................................................................................................................................... 41
STATE STANDARD SETTING ......................................................................................................................................................................................................................................... 42
TAC RECOMMENDATIONS ........................................................................................................................................................................................................................................... 45
CONCLUSION ................................................................................................................................................................................................................................................................ 46
APPENDIX A: INTERNAL STRUCTURE .......................................................................................................................................................................................................................... 48
APPENDIX B: DOUBLE SCORING BAND – DISTRIBUTION OF SCORES ................................................................................................................................................................... 51
APPENDIX C: PERFORMANCE BY CONTENT FIELD ................................................................................................................................................................................................... 53
APPENDIX D: SCORE DISTRIBUTIONS BY CONTENT FIELD ...................................................................................................................................................................................... 56
APPENDIX E: PORTFOLIOS REPRESENTED BY STATE ................................................................................................................................................................................................ 58
APPENDIX F: CONSEQUENTIAL USE BY CONTENT FIELD ......................................................................................................................................................................................... 59
APPENDIX G: ANOVAS AND POST-HOC ANALYSES .................................................................................................................................................................................................. 62
APPENDIX H: DEMOGRAPHIC SUBGROUPS WITHIN TEACHING CONTEXT ........................................................................................................................................................... 68
APPENDIX I: NATIONAL TECHNICAL ADVISORY COMMITTEE (TAC) ........................................................................................................................................................................ 72
CITATIONS ..................................................................................................................................................................................................................................................................... 73

edTPA ANNUAL ADMINISTRATIVE REPORT Data range: 1/1/2014 - 12/31/2014
4
Executive Summary The Stanford Center for Assessment, Learning and Equity (SCALE), the American Association of Colleges of Teacher Education (AACTE) and Evaluation Systems group of Pearson are pleased to release the 2014 Administrative Report. This report presents all candidate performance data from the 18,000+ candidates who participated in edTPA during the first full operational year (January 1 to December 31, 2014), and associated analyses affirming reliability of scoring and validity evidence supporting its intended use as a measure of readiness to teach and a metric used to inform program approval or accreditation. All analyses and results have been informed and reviewed by a technical advisory committee of nationally recognized psychometricians, and meet the technical standards for licensure assessments set forth by AERA, APA, & NCME (2014).
SCALE and AACTE commend the more than 600 campuses in 40 states that contributed to the development and field testing1 of edTPA and its use since 2009. We also commend the teaching candidates who have engaged with edTPA as a reflective experience that demonstrates the knowledge, skills, and abilities embedded in their real teaching with real students in real classrooms across the country. Sharon P. Robinson, president and chief executive officer for AACTE, states, “We congratulate the growing network of teacher preparation programs that are working together to prepare teachers who are effective with all students. edTPA participants are helping to elevate the profession by supporting a core set of expectations for what every teacher should know and be able to do, just as other professions require for licensure or certification.” Moreover, edTPA was purposefully designed to reflect the teaching tasks that are represented in the National Board for Professional Teaching Standards (NBPTS) as it pertains to the skills and competencies attained as part of teacher preparation.
1 See the edTPA Summary Report 2013 for a complete description of edTPA development, field testing and candidate performance prior to operational use.
Developed by subject-specific faculty design teams and staff at SCALE with input from hundreds of teachers and teacher educators from across the country, edTPA is the first nationally available, educator-designed support and assessment system for teachers entering the profession. It provides a measure of teacher candidates’ readiness to teach that can inform licensure, accreditation decisions, and program completion. Most importantly, edTPA is an educative assessment that supports candidate learning and preparation program renewal.
edTPA Design
edTPA is a subject-specific performance assessment that evaluates a common set of teaching principles and teaching behaviors as well as pedagogical strategies that are focused on specific content learning outcomes for P-12 students. SCALE’s extensive Review of Research on Teacher Education provides the conceptual and empirical rationale for edTPA’s three-task design and the rubrics' representation of initial competencies needed to be ready to teach. The assessment systematically examines an authentic cycle of teaching aimed at subject-specific student learning goals, using evidence derived from candidates’ practice in their student teaching or internship placement. A cycle of teaching, captured by the three tasks that compose an edTPA portfolio, includes:
1) planning,
2) instruction, and
3) assessment of student learning.

edTPA ANNUAL ADMINISTRATIVE REPORT Data range: 1/1/2014 - 12/31/2014
5
Authentic evidence includes lesson plans, instructional materials, student assignments and assessments, feedback on student work, and unedited video recordings of instruction. Also assessed through the three tasks are candidates’ abilities to develop their students’ academic language and to justify and analyze their own teaching practices.
All 27 edTPA handbooks share approximately 80% of their design, assessing pedagogical constructs that underlie the integrated cycle of planning, instruction, and assessment. The other 20% features key subject-specific components of teaching and learning drawn from the content standards for student learning and pedagogical standards of national organizations. For example, consistent with the National Council of Teachers of Mathematics standards, the elementary, middle childhood, and secondary mathematics versions of edTPA require candidates to demonstrate subject-specific, grade-level appropriate pedagogy in mathematics. The assessment requires that the central focus of their learning segment supports students’ development of conceptual understanding, procedural fluency, and problem solving/reasoning skills of a standards-based topic, that their lesson design includes mathematics-pertinent language demands and supports, and that assessments provide opportunities for students to demonstrate development of mathematics concepts and reasoning skills.
edTPA’s Educative Purpose – A Support and Assessment System
Unlike typical licensure assessments external to programs, edTPA is intended to be embedded in a teacher preparation program and to be “educative” for candidates, faculty, and programs. Candidates deepen their understanding of teaching through use of formative resources and materials while preparing for edTPA, and the score reports provide feedback on candidates’ strengths and challenges as they move forward into their first years of teaching. For faculty and programs, the various edTPA resources and candidate, program, and campus results can be used to identify areas of program strength and determine areas for curricular renewal.
Since edTPA launched its first “online community” in 2011, membership has grown to nearly 8,000 faculty from more than 700 teacher preparation programs who have downloaded the program’s 150+ implementation resources over 100,000 times. The website (edtpa.aacte.org) also includes publicly available materials for various stakeholders. In addition to the website, edTPA offers a National Academy of experienced consultants available to provide professional development to new users and to network in a learning community across the country. Lastly, programs using edTPA are provided with a variety of tools and reporting formats to access, analyze, and make decisions about their own candidate performance data, as well as state and national summary reports.
Scorer Training, Monitoring and Reliability of Scores
Educators play a critical role in the scoring of edTPA. Over 2,300 teachers and teacher educators now serve as scorer trainers, supervisors, or scorers. Scorers must be P-12 teachers or teacher preparation faculty with significant pedagogical content knowledge in the field in which they score, as well as experience working as instructors or mentors for novice teachers (e.g.,
“The hard work pays off, absolutely. So much of what I do now and the planning I do is just automatic. Hands down the most beneficial thing for me is the learning context you get from edTPA; you must know your students well and analyze their information before planning lessons.”
- Phil Munkvold, kindergarten teacher, Mounds View (Minn.) School District

edTPA ANNUAL ADMINISTRATIVE REPORT Data range: 1/1/2014 - 12/31/2014
6
NBTPS teachers). In the 2014 administration year (January 1st, 2014 – December 31st, 2014), scorer recruitment goals targeted a balance of approximately 50% teacher educators and 50% practicing classroom teachers; 21% of scorers are National Board certified teachers. Before becoming an official edTPA scorer, educators must go through an extensive scorer training curriculum developed by SCALE and meet qualification standards demonstrated by scoring consistently and accurately. Once scorers are scoring operationally, they are systematically monitored during the scoring process to ensure that they continue to score reliably.
Scorer reliability was evaluated using several different statistical tests. In a random sample of 1,808 portfolios double-scored independently by two scorers, the scorers assigned either the same or adjacent scores (total agreement) in approximately 93.3% of all cases. Kappa n agreement rates reveal that scorers tend to assign scores within +/- 1 and rarely assign scores that differ by more than 1 point (overall kappa n reliability = .86). Internal consistency of the 15 rubrics, or items, was evaluated using Cronbach’s alpha (.923) and a latent trait IRT partial credit model that produced a reliability estimate of (0.917). All reliability coefficients indicate a high degree of internal consistency of rubrics to the measured construct (readiness to teach). These results are consistent with the Standards for Educational and Psychological Testing (AERA, APA & NCME, 2014) technical standards for licensure assessments of this type and support the use of edTPA scores as a reliable, consistent estimate of a prospective teacher’s readiness to teach.
Validity Evidence
edTPA was developed as an authentic, subject-specific, performance-based support and assessment system of a candidate’s readiness to teach. Following the validity guidelines presented in the Standards for Educational
and Psychological Testing (AERA, APA & NCME, 2014), this report defines the constructs assessed by edTPA and presents evidence that examines its use and interpretations. The validity section reviews evidence of construct validity of edTPA; these include the empirical research and theory on which the development was based, the design process and content development to ensure that the assessment represents the skills, knowledge and abilities that represent a candidate’s readiness to teach, and evidence of content, consequential, concurrent, and predictive validity. Results from a Confirmatory Factor Analyses (CFA) and a polytomous item response theory (IRT) model provide empirical support for the edTPA constructs of planning, instruction, and assessment.
Candidate Performance
This report presents performance data from 18,436 submissions: average scores and distributions overall by task and by rubric for the entire sample, as well as for each of the 27 content fields. The total score, computed as an aggregation of scores on a 5-point scale across 15 rubrics, ranges from 5 to 75 total points. The average edTPA score across 18,436 portfolios from fields with 15-rubric handbooks was 44.3, with a standard deviation of 7.8. Performance by task is an aggregation of scores on the 5 rubrics that make up each task; these range from 5 to 25 points for each task. Over a number of field trials and in operational use, a consistent candidate performance across edTPA teaching tasks has emerged: candidates performed most strongly on the planning task (M = 15.4), followed by the instruction task (M = 14.8) and the assessment task (M = 14.1). This conforms to other studies that have found that learning to evaluate and respond to students’ learning and provide meaningful feedback is one of the more challenging elements of teaching (Black & William, 1998; Otero, 2006; Siegel & Wissehr, 2011).
Scores across content fields were examined overall as well as disaggregated based on state-wide policy regarding consequential edTPA use - that is, whether or not the results of edTPA are used to make consequential decisions about candidates or programs. The overall mean score for all candidates in states with consequential policy was 45.0. Based on the
¡ edTPA is scored by highly trained and experienced educators.
edTPA ANNUAL ADMINISTRATIVE REPORT Data range: 1/1/2014 - 12/31/2014
7
national recommended cut score of 42, the pass rate for all candidates who submitted an edTPA portfolio in 2014 was 72% across all states, and 76% in states using the assessment consequentially.
Overall, the scores were generally higher for secondary teaching fields than most elementary and middle childhood fields. Due to large differences in sample size, populations represented within the sample, and small numbers of total submissions in certain fields, interpretations and comparisons across fields should be approached with caution and should not be generalized across the entire profession.
When submitting an edTPA portfolio for official scoring, the candidate is asked to provide demographic information in several categories: gender, ethnicity, teaching placement context, education level, and primary language. Portfolios submitted in states that have policy for consequential use of edTPA were used to examine performance by these demographic categories. These analyses revealed that all demographic variables taken together explained less than 4% of the total variance in edTPA scores. Differences by racial /ethnic group were small, with differences within groups much larger than differences between groups. Women generally scored more highly than men, and urban teachers on average scored more highly than teachers in other settings. In addition, White and Hispanic candidates had comparable performance, as did English speakers and those whose primary language is one other than English. Small sample sizes for some groups and differences in group sizes prevent strong generalizations; nevertheless, the results are encouraging and gaps in candidate performance appear to be narrowing. edTPA is committed to providing equal opportunity for all teacher candidates and will continue to monitor candidate performance, scorer training, assessment design, and implementation for any potential sources of differential impact.
Next Steps for Research
The input of the edTPA National Technical Advisory Committee guided the analyses and interpretations presented in this report; their recommendations and feedback are reflected throughout. The reported analyses were found to meet or exceed the standards for reliability and validity evidence of the Standards for Educational and Psychological Testing (APA, AERA and NCME, 2014). Additional research recommendations were discussed that can support and expand the validity evidence of edTPA.
Conclusion
Qualitative and quantitative analyses presented in this report describe the impact of edTPA on programs, faculty, and teacher candidates’ educative experiences. As with the Field Test data, data from the first year of operational use presented here are consistent with the technical standards of APA, AERA and NCME (2014) and support the use of edTPA to grant an initial license to pre-service teacher candidates as well as to inform state and national accreditation. The reporting of performance of all candidates who submitted edTPA portfolios in 2014 is presented for all content fields and informs the use of edTPA across states.
As is the case with NBPTS, educative use of a performance-based assessment is more than a testing exercise completed by a candidate. edTPA’s emphasis on support for implementation mirrors the NBPTS use of professional networks of experienced users to assist others as they prepare for the assessment. The opportunities for educator preparation program faculty and their P-12 partners to engage with edTPA are instrumental to its power as an educative tool. The extensive library of resources developed by SCALE, the National Academy of consultants, and state infrastructures of learning communities for faculty and program leaders promote edTPA as a tool for
¡ The edTPA National Technical Advisory Committee has reviewed this report and provided recommendations for future directions.
edTPA ANNUAL ADMINISTRATIVE REPORT Data range: 1/1/2014 - 12/31/2014
8
candidate and program learning. As candidates are provided with formative opportunities to develop and practice the constructs embedded in edTPA throughout their programs, and reflect on their edTPA experience with faculty and P-12 partners, they are more likely to internalize the cycle of effective teaching (planning, instruction, and assessment) as a way of thinking about practice - a way of thinking about students and student learning that will sustain them in the profession well beyond their early years in the classroom.

edTPA ANNUAL ADMINISTRATIVE REPORT Data range: 1/1/2014 - 12/31/2014
9
Introduction By the Profession, for the Profession
Drawing upon a 25-year history of assessment development led by Raymond Pecheone and Linda Darling-Hammond, edTPA is modeled after the architecture of the National Board for Professional Teaching Standards’ (NBPTS) assessments of accomplished veteran teachers, the Interstate Teacher Assessment and Support Consortium (InTASC) Portfolio, and the Performance Assessment for California Teachers (PACT). These portfolio-based designs have stood the test of time and consistently reveal key features of effective teaching. After more than four years of development and analysis, including two years of field testing with more than 12,000 teacher candidates, edTPA was launched operationally in September 2013 as a performance-based assessment to measure the classroom practice of pre-service teacher candidates – to ensure they are ready to teach on day 1. The assessment was developed by faculty and staff at Stanford University with leadership by the American Association of Colleges for Teacher Education (AACTE), subject-specific design teams comprised of teachers and teacher educators who are subject-matter experts, and input from educators nationwide. More than 1,000 educators from 29 states and the District of Columbia and more than 430 institutions of higher education participated in the design, development, piloting, and field testing of edTPA from 2009 to 2013. edTPA has been used operationally to assess teacher candidates since Fall 2013 and is now used by 626 programs in 41 states. edTPA is the first subject-specific, standards-based pre-service assessment and support system to be nationally available in the United States.
Role of the Partners
edTPA was created with input from teachers and teacher educators across the country in a process led by Stanford University’s Center for Assessment, Learning and Equity (SCALE) and supported by AACTE.
Each of the edTPA partners supports edTPA development and implementation in different ways. Stanford University faculty and staff at SCALE developed edTPA and are the sole authors. They receive substantive advice and feedback from teachers and teacher educators. The national design team and individual subject-specific design teams are convened annually to develop and update the handbooks for each of the 27 teaching fields. Design team members include subject-matter organization representatives from higher education and P-12.
As the lead in development, Stanford University exclusively owns all of the intellectual property rights and trademark for edTPA. SCALE is responsible for all edTPA development including candidate handbooks, scoring rubrics and the scorer training design, scorer training curriculum, and materials (including benchmarks), as well as support materials for programs, faculty, and candidates. SCALE also recruits, reviews, trains, and endorses National Academy consultants who act as support providers within the edTPA community (see description below).
AACTE partners with edTPA to support development and implementation, and disseminates resources via edtpa.aacte.org so that teacher preparation programs and faculty using edTPA have the materials they need to support teacher candidates. AACTE also supports the deployment of National Academy consultants via the website and an online community forum for networking and program assistance.
Stanford University/SCALE engaged Evaluation Systems, a group of Pearson, as an operational partner in March 2011 to make edTPA available to a national educational audience. As the operational partner, Evaluation Systems provides the management system required for multistate use of edTPA, including the infrastructure that facilitates administration of the assessment for submission, scoring, and reporting of results from both national and regional scoring.
Evaluation Systems collects and records the scores generated by qualified scorers. Evaluation Systems also recruits scorers, manages the scoring pool,

edTPA ANNUAL ADMINISTRATIVE REPORT Data range: 1/1/2014 - 12/31/2014
10
monitors scoring quality, and provides a delivery platform for the SCALE-developed scorer training curriculum.
The design framework for edTPA and constructs assessed were established prior to the partnership with Evaluation Systems/Pearson and were informed by earlier work led by SCALE staff (National Board and PACT). Evaluation Systems was chosen as the operational partner to ensure that edTPA assessment development built by the profession and supported by foundation funds could be scaled up for national use. That is, the Evaluation Systems/Pearson group has no authority or decision-making role in the design and development of edTPA.
edTPA as Support and Assessment
Unlike typical licensure assessments external to programs, edTPA is intended to be embedded in a teacher preparation program and to be “educative” for candidates, faculty, and programs. Candidates deepen their understanding of teaching through use of formative resources and materials while preparing for edTPA, and the score reports provide feedback on candidates’ strengths and challenges as they move forward into their first years of teaching. For faculty and programs, the various edTPA resources and candidate, program, and campus results can be used to identify areas of program strength and determine areas for curricular renewal.
Summary of resources
Since edTPA launched its first “online community” in 2011, membership has grown to 7,937 faculty from more than 700 teacher preparation programs who have access to more than 150 resources including candidate handbooks, rubrics, and templates, support guides for candidates, local evaluation protocols, retake guidelines, guidelines for supervising teachers, and webinars addressing edTPA constructs such as Academic Language. The website, edtpa.aacte.org, also includes publicly available materials for various stakeholders (for example, video and webinar explanations of edTPA and its benefits). Materials in the resource library have been downloaded over 100,000 times. The most commonly downloaded resources include…
edTPA Handouts to Share with Stakeholders 9895 downloads
“Making Good Choices” - A Support Guide for edTPA Candidates 4914 downloads
All National Handbooks 3662 downloads
Academic Language Webinar Recording 3290 downloads
Understanding Rubric Learning Progressions - Full Collection 2598 downloads
Guidelines for Acceptable Candidate Support 2553 downloads
edTPA Orientation for Program Leaders, Faculty, and P-12 Partners 2542 downloads
2013 edTPA Field Test: Summary Report 2193 downloads
In addition to the Resource Library for edTPA members, the website also includes an online community platform used by faculty to pose questions or share resources developed locally.
National Academy
edTPA’s National Academy of consultants provides onsite professional development and implementation support for programs, states, and regional networks, as well as webinar-based support for individual programs seeking more peer interaction. National Academy members must demonstrate edTPA leadership within a program, have experience leading state or local implementation and/or developing and delivering edTPA-related professional development, and have disciplinary expertise related to national scoring and training.

edTPA ANNUAL ADMINISTRATIVE REPORT Data range: 1/1/2014 - 12/31/2014
11
Common workshop topics include:
• General introduction to edTPA • “Deep-dive” handbook and rubric walk-throughs • Preparation for local evaluation • Curriculum mapping • Academic language • P-12 support • Candidate support • Leading faculty in a change process
AACTE and SCALE collect feedback from each workshop to inform continual improvement of the National Academy, which is intended to be an adaptive and responsive resource addressing programs’ evolving needs.
Semi-Annual Summary Reports
edTPA Summary Reports are made available to Educator Preparation Programs (EPPs) and state agencies on a biannual basis (January and July) to assist them in examining the performance of their candidates as compared to the population of candidates taking edTPA within the associated state and nationally. The reports provide analyses at three levels for the date ranges referenced:
edTPA National Performance Summary
Provides a summary that represents national-level data for candidates scored and reported within the stated date ranges. Programs who have received edTPA official data in these date ranges will receive this summary.
edTPA State Performance Summary
Provides a summary that represents state-level summary data for candidates who indicated they were prepared in the state, and were scored and reported within the stated date ranges. Programs who
have received edTPA official data in these date ranges will receive this summary for their respective state.
edTPA EPP Performance Summary
Provides a summary that represents program-level summary data for candidates who indicated they were prepared at the specific program, and were scored and reported within the stated date ranges. Programs who have received edTPA official data in these date ranges for candidates preparing at the program will receive this summary for their program.
All summary reports contain a) mean edTPA scores, total and by rubric, b) distributions of total scores, and c) rubric means and distributions for each field. In addition to the three summary reports, EPPs are provided a spreadsheet or roster that provides official scores by rubric as well as total scores by task and overall for each candidate who indicated they were prepared by the program and was officially scored and reported during the stated date ranges. The report allows the EPP to easily analyze performance by subject area, cohort, or other program features.
EPPs utilizing the data are also provided with a detailed table of contents and suggested questions to guide conversation about each part of the reported data. Examples of questions include: "What do the data show in terms of teacher candidates' understandings and professional performance? What are the implications for our program in terms of what and how we teach?” SCALE encourages programs utilizing the data to connect numerical trends to local evaluation of candidate portfolios.
These reports are critical to building understanding and discussion about edTPA, and for this reason, SCALE strongly encourages EPPs to share these data with all participating faculty and P-12 partners to celebrate candidate success and as part of ongoing program renewal conversations.

edTPA ANNUAL ADMINISTRATIVE REPORT Data range: 1/1/2014 - 12/31/2014
12
Evaluation Systems/Pearson Supports
Pearson (through edTPA.com – the candidate-facing program web site) provides operational assessment services associated with registration, scoring, and reporting of edTPA scores. Assessment services include use of the technology platform which registers the candidate, receives the portfolio, coordinates the logistics of scoring the portfolio, and reports the results to the candidate. Additionally, a faculty feedback feature is available through the Pearson Portfolio system, allowing candidates to request formative feedback from a designated faculty member based on SCALE’s guidelines of acceptable support. Assessment services also include the recruiting and management of qualified educators who serve as scorers, scoring
supervisors, or trainers. Scorers are trained using a training curriculum developed by SCALE, specifically for use with edTPA rubrics. Scorers use standardized scoring procedures and are calibrated and monitored during scoring. Pearson also works with EPPs and state agencies to securely report candidate scores as appropriate. Through the ResultsAnalyzer tool, stakeholders are able to review and utilize their data sets as provided on each reporting date.
Pearson also provides fee waivers in the form of financial hardship vouchers to eligible candidates. Over 1,400 fee waivers were made available for eligible edTPA candidates between September 2013 and June 2014. Waivers are provided directly to EPPs who then distribute them based on student need.
edTPA ANNUAL ADMINISTRATIVE REPORT Data range: 1/1/2014 - 12/31/2014
13
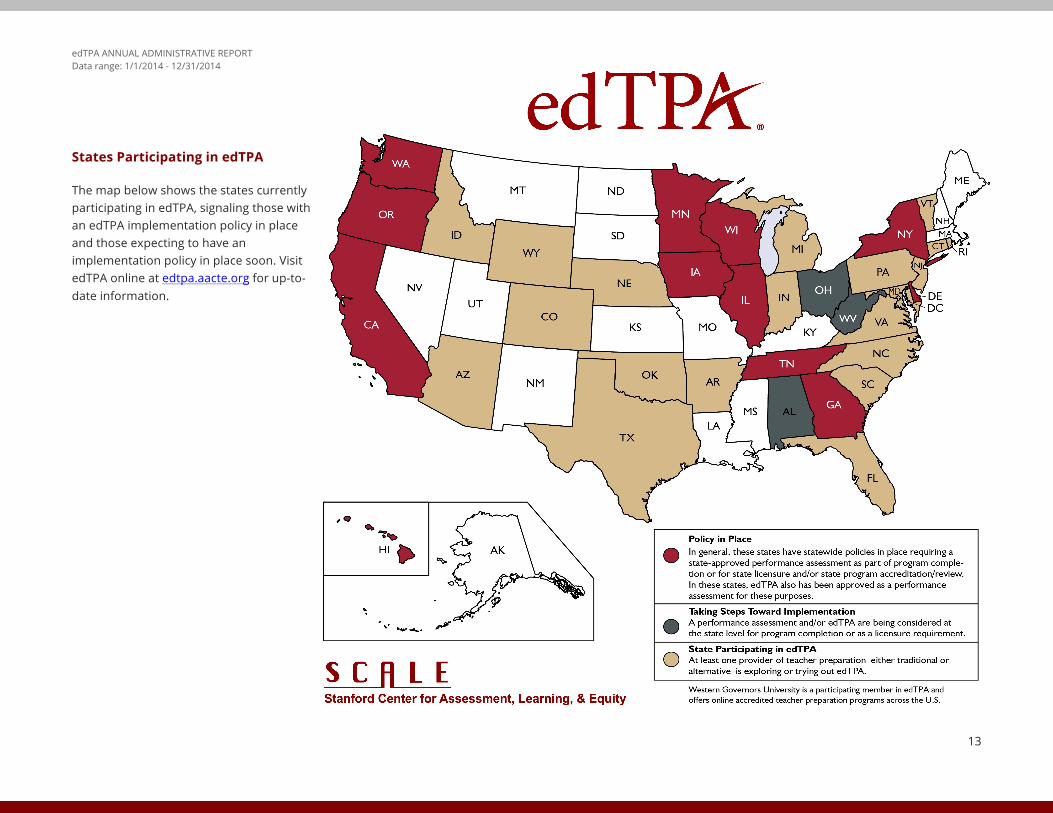
States Participating in edTPA
The map below shows the states currently participating in edTPA, signaling those with an edTPA implementation policy in place and those expecting to have an implementation policy in place soon. Visit edTPA online at edtpa.aacte.org for up-to-date information.

edTPA ANNUAL ADMINISTRATIVE REPORT Data range: 1/1/2014 - 12/31/2014
14
edTPA Scoring 2014 Over 2,300 teachers and teacher educators now serve as trainers, scoring supervisors, or scorers of edTPA as part of the National Scoring Pool. Scorers must be P-12 teachers or teacher preparation faculty with significant pedagogical content knowledge in the field in which they score, as well as experience working as instructors or mentors for novice teachers. In the 2014 administrative year (January 1st, 2014 – December 31st, 2014), recruitment goals targeted a balance of scorers with approximately 50% teacher educators and 50% classroom teachers. National Board Certified teachers compose 21% of all edTPA scorers.
Scorer Training
Before becoming an official edTPA scorer, educators must go through an extensive scorer training curriculum and meet qualification standards. All scorer training materials are authored by SCALE. Training for scorers comprises both individual online and interactive group sessions, totaling about 20 hours. The individualized training includes a series of modules that orient scorers to the tasks, rubrics, and scoring system, and provides numerous opportunities to identify and evaluate evidence for each rubric. After completing the individual portion of the training materials, scorers independently score a sample edTPA portfolio coded by experienced scorers and trainers and then review evidence and score justifications with other scorers and a trainer in that content area. Following the independent sample scoring of a practice portfolio and discussion of score justifications, scorers must consistently score two qualifying portfolios within calibration standards before becoming fully qualified to score. Active scorers are monitored by their supervisors through a back-reading process and routinely score previously scored “benchmark” portfolios to ensure they are applying scores accurately and consistently.
Scorers are recruited, trained, and qualified to score in two scoring pools – national and regional (see additional information in the “Regional Scoring Option” section below). The national pool includes qualified scorers who
access and score portfolios submitted from across the country. In the regional scoring pool, qualified faculty from preparation programs (in implementing states where regional scoring is an accepted scoring model), score a sample of their program’s own candidate portfolios. Regional scorers complete the same training and qualify using the same criteria before scoring, and have the same quality monitoring and scoring consistency requirements as those scoring in the national pool. The Regional option was launched in 2015, so all of the portfolios scored in the 2014 operational year and reported here were scored by the National Scoring Pool.
Each edTPA scorer is assigned to score portfolios at the grade-level span and subject area for which he or she has qualified. The scorer utilizes a secure online scoring platform to access each candidate’s materials and determines the rubric scores after viewing all evidence from artifacts, commentaries, and video recording(s) submitted by the candidate. The scorer evaluates a candidate’s entire portfolio across the three assessment tasks (planning, instruction, and assessment). Drawing upon SCALE’s theory of action from PACT that examined the benefits of understanding the interrelationships within a cycle of effective teaching, each scorer scores an entire candidate submission (rather than independent scorers of discrete tasks or rubrics). As a result, the scorer can effectively review the entirety of a candidate’s teaching evidence and ensure the components are appropriately interrelated. The scorer evaluates how the candidate plans to support subject-specific student learning, enacts those plans in ways that develop student learning, and analyzes the impact of that teaching on student learning. Guided by 15 analytic rubrics (five rubrics within each of the three assessment tasks) that use a five point scale, the scorer assesses the extent to which — and the areas in which — the candidate is ready to teach, as well as any particular areas for improvement. The total possible scores on edTPA, added across all 15 rubrics, range from 15 to 75 points.
¡ edTPA scorers receive rigorous training and ongoing monitoring while scoring.

edTPA ANNUAL ADMINISTRATIVE REPORT Data range: 1/1/2014 - 12/31/2014
15
edTPA’s Scoring Model
Overview of the edTPA Scoring Model:
• A single scorer evaluates the entire portfolio. • Rubric scores are on a five point scale – rater agreement is evaluated
by exact and adjacent scores. • Scoring model: currently about 30% of portfolios are double scored,
for two reasons: 1. 10% of portfolios are randomly selected for reliability reads
OR 2. The portfolio lies within the double scoring band around
the cut score. • Inter-rater reliability is calculated by examining the double scored
portfolios cited under #1 above (10% reliability reads). • If a portfolio score falls within the double scoring band (a band
calculated based on the standard error of measurement around the national recommended professional performance standard), it is scored by a second scorer.
• Double scored portfolios can be read by a scoring supervisor (a third “chief” scorer) for rubric score resolution, or for portfolio score adjudication.
o Resolution: If Scorer 1 and Scorer 2 are discrepant (i.e., more than 1 score point apart) on any rubric, the portfolio is resolved by a scoring supervisor. The supervisor score is reported for the discrepant rubrics.
o Adjudication: If Scorer 1 and Scorer 2 are on opposite sides of the national recommended professional performance standard, the portfolio is adjudicated by a scoring supervisor. The scoring supervisor scores are reported to candidates.
• If a portfolio is double scored and does not need resolution or adjudication, then the average of scorer 1 and scorer 2 is reported to the candidate.
The double scoring procedures increase the decision consistency of the final scores assigned to edTPA candidates. In all such cases the final score is
based on at least two scorers who agree on the decision in relation to the national recommended professional performance standard. Ideally, decisions of the two scorers on each of the 15 rubrics would be the same across the portfolio. However in practice, the high complexity of teaching and 15 different decisions by rubric may result in a difference in total scores across two raters. Evidence of high total agreement (the rate at which scorers assign the same or adjacent scores) presented in the ‘Reliability’ section of this report supports the consistency of edTPA scores.
Scorers cannot continue scoring if flagged by quality monitoring. Facets of the quality management of scorers include:
• Validity Portfolio Performance: Validity portfolios are benchmarked portfolios (i.e., calibration exercises) that are randomly sent to scorers to evaluate scorer performance. Approximately 10% of the portfolios a scorer sees are validity portfolios.
• Inter-Rater Reliability: As described above, 10% of portfolios are randomly double-scored to monitor agreement rates amongst scorers.
• Monitoring after Initial Qualification: All newly qualified scorers are backread by a scoring supervisor. All scorers are flagged for backreading after they have scored their first portfolio.
• Scoring Rate: Scorers are monitored to ensure they are not scoring too quickly or too slowly, which may impact quality. On average, a portfolio is scored in 2-3 hours. A scorer’s average scoring rate per portfolio cannot not exceed or fall below edTPA program thresholds.
• Excessive Scoring: Scorers are not permitted to score an excessive number of portfolios in a designated time period.
• Portfolio Limits: The edTPA program limits the number of portfolios in each subject area that any individual scorer may score during a specific timeframe.
• Backreading: Scorers are systematically monitored by their supervisors through a backreading process that ensures they are applying scores accurately and consistently. Backreading is defined as supervisors scoring a previously scored portfolio for the purpose of reviewing the original scoring and providing feedback to the scorer. During backreading, a scoring supervisor applies scores and

edTPA ANNUAL ADMINISTRATIVE REPORT Data range: 1/1/2014 - 12/31/2014
16
identifies key evidence to support the scores. After applying scores, supervisors review scores from the original scoring and review backreading scores with feedback to the original scorer.
• Period of Inactivity: Inactive scorers (those who have not scoredwithin 120 days) need to score a complete benchmarked portfolio as a re-qualification exercise in order to remain calibrated to edTPA rubrics and prior to returning to score.
Regional Scoring Option
Faculty engagement in the scoring of edTPA portfolios is an ideal way to deepen and sustain an understanding of candidate performance and educative implementation. In addition to faculty participation as scorers in the national official scoring outlined above, EPPs can participate in regional official scoring, wherein faculty are able to officially score portfolios from their own campus or region.
Regional scorers complete the same training and qualify using the same criteria as all official scorers before scoring, and have the same quality monitoring and scoring consistency requirements as those scoring in the national pool and as described above. edTPA regional scoring is conducted in accordance with all quality standards in place for national scoring, to ensure that the levels of service and quality of the national program are maintained. These quality standards refer to both the actual scoring statistics and figures, as well as scorer training quality protocol. Scorers observe all conditions and requirements for training and qualification, as well as of confidentiality and self-recusal for personal knowledge of the candidate.
The regional scoring option was piloted in Spring 2015 in California and will be available in other states in a second comprehensive pilot phase beginning in Spring 2016, in order to establish processes for a broad-based implementation of edTPA regional scoring. Based on the results of the pilot, a complete national expansion will be offered in 2017 (scoring occurring in Spring 2017).
The EPP will play a primary role in the management and implementation of regional scoring on their campus. The number of faculty from the EPP who complete scorer training and qualify will determine the number of portfolios that can be identified for regional scoring at the location during specified scoring windows.
It is hoped that regional scoring will offer EPPs additional opportunities to build faculty capacity to support prospective teachers as well as become more engaged and knowledgeable about edTPA handbooks, the scoring process, and performance of candidates.
Candidate Submissions and Score Confirmation
At the time of the submission, edTPA candidates are required to attest to the originality of their work, including confirmation that the candidate is sole author of the commentaries and other written responses to prompts and other requests for information in this assessment, and that the candidate has appropriately cited all materials in the assessment whose sources are from published text, the Internet, or other educators. Pearson uses a well-established and reliable software platform to screen submissions for originality of content. Submissions that are flagged as a result of initial screening are subject to additional review and investigation in coordination with individual IHEs or state or, as appropriate.
¡ National and regional scoring options are available.
¡ As indicated here teacher candidates own the content they create and submit for each edTPA portfolio. Neither Stanford University nor Pearson owns the candidates’ edTPA portfolios.
The use of the portfolio video by candidates is restricted by the parameters of the release forms obtained for children and/or adults who appear in the video. Candidates are warned that videos are NOT to be displayed publicly (i.e., personal websites, YouTube, Facebook).

edTPA ANNUAL ADMINISTRATIVE REPORT Data range: 1/1/2014 - 12/31/2014
17
Following score reporting, if a candidate believes that one or more of their scores has been reported in error, they may request a score confirmation report. A supervisor or trainer who did not serve as one of the original scorers reviews the original reported scores to confirm that they are accurate. A review of the original scores takes place through the backreading process. As the supervisor or trainer engages in backreading, should there be a score with which the supervisor or trainer disagrees, they rescore the entire portfolio and provide the updated rubric scores.
If the score confirmation process results in a score alteration, the candidate is issued an updated Score Profile, the score confirmation fee is refunded, and the candidate’s records will be updated. If the original score is confirmed as a result of the score confirmation process, the candidate is sent a letter indicating that their score has been confirmed, and the score confirmation fee is not refunded.

edTPA ANNUAL ADMINISTRATIVE REPORT Data range: 1/1/2014 - 12/31/2014
18
Validity Evidence According to the Standards for Educational and Psychological Testing (AERA, APA & NCME, 2014) and leading psychometric experts (Bell et al., 2012; Haertel, 2008; Haertel & Lorié, 2004; Kane, 2006; Sheppard, 1993), the process of validation begins with defining the intended purpose of the assessment and the constructs being measured. The inferences made by this definition are then examined using various sources of evidence that may support the interpretation and use of scores. edTPA was developed to be an authentic, subject-specific, performance-based support and assessment system of a candidate’s initial readiness to teach. The following section of the report presents the inferences made by this purpose and use of edTPA, followed by evidence that evaluates the validity of proposed score interpretations.
Content Validity
edTPA was designed following standards for credentialing exams, and intended to be used as an assessment of the knowledge, skills, and abilities necessary for beginning teaching. According to the Standards for Educational and Psychological Testing (AERA, APA & NCME, 2014), “validation of credentialing tests depends mainly on content-related evidence, often in the form of judgments that the test adequately represents the content domain associated with the occupation or specialty being considered.” The design and structure of edTPA was based on foundational research in teacher education and a 25 year history of assessment development. It is modeled after the subject-specific architecture of NBPTS assessments, Council of Chief State School Officers (CCSSO) portfolio assessment, and PACT, authentic assessments of teaching that have been found to be effective measures of teacher quality across populations and learning contexts (e.g., Cavalluzzo, Barrow, Mokher, Geraghty, & Sartain, 2014; Darling-Hammond, Newton, & Chung Wei, 2013; Cowan & Goldhaber, 2015), and aligned with the InTASC standards for beginning teacher licensing (2013).
The AERA, APA & NCME Standards (2014) indicate that, “To identify the knowledge and skills necessary for competent practice….A wide variety of empirical approaches may be used, including the critical incident technique, job analysis, training needs assessments, or practice studies and surveys of practicing professionals.” Building on the foundation of NBPTS, PACT, and InTASC, the development of the edTPA rubrics was informed by a combination of content validation and job analysis activities and information. The information obtained through these activities is a key contributor to validating edTPA as an effective, authentic instrument that can be used for teacher licensure decisions. The review by teachers and teacher educators provided statistical data to support edTPA as a highly representative tool in measuring candidates’ knowledge and skills needed to perform on the job as a novice teacher. The data support edTPA as an evaluation tool for both pedagogical and subject-specific knowledge and skills — which together with other measures of teacher competence form the basis of what teacher candidates must possess starting on day one of their professional career.
The first round of content validation reviews in July 2011 yielded results that were taken into account as edTPA materials were revised in preparation for the national edTPA field test the following year (results from this activity are reporting in the edTPA 2013 Field Test Summary Report). Content validation results were examined by SCALE staff and presented to subject-specific review team members (some of whom were recruited from the content validation review committees) as the pilot versions of the 2011 handbooks were revised for the 2012 field test. As a result, the field test handbooks included greater specificity about subject-specific pedagogy (in Planning and Instruction prompts and rubrics), and subject-specific learning (in Assessment and Academic Language prompts and rubrics). Strong existing alignment with InTASC standards resulted in some changes to edTPA field test handbooks. Some InTASC standards, such as “professional responsibility,” were better measured by other ongoing program evaluation processes and not included in edTPA. Further, based on the content validation ratings, the InTASC standard, “positive learning environments,” was further refined and included in edTPA.

edTPA ANNUAL ADMINISTRATIVE REPORT Data range: 1/1/2014 - 12/31/2014
19
In the second round of content validation reviews (conducted in 2013), educators participated in an online content validation survey activity, comprising a review of materials for the 27 available edTPA content areas. Key to the validity and authenticity of edTPA is the diverse pool of educators who participated throughout its development. The edTPA content validation process featured educator participants composed of qualified public school and higher education representatives.
For the 2013 activity, over 500 educators from public school and higher education faculty were contacted to participate in the online content validation/job related survey activity. In order to be eligible to participate, K–12 educators needed to indicate that they were a currently licensed and practicing educator in the content area, and faculty needed to indicate that they were teaching courses that may be taken by candidates preparing to become educators or supervising the clinical experiences of candidates in the content area. Participants were supplied with online access to the Fall 2013 operational edTPA handbook and the National professional standards (e.g., National Council of Teachers of English, International Reading Association) associated with their individual fields to assist them in their review and ratings.
For the first part of the process, participants were asked to focus on rating the pedagogical components of the edTPA Handbook tasks and rubrics and their alignment with the release of the InTASC teaching standards, a project of CCSSO. For the second part of establishing content validity, participants were asked to focus on rating the subject-specific content pedagogy components of the edTPA handbook tasks and rubrics and the alignment of the materials with the national professional standards (e.g., National Council of Teachers of English, International Reading Association) associated with their individual fields. Each participant provided independent judgments in the online survey rating form addressing the following questions:
• Importance. How important are the knowledge and/or skills assessed in each edTPA task for performing the job of an entry-level
educator in this field? ( “1 = no importance” to “5 = very great importance”)
• Representativeness. How well do the set of rubrics represent important knowledge and/or skills addressed by each edTPA task for performing the job of an entry-level educator in this field? (“1 = poorly” to “5 = very well”)
• Alignment*. How well do the knowledge and/or skills addressed in each edTPA task align with the subject-specific pedagogical standards? (“1 = poorly” to “5 = very well”)
One set of ratings were gathered for each task. For each of the rating questions, participants were provided with an optional comment box.
*Note: Subject-specific “Alignment” ratings were captured for each set of subject-specific pedagogical standards utilized for the survey field.
Results from the 2013 content validity round of activities are shown in the following table, providing additional confirmation of the importance, alignment, and representativeness of the edTPA tasks.

edTPA ANNUAL ADMINISTRATIVE REPORT Data range: 1/1/2014 - 12/31/2014
20
Content Validation:
Pedagogy Ratings for All Fields
Importance of Knowledge and Skills
InTASC Standards Alignment
Rubric Representativeness
Task/Component N Mean Std Dev
N Mean Std Dev
N Mean Std Dev
Task 1: Planning 52 4.35 0.65 52 4.27 0.72 52 4.25 0.74
Task 2: Instruction 52 4.52 0.58 52 4.25 0.65 52 4.31 0.70
Task 3: Assessment 52 4.44 0.64 52 4.25 0.71 52 4.29 0.72
Content Validity Ratings. The table above displays content validity ratings (on a five-point scale with five being the most positive rating) given by edTPA content validity committee members. The data indicate a strong relationship between the assessment’s key tasks and the job of an entry-level teacher.
The ratings obtained through these content validity surveys indicated a strong support of the tasks’ importance to performing the job of an entry level educator in the content area, their representativeness of important content in the content area, and the knowledge and skills in edTPA being very well aligned to the subject-specific pedagogical standards. These data indicate a strong relationship between the edTPA tasks (planning, instruction and assessment) and the job of an entry-level teacher.
Confirmatory National Job Analysis
To further support the content validity findings in 2013, a confirmatory job analysis study was conducted to support the job-related validity of edTPA by drawing upon the list of Knowledge, Skills, and Abilities (KSAs) that were identified by educators, faculty, and subject-matter experts during the edTPA development process. Subject-matter experts for edTPA, composed of teachers and/or educators who train those entering the profession, generated the following list of KSAs:
1. Planning for content understanding 2. Planning to support varied student needs
3. Planning assessments to monitor and support student learning 4. Demonstrating a positive and engaging learning environment 5. Engaging students in learning 6. Deepening student learning while teaching 7. Subject-specific pedagogy 8. Analyzing student work 9. Providing feedback to guide learning 10. Supporting students’ use of feedback 11. Using knowledge of students to inform planning 12. Analyzing teaching 13. Using assessments to inform instruction 14. Identifying and supporting language demands 15. Using evidence of language use to support content understanding
These edTPA KSAs served to inform refinements to the design and development of edTPA. The assessment instruments’ tasks and scoring rubrics directly align to these KSAs. As a form of confirmatory evidence, job analysis activities were conducted to examine the links between these KSAs
edTPA ANNUAL ADMINISTRATIVE REPORT Data range: 1/1/2014 - 12/31/2014
21
and teachers’ actual work. The job analysis confirmation serves as evidence supporting the validity of the interpretations made based on the edTPA results.
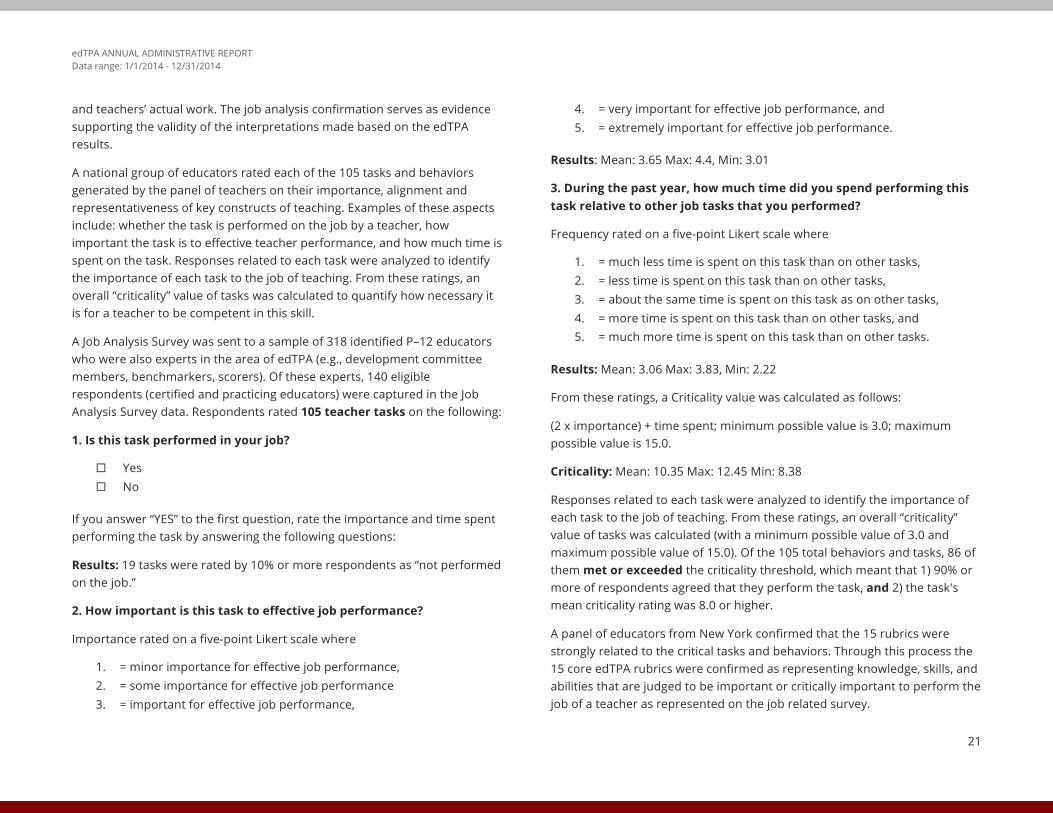
A national group of educators rated each of the 105 tasks and behaviors generated by the panel of teachers on their importance, alignment and representativeness of key constructs of teaching. Examples of these aspects include: whether the task is performed on the job by a teacher, how important the task is to effective teacher performance, and how much time is spent on the task. Responses related to each task were analyzed to identify the importance of each task to the job of teaching. From these ratings, an overall “criticality” value of tasks was calculated to quantify how necessary it is for a teacher to be competent in this skill.
A Job Analysis Survey was sent to a sample of 318 identified P–12 educators who were also experts in the area of edTPA (e.g., development committee members, benchmarkers, scorers). Of these experts, 140 eligible respondents (certified and practicing educators) were captured in the Job Analysis Survey data. Respondents rated 105 teacher tasks on the following:
1. Is this task performed in your job?
¨ Yes ¨ No
If you answer “YES” to the first question, rate the importance and time spent performing the task by answering the following questions:
Results: 19 tasks were rated by 10% or more respondents as “not performed on the job.”
2. How important is this task to effective job performance?
Importance rated on a five-point Likert scale where
1. = minor importance for effective job performance, 2. = some importance for effective job performance 3. = important for effective job performance,
4. = very important for effective job performance, and 5. = extremely important for effective job performance.
Results: Mean: 3.65 Max: 4.4, Min: 3.01
3. During the past year, how much time did you spend performing this task relative to other job tasks that you performed?
Frequency rated on a five-point Likert scale where
1. = much less time is spent on this task than on other tasks, 2. = less time is spent on this task than on other tasks, 3. = about the same time is spent on this task as on other tasks, 4. = more time is spent on this task than on other tasks, and 5. = much more time is spent on this task than on other tasks.
Results: Mean: 3.06 Max: 3.83, Min: 2.22
From these ratings, a Criticality value was calculated as follows:
(2 x importance) + time spent; minimum possible value is 3.0; maximum possible value is 15.0.
Criticality: Mean: 10.35 Max: 12.45 Min: 8.38
Responses related to each task were analyzed to identify the importance of each task to the job of teaching. From these ratings, an overall “criticality” value of tasks was calculated (with a minimum possible value of 3.0 and maximum possible value of 15.0). Of the 105 total behaviors and tasks, 86 of them met or exceeded the criticality threshold, which meant that 1) 90% or more of respondents agreed that they perform the task, and 2) the task's mean criticality rating was 8.0 or higher.
A panel of educators from New York confirmed that the 15 rubrics were strongly related to the critical tasks and behaviors. Through this process the 15 core edTPA rubrics were confirmed as representing knowledge, skills, and abilities that are judged to be important or critically important to perform the job of a teacher as represented on the job related survey.

edTPA ANNUAL ADMINISTRATIVE REPORT Data range: 1/1/2014 - 12/31/2014
22
Construct Validity
Based on this foundation and design process, edTPA is a subject-specific performance assessment that evaluates a common set of teaching principles, teaching behaviors, and pedagogical strategies. The rubrics of the assessment are divided into three tasks that assess the integrated cycle of planning, instruction, and assessment that underlies teaching. Exploratory Factor Analyses (EFA) of 2013 field test data provided support for the common underlying structure of edTPA that unifies all rubrics, as well as for the three-task structure (see pg. 22 of the 2013 edTPA Field Test Summary Report). Confirmatory Factor Analyses (CFA) as well as a Partial Credit IRT model were conducted using data from portfolios submitted in 2014, both described in the “Internal Structure” section below. Both of these models confirmed that the tasks are measuring a common unifying teaching construct and that there are three common latent constructs (planning, instruction, and assessment) that are appropriately assessed by the rubrics which make up each of the three tasks. These analyses confirm the intended design and structure of edTPA and provide evidence that edTPA scores measure key job-related teaching skills that are used to evaluate a candidate’s overall readiness to enter the profession of teaching.
In addition to the evidence presented in the Field Test Summary Report and described above, the edTPA Review of the Research, developed by SCALE staff with input from educators and researchers, is now available as a resource that identifies foundational research literature that informed the development of edTPA and ongoing validity research. The extensive literature review cited provides a foundation for the common edTPA architecture used across 27 different subject-specific licensure/certification areas and the fifteen shared rubric constructs that define effective teaching. The document includes foundational texts in the field relevant to each performance task (planning, instruction, and assessment) and rubrics. The studies cited provide an empirical examination of the constructs including reviews that summarize the state of the research evidence in that field, and professional papers, chapters, and books that make research-based recommendations for practice. The first section of the review presents
relevant literature and research that speaks to the role of assessment in teacher education and student learning. The sections following are organized according to the three edTPA tasks (planning, instruction, and assessment), and by rubric within each task and provide a strong basis for the teaching competencies used in edTPA.
Consequential Validity
edTPA is intended to be embedded in a teacher preparation program as an educative tool and support system for candidates, faculty, and programs. Evidence of validity, then, must come from examining how use and implementation of edTPA impact program curricula, faculty, and teacher candidates. Numerous scholars have outlined the benefits of high-quality formative performance assessment and the opportunities for improvement that common standards, experience of implementation, and use of data gathered can provide (e.g., Darling-Hammond, 2010; Darling-Hammond & Falk, 2013; Pecheone & Chung, 2006; Peck, Gallucci, Sloan, & Lippincott, 2009; Peck, Singer-Gabella, Sloan, & Lin, 2010; Sato, 2014). Several studies have now verified these claims using their experience with edTPA as well as PACT, the precursor to edTPA that shares the same architecture and assesses many of the same constructs. Reports by these programs indicate that thoughtful integration of PACT/edTPA knowledge, skills, and constructs into pre-service preparation programs has improved the content, methods, and supports of program curriculum (Gillham & Gallagher, 2015; Peck & McDonald, 2013; Sloan, 2013). The use of PACT and edTPA has been reported to support program improvement and inquiry, collaboration within and between institutions around program structure, practice, and quality, as well as reflection on teacher candidates’ performance and needs (Chung, 2008; Kleyn, Lopez, & Makar, 2015; Liu & Milman, 2013; Peck, Gallucci, & Sloan, 2010; Sloan, 2013; Stillman, Anderson, Arellano, Lindquist Wong, Berta-Avila,
¡ edTPA assesses constructs relevant to and aligned with standards determined by the profession.

edTPA ANNUAL ADMINISTRATIVE REPORT Data range: 1/1/2014 - 12/31/2014
23
Alfaro, & Struthers, 2013). By providing delineated standards and rubrics, “…expectations of candidates are operationalized. The standards were always there; the difference is that programs are now explicit about what it means to do well.” (Dr. Amee Adkins, Illinois State University, personal communication, June 25, 2015). edTPA enables programs to clearly communicate expectations to students, and to engage in conversations and collaborations across programs and institutions using a common language. These studies also report some challenges or unintended consequences experienced by programs, faculty, and candidates as they work to integrate edTPA requirements into existing practice and navigate the pressures that come with high-stakes policy – findings that are well documented in student assessment. However, edTPA was designed as a support and an assessment program and targeted attention to capacity building and implementation was explicitly built into the system to help mitigate the high-stakes use of edTPA — from a system of compliance to a system of inquiry.
Policy and approach to implementation play important roles in the impact of the assessment on the program and the teacher candidates’ experiences (Peck, Gallucci, & Sloan, 2010; Whittaker & Nelson, 2013). A recent study has found that candidate engagement with these opportunities to learn implicit in the process of taking edTPA are mediated by the attitudes and actions of faculty, cooperating teachers, and field supervisors (Lin, 2015). Evidence supports the inference that despite challenges and workload, teacher candidates report that constructing their PACT/edTPA portfolios has expanded their understanding of pedagogy and assessment of student learning, caused them to reflect more deeply on their instruction, and that they expected this experience to be useful to their future practice (Chung, 2008; Darling-Hammond, Newton, & Chung Wei, 2013; Lin, 2015).
Concurrent Validity
Evidence of concurrent validity examines the inference that edTPA scores accurately reflect a candidate’s readiness to teach by testing whether total scores are related to other indicators of instructional capability. Empirical examinations of this type of evidence require datasets with a substantial sample size that include variables from various measures of performance, as well as variables that allow for the control of other sources of variance such as demographic categories and prior skills and knowledge. These studies are now beginning to emerge: a study from Illinois State University has found that candidates’ edTPA scores correlate with GPA, scores on a content knowledge assessment, and scores on a pedagogy and skills assessment (Adkins, Klass, & Palmer, 2015). Findings presented later in this report also indicate that demographic variables are not associated with differences in edTPA scores. Another study that focused on supervisors’ predictions about their candidates’ performance on PACT found that these predictions accurately predicted PACT scores (Pecheone & Chung, 2006). As programs gather more data, several studies around the country are being conducted that will add to this collection of evidence. SCALE is currently working on a state-wide concurrent validity study with the state of Georgia to examine the relationship between edTPA scores and other markers of performance completed during pre-service teacher preparation that can provide evidence of convergent and divergent validity, as well as interactions with demographics, program type, and degree type. Dissemination of these results as they become available will inform all programs and states working with teacher candidates taking edTPA.
“…expectations of candidates are operationalized. The standards were always there; the difference is that programs are now explicit about what it means to do well.”
(Dr. Amee Adkins, Illinois State University, on how edTPA has impacted Educator Preparation Programs)
¡ A review of theory, existing research, and latest analyses provide evidence of validity which support the inferences and underlying assumptions of edTPA design and use.

edTPA ANNUAL ADMINISTRATIVE REPORT Data range: 1/1/2014 - 12/31/2014
24
Predictive Validity
Predictive validity studies provide another method of validating the use of edTPA scores as markers of readiness to teach by examining their ability to predict student learning and instructional practice on the job. These studies are routinely conducted after the assessment has been in operational use for several years. Predictive validity evidence for PACT was revealed in a study by Darling-Hammond, Newton, & Chung Wei (2013), which found that teachers’ PACT scores predict growth in their students’ math and literacy achievement using value-added statistical modeling. Preliminary data from studies by Benner and Wishart (2015) has revealed that edTPA scores predict candidates’ ratings of teacher effectiveness, as measured by a composite score that combines students’ performance data and classroom observations.
Predictive validity studies are not a precursor to implementation of licensure assessments of teacher candidates, as it is not possible to analyze predictive validity during clinical practice, as candidates are not the teacher of record during this time. Additionally, analyzing these relationships requires gathering data on a sample that is large enough to determine consistent, generalizable patterns. Once candidates become teachers of record, the examination of predictive validity is more robust if researchers are able to follow candidates into their teaching practice for several years in order to obtain more stable estimates of student learning and teacher effectiveness as captured by student test scores and other assessments of performance, (e.g., observations of teaching practice, classroom climate surveys, supervisor, co-teacher, student, peer evaluations). SCALE is committed to conducting predictive validity studies that follow candidates into employment if the state database enables linking teachers to classrooms and student achievement – providing states grant access to these data. SCALE is currently working with two states to establish data sharing protocols that will make these studies possible. The edTPA National Technical Advisory Committee of leading psychometricians in the field advises SCALE on the design of studies that examine the impact of edTPA implementation as an assessment and educational tool on educator preparation programs, faculty, candidates, P-12
educators, and P-12 students’ achievement. The standing edTPA Research Consortium comprised of faculty representatives across states using edTPA work with SCALE to identify and collaborate on research efforts relevant to teacher education.
Internal Structure
The use of edTPA rubric, task, or overall scores depends on the intended purpose as well as the policy and approach to implementation of each program and state. The score on a particular rubric provides a candidate’s level of readiness on the particular skill/ability being measured, and informs conversations about the strengths and weaknesses of a particular candidate or a preparation program. Scores on each of the rubrics and total scores for the three edTPA tasks are reported to candidates, programs, and states to inform decisions and level of competency for each of the three components of the teaching cycle (planning, instruction, and assessment). The final score is the summed score across rubrics in all three tasks, and is used as an overall measure of readiness to teach. As a valid assessment, the claim is made that the scoring procedure appropriately summarizes relevant aspects of performance and is applied accurately and consistently for all candidates. This is based on evidence that the scoring rules are appropriate and that the data fit the scoring model. The following analyses of the internal structure of edTPA provide psychometric evidence that support the structure of levels within each rubric, the fit of rubrics within the three edTPA tasks, and the use of a single summed total score to represent candidates’ overall performance. The accuracy and consistency of the scoring process is supported by the scoring model, scorer training, double scoring procedures, and quality management outlined in the “edTPA Scoring 2014” section above.
Confirmatory Factor Analyses
Exploratory factor analyses of 2013 field test data provided support for the use of a total score on edTPA to summarize a candidate’s performance, as well as for the underlying task structure (see pg. 22 of the edTPA 2013 Field Summary Report). To confirm these factor structures, Confirmatory Factor Analyses (CFAs) were conducted using data from portfolios submitted in

edTPA ANNUAL ADMINISTRATIVE REPORT Data range: 1/1/2014 - 12/31/2014
25
2014. CFAs test whether patterns (correlations) among observed scores on a set of test items conform to hypothesized structures (Brown, 2006), providing validity evidence based on a test’s “internal structure” to support score interpretations (AERA, APA, & NCME, 2014).
These analyses included 18,436 first-time edTPA submissions, and excluded incomplete portfolios and portfolios with condition codes.2 In cases where a portfolio was double-scored, only the first rater’s score is included in the analyses. CFA models were estimated based on the observed sample covariance matrix among rubric scores for the 2014 administration cycle. Models were estimated using maximum likelihood estimation with standard errors and scaled chi-square fit statistics, as implemented in the R package “lavaan” (Rosseel, 2012), to fit all models.
Based on the design and interpretation of the edTPA total score, a 1-factor model in which all rubric scores load on a single latent factor was estimated. To account for the task-based design and structure of edTPA portfolios, a 3-factor model with correlated factors and with each rubric loading only on its associated task was also estimated. All factor loadings in both models were positive and statistically significant as hypothesized (all standardized loadings were greater than 0.5 in the 1-factor model and greater than 0.6 in the 3-factor model). Table A in Appendix A presents the estimated standardized factor loadings for the 1- and 3-factor models in the full sample of portfolios. Table B presents the estimated correlations among the task factors in the 3-factor model, which are also strongly positive and statistically significant. The large magnitude of the correlations further supports the interpretation that edTPA rubrics measure three highly interrelated sub-dimensions – planning, instruction, and assessment – of a single readiness to teach construct.
2 Condition codes are applied to one or more rubrics when the candidate's materials do not comply with edTPA evidence requirements (e.g., inaudible video, missing artifact, wrong artifact) and are therefore, unscorable.
IRT: Partial Credit Model
A polytomous item response theory (IRT) model, the partial credit model (PCM; Masters, 1982), was fit to the same sample of edTPA submissions included in the CFA models. The PCM provides a statistical model of the probability that a candidate earns each possible rubric score as a function of a single, continuous, underlying dimension “theta.” The PCM been used to evaluate the internal structure of similar portfolio-based assessments of readiness to teach such as PACT (Duckor et al., 2014). In the PCM the underlying theta variable is a direct function of the total score, which allows the theta score to function as a statistical representation or summary of “readiness to teach” as measured by the total sum score on edTPA. The PCM thus provides information about the relationship between candidates’ readiness to teach as measured by a total sum score and edTPA rubrics consistent with the edTPA policy for summing across rubrics and subject area fields to evaluate candidate performance.
It is important to note that this model was used to further examine the theoretical foundation that underlies the use of edTPA total scores as a representation of a common construct of teaching effectiveness, and that the rubric levels are distributed in the expected pattern of difficulty. edTPA scores are not derived using IRT analyses; total scores are an aggregate of all rubric scores across the assessment. The dataset analyzed here contains a single score for each candidate and this single score is derived from the ratings of a single scorer. edTPA rubrics were designed to be independent measures of the teaching constructs measured in edTPA; it is possible that the rubric scores may be affected by the presence of some individual rater effects due to the single scorer approach used to score edTPA. However, the design of edTPA is a reflection of a theory of action that is grounded in the licensure approach and over a decade of experience with the InTASC portfolio and PACT program in California which is designed to provide higher education faculty with a comprehensive profile of a candidate’s performance within an authentic and interconnected cycle of teaching.
Finally, the results presented below are based upon aggregating data across credential areas. Again, edTPA is used based on a single total score

edTPA ANNUAL ADMINISTRATIVE REPORT Data range: 1/1/2014 - 12/31/2014
26
calculated equally across fields and so this analysis provides evidence about how this measure functions overall. However, we also plan to explore in future analyses l fit models separately by credential areas. We note, however, that there are not enough candidate submissions in most edTPA credential areas to fit the PCM with stable estimates. A primary limitation is that as sample sizes become smaller, there are sometimes no observed scores in all possible categories for all rubrics, and not all relevant parameters can be estimated. As more candidates complete edTPA, further analyses by subgroups will become more possible.
The PCM was used to investigate the following primary questions:
• How well does a unidimensional PCM fit edTPA data? • Do all rubrics adequately fit the model? • Are the rubric score-point thresholds distributed across the latent
theta distribution, suggesting the rubrics are well-matched to the candidate performance distribution and provide a good measurement of each candidate’s level of performance?
• Is the precision of proficiency estimates consistent across the range of theta? Does an overall estimate of “reliability” suggest there is sufficient precision in the overall scores to distinguish among candidate performances?
The unidimensional PCM was fit to the 2014 sample of 18,436 candidates. Models were estimated using marginal maximum likelihood as carried out with the “TAM” package in R (Kiefer, Robitzsch, & Wu, 2015), which uses statistical approaches based on those in the software program Conquest (Wu, Adams, Wilson, & Haldane, 2007). As noted above, edTPA scores are derived from the ratings of a single scorer who scores the entire portfolio; rubric scores may reflect some rater effects. Additionally, the results presented below are based upon aggregating data across credential areas. Because edTPA is used based on a single total score calculated equally across fields with 15 rubrics, this analysis provides evidence about how this measure functions overall.
To evaluate fit, INFIT mean square statistics were computed for each rubric and examined to identify rubrics with INFIT values less than 0.75 or greater than 1.33, which would suggest a lack of fit. Plots of expected and observed rubric scores across the theta range were compared across the theta range to identify potential model misfit. A Wright Map depicting the distribution of candidate proficiency estimates alongside rubric threshold parameter estimates was inspected to determine whether: a) rubric thresholds conformed to the expected ordering, and b) whether the rubric thresholds for each score point were well-distributed across the range of the theta distribution. Finally, to summarize precision of theta estimates, the test information function and conditional standard error of estimate were plotted across the range of the theta distribution and a person separation reliability index was estimated.
All rubric INFIT mean square statistics were within the range 0.90 to 1.15 (mean = 1.00), suggesting appropriate model-data fit for the rubrics, which was also supported by the plots of observed vs. expected scores. Inspection of the Wright Maps and rubric parameter estimates showed the hypothesized ordering of rubric thresholds and demonstrated that the Thurstonian thresholds (proficiency level at which a candidate has a 50% chance of scoring above a given score level) were located across the entire range of estimated candidate performance on the theta scale (see Appendix A). The test information function (and hence standard error of measurement in the theta metric) was consistent across the range of candidate performance. To summarize, these results provide information about the level of performance at which candidates are likely to move from one possible rubric score to the next. The fact that these points are distributed across the theta distribution affirms that edTPA rubrics are constructed to provide useful discriminating information about candidate performance at different levels of overall performance. Person separation reliability, similar to Cronbach’s alpha, was estimated at 0.917, indicating a high level of consistency.

edTPA ANNUAL ADMINISTRATIVE REPORT Data range: 1/1/2014 - 12/31/2014
27
edTPA Handbook Structure and Single Passing Standard
The design of edTPA is based on a long history of research, practice, and publications in the area of subject matter and pedagogical practice. Building on earlier portfolio- and performance-based assessments of teaching, including the National Board for Professional Teaching Standards, the InTASC portfolio, and PACT, the design methodology of edTPA was created by Stanford University faculty and staff with substantive advice from national design teams that included university faculty, clinical supervisors, and P-12 educators. edTPA is founded on universal principles of effective teaching with a focus on subject-specific student learning and principles from research and theory (for a review of literature of effective teaching and common constructs, see the Review of Research on Teacher Education: edTPA Task Dimensions and Rubric Constructs). While edTPA handbooks articulate specific instructions that reference the candidate’s subject matter, the theoretical and philosophical underpinnings remain constant – to assess three distinct but interrelated and essential dimensions of a candidate’s developing teaching practice. These three dimensions – planning, instruction, and assessment – are rooted in the literature and a long tradition of developing teacher performance assessments. All credential areas include three tasks (planning, instruction, and assessment) and with the exception of World and Classical Languages, all credential areas have 5 rubrics that assess each task. Elementary Education has one additional task, but the first three tasks remain common. World and Classical Languages exclude rubrics that reference academic language use (4 and 14), because this is incorporated throughout the teachers’ practice as a language instructor.
The choice to use a compensatory scoring model and a single passing standard is a substantive and policy-based choice, rather than a purely statistical one. It intentionally chooses to treat candidates who earn equivalent total scores as demonstrating equivalent readiness to teach. This acknowledges that candidates may be stronger in one dimension than another, but if their overall performance reaches a given threshold they will be considered to have demonstrated a sufficient level of performance. Each of the 27 edTPA handbooks embeds a subject-specific focus into a common architecture addressing the integration of planning, instruction and assessment. edTPA rubrics reflect this common architecture and subject-specific focus in their design.
As a performance-based assessment system for learning, edTPA is designed to engage candidates in demonstrating their understanding of teaching and student learning in authentic ways. Unlike other generic evaluations of teaching, edTPA is not a “one size fits all” assessment system; rather, it focuses on subject-matter and pedagogy modeled after the development of the NBPTS assessments. An analysis of edTPA rubrics revealed an 85.7% overlap of common language across rubrics, across content areas. Although several rubrics have subject-specific language embedded within the rubric criteria, the construct of the rubric remains identical indicating that there is a deep structure to the design of edTPA that is shared across all licensure fields. It is this ‘deep structure’ claim that drove the design and development of the NBPTS portfolio assessment which has been supported through a number of research studies over the 25-year plus history of the Board. Rubrics with the same construct that vary only by subject-specific phrases embedded within the level descriptors are noted in the tables below. Most rubrics had an 80% overlap in language with the exception of rubric 9 – Subject Specific Pedagogy. Rubric 9 is a subject-specific rubric designed to assess subject-specific constructs identified by the design team for each content area and informed by pedagogical standards determined by national subject matter organizations.
¡ All edTPA handbooks follow the same architecture and examine the same underlying constructs, with subject specific elements that align to standards and expectations in that field. Differences in performance across content fields are investigated systematically in a multi-pronged approach.

edTPA ANNUAL ADMINISTRATIVE REPORT Data range: 1/1/2014 - 12/31/2014
28
Candidate Performance Overall Scores
The following figure presents the score distribution of 18,436 edTPA portfolios, in fields scored based on 15 rubrics and submitted January 1 - December 31, 2014, the first full calendar year for which edTPA was used consequentially. This represents the distribution of final scores on all complete portfolios scored on five separate rubrics within each of the three major edTPA tasks: planning, instruction, and assessment. There are five levels of possible performance for each rubric, with level 3 characterizing “ready to teach”, and a total score range from 15 to 75. This figure shows that
scores are normally distributed across this range. The dip in scores around 35-41 is an artifact of the double scoring process automatically applied to all portfolios that fall within the double-scoring band established based on the national cut score of 42 and standard error of measurement of 5. Figures presenting further information on the distribution of these portfolios (distribution based on first score only, and distribution within cut band) are found in Appendix B.
This document includes some materials that are test secure and/or confidential for other reasons . As such, it should not be circulated to unauthorized persons . T he accompanying notes are an integ ral part of this document.
F requency
0
100
200
300
400
500
600
700
800
900
1000
1100
1200
1300
1400
Total S core (15 R ubrics )
15
20
25
30
35
40
45
50
55
60
65
70
75
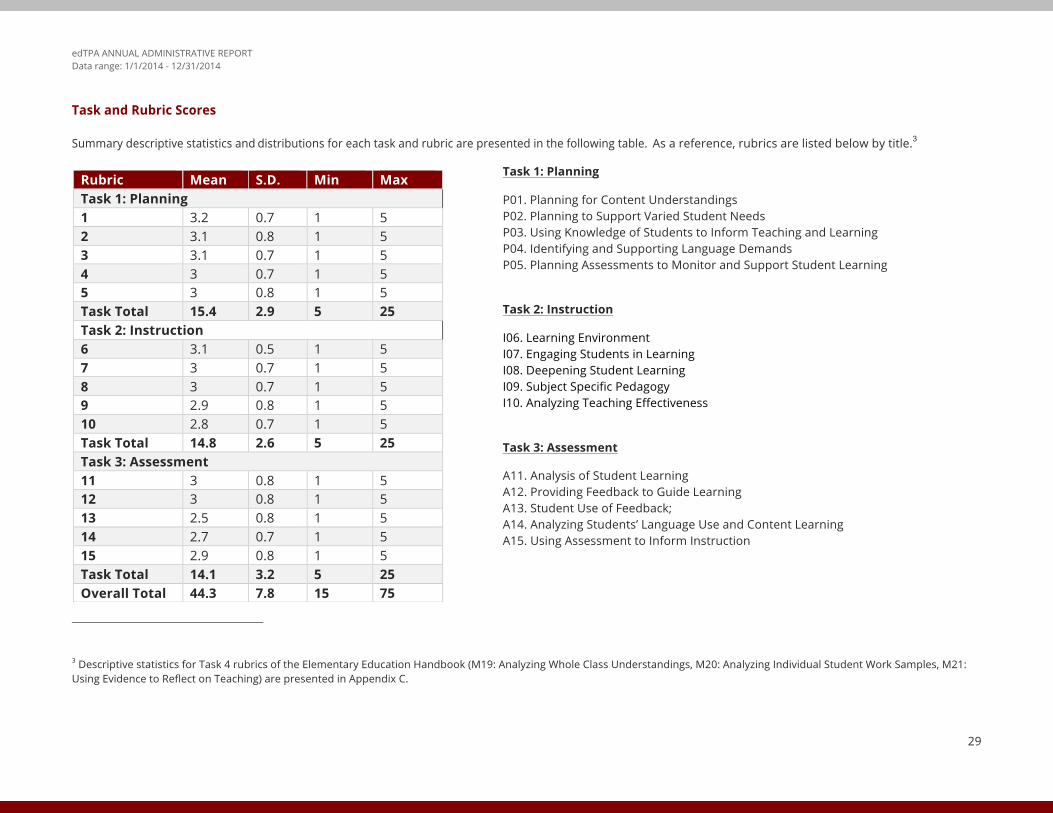
edTPA ANNUAL ADMINISTRATIVE REPORT Data range: 1/1/2014 - 12/31/2014
29
Task and Rubric Scores
Summary descriptive statistics and distributions for each task and rubric are presented in the following table. As a reference, rubrics are listed below by title.3
Task 1: Planning
P01. Planning for Content Understandings P02. Planning to Support Varied Student Needs P03. Using Knowledge of Students to Inform Teaching and Learning P04. Identifying and Supporting Language Demands P05. Planning Assessments to Monitor and Support Student Learning
Task 2: Instruction
I06. Learning Environment I07. Engaging Students in Learning I08. Deepening Student Learning I09. Subject Specific Pedagogy I10. Analyzing Teaching Effectiveness
Task 3: Assessment
A11. Analysis of Student Learning A12. Providing Feedback to Guide Learning A13. Student Use of Feedback; A14. Analyzing Students’ Language Use and Content Learning A15. Using Assessment to Inform Instruction
3 Descriptive statistics for Task 4 rubrics of the Elementary Education Handbook (M19: Analyzing Whole Class Understandings, M20: Analyzing Individual Student Work Samples, M21: Using Evidence to Reflect on Teaching) are presented in Appendix C.
Rubric Mean S.D. Min Max Task 1: Planning 1 3.2 0.7 1 5 2 3.1 0.8 1 5 3 3.1 0.7 1 5 4 3 0.7 1 5 5 3 0.8 1 5 Task Total 15.4 2.9 5 25 Task 2: Instruction 6 3.1 0.5 1 5 7 3 0.7 1 5 8 3 0.7 1 5 9 2.9 0.8 1 5 10 2.8 0.7 1 5 Task Total 14.8 2.6 5 25 Task 3: Assessment 11 3 0.8 1 5 12 3 0.8 1 5 13 2.5 0.8 1 5 14 2.7 0.7 1 5 15 2.9 0.8 1 5 Task Total 14.1 3.2 5 25 Overall Total 44.3 7.8 15 75

edTPA ANNUAL ADMINISTRATIVE REPORT Data range: 1/1/2014 - 12/31/2014
30
Descriptive Summary by Task and Rubric
The average edTPA score across 18,436 portfolios from fields with 15-rubric handbooks was 44.3, with a standard deviation of 7.8. This average performance shows growth from the 2013 field test data where the average score was 42.8 (SD = 8.17). Scores ranged across the entire range of possible scores, from 15 to 75. These findings parallel those from the 2013 field test, showing that candidates performed most highly on the planning task, followed by the instruction task, and then the assessment task. This is also consistent with other studies and literature in teacher education that identifies the evaluation and response to students’ learning as one of the more challenging elements of teaching (Black & William, 1998; Mertler, 2009). Based on the national recommended cut score of 42, the pass rate for candidates who submitted an edTPA portfolio in 2014 was 72% across all states, and 76% in states using the assessment consequentially.
Performance by Content Field
The graph to the right shows total score means by subject area field for edTPA portfolios submitted January 1 - December 31, 2014, in fields scored based on 15 rubrics. Data reflect complete submissions in fields with sample size (N) > 100. For double-scored portfolios, the average score across the two was used. Bars represent scores one standard deviation (SD) below and one SD above the mean. The scores were generally higher in secondary teaching fields than in most elementary and middle childhood fields.
A regression model was run to examine how much variance in total scores is explained by content field in which the assessment was taken. This model was significant, F(22,12028) = 41.09, p < .01, accounting for 6.99% of variance in total scores (R2 = .0699). Tables in Appendices D and E provide mean candidate performance, an abbreviated distribution of total scores for national fields, and distributions of rubric-level scores and condition codes reported by field. Due to differences in sample size, content knowledge demands, and low numbers of submissions in some fields, comparisons across fields should be approached with caution.
All edTPA handbooks examine the same underlying constructs and follow the same architecture with 80% overlap in content, with particular subject-specific elements that align to standards and expectations for pedagogy and student learning in that field accounting for the other 20%. Patterns of
Con
tent
Fie
ld
Early Childhood
Elementary Education
Elementary Literacy
Elementary Mathematics
English as an Additional Language
K-12 Performing Arts
K-12 Physical Education
Middle Childhood English-Language Arts
Middle Childhood History/Social Studies
Middle Childhood Mathematics
Middle Childhood Science
Secondary English-Language Arts
Secondary History/Social Studies
Secondary Mathematics
Secondary Science
Special Education
Visual Arts
Total Score (Mean +- 1 SD) 60555045403530
Page 1

edTPA ANNUAL ADMINISTRATIVE REPORT Data range: 1/1/2014 - 12/31/2014
31
performance across content fields are confirmed systematically in a multipronged approach:
1. Factor analyses models of latent structure are reviewed for each field with appropriate sample size.
2. Summary data, distributions, and patterns of overall scores, tasks, and rubrics are compared across fields for flags of outlier behavior.
3. Indices of reliability (internal consistency, exact and adjacent agreement by rubric, kappa Ns) are reviewed for each field with appropriate sample size.
4. Scoring trainers and supervisors are consulted to confirm scoring and backreading processes and flag any recurring questions from scorers.
5. Experts in each profession are consulted to review the data, and to discuss alignment of the handbook to the standards and expectations of the profession.
6. Input from programs and faculty using edTPA via the Online Community at edtpa.aacte.org and email to SCALE or AACTE staff are reviewed.
7. Review of and clarification to handbooks, scorer training, and support materials is conducted annually based on all quantitative and qualitative data.
Special Education Performance Examined
Based on requests from the field, a deep investigation into the score performance in the field of Special Education has been conducted. Data on performance across different subject fields indicates that the scores of candidates taking edTPA in Special Education tend to be lower than those in other high incidence fields. To examine this outcome we explored many factors that might help interpret the candidate performance including preexisting differences in the candidates going into the field, in requirements and standards of the field, in handbooks, in scorer consistency, in program curricula and structure, and/or in the demands and challenges inherent in
serving this widely diverse student population. Of course these systems and causal mechanisms are likely to be interrelated. SCALE has taken a multipronged approach to investigate this trend and potential contributing factors:
• Inter-rater reliability: Analyses of randomly double-scored Special Education portfolios indicate that agreement rates between independent scorers and Kappa N estimates meet standards of total agreement > 90%, and kappa n > .80. Reliability data for each rubric by field is used to inform scorer accuracy as well as communication with trainers, and supervisors to guide new scorer training revisions.
• Differential item analyses: Analyses were run to examine systematic differences in rubric difficulty for candidates with same total scores. These analyses confirmed that scores were systematically lower in Special Education across all rubrics. The rubrics with the largest differences when compared to scores in other fields were rubrics requiring the candidate to attend to two learning targets for Special Education students (rubrics 1, 2, 3, 5, 11, and 15.)
• Comparisons of performance patterns across all content fields: Analyses were conducted to test whether rubrics appeared to be differentially harder (or easier) for candidates taking edTPA in Special Education. These analyses indicated that candidates taking edTPA in Special Education did not systematically earn higher or lower scores by rubric, when compared to other candidates with the same total score in other fields.
• Breakdown of demographic subgroups represented within field: The breakdown of candidates by gender, ethnicity, teaching context, primary language, and level of education of candidates taking Special Education edTPA are comparable to that in other fields. In other words, the pattern of lower scores in Special Education cannot be attributed to the under- or over-representation of any particular subgroup within the pool of candidates taking edTPA in this field.

edTPA ANNUAL ADMINISTRATIVE REPORT Data range: 1/1/2014 - 12/31/2014
32
• Review of differences within field placements across programs and states: Differences in policy, preparation of candidates, structure of the field, and approach to edTPA implementation all contribute to how candidates score within and across fields. The pattern of performance seen nationally does not represent that of every state or every program; in some programs, scores on the Special Education edTPA are equal to or exceed the mean for all fields.
• Feedback, review and input from: o State Technical Advisory Committees (NY, OH, CA, and WA) o Scorers, trainers, scoring supervisors via survey and the
Online Community o National User Group/Design Team, key state leads group,
state advisory groups and edTPA coordinators and the National Policy Advisory Board
o Subject-specific design teams; scoring supervisors, trainers, and scorers; a Council for Exceptional Children (CEC) advisory group of special education experts; and comments, questions, and suggestions indicating areas of confusion from faculty and candidates
o A group of Georgia special educators convened for orientation to the edTPA handbook by The Collaboration for Effective Educator Development, Accountability, and Reform (CEEDAR)
o A committee of special educators convened by the state of New York
These investigations supported the claim that the edTPA Special Education Handbook assesses constructs relevant to, and aligned with, the standards of the profession, and that it meets the reliability and validity criteria put forward by the Standards for Educational and Psychological Testing (AERA, APA & NCME, 2014). Based on these data and sources of feedback there were areas of the Handbook that should be modified to address the comments
from the expert review of the handbooks to clarify directions and understandings. The edTPA Special Education design team made the following revisions to the Special Education Handbook for 2015-16 based on the review above:
• Change from two learning targets to one learning goal plus planned support.
• Change from breaking down expressive/receptive communication skill into subskills to a focus on support for focus learner use of the expressive/receptive communication skill to participate in learning tasks and/or to demonstrate learning.
• Work sample chosen to illustrate analysis and feedback in Assessment Task 3, changed from the final assessment to any assessment during the learning segment.
• Some rubrics modified in line with minor generic rubric changes made to all handbooks.
Input from the groups, educators, and experts in the field listed above have emphasized several aspects of being an educator in Special Education that are unique to this field. Special Education is predicated upon individualized, differentiated instruction. Candidates work with and must be ready to teach learners across a wide spectrum of diagnosed needs, ages, and learning contexts. This variety of learner needs and content must be considered when designing curriculum. Teachers in this field are also dependent on the students’ IEPs which are often very general, and may not explicitly tie goals and supports to specific learning needs. Further, placements of Special Education teachers often require collaboration with the general education teacher, which may further complicate planning and instruction. These factors have implications for the design of common assessment standards, the programs preparing candidates, as well as for the candidates themselves as they enact their lessons. edTPA provides a structure for programs and their P-12 partners to use program-specific data together with candidate’s artifacts and commentaries to inform much-needed discussion about program, policy, and systems of support for teachers entering this field.

edTPA ANNUAL ADMINISTRATIVE REPORT Data range: 1/1/2014 - 12/31/2014
33
Performance by Consequential Use
edTPA portfolios officially scored in the 2014 operational year represent submissions from candidates in 17 states. Of the 18,436 portfolios scored, 6,385 were submitted by candidates in states that do not currently have policy for edTPA use, and 12,051 were submitted in states with consequential policy. States without policy with submissions in 2014 are AR, CO, GA, IL, MD, NC, NJ, OH, UT, WI, and WY. States with consequential policy and submissions in 2014 are CA, IA, MN, NY, TN, and WA. Appendix E presents the approximate percentage of portfolios coming from each state. State policy mandating edTPA for purposes of teacher licensure and/or program evaluation results in greater consistency for use and implementation. It was therefore hypothesized that submissions from states with official policy would have higher average scores than those from states without edTPA policy. The table below shows overall performance (mean, standard deviation, and number of submissions) by field in states without state-wide policy for use of edTPA, and states where such policy exists.
As predicted, edTPA scores were significantly higher in states with policy requiring edTPA. This finding is consistent with expectations given the increased consistency of implementation and support structures, as well as levels of effort and motivation, that come about as a result of state-wide policy for consequential assessment. This pattern is present across most content fields (see Appendix F), although low sample sizes in some fields mean that any interpretations or comparisons should be approached with caution at this time. Typically, faculty preparing candidates in states with consequential policy have had more time to become familiar with and utilize edTPA as an assessment and educative tool, as well as to draw upon edTPA resources and build supports for their candidates. It is also an artifact of high-stakes assessment that higher stakes influence higher levels of effort, motivation, and consistency for all stakeholders. Ongoing integration of edTPA by states and EPPs will inform research into the approaches and practices that best facilitate, support, and assess teaching effectiveness of pre-service teaching candidates.
Without State Policy With State Policy
Rubric Mean S.D. Mean S.D
Overall 42.7 7.8 45.0 7.6
Task 1: Planning
1 3.1 0.7 3.2 .7 2 3.0 0.8 3.1 .8 3 3.0 0.7 3.1 .7 4 2.9 0.7 3.1 .7 5 2.9 0.8 3.1 .7 Task Total 15.0 3.0 15.6 2.9
Task 2: Instruction
6 3.1 0.5 3.2 .5 7 2.9 0.7 3.0 .6 8 2.9 0.7 3.0 .7 9 2.8 0.8 3.0 .7 10 2.7 0.7 2.9 .7 Task Total 14.4 2.6 15.0 2.6
Task 3: Assessment
11 2.8 0.8 3.0 .8 12 2.9 0.8 3.1 .8 13 2.4 0.8 2.6 .8 14 2.6 0.7 2.7 .7
15 2.7 0.8 3.0 .8
Task Total 14.1 3.2 14.4 3.2
Overall Total 42.7 7.8 45.0 7.6

edTPA ANNUAL ADMINISTRATIVE REPORT Data range: 1/1/2014 - 12/31/2014
34
Performance by Demographic Subgroups
When submitting an edTPA portfolio for official scoring, the candidate is asked to provide demographic information in several categories: gender, ethnicity, teaching placement context, education level, and primary language. Analyses of performance by subgroup within these categories included only portfolios submitted in states that have policy for consequential use of edTPA. In states without such policy, many factors may affect candidate performance into the assessment of teaching competence such as variability in the level of implementation, support structures, level of effort, and candidate motivation and preparation. The portfolios represented here were submitted in CA, IA, MN, NY, TN, and WA.
The analyses revealed small differences in performance across some of the subgroups, with differences within groups being much larger than differences between groups in all categories. It is important to note the difference in sample sizes of some of the subgroups within each demographic category may affect the ability to generalize these results to the national pre-service teaching population; all estimates of performance should not be overgeneralized and should be interpreted with caution. Further, differences in performance do not take into account any prior or experiential differences in the applicant pool, differences in program quality or preparation of candidates, and other factors that may contribute to a candidate’s score and cause differences in performance. What follows is a description of subgroup performance in the following categories: Teaching Context, Ethnicity, Primary Language, Gender, and Education Level. Finally, a regression analysis was conducted to examine the contribution of these demographic categories in explaining and interpreting edTPA candidate scores.
Teaching Context
Upon submission of their edPTA portfolio, candidates are asked to indicate the context of their teaching placement. Based on these data, an ANOVA was run to analyze whether overall edTPA scores differed based on the teaching context of the candidate. The table below displays mean scores, standard
deviations, and submission volumes by teaching placement categories. Results showed that candidates teaching in urban settings had the highest average scores, while candidates teaching in rural settings had the lowest average scores. The difference between urban and rural, as well as urban and rural/suburban subgroups, was statistically significant (p<.01). There was no significant difference between urban and suburban subgroups. For the ANOVA and Games-Howell post hoc analyses, see Appendix G.
TEACHING CONTEXT N Mean Std. Deviation
Rural 1982 43.05 7.70
Rural/Suburban 1018 43.88 7.73
Suburban 4202 45.51 7.26
Suburban/Urban 1292 45.42 7.83
Urban 3557 45.84 7.65
This finding provides evidence that candidates in urban settings had the highest overall performance, and that candidates whose practice or clinical teaching takes place in rural settings have significantly lower average scores. Different teaching contexts present different sets of experiences and opportunities for a pre-service teacher candidate. Many programs purposefully place students in field experiences in a range of teaching contexts, and vary in their approach to preparing candidates for teaching in different contexts. Therefore depth and breadth of experiences provided by the preparation program should be considered. The process used by each program to select candidates, the resources and supports available, as well as the candidate’s disposition or preference are also likely to play a role in
¡ Data are used to analyze trends in performance by several demographic categories, including gender, ethnicity, teaching placement context, education level, and the candidate’s primary language.

edTPA ANNUAL ADMINISTRATIVE REPORT Data range: 1/1/2014 - 12/31/2014
35
how a candidate performs within a particular teaching context. These data can help programs reflect on how they serve and prepare their candidates and to scaffold conversation about teaching strategies that best support learners across various teaching contexts.
Ethnicity
Data from the 2014 operational year indicated that the large majority of candidates submitting edTPA portfolios were White (79.9%), followed by Hispanic (5.3%), Asian (4.1%) African American (2.8%), and American Indian or Alaskan (.3%), with 2.8% identifying as Multiracial, 1.3% Other, and 3.5% not identifying ethnicity. The disproportionate representation of White candidates and the relative small sample sizes of other groups must be considered when making comparisons or generalizations to other samples or to the general population of teacher candidates.
The table below shows the sample size, average scores, and standard deviations of each subgroup. For the ANOVA and Games-Howell post hoc analyses of these results, see Appendix G.
ETHNICITY N Mean Std. Deviation
African American/Black
339 42.59 7.96
American Indian or Alaskan Native
39 42.56 8.95
Asian or Pacific Islander
496 46.72 6.96
Hispanic 640 44.93 7.53
White 9629 45.00 7.61
Multiracial 336 46.42 7.39
Other 154 44.53 7.90
Undeclared 418 45.97 7.75
Analyses revealed that there was no significant difference between the average scores of White candidates and Hispanic candidates. While the average score of African American candidates was lower than those of other subgroups (p <.01), the fact that African American candidates made up a very small portion of the candidate pool (2.8%) significantly limits our ability to interpret these differences in relationship to the general population of African American candidates.
To determine whether the scores of two groups are meaningfully different from one another it is informative to compare the difference in means of the two groups to their pooled standard deviation. A smaller ratio indicates that there is substantial overlap in the scores of the two groups, and greater variability within each subgroup than between the subgroups. The difference in means between the White and African American subgroups is 2.41 points, and the pooled standard deviation (7.96+7.61)/2= 7.79. The difference in the mean performance of African American and White candidates in this sample, then, is .31 of a standard deviation (2.41/7.79). These findings contextualize the magnitude of the difference and demonstrate that the scores of candidates in these two subgroups overlap substantially. Placing this finding in the context of assessment of teacher education, the gap between average scores of White candidates and other subgroups is smaller than that seen with other more traditional standardized assessments of initial teaching (e.g., Goldhaber and Hansen, 2010). Further, gaps in performance are narrowing over time; the difference in mean scores of African American and White candidates has decreased from 3.02 points in the 2013 field test data to 2.41 points in the 2014 dataset.
The performance of candidates was also examined by subgroup within each teaching context to see whether the pattern of the overall sample was consistently across the different placements (contexts). This examination revealed that the difference in means of the White and Hispanic candidates were consistently less than 1 point within all teaching contexts. There was greater variation in mean differences between African American and White candidates, with differences being greater in rural settings than in suburban settings or urban settings. Of particular note, African American and Hispanic

edTPA ANNUAL ADMINISTRATIVE REPORT Data range: 1/1/2014 - 12/31/2014
36
candidates in urban teaching contexts have significantly higher overall performance than White candidates in rural placements (see Appendix H). As noted in the ‘Teaching Context’ section above, the performance of candidates in rural settings is systematically lower than that in all other contexts, suggesting that further research in this area is needed.
These data reveal overall trends in edTPA performance for this sample; findings should not be overgeneralized to other teacher candidates or across all programs and states participating in edTPA. Educator preparation programs and state agencies are encouraged to use data from their respective populations to conduct further analyses and consider implications. edTPA is committed to providing an equitable assessment that is free of bias and adverse impact. While caution must be taken in making generalizations based on such small sample sizes, these findings are encouraging and provide a foundation for further research. As more data become available, additional research is planned at the state and national levels.
Primary Language
Candidates were asked to identify whether English is their primary language. There was no significant difference in performance between the two groups; those whose primary language is English and those with another primary language scored within .1 points of each other.
PRIMARY LANGUAGE N Mean Std. Deviation
English 11649 45.05 7.62
Other 277 45.00 7.47
This finding suggests that the structure of edTPA handbooks, instructions, and response requirements do not adversely affect candidates who speak languages other than English as their primary language. Overall, edTPA score performance based on language proficiency is a reflection of the candidate’s skills and abilities needed to perform the job of an initial teacher and
appears not to be significantly influenced by a teacher’s proficiency in English.
Gender
In this sample, 76.7% of submissions came from female candidates, and 22% from male candidates, with 1.3% not indicating gender. Female candidates scored higher than their male counterparts; this difference, while small (.93), was statistically significant (p < .01).
GENDER N Mean Std. Deviation
Male 2651 44.34 8.00
Female 9240 45.27 7.48
Follow up analyses reveal that the difference was greatest in rural teaching contexts (2.05 points), and smallest within urban contexts (.33 points); see Appendix H. These findings suggest that the difference in performance by gender may vary based on other variables such as educational background, or preparation program.
Education Level
The achieved level of education prior to taking edTPA was reported by candidates. Candidates holding a doctorate degree had the highest average scores; due to low sample size this subgroup was not included in statistical comparisons of mean difference. Candidates holding a Bachelor’s or Bachelor’s plus additional credits scored significantly higher than candidates with a High School degree/Some college (p < .01). Candidates holding a Bachelor’s or Bachelor’s plus additional credits scored statistically significantly higher than candidates with a Master’s/Master’s plus additional credits (p < .05). For the ANOVA and Games-Howell post hoc analyses, see Appendix G.

edTPA ANNUAL ADMINISTRATIVE REPORT Data range: 1/1/2014 - 12/31/2014
37
EDUCATION LEVEL N Mean Std. Deviation
HS/some College 6096 44.22 7.45
Bachelor's/Bachelor's plus credits
5225 46.01 7.59
Master's/Master's plus credits
697 45.10 8.36
Doctorate 33 48.00 7.80
Due to the significant disparities in the size between the Masters/Master’s plus credits sample and that of the HS/Some college and the Bachelor’s/Bachelor’s plus credits samples, results should be interpreted with caution. One hypothesis is that candidates who take edTPA after earning a Master’s degree may have a background in a different field or have had less coursework and/or student teaching experience prior to taking edTPA. Structure of program curricula, timing of the assessment within the program, and prior experience with pedagogical theory and teaching practice may also play a role in outcomes on an assessment of teaching readiness.
Regression Analysis
Regression analyses are used to determine whether particular variables significantly predict an outcome, and the extent to which these variables explain the differences in outcomes within the sample. To examine the contribution of all demographic factors to the performance of the candidates, a multiple regression model including Teaching Context, Ethnicity, Primary Language, Gender, and Education Level was run to examine the extent to which demographic factors explain the variability in total edTPA scores. It is important to note that a finding that a factor is a
“statistically significant” predictor does not necessarily indicate that this factor makes a substantial or meaningful difference in outcomes. The percent of variance explained (Delta R2) by each factor is therefore presented here to describe the extent to which each variable explains the differences in candidates’ edTPA scores. The overall model was statistically significant, F(21,12029) = 23.36, p<.01, indicating that this model predicts edTPA scores better than chance alone. The following table presents each factor included in the model, and the percentage of variance in total scores accounted for by each factor and by the overall model.
FACTOR VARIANCE EXPLAINED (%)
School Context 1.02 Ethnicity 0.47 Gender 0.64 Education Level 0.83 Primary Language 0.02 Overall Model 3.92
Overall, this model accounts for only 3.9% of the variance in total scores (R2 = .039); 96.1% of the variability in scores is explained by other factors not accounted for by the variables included in this model. This result highlights that demographic factors account for a very small portion of the variables that contribute to how a candidate scores on their edTPA. In other words, a candidate’s demographic characteristics alone are a poor predictor of a candidate’s edTPA performance or readiness to teach. How a candidate performs on edPTA may be largely explained by other factors such as the candidate’s knowledge, skills, and abilities to begin teaching, initial level of academic readiness, the quality of the preparation program, and/or the supports provided by the program. Further research into the each of these and other variables can serve to inform the ways in which candidates, faculty, and programs employ edTPA as a tool for candidate and program learning.
¡ Analyses show that a candidate’s demographic
characteristics alone are a poor predictor of a candidate’s edTPA performance or readiness to teach.

edTPA ANNUAL ADMINISTRATIVE REPORT Data range: 1/1/2014 - 12/31/2014
38
Reliability Evidence Inter-rater agreement
The table below shows inter-rater agreement for the 2014 edTPA administration cycle (January 1, 2014 - December 31, 2014). The table shows agreement rates for each rubric as well as for judgments overall. Inter-rater agreement (IRA) measures to what extent multiple raters provide ratings of items or performance tasks consistently. The check of inter-rater agreement is part of the general quality control for a scoring process, and it requires a process that randomly assigns portfolios to be read by two scorers, independently. It is customary to summarize IRA for three levels of granularity (Chodorow & Burnstein, 2004; Powers, 2000; Stemler & Tsai, 2008), such as:
• Exact agreement – proportion of cases in which the first and second scores match exactly;
• Adjacent agreement – proportion of cases in which the first and second scores are apart by one score point, in absolute value; and
• Total agreement – proportion of cases in which the pairs of scores are ± 1 score point apart from each other.
The data set included 1,808 complete submissions (approximately 10% of the total number of examinees) that were scored independently by two scorers as part of the random sample of double-scored portfolios for the 2014 administration cycle. Across all 15 rubrics and 1,808 candidates, scorers assigned the same score (exact agreement) in approximately 50.1% of all cases. The average total agreement (exact plus adjacent agreement) was 93.3%, and ranged from 89.9% (Rubric 2 and Rubric 13) to 97.1% (Rubric 6). These exact and adjacent agreement rates are consistent with that of other performance assessments, such as the NBPTS.
The kappa n provides chance-corrected total agreement, or inter-rater agreement measures that result from removing total agreement that may have occurred randomly (Brennan & Prediger, 1981). Chance-corrected agreement ranges from 0 to 1. There are no widely accepted guidelines for what constitutes an adequate value of the coefficients, although higher values represent greater levels of agreement. Table 2 shows kappa n ranged from 0.789 (rubric 2) to 0.939 (rubric 6), with an average value of 0.86. This outcome corroborates that scorers tend to assign scores within +/- 1 and indicate that scorers use the full score range (level 1 to level 5 for each rubric) in assigning candidate scores. The overall chance-corrected total agreement rate (0.86) is consistent with the kappa n rate found in the field test year (0.83)
¡ edTPA meets the reliability and precision standards put forward by the Standards for Educational and Psychological Testing (APA, AERA and NCME, 2014).

edTPA ANNUAL ADMINISTRATIVE REPORT Data range: 1/1/2014 - 12/31/2014
39
Inter-Rater Agreement Task Rubric Exact Adjacent Total Kappa N Task 1: Planning Rubric 01 0.518 0.416 0.935 0.864 Rubric 02 0.46 0.439 0.899 0.789
Rubric 03 0.498 0.459 0.956 0.909
Rubric 04 0.495 0.443 0.938 0.871
Rubric 05 0.488 0.428 0.915 0.824
Task 2: Instruction Rubric 06 0.629 0.342 0.971 0.939
Rubric 07 0.518 0.432 0.95 0.896
Rubric 08 0.486 0.449 0.935 0.864
Rubric 09 0.492 0.429 0.921 0.836
Rubric 10 0.502 0.43 0.933 0.861
Task 3: Assessment Rubric 11 0.487 0.441 0.928 0.85
Rubric 12 0.48 0.451 0.93 0.856
Rubric 13 0.465 0.435 0.899 0.790
Rubric 14 0.518 0.43 0.947 0.890
Rubric 15 0.48 0.451 0.932 0.858
Overall Average .501 .432 .933 0.86
Internal Consistency
Cronbach’s alpha is a measure of internal consistency of raw test scores, an important characteristic of test scores that indicates the extent to which the items of the assessment measure the intended common construct (Cronbach, 1951). Cronbach’s alpha estimates range from zero to one, and higher values reflect higher levels of consistency of a person’s scores across the items (rubrics).
The table below shows edTPA estimates of Cronbach’s alpha coefficient for the 2014 administration cycle. The table shows descriptive statistics for total scores and reliability estimates for individual fields and the overall group. The data set included 18,436 complete submissions, excluding portfolios with
condition codes and retakes that were scored for the 2014 administration cycle by at least one scorer. Data from the first scorer was retained for submissions randomly assigned for scoring by two scorers. Reliability coefficients ranged from 0.767 (Agricultural Education) to 0.957 (Health Education). The overall reliability coefficient across all fields was 0.923, indicating a high level of consistency across the rubrics, meaning that the rubrics as a group are measuring a common construct of teacher readiness.

edTPA ANNUAL ADMINISTRATIVE REPORT Data range: 1/1/2014 - 12/31/2014
40
The person separation reliability calculated as part of the IRT internal structure analyses presented in the ‘Validity’ section of this report was estimated as 0.917. This index is similar to Cronbach’s alpha. Generally, values of 0.90 or greater are expected for such reliability indices. The
estimated person separation reliability index for the overall sample is 0.917, indicating a high level of reliability for distinguishing among candidates’ levels of performance.
Field Name N Mean Variance Cronbach’s alpha
Agricultural Education 46 46.000 19.378 0.767
Business Education 54 38.056 57.412 0.920
Early Childhood 2019 43.948 45.111 0.904
Elementary Literacy 1851 43.473 56.279 0.927
Elementary Mathematics 2075 45.735 38.975 0.902
English as an Additional Language 230 48.352 58.081 0.912 Family and Consumer Sciences 55 43.145 79.460 0.931
Health Education 80 34.675 108.222 0.957
K-12 Performing Arts 886 44.174 60.865 0.924
K-12 Physical Education 581 43.417 71.792 0.929
Middle Childhood History/Social Studies 230 42.365 49.761 0.910 Middle Childhood Mathematics 304 42.747 76.810 0.932
Middle Childhood Science 231 45.593 61.034 0.917
Secondary English- Language Arts 1318 47.095 47.003 0.911
Secondary History/Social Studies 1318 44.797 61.696 0.935
Secondary Mathematics 1163 45.323 41.427 0.892 Secondary Science 1013 45.886 58.032 0.909
Special Education 1979 39.765 76.894 0.937
Visual Arts 419 45.382 53.519 0.910
Elementary Education 2285 44.806 59.675 0.926
Overall 18436 44.275 60.237 0.923
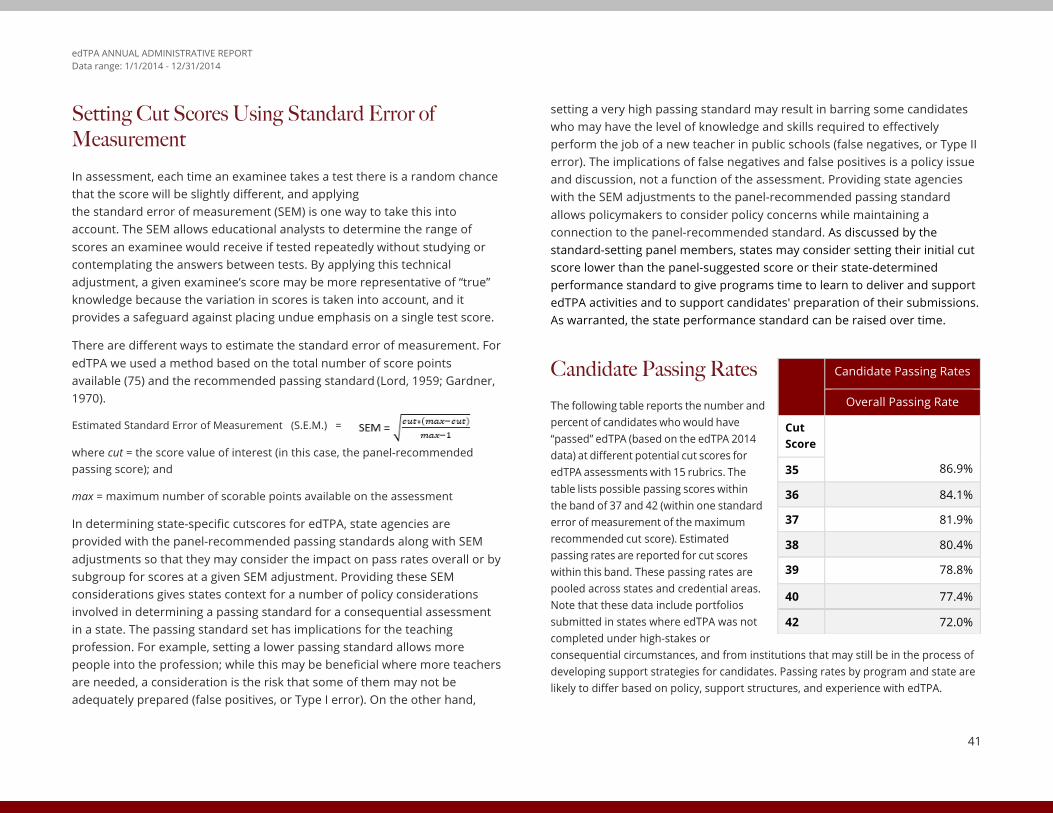
edTPA ANNUAL ADMINISTRATIVE REPORT Data range: 1/1/2014 - 12/31/2014
41
Setting Cut Scores Using Standard Error of Measurement In assessment, each time an examinee takes a test there is a random chance that the score will be slightly different, and applying the standard error of measurement (SEM) is one way to take this into account. The SEM allows educational analysts to determine the range of scores an examinee would receive if tested repeatedly without studying or contemplating the answers between tests. By applying this technical adjustment, a given examinee’s score may be more representative of “true” knowledge because the variation in scores is taken into account, and it provides a safeguard against placing undue emphasis on a single test score.
There are different ways to estimate the standard error of measurement. For edTPA we used a method based on the total number of score points available (75) and the recommended passing standard (Lord, 1959; Gardner, 1970).
Estimated Standard Error of Measurement (S.E.M.) =
where cut = the score value of interest (in this case, the panel-recommended passing score); and
max = maximum number of scorable points available on the assessment
In determining state-specific cutscores for edTPA, state agencies are provided with the panel-recommended passing standards along with SEM adjustments so that they may consider the impact on pass rates overall or by subgroup for scores at a given SEM adjustment. Providing these SEM considerations gives states context for a number of policy considerations involved in determining a passing standard for a consequential assessment in a state. The passing standard set has implications for the teaching profession. For example, setting a lower passing standard allows more people into the profession; while this may be beneficial where more teachers are needed, a consideration is the risk that some of them may not be adequately prepared (false positives, or Type I error). On the other hand,
setting a very high passing standard may result in barring some candidates who may have the level of knowledge and skills required to effectively perform the job of a new teacher in public schools (false negatives, or Type II error). The implications of false negatives and false positives is a policy issue and discussion, not a function of the assessment. Providing state agencies with the SEM adjustments to the panel-recommended passing standard allows policymakers to consider policy concerns while maintaining a connection to the panel-recommended standard. As discussed by the standard-setting panel members, states may consider setting their initial cut score lower than the panel-suggested score or their state-determined performance standard to give programs time to learn to deliver and support edTPA activities and to support candidates' preparation of their submissions. As warranted, the state performance standard can be raised over time.
Candidate Passing Rates The following table reports the number and percent of candidates who would have “passed” edTPA (based on the edTPA 2014 data) at different potential cut scores for edTPA assessments with 15 rubrics. The table lists possible passing scores within the band of 37 and 42 (within one standard error of measurement of the maximum recommended cut score). Estimated passing rates are reported for cut scores within this band. These passing rates are pooled across states and credential areas. Note that these data include portfolios submitted in states where edTPA was not completed under high-stakes or consequential circumstances, and from institutions that may still be in the process of developing support strategies for candidates. Passing rates by program and state are likely to differ based on policy, support structures, and experience with edTPA.
Candidate Passing Rates
Overall Passing Rate
Cut Score
86.9% 35
36 84.1%
37 81.9%
38 80.4%
39 78.8%
40 77.4%
41 75.1% 42 72.0%

edTPA ANNUAL ADMINISTRATIVE REPORT Data range: 1/1/2014 - 12/31/2014
42
State Standard Setting edTPA Standard Setting Event Overview
edTPA state standard setting conferences occur over one or multiple days. The method used to conduct the standard setting is the Briefing Book Method (Haertel, Beimers, & Miles, 2012). The Briefing Book Method (BBM) is an evidence-based standard setting method intended to develop an appropriate and defensible cut score that can be supported with a validity argument. The BBM provides a framework and approach to standard setting rather than a specific set of steps or procedures that must be followed exactly. The primary aim is to follow a process that allows a body with the appropriate authority and knowledge to reach a defensible and appropriate judgment of a passing cut score.
Participants in the conference include groups of subject area experts, educators, and policymakers who are convened into a panel for the standard setting session. For each participant group, the conference organizers strive to have an equal mix of higher education faculty, non-traditional educational preparation program providers (e.g., area education service organizations), and P-12 educators. Panelists are informed of the purpose of the assessment and are provided with the “briefing book” to guide their activity. Prior to the meeting, each invited panelist receives edTPA handbooks, rubrics, scoring materials, and three previously scored sample portfolio submissions representing different performance levels across various content areas. Panelists are asked to review materials submitted by candidates and the scoring evidence identified by trained benchmarkers for the submissions assigned to them. During the facilitated session, panelists familiarize themselves with the assessment and with the information contained in the briefing book. After a series of “Policy Capture Activities” examining whole portfolios and score profiles representing a range of candidate performances, panelists recommend an initial cut score (which may also be referred to as a “passing standard”) for each task, which is then discussed and evaluated based on impact data. Following that, panelists recommend a final cut score.
edTPA Guiding Question
Throughout the standard setting event and examination of sample edTPA score profiles, a prompt and a guiding question are used and revisited to frame all discussions. This contextual prompt and guiding question provide a common framework in which all participants anchor their decisions.
• Think about a teacher candidate who is just at the level of knowledge and skills required to perform effectively the job of a new teacher in (Insert State Name) public schools.
• Guiding question: What score (the sum of all of the rubric scores of edTPA) represents the level of performance that would be achieved by this individual?
The purpose of the edTPA standard setting guiding question and contextual prompt is to identify the performance expectation of an initially licensed, classroom-ready teacher. The step-by-step standard setting process of examining actual candidate submissions, candidate score profiles, and impact data guides participants to determine the candidate performance on edTPA that, as stated in the Briefing Book Method, “just meets the definition of performing effectively the job of a new teacher.”
edTPA Standard Setting Activities
Policy Capture 1 Activity Overview/ Instructions
In this activity, panelists collaborate with others who reviewed the same edTPA candidate portfolio as a homework assignment prior to the standard setting event. To begin, individually, each panelist spends some time recalling a specific submission that they reviewed for homework and then provides an individual rating for that portfolio. Panelists rate portfolios as Clearly Below, Just Below, Just Meets, or Meets the Standard. Then, in assigned table groups, they discuss their ratings with other panelists with the goal of arriving at a consensus rating. Upon reaching consensus, each table completes one consensus rating form for the portfolio discussed. After each table completes the table form, panelists move to the next table assignment

edTPA ANNUAL ADMINISTRATIVE REPORT Data range: 1/1/2014 - 12/31/2014
43
and they repeat the process two more times for the other submissions they reviewed for homework. By the end of the three cycles, a consensus rating is generated for each of the submissions reviewed by each panel and presented to the individual panelists.
Policy Capture 1 Debrief and Discussion Activity Overview/Instructions
All individual and table ratings are tabulated. Data from the individual ratings of the Policy Capture Activity are then presented to the panel. After some discussion of the individual and table ratings, each table discusses a score range (i.e., a lower and upper bound total score) that may include the potential cut score. Given this range, a set of “Candidate Score Profiles” is identified for review by the panelists.
Score Profile Review and Discussion Activity
As part of this activity, panelists review a set of "Candidate Score Profiles" within the total score range determined by the panelists in the first activity. The Candidate Score Profiles represent a sample of candidate raw scores (individual rubric scores and total scores) that are received during operational and field test activities, and the rubric descriptors that correspond to each rubric score obtained.
All panelists review the same set of Candidate Score Profiles as a group. The group is asked to review the information and attempt to narrow the range of scores that would include the cut score. Panelists discuss the score profiles, and new, narrowed ranges are recorded as reported out by the group. Through the Score Profile review and the subsequent discussions, panelists begin to come together around a common range within which the passing standard would likely occur (from widely divergent to less divergent).
Initial Passing Score Recommendation
Through a facilitated discussion, panelists are presented with a series of national data as described below.
Descriptive and Summary Data Presented to Panelists
To conduct standard setting, panelists are provided descriptive and summary data to help guide their recommendations. Descriptive and summary data include the number of portfolios scored in each edTPA credential field, a summary of the population aggregate rubric, task, and total edTPA performance (mean, standard deviation, median, minimum, maximum) for all candidates. Demographics and total score descriptive performance statistics (number, percent, mean, standard deviation, and median, minimum, maximum) are provided by gender, ethnicity, and Primary Language English subgroups. Finally, a distribution of total scores is provided for the national data set.
After reviewing the descriptive and summary data, and following discussion with the whole group, panelists are asked to make an initial recommendation for a cut score. Individually each panelist completes an initial cut score recommendation form and cut scores are gathered and tallied.
Final Passing Score Recommendation
Through a facilitated discussion, panelists are presented with a series of national data as described below.
Impact Data Presented to Panelists
To conduct standard setting, panelists are provided impact data to help guide their recommendations. Impact data includes the reporting of the passing rate that would have been observed based on the range of possible cut scores determined in Policy Capture 1. Included in the impact data are comparisons between the host state (i.e. the state where standard setting is occurring) and other states where edTPA is non-consequential. The number of candidates passing and the passing rate (as a percentage of all candidates in a given group) overall, by credential area, and by demographic characteristics are also provided.
After reviewing impact data, and following discussion with the whole group, panelists are asked to make a final recommendation for a cut score.

edTPA ANNUAL ADMINISTRATIVE REPORT Data range: 1/1/2014 - 12/31/2014
44
Individually each panelist completes a final cut score recommendation form and cut score recommendations are gathered and tallied.
Evaluation
After reviewing the final recommended cut scores, panelists are asked to complete an evaluation form capturing their feedback on the meeting’s proceedings.
Typically, in setting a cut score for a pass-fail decision, a standard error of measurement is applied to the recommended score so as to reduce decisions influenced by measurement error (e.g., false negatives). The full standard error of measurement puts a lower bound on the recommended score of about five points.
States may set their own passing scores based on state standard setting panels that take into account state-specific data, measurement data, and the state's policy considerations. As discussed by the national standard setting panel members, as well as the state panelists, states may consider setting their initial cut score lower than the panel-recommended score to give programs time to learn to deliver and support edTPA activities and to support candidates' preparation of their submissions. This “phase-in” strategy allows for a ramping up of the state based standard over time, eventually reaching the panel-recommended score, or other cut score, after a defined period of time. An example of a phase-in strategy would be to establish a passing score at -1 SEM from the panel-recommended score, raise the passing score to -1/2 SEM after the first year of operational use, and finally to raise the passing score to the panel-recommended score after the second year of operational use. This allows states time to examine operational data during the defined timeframes, and review pass rates over time. As warranted, the state performance standard can be reviewed and adjusted as appropriate over time.
State Based Passing Standards
Between fall 2013 and the end of 2014, the following states established state-based passing standards as follows:
• New York (41) • Washington (35, excludes Student Voice) • Iowa (41) • Minnesota (Task 1: 13, Task 2: 13, Task 3: 12) • California (41)
Note that these state-based passing standards may be reevaluated and adjusted, as driven by state reviews. The passing standards cited above were in use during the 2014 calendar year, the date range which this report covers.
edTPA ANNUAL ADMINISTRATIVE REPORT Data range: 1/1/2014 - 12/31/2014
45
TAC recommendations for future directions The edTPA National Technical Advisory Committee (TAC; for members, see list in Appendix I) has reviewed the evidence presented in this report; their input guided the analyses and interpretations presented. The discussion included planned and recommended future directions that will add to the validity evidence outlined here and inform state and program policy about the role of edTPA in the education of their teacher candidates. The diversity of expertise and perspectives represented by the TAC provided for rich discussion and suggestions for additional analyses and research questions, which are represented throughout the report. The following list highlights two additional discussions not presented previously. These summarize the recommendations and reflections of the TAC about potential future directions; they do not preclude the use and interpretation of edTPA scores for current intended purposes.
1. Investigating a task-based scoring approach
The portfolio-based scoring model now used, in which one scorer scores the entire edTPA portfolio, gives scorers a full picture of the candidate’s performance as they navigate the interrelated cycle of teaching, and streamlines the scoring process by sending each portfolio as a complete entity to a single scorer (note that under portfolio-based scoring, scorers still progress sequentially through the tasks, scoring according to the analytic rubrics and scoring all rubrics for the first task before moving to the next). This scoring model has been shown to be valid and reliable based on the Standards for Educational and Psychological Testing (AERA, APA & NCME, 2014). Task-based scoring is worth investigating, as it may reduce cognitive load for the scorers and improve reliability. This potential halo effect can be reduced with a task-based scoring model, in which each task is scored by a different scorer. To examine a task-based approach, the recommendation is to select a sample of portfolios to be scored with both methods and compare properties of the scores. This would include evaluating reliability (via interrater agreement, generalizability studies, and SEM estimates) and qualitative studies that assess the educative impact of scoring a whole
portfolio, the overall scoring process, and the scorers’ experience with each approach.
2. Further examining demographic differences
This report presents performance data by several demographic categories. Some differences in performance were found across gender, ethnicity, education level, and teaching context. Regression analyses show that these categories explain a small percentage of the differences in candidates’ total scores, and evidence suggests that magnitude of differences vary based on candidates’ academic and socioeconomic background, teaching context, quality of the preparation program, state implementation and support infrastructures, and other factors. The TAC recommends gathering data on existing as well as additional demographic variables to examine the relationships and interactions that may explain the reported differences in performance. Differential Item Functioning (DIF) analyses are recommended to examine differences in performance by testing whether candidates that belong to different subgroups have the same probability of earning a certain score at the same level of the latent trait (same total score) and to better understand measurement properties of the different rubrics. In order to be meaningful, interaction effects should be examined when each of the categories has a robust enough sample size to look at group differences within these categories. DIF analyses require large sample sizes, as data from candidates scoring at each total score level within different subgroups is needed. Exploratory analyses are now being conducted to inform formal studies, to be conducted as data become available.

edTPA ANNUAL ADMINISTRATIVE REPORT Data range: 1/1/2014 - 12/31/2014
46
Conclusion edTPA was developed for the profession by the profession to be a reflection of the broad skills and competencies necessary to be a successful teacher. Founded on the subject-specific architecture of the National Board for Professional Teaching Standards’ assessments and the work in California on the Performance Assessment of California Teachers (PACT), edTPA is aligned with the Interstate Teacher Assessment and Support Consortium (InTASC) standards for beginning teacher licensing (2013). The development of edTPA, content validity studies and subsequent revisions, and job analyses add to research-based evidence of effective teacher performance and capture the skills, knowledge, and abilities of a novice teacher. The Review of Research on Teacher Education presents the research foundation of edTPA as an assessment of teacher readiness as defined by the leading experts and existing literature on teacher preparation. As with the field test data, data from the first year of operational use presented here are consistent with Standards for Educational and Psychological Testing (AERA, APA & NCME, 2014), and affirm the reliability and validity evidence necessary for edTPA to be used for the evaluation of teacher candidates.
The use of edTPA scores by EPPs and state agencies as a reflection of a candidate’s readiness to be an effective and proficient educator is predicated on observed scores being accurate, unbiased, reliable, and consistent across relevant conditions of measurement. The scoring model, training design, double scoring and adjudication processes, and quality management of scorers describe the rigorous scoring model applied to the reporting of edTPA final scores, and analyses of interrater reliability quantify the precision and reliability of these scores. The confirmatory factor and partial credit model analyses of internal structure support the construction of levels within each rubric, the fit of rubrics within the three edTPA tasks, and the use of a single summed total score to represent candidates’ performance. Data on candidates’ performance by content field and demographic categories presented in the report suggest that these factors explain a very small portion of variance in total scores, and do not suggest systematic bias against any group or field. As more data become available, the interactions
among variables that contribute to candidates’ performance on edTPA will inform the use and interpretation of rubric, task, and total scores.
edTPA was designed as a support and assessment system for teachers entering the profession. The use of edTPA to inform decisions about a candidate’s readiness to successfully begin his or her career as a teacher is supported by studies that have explored relationships between PACT or edTPA scores with other performance measures of teacher candidates. Summarized in the “Validity” section of this report, emerging studies indicate that performance on these teacher performance assessments is related to candidate performance or readiness to teach: candidates’ GPAs, scores on assessments of pedagogy, supervisors’ predictions of success, and evidence of student learning. Most importantly, edTPA is an educative assessment that supports candidate learning and preparation program improvement. This report synthesizes the systems of support and resources available to candidates, faculty, and programs; the process of taking the assessment, using it to reflect on individual and program practices, and to use data in systematic and reflective ways. Qualitative and quantitative analyses presented in this report describe the impact of edTPA on programs, faculty, and teacher candidates’ educative experience.
More evidence of the concurrent, predictive, and consequential validity of edTPA is eagerly anticipated as data become available; existing research provides strong support that completing edTPA is an educative experience that further improves readiness to teach, while passing edTPA is a signal of readiness that is linked to becoming a more proficient teacher. As more states and educator preparation programs move toward integrated and consistent methods of assessing teacher candidates, it is crucial to continue the examination of reliability and validity arguments of assessments used for licensure/certification, program improvement, and/or program completion. Access to data on candidate performance allows for examination of the preparedness of teachers entering the profession across various skills and constructs. As a subject-specific assessment, edTPA data allows us to consider candidates’ readiness to teach for each content field, as well as to present programs with national data trends that in turn inform program

edTPA ANNUAL ADMINISTRATIVE REPORT Data range: 1/1/2014 - 12/31/2014
47
preparation and reflection. In collaboration with the edTPA Technical Advisory Committee and the edTPA Research Consortium, SCALE is committed to continuing research that informs and advances the field of teacher preparation. The findings presented in this report can guide and support educator preparation programs, states, and P-12 partners to inform and reform teaching and learning. It also serves as a call for further research and lays the foundation for research questions that will continue to improve assessment and preparation of readiness to teach P-12 students in every classroom, every school, and every field.
Lastly, as with the case of the National Board for Professional Teaching Standards (NBPTS), educative use of a performance-based assessment is more than a testing exercise completed by a candidate. edTPA’s emphasis on support for implementation mirrors the NBPTS use of professional networks
of experienced users to assist others as they prepare for the assessment. The opportunities for educator preparation program faculty and their P-12 partners to engage with edTPA is instrumental to its power as an educative tool. The extensive library of resources developed by SCALE, the National Academy of consultants and state infrastructures of learning communities for faculty and program leaders promote edTPA as a tool for candidate and program learning. As candidates are provided with formative opportunities to develop and practice the constructs embedded in edTPA throughout their programs, and reflect on their edTPA experience with faculty and P-12 partners, they are more likely to internalize the cycle of teaching (planning, instruction, and assessment) as a way of thinking about practice -- a way of thinking about students and student learning that will sustain them in the profession well beyond their early years in the classroom.

edTPA ANNUAL ADMINISTRATIVE REPORT Data range: 1/1/2014 - 12/31/2014
48
Appendix A: Internal Structure Table 1: Confirmatory Factor Analyses: Standardized Factor Loading Estimates
The table below presents the estimated standardized factor loadings for the 1 and 3-factor models in the full sample of portfolios.
1-Factor Model 3-Factor (Task) Model
Rubric F1 Planning Instruction Assessment 1 0.663 0.737 -- -- 2 0.652 0.728 -- -- 3 0.674 0.721 -- -- 4 0.647 0.690 -- -- 5 0.680 0.751 -- -- 6 0.527 -- 0.641 -- 7 0.645 -- 0.767 -- 8 0.627 -- 0.749 -- 9 0.578 -- 0.675 -- 10 0.646 -- 0.611 -- 11 0.729 -- -- 0.778 12 0.636 -- -- 0.701 13 0.657 -- -- 0.720 14 0.678 -- -- 0.702 15 0.705 -- -- 0.739 NOTE: "--" indicates factor loadings constrained to 0.0 in model estimation.
All factor loadings in both models were positive and statistically significant as anticipated (all standardized loadings were greater than 0.5 in the 1-factor model and greater than 0.6 in the 3-factor model).

edTPA ANNUAL ADMINISTRATIVE REPORT Data range: 1/1/2014 - 12/31/2014
49
Table 2: Confirmatory Factor Analyses: Task Factor Correlation Matrix
The table below presents the estimated correlations among the task factors in the 3-factor model.
Planning Instruction Assessment
Planning 1.00
Instruction 0.72 1.00 Assessment 0.79 0.75 1.00
The task factors are strongly positive and statistically significant. The large magnitude of the correlations further supports the interpretation that the edTPA rubrics measure three highly interrelated sub-dimensions - Planning, Instruction, and Assessment - of a single readiness to teach construct.

edTPA ANNUAL ADMINISTRATIVE REPORT Data range: 1/1/2014 - 12/31/2014
50
Table 3: Partial Credit Model: Wright Map
The following figure shows the ordering and distribution of Thurstonian thresholds across the range of candidates’ theta estimates. The histogram on the left shows the distribution of candidate theta estimates. These are a direct function of total scores, which represent estimates of teacher effectiveness. The points on the graph (Thurstonian thresholds) represent the point on the underlying theta scale at which a candidate has a 50% chance of scoring at or above score k for a particular rubric. For example, the furthest left point labeled “2” indicates the point on the theta (logit) scale at which a candidate is predicted to have a 50% chance of scoring a 2 or higher on Rubric 1, the furthest left point labeled “3” is the point at which a candidate is predicted to have a 50% chance of scoring a 3 or higher on Rubric 1, and so on.
This graph shows that the ordering of thresholds is as intended (the threshold for scoring 3 is higher than for scoring 2 on a given rubric, etc.). This graph also shows that thresholds are evenly distributed across the theta distribution, indicating that differences in rubric scores are sensitive to differences in candidate performance at a range of performance levels.
Dim1
Rubric
−6
−4
−2
0
2
4
6
22
22
2
2 22
2
2
22
2 2 2
33 3 3 3
3
33 3
33 3
33
3
4 4 44 4
4 4 4 4 44
4
4 4
4
55
55
5 55 5 5
5 55 5
5
5
Rubric1 Rubric2 Rubric3 Rubric4 Rubric5 Rubric6 Rubric7 Rubric8 Rubric9 Rubric10 Rubric11 Rubric12 Rubric13 Rubric14 Rubric15
Logits
Respondents
Wright Map for Overall Sample

edTPA ANNUAL ADMINISTRATIVE REPORT Data range: 1/1/2014 - 12/31/2014
51
Appendix B: Double Scoring Band – Distribution of Scores Figure 1: Distribution of the first scores
The following figure shows the distribution of the first score on portfolios that are on and around the national cut score. These portfolios were then double scored since they fall within this double scoring band.
Total Score (15 rubrics)

edTPA ANNUAL ADMINISTRATIVE REPORT Data range: 1/1/2014 - 12/31/2014
52
Figure 2: Distribution of the final scores
The following figure shows the final disposition (after double scoring and any resolution) of those portfolios that were within the double scoring band and illustrates the distribution of final scores that were originally around the national cut score.
Total Score (15 rubrics)

edTPA ANNUAL ADMINISTRATIVE REPORT Data range: 1/1/2014 - 12/31/2014
53
Appendix C: Performance by Content Field The following tables contain average candidate performance, overall and for each task and rubric, for 15-, 13-, and 18- rubric content fields.
Data cautions for interpretation of tables:
• Total portfolio scores are based on the 13, 15, or 18 rubrics (depending on the handbook) that are common to all national handbooks. • Results for Washington handbooks are included in the national results reported here and are based on the rubrics common to all handbooks. State-
specific rubrics, such as Washington’s Student Voice, are excluded for the purpose of this report. • Occasionally, rubrics receive a final score ending in a .5. This occurs when edTPA portfolio submissions are scored by two independent scorers. For those
portfolios, the final rubric score is the average of the scores assigned by each scorer. • For this report, the scores included in the distribution of portfolio total scores were rounded up to the nearest whole number if the total portfolio score
ended in .5. • Occasionally, portfolios are submitted that do not meet submission requirements and result in a condition code for one or more rubrics. A condition code
explaining the reason a rubric is deemed unscorable is reported to the candidate. No portfolios with condition codes were included in these reports and analyses.
Means and distributions of total scores are not provided for fields with fewer than 10 portfolios. Fields with fewer than 10 portfolios are omitted from the rubric-level distribution reporting tables. Note that estimates based on sample sizes below 100 may be unstable and should be interpreted with caution.
N
Total Score Mean
Planning Instruction Assessment Mean by Task
P01 P02 P03 P04 P05 I06 I07 I08 I09 I10 A11 A12 A13 A14 A15 P I A
All 15-Rubric Handbooks 18,436 44.3 3.2 3.1 3.1 3.0 3.0 3.1 3.0 3.0 2.9 2.8 3.0 3.0 2.5 2.7 2.9 15.4 14.8 14.1
Agricultural Education 46 46.0 3.5 3.2 3.1 3.1 3.2 3.1 3.2 3.0 3.1 3.0 3.0 3.2 2.6 2.6 2.9 16.2 15.5 14.3
Business Education 54 38.1 2.7 2.6 2.6 2.7 2.7 3.0 2.6 2.5 2.6 2.3 2.4 2.7 2.2 2.1 2.4 13.3 12.9 11.8
Early Childhood 2,019 43.9 3.3 3.2 3.1 3.1 3.1 3.1 3.0 3.0 2.4 2.8 2.9 2.7 2.3 2.8 2.9 15.9 14.4 13.6
Elementary Education 2,285 44.8 3.1 3.1 3.1 3.0 3.0 3.1 3.0 3.0 3.0 2.9 3.0 3.2 2.6 2.7 3.0 15.3 15.0 14.5
Elementary Literacy 1,851 43.5 2.9 3.0 3.0 2.9 2.9 3.1 2.9 2.9 2.9 2.8 2.9 3.0 2.5 2.6 3.0 14.8 14.6 14.0
Elementary Mathematics 2,075 45.7 3.3 3.2 3.2 3.0 3.1 3.2 3.1 3.0 3.1 3.0 3.1 3.1 2.7 2.8 3.0 15.8 15.3 14.6
English as an Additional Language 230 48.4 3.6 3.4 3.3 3.4 3.3 3.4 3.3 3.2 2.9 3.0 3.3 3.3 2.8 2.9 3.3 17.0 15.8 15.5
Family and Consumer Sciences 55 43.1 3.2 3.0 3.1 3.0 2.9 3.2 3.0 2.7 2.9 2.9 2.8 2.9 2.3 2.4 2.7 15.3 14.7 13.1

edTPA ANNUAL ADMINISTRATIVE REPORT Data range: 1/1/2014 - 12/31/2014
54
N
Total Score Mean
Planning Instruction Assessment Mean by Task
P01 P02 P03 P04 P05 I06 I07 I08 I09 I10 A11 A12 A13 A14 A15 P I A
Health Education 80 34.7 2.5 2.5 2.4 2.5 2.3 3.0 2.3 2.2 2.2 2.2 2.2 2.5 1.9 2.0 2.1 12.2 11.9 10.6
K-12 Performing Arts 886 44.2 3.2 3.2 3.1 3.0 3.0 3.0 2.9 2.8 2.9 2.7 3.0 3.0 2.5 2.7 3.0 15.6 14.4 14.2
K-12 Physical Education 581 43.4 3.2 3.0 2.9 2.9 2.9 3.2 3.0 3.3 3.0 2.7 2.8 2.9 2.4 2.5 2.5 15.0 15.2 13.2
Library Specialist 27 43.5 3.7 3.2 3.2 3.0 3.0 3.2 3.0 2.7 2.9 2.7 2.6 2.9 2.3 2.5 2.6 16.1 14.5 12.9
Middle Childhood English-Lang. Arts 240 46.9 3.5 3.3 3.4 3.0 3.3 3.3 3.2 3.2 3.0 2.9 3.1 3.3 2.6 2.7 3.1 16.4 15.6 14.8
Middle Childhood History/Social Studies 230 42.4 3.3 3.0 3.1 2.9 3.0 3.1 3.0 2.8 2.6 2.7 2.7 2.9 2.3 2.3 2.6 15.3 14.1 12.9
Middle Childhood Mathematics 304 42.7 3.1 2.9 3.0 2.8 2.9 3.1 2.8 2.9 3.0 2.7 2.9 3.1 2.4 2.4 2.7 14.7 14.4 13.5
Middle Childhood Science 231 45.6 3.4 3.3 3.3 3.0 3.3 3.2 2.9 2.9 2.9 2.9 3.1 3.0 2.6 2.7 2.9 16.3 14.9 14.4
Secondary English-Language Arts 1,318 47.1 3.3 3.3 3.3 3.2 3.3 3.2 3.2 3.1 3.1 3.0 3.2 3.3 2.7 2.8 3.1 16.4 15.6 15.1
Secondary History/Social Studies 1,318 44.8 3.2 3.1 3.1 3.1 3.1 3.1 3.0 3.0 2.9 2.9 3.0 3.0 2.6 2.7 2.9 15.5 14.9 14.3
Secondary Mathematics 1,163 45.3 3.2 3.1 3.2 3.0 3.1 3.2 3.0 3.0 3.1 2.7 3.2 3.2 2.6 2.8 2.8 15.7 14.9 14.7
Secondary Science 1,013 45.9 3.3 3.2 3.2 3.1 3.3 3.2 3.0 3.0 2.8 2.9 3.2 3.2 2.6 2.8 3.0 16.1 14.9 14.8
Special Education 1,979 39.8 2.8 2.7 2.7 2.8 2.6 3.1 2.8 2.7 2.8 2.5 2.5 2.7 2.3 2.4 2.3 13.5 14.0 12.3
Technology and Engineering Education 32 39.2 2.9 2.6 2.8 2.6 2.5 2.9 2.8 2.7 2.9 2.5 2.6 2.7 2.2 2.2 2.3 13.5 13.8 11.9
Visual Arts 419 45.4 3.6 3.2 3.2 3.1 3.2 3.2 3.1 3 3.1 2.8 3 3 2.5 2.6 2.9 16.3 15.1 14
N
Total Score Mean
Planning Instruction Assessment Mean by Task
P01 P02 P03 P04 P05 I06 I07 I08 I09 I10 A11 A12 A13 A14 A15 P I A
All 13-Rubric Handbooks 420 40.0 3.5 3.4 3.4 3.4 3.2 3.0 2.8 2.4 2.9 3.1 3.1 2.6 3.0 13.6 14.5 11.9
Classical Languages 4
World Language 416 40.0 3.5 3.4 3.4 3.4 3.2 3.0 2.8 2.4 2.9 3.1 3.1 2.6 3.0 13.6 14.5 11.9
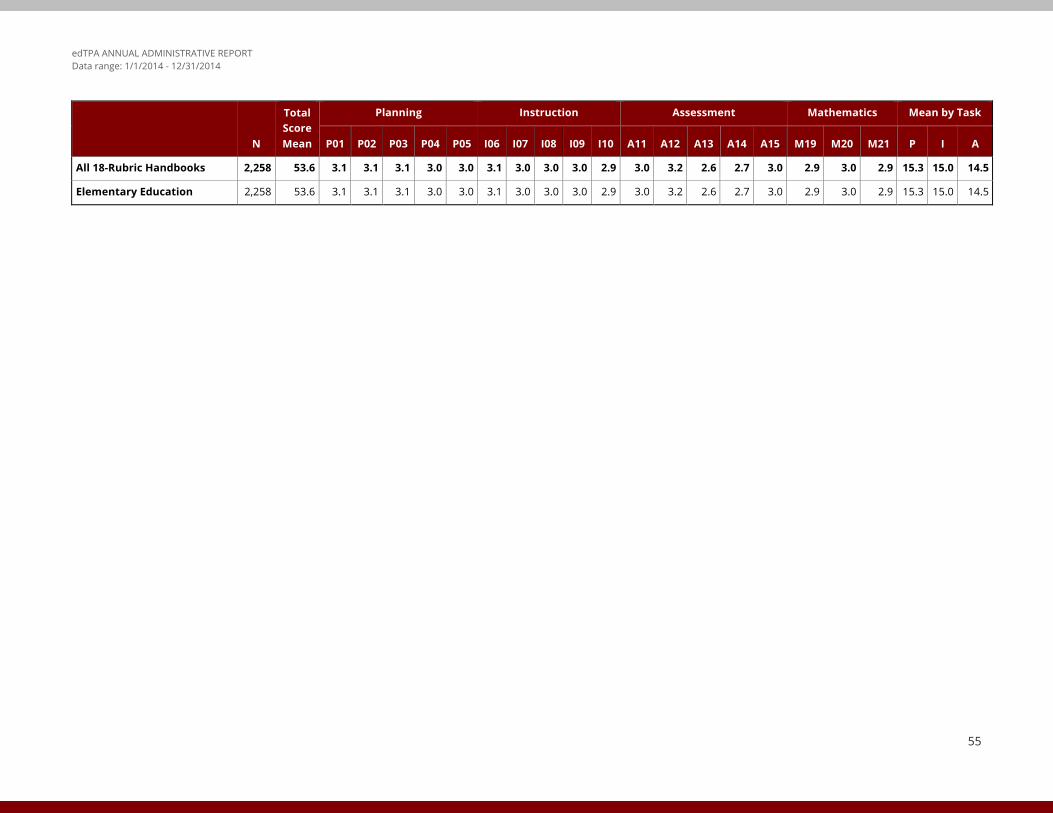
edTPA ANNUAL ADMINISTRATIVE REPORT Data range: 1/1/2014 - 12/31/2014
55
N
Total Score Mean
Planning Instruction Assessment Mathematics Mean by Task
P01 P02 P03 P04 P05 I06 I07 I08 I09 I10 A11 A12 A13 A14 A15 M19 M20 M21 P I A
All 18-Rubric Handbooks 2,258 53.6 3.1 3.1 3.1 3.0 3.0 3.1 3.0 3.0 3.0 2.9 3.0 3.2 2.6 2.7 3.0 2.9 3.0 2.9 15.3 15.0 14.5
Elementary Education 2,258 53.6 3.1 3.1 3.1 3.0 3.0 3.1 3.0 3.0 3.0 2.9 3.0 3.2 2.6 2.7 3.0 2.9 3.0 2.9 15.3 15.0 14.5

edTPA ANNUAL ADMINISTRATIVE REPORT Data range: 1/1/2014 - 12/31/2014
56
Appendix D: Score Distributions by Content Field The following tables present the mean scores and distribution of total scores across 15-, 13-, and 18-Rubric content fields.
N
Distribution of Total Score (%)
Mean Score < 35 35 36 37 38 39 40 41 42 > 42
All 15-Rubric Handbooks 18,436 44.3 13 3 2 1 2 1 2 3 6 66
Agricultural Education 46 46.0 2 2 2 2 2 2 87
Business Education 54 38.1 41 4 2 2 6 9 4 33
Early Childhood 2,019 43.9 9 3 2 2 2 2 3 4 8 65
Elementary Education 2,285 44.8 12 2 2 1 1 1 3 4 5 68
Elementary Literacy 1,851 43.5 14 3 3 1 1 2 2 3 6 64
Elementary Mathematics 2,075 45.7 6 1 2 1 1 1 2 3 6 76
English as an Additional Language 230 48.4 8 1 1 1 1 1 4 83
Family and Consumer Sciences 55 43.1 22 2 2 2 2 2 5 64
Health Education 80 34.7 64 10 1 1 24
K-12 Performing Arts 886 44.2 14 3 2 1 2 2 3 3 6 64
K-12 Physical Education 581 43.4 18 4 3 1 2 1 3 4 6 60
Library Specialist 27 43.5 7 7 4 7 4 11 4 4 52
Middle Childhood English-Lang. Arts 240 46.9 8 4 1 1 0 0 2 1 3 80
Middle Childhood History/Social Studies 230 42.4 20 2 3 1 2 0 3 3 8 58
Middle Childhood Mathematics 304 42.7 20 5 4 2 2 1 3 3 6 54
Middle Childhood Science 231 45.6 12 2 1 0 1 1 1 2 6 74
Secondary English-Language Arts 1,318 47.1 5 2 1 2 1 1 2 2 5 80
Secondary History/Social Studies 1,318 44.8 11 2 2 2 1 1 3 3 6 68
Secondary Mathematics 1,163 45.3 7 2 2 1 2 1 2 2 6 74

edTPA ANNUAL ADMINISTRATIVE REPORT Data range: 1/1/2014 - 12/31/2014
57
N
Distribution of Total Score (%)
Mean Score < 30 30 31 32 33 34 35 > 35
All 13-Rubric Handbooks 420 40.0 13 1 1 1 2 2 3 77
Classical Languages 4
World Language 416 40.0 13 1 1 1 2 2 3 77
N
Distribution of Total Score (%)
Mean Score < 40 40 41 42 43 44 45 46 47 48 49 > 49
All 18-Rubric Handbooks 2,258 53.6 9 2 2 2 1 1 1 1 1 1 4 75
Elementary Education 2,258 53.6 9 2 2 2 1 1 1 1 1 1 4 75
Secondary Science 1,013 45.9 10 3 2 1 2 1 1 2 5 73
Special Education 1,979 39.8 32 6 4 2 2 2 2 3 6 41
Technology and Engineering Education 32 39.2 31 6 6 3 6 3 44
Visual Arts 419 45.4 8 2 2 1 3 1 3 4 6 71
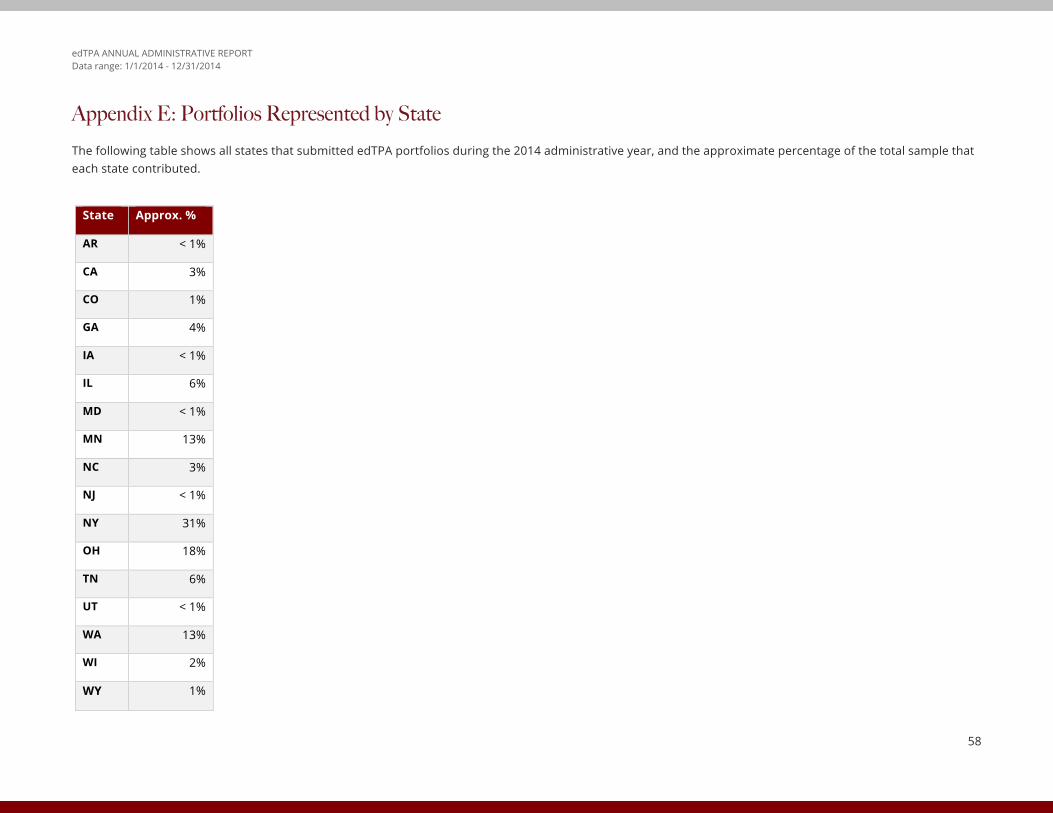
edTPA ANNUAL ADMINISTRATIVE REPORT Data range: 1/1/2014 - 12/31/2014
58
Appendix E: Portfolios Represented by State The following table shows all states that submitted edTPA portfolios during the 2014 administrative year, and the approximate percentage of the total sample that each state contributed.
State Approx. %
AR < 1%
CA 3%
CO 1%
GA 4%
IA < 1%
IL 6%
MD < 1%
MN 13%
NC 3%
NJ < 1%
NY 31%
OH 18%
TN 6%
UT < 1%
WA 13%
WI 2%
WY 1%

edTPA ANNUAL ADMINISTRATIVE REPORT Data range: 1/1/2014 - 12/31/2014
59
Appendix F: Consequential Use by Content Field The following table presents a comparison of average scores and standard deviations of portfolios from all states, from states without consequential policy, and from states with consequential policy for all 15-, 13-, and 18-rubric handbooks.
15-Rubric Handbooks
All States Non-Policy States Policy States
Field N Mean Std.
Deviation
N Mean Std.
Deviation
N Mean Std.
Deviation
Agricultural Education 46 46.00 4.40 18 45.33 3.25 28 46.43 5.01
Business Education 54 38.06 7.58 21 34.19 6.29 33 40.52 7.37
Early Childhood 2019 43.95 6.72 1327 43.65 6.71 692 44.51 6.70
Elementary Education (first 15
rubrics)
2285 44.81 7.73 390 41.91 7.98 1895 45.40 7.54
Elementary Literacy 1851 43.47 7.50 535 43.62 7.22 1316 43.41 7.62
Elementary Mathematics 2075 45.73 6.24 153 44.17 6.25 1922 45.86 6.23
English as an Additional Language 230 48.35 7.62 18 45.33 6.64 212 48.61 7.66
Family and Consumer Sciences 55 43.15 8.91 24 40.21 7.84 31 45.42 9.15
Health Education 80 34.68 10.40 29 31.90 7.37 51 36.25 11.56
K-12 Performing Arts 886 44.17 7.80 320 42.93 8.22 566 44.88 7.47
K-12 Physical Education 581 43.42 8.47 180 41.49 8.20 401 44.28 8.46

edTPA ANNUAL ADMINISTRATIVE REPORT Data range: 1/1/2014 - 12/31/2014
60
Library Specialist 27 43.48 8.68 7 50.14 11.34 20 41.15 6.35
Middle Childhood English-
Language Arts
240 46.88 7.28 200 46.97 7.26 40 46.45 7.44
Middle Childhood History/Social
Studies
230 42.37 7.05 182 42.40 7.11 48 42.25 6.91
Middle Childhood Mathematics 304 42.75 8.76 258 42.60 8.73 46 43.59 9.04
Middle Childhood Science 231 45.59 7.81 197 45.74 7.96 34 44.74 6.96
Secondary English-Language Arts 1318 47.09 6.86 459 45.50 6.97 859 47.95 6.65
Secondary History/Social Studies 1318 44.80 7.86 403 41.97 7.55 915 46.04 7.66
Secondary Mathematics 1163 45.32 6.44 351 43.83 6.70 812 45.97 6.21
Secondary Science 1013 45.89 7.62 279 42.91 7.61 734 47.02 7.32
Special Education 1979 39.76 8.77 839 38.66 8.48 1140 40.58 8.90
Technology and Engineering
Education
32 39.22 12.01 19 37.63 10.54 13 41.54 14.00
Visual Arts 419 45.38 7.32 176 43.71 7.42 243 46.59 7.01
Total 18436 44.27 7.76 6385 42.80 7.81 12051 45.06 7.62

edTPA ANNUAL ADMINISTRATIVE REPORT Data range: 1/1/2014 - 12/31/2014
61
13-Rubric Handbooks
All States Non-Policy States Policy States
Field N Mean Std. Deviation
N Mean Std. Deviation
N Mean Std. Deviation
Classical Languages 4 1 . 3
World Language 416 40.00 7.73 136 38.54 7.8 280 40.71 7.61
Total 420 39.96 7.74 137 38.44 7.8 283 40.70 7.59
18-Rubric Handbooks All States Non-Policy States Policy States
Field N Mean Std. Deviation
N Mean Std. Deviation N Mean Std. Deviation
Elementary Education 2285 53.44 9.40 390 49.37 9.70 1895 54.28 9.11

edTPA ANNUAL ADMINISTRATIVE REPORT Data range: 1/1/2014 - 12/31/2014
62
Appendix G: ANOVAs and Post-hoc Analyses One-way ANOVAs were run to examine significance of differences between subgroups in each demographic field. Post-hoc comparisons using the Games-Howell procedure, which does not rely on the assumption of equal variance between subgroups, were then considered to analyze differences within each category.
Note: Analyses presented do not include portfolios that do not fall into an interpretable category for that demographic field (i.e.: other, unidentified) or have a sample size of less than 100. Due to unequal sample sizes and variances between subgroups, all comparisons should be interpreted with caution.
Table 1: Teaching Placement Context
ANOVA
Sum of Squares
Df Mean Square F Sig.
Between Groups 12610.235 4 3152.559 55.297 .000
Within Groups 686754.942 12046 57.011
Total 699365.177 12050
Post Hoc Analyses
(I)
TeachingContext
(J)
TeachingContext
Mean Difference
(I-J)
Std. Error
Sig.
Rural Rural/Suburban -.829* .298 .043
Suburban -2.462* .206 .000
Suburban/urban -2.364* .278 .000
Urban -2.790* .215 .000
Rural/Suburban Rural .829* .298 .043

edTPA ANNUAL ADMINISTRATIVE REPORT Data range: 1/1/2014 - 12/31/2014
63
Suburban -1.633* .267 .000
Suburban/urban -1.535* .326 .000
Urban -1.961* .274 .000
Suburban Rural 2.462* .206 .000
Rural/Suburban 1.633* .267 .000
Suburban/urban .098 .245 .995
Urban -.328 .170 .304
Suburban/urban Rural 2.364* .278 .000
Rural/Suburban 1.535* .326 .000
Suburban -.098 .245 .995
Urban -.426 .253 .444
Urban Rural 2.790* .215 .000
Rural/Suburban 1.961* .274 .000
Suburban .328 .170 .304
Suburban/urban .426 .253 .444
*. The mean difference is significant at the 0.05 level.

edTPA ANNUAL ADMINISTRATIVE REPORT Data range: 1/1/2014 - 12/31/2014
64
Table 2: Ethnicity
ANOVA Sum of
Squares
Df Mean
Square
F Sig.
Between Groups 3440.452 3 1146.817 19.930 .000
Within Groups 638730.461 11100 57.543
Total 642170.913 11103
Post Hoc Analyses
(I) Ethnicity (J) Ethnicity Mean Difference (I-J)
Std.
Error Sig.
African
American/Black
Asian or Pacific
Islander
-4.131* .534 .000
Hispanic -2.343* .525 .000
White -2.411* .439 .000
Asian or Pacific
Islander
African
American/Black
4.131* .534 .000
Hispanic 1.788* .432 .000
White 1.720* .322 .000
Hispanic African
American/Black
2.343* .525 .000

edTPA ANNUAL ADMINISTRATIVE REPORT Data range: 1/1/2014 - 12/31/2014
65
Asian or Pacific
Islander
-1.788* .432 .000
White -.068 .307 .996
White African
American/Black
2.411* .439 .000
Asian or Pacific
Islander
-1.720* .322 .000
Hispanic .068 .307 .996
Table 3: Primary Language
ANOVA
Sum of
Squares
Df Mean
Square
F Sig.
Between
Groups
.759 1 .759 .013 .909
Within Groups 690806.320 11924 57.934
Total 690807.079 11925

edTPA ANNUAL ADMINISTRATIVE REPORT Data range: 1/1/2014 - 12/31/2014
66
Table 4: Gender
ANOVA
Sum of
Squares
Df Mean
Square
F Sig.
Between
Groups
1765.513 1 1765.513 30.600 .000
Within Groups 685943.133 11889 57.696
Total 687708.646 11890
Table 5: Education level ANOVA
Sum of
Squares
Df Mean
Square
F Sig.
Between
Groups
9282.386 3 3094.129 54.015 .000
Within Groups 690082.791 12047 57.283
Total 699365.177 12050

edTPA ANNUAL ADMINISTRATIVE REPORT Data range: 1/1/2014 - 12/31/2014
67
Post Hoc Analyses
(I) Education (J) Education Mean
Difference (I-J)
Std. Error
Sig.
HS/some College Bachelor's/Bachelor's
plus credits
-1.788* .142 .000
Master's/Master's plus
credits
-.883* .331 .039
Bachelor's/Bachel
or's plus credits
HS/some College 1.788* .142 .000
Master's/Master's plus
credits
.905* .334 .034
Master's/Master's
plus credits
HS/some College .883* .331 .039
Bachelor's/Bachelor's
plus credits
-.905* .334 .034
*. The mean difference is significant at the 0.05 level.

edTPA ANNUAL ADMINISTRATIVE REPORT Data range: 1/1/2014 - 12/31/2014
68
Appendix H: Demographic subgroups within teaching context The following tables present cross-tabs breakdowns of candidates’ ethnicity and gender within each teaching context.
Table 1: Ethnicity by Teaching Context
Teaching Context Ethnicity Mean N Std. Deviation
Rural African American/Black 36.00 17 7.27
American Indian or Alaskan
Native
37.86 14 9.39
Asian or Pacific Islander 43.92 12 5.57
Hispanic 43.74 62 8.62
White 43.09 1793 7.63
Multiracial 43.28 32 7.68
Other - 7 -
Undeclared 44.87 45 7.41
Total 43.05 1982 7.70
Rural/Suburban African American/Black 40.42 19 7.65
American Indian or Alaskan
Native
- 4 -
Asian or Pacific Islander 46.54 13 7.32
Hispanic 43.48 25 7.43

edTPA ANNUAL ADMINISTRATIVE REPORT Data range: 1/1/2014 - 12/31/2014
69
White 43.84 883 7.73
Multiracial 45.59 32 7.65
Other - - -
Undeclared 43.71 34 7.80
Total 43.88 1018 7.73
Suburban African American/Black 42.48 75 7.37
American Indian or Alaskan
Native
44.62 13 8.85
Asian or Pacific Islander 46.22 156 7.05
Hispanic 44.74 182 7.52
White 45.58 3526 7.24
Multiracial 46.32 107 6.78
Other 42.94 32 7.35
Undeclared 45.74 111 7.54
Total 45.51 4202 7.26
Suburban/urban African American/Black 41.46 28 7.19
American Indian or Alaskan
Native
- 2 -
Asian or Pacific Islander 47.18 55 7.77
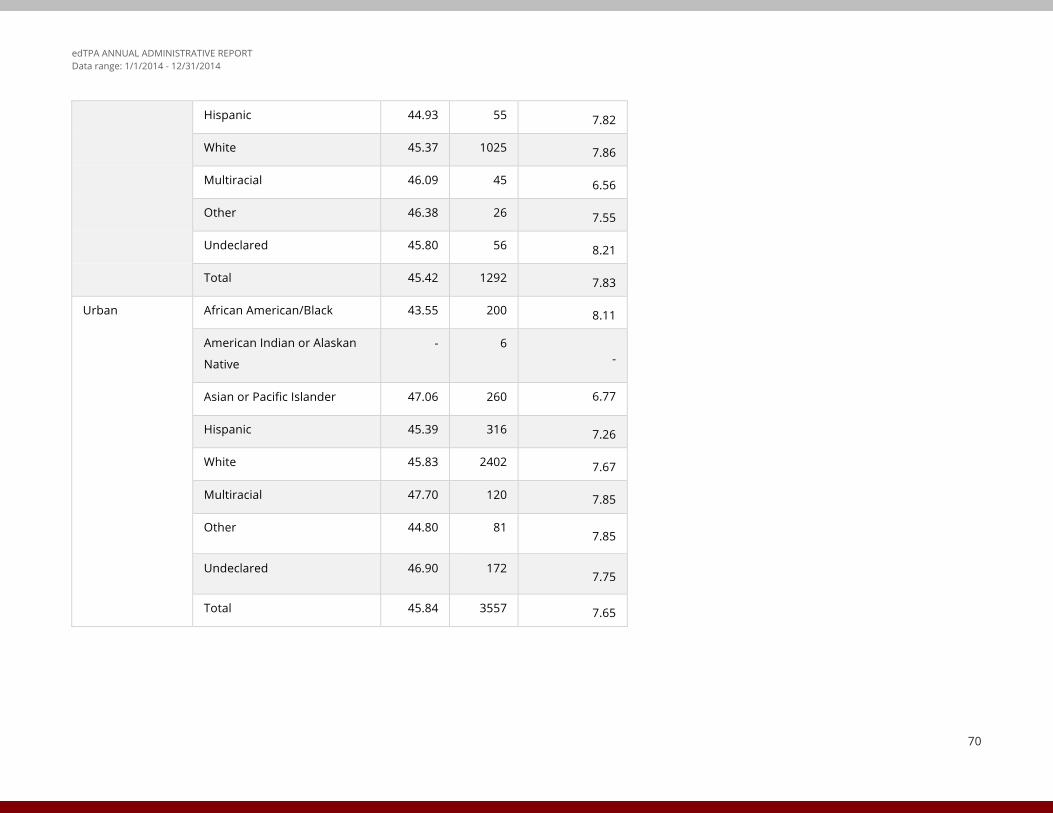
edTPA ANNUAL ADMINISTRATIVE REPORT Data range: 1/1/2014 - 12/31/2014
70
Hispanic 44.93 55 7.82
White 45.37 1025 7.86
Multiracial 46.09 45 6.56
Other 46.38 26 7.55
Undeclared 45.80 56 8.21
Total 45.42 1292 7.83
Urban African American/Black 43.55 200 8.11
American Indian or Alaskan
Native
- 6 -
Asian or Pacific Islander 47.06 260 6.77
Hispanic 45.39 316 7.26
White 45.83 2402 7.67
Multiracial 47.70 120 7.85
Other 44.80 81 7.85
Undeclared 46.90 172 7.75
Total 45.84 3557 7.65

edTPA ANNUAL ADMINISTRATIVE REPORT Data range: 1/1/2014 - 12/31/2014
71
Table 2: Gender by Teaching Context
Teaching Context Gender Mean N Std. Deviation
Rural Male 41.45 432 7.85
Female 43.50 1524 7.62
Total 43.05 1982 7.70
Rural/Suburban Male 43.72 285 7.81
Female 43.94 721 7.67
Total 43.88 1018 7.73
Suburban Male 44.62 805 7.57
Female 45.72 3356 7.17
Total 45.51 4202 7.26
Suburban/urban Male 44.94 350 8.29
Female 45.60 924 7.62
Total 45.42 1292 7.83
Urban Male 45.61 779 8.07
Female 45.94 2715 7.48
Total 45.84 3557 7.65

edTPA ANNUAL ADMINISTRATIVE REPORT Data range: 1/1/2014 - 12/31/2014
72
Appendix I: National Technical Advisory Committee (TAC)
Members Institution
Andrew Porter University of Pennsylvania
Jim Pellegrino University of Illinois at Chicago
Pam Moss University of Michigan
Andy Ho Harvard University
Lloyd Bond Carnegie Foundation
Brian Gong The National Center for the Improvement of Educational Assessment
Bob Linn University of Colorado, Boulder
Stuart Kahl Measured Progress
Eva Baker University of California, Los Angeles
Jamal Abedi University of California, Davis
Edward Haertel Stanford University
Mark Wilson University of California, Berkeley
Lorrie Shepard University of Colorado, Boulder
Linda Darling-Hammond Stanford University
Ruth Chung Wei Stanford University
David Pearson University of California, Berkeley
Anthony S. Bryk The Carnegie Foundation
Susanna Loeb Stanford University
James Popham University of California, Los Angeles
Etta Hollins University of Missouri – Kansas City
All members of the national technical advisory committee were presented with the draft version of this report and had an opportunity to provide comments and feedback. Several other experts in the field were consulted and provided valuable recommendations. We thank them for their ongoing input and guidance.
edTPA ANNUAL ADMINISTRATIVE REPORT Data range: 1/1/2014 - 12/31/2014
73
Citations Adkins, A., Klass, P., & Palmer, E. (2015). Identifying demographic and preserve teacher performance predictors of success on the edTPA. Paper Presented at the 2015 Hawaii
International Conference on Education. Honolulu, Hawaii.
American Educational Research Association, American Psychological Association, National Council on Measurement in Education. (2014). Standards for educational and psychological testing. Washington, DC: American Educational Research Association.
Bell, C. A., Gitomer, D. H., McCaffrey, D. F., Hamre, B. K., Pianta, R. C., & Qi, Y. (2012). An argument approach to observation protocol validity. Educational Assessment, 17(2-3), 62–87. doi:10.1080/10627197.2012.715014
Benner, S.M. & Wishart, B. (2015) Teacher preparation program impact on student learning: Correlations between edTPA, and VAM levels of effectiveness. Paper presented at the 2015 annual meeting of the meeting of the American Educational Research Association, Chicago, IL.
Black, P., & Wiliam, D. (1998). Inside the black box: Raising standards through classroom assessment. Phi Delta Kappan, 80(2), 139–148.
Brennan, R. L., & Prediger, D. J. (1981). Coefficient Kappa: Some uses, misuses, and alternatives. Educational and Psychological Measurement, 41(3), 687-699.
Brown, T. A. (2006). Confirmatory factor analysis for applied research. New York: The Guilford Press.
Cavalluzzo, L., Barrow, L., Mokher, C., Geraghty, T., & Sartain, L. (2014). From Large Urban to Small Rural Schools: An empirical study of National Board certification and teaching effectiveness. Alexandria, VA: The CNA Corporation. Retrieved from http://www.cna.org/sites/default/files/research/IRM-2015-U 010313.pdf.
Cowan, J., & Goldhaber, D. (2015). National Board Certification and Teacher Effectiveness: Evidence from Washington. Technical Report 2015-1, Center for Education Data and Research, Seattle, WA. Retrieved from http://www.cedr.us/papers/working/CEDR%20WP%2020153_NBPTS%20Cert.pdf.
Chodorow, M., & Burstein, J. (2004). Beyond Essay Length: Evaluating e-raters' performance on TOEFL testing. ETS Research Report Series, 2004(1), i-38.
Chung, R. R. (2008). Beyond assessment: Performance assessments in teacher education. Teacher Education Quarterly, 35(1), 8-28.
Cohen, J. (1960). A coefficient of agreement for nominal scales. Educational and Psychological Measurement, 20(1), 37-46.
Cronbach, L. J. (1951). Coefficient alpha and the internal structure of tests. Psychometrika, 16, 297-334
Darling-Hammond, L. (2010). Evaluating teacher effectiveness: How teacher performance assessments can measure and improve teaching. Washington, DC: Center for American Progress.
Darling-Hammond, L., & Falk, B. (2013). Teacher learning through assessment: How student-performance assessments can support teacher learning. Center for American Progress. Retrieved from www.americanprogress.org.
Darling-Hammond, L., Newton, S. P., & Wei, R. C. (2013). Developing and assessing beginning teacher effectiveness: The potential of performance assessments. Educational Assessment, Evaluation and Accountability, 25(3), 179-204.

edTPA ANNUAL ADMINISTRATIVE REPORT Data range: 1/1/2014 - 12/31/2014
74
Duckor, B., Castellano, K. E., Tellez, K., Wihardini, D., & Wilson, M. (2014). Examining the internal structure evidence for the Performance Assessment for California Teachers: A validation study of the Elementary Literacy Teaching Event for Tier I teacher licensure. Journal of Teacher Education, 65(5), 402–420. http://doi.org/10.1177/0022487114542517
Gardner, P. L. (1970), Test Length and the Standard Error of Measurement. Journal of Educational Measurement, 7: 271–273.
Goldhaber, D., & Hansen, M. (2010). Race, gender, and teacher testing: How informative a tool is teacher licensure testing?. American Educational Research Journal, 47(1), 218-251.
Gillham, J.C. & Gallagher, D. (2015). Pilot Implementation of the edTPA in Ohio. Paper presented at the 2015 annual meeting of the American Association of Colleges for Teacher Education, Atlanta, GA.
Haertel, E. H. (2008). Standard setting. In K. E. Ryan & L. A. Shepard (Eds.), The future of test-based educational accountability (pp. 139–154). New York: Taylor & Francis.
Haertel, E. H., Beimers, J. N., & Miles, J. A. (2012). The briefing book method. In G. J. Cizek (Ed.), Setting performance standards: Foundations, methods, and innovations (2nd ed., pp. 283–299). New York, NY: Routledge.
Haertel, E. H., & Lorié, W. A. (2004). Validating standards-based test score interpretations. Measurement: Interdisciplinary.
Kane, M. (2004). Certification testing as an illustration of argument-based validation. Measurement: Interdisciplinary Research & Perspective, 2(3), 135–170.
Kane, M. (2006). Validation. In R. Brennan (Ed.), Educational measurement (4th ed., pp.17–64). Westport, CT: American Council on Education and Praeger.
Kiefer, T., Robitzsch, A., & Wu, M. L. (2015). Test analysis modules (Version 1.6-0) [R Package]. Retrieved from http://cran.us.r-project.org/web/packages/TAM/index.html
Kleyn, T., López, D., & Makar, C. (2015). What About Bilingualism? A Critical Reflection on the edTPA With Teachers of Emergent Bilinguals, Bilingual Research Journal: The Journal of the National Association for Bilingual Education, 38:1, 88-106, DOI: 10.1080/15235882.2015.1017029
Lin, S. (2015) Learning through Action: Teacher Candidates and Performance Assessments. Doctoral dissertation, University of Washington, Seattle, WA.
Liu, L. B., & Milman, N. B. (2013). Year one implications of a teacher performance assessment's impact on Multicultural Education across a secondary education teacher preparation program. Action in Teacher Education, 35(2), 125-142.
Lord, F. M. (1959). Tests of the same length do have the same standard error of measurement. Educational and Psychological Measurement, 19, 233-239.
Masters, G. N. (1982). A Rasch model for partial credit scoring. Psychometrika, 47(2), 149–174.
Mertler, C. A. (2009). Teachers' assessment knowledge and their perceptions of the impact of classroom assessment professional development. Improving Schools, 12(2), 101-113.
Otero, V. K. (2006). Moving beyond the ‘‘Get it or don’t’’ conception of formative assessment. Journal of Teacher Education, 57, 247–255.
edTPA ANNUAL ADMINISTRATIVE REPORT Data range: 1/1/2014 - 12/31/2014
75
Pecheone, R. L., & Chung, R. R. (2006). Evidence in teacher education: The Performance Assessment for California Teachers (PACT). Journal of Teacher Education, 57(1), 22–36. doi:10.1177/0022487105284045
Peck, C., Gallucci, C., & Sloan, T. (2010). Negotiating implementation of high-stakes performance assessment policies in teacher education: From compliance to inquiry. Journal of Teacher Education, 61(5), 451-463. doi: 10.1177/0022487109354520
Peck, C., Gallucci, C., Sloan, T., & Lippincott, A. (2009). Organizational learning and program renewal in teacher education: A socio-cultural theory of learning, innovation and change. Educational Research Review, 4, 16-25. doi:10.1016/j.edurev.2008.06.001
Peck, C., & McDonald, M. (2013). Creating “cultures of evidence” in teacher education: Context, policy and practice in three high data use programs. The New Educator, 9(1), 12-28. doi: 10.1080/1547688X.2013.751312
Peck, C. A., Singer-Gabella, M., Sloan, T., & Lin, S. (2014). Driving blind: Why we need standardized performance assessment in teacher education. Journal of Curriculum and Instruction, 8(1), 8-30.
Powers, D. E. (2000). Computing reader agreement for the GRE Writing Assessment. Princeton, NJ: Educational Testing Service
Rosseel, Y. (2012). lavaan: An R package for structural equation modeling. Journal of Statistical Software, 48(2), 1–36.
Sandholtz, J. H., & Shea, L. M. (2012). Predicting performance: A comparison of university supervisors’ predictions and teacher candidates’ scores on a teaching performance assessment. Journal of Teacher Education, 63(1), 39–50. doi:10.1177/0022487111421175
Sato, M. (2014). What is the underlying conception of teaching of the edTPA? Journal of Teacher Education, 0022487114542518.
Shepard, L. A. (1993). Evaluating test validity. Review of research in education, 405-450.
Siegel, M. A., & Wissehr, C. (2011). Preparing for the plunge: Preservice teachers’ assessment literacy. Journal of Science Teacher Education, 22(4), 371-391.
Sloan, T. (2013). Distributed leadership and organizational change: Implementation of a teaching performance measure. The New Educator, 9, 29-53. doi: 10.1080/1547688X.2013.751313
Stanford Center for Assessment, Learning and Equity (SCALE). (2013). edTPA Field test: Summary report. Palo Alto, CA: Author.
Stemler, S. E., & Tsai, J. (2008). Best practices in interrater reliability: Three common approaches. Best practices in quantitative methods, 29-4
Stillman, J., Anderson, L., Arellano, A., Lindquist Wong, P., Berta-Avila, M., Alfaro, C., & Struthers, K. (2013). Putting PACT in context and context in PACT: Teacher educators collaborating around program-specific and shared learning goals. Teacher Education Quarterly, 40(4), 135-157.
Whittaker, A., & Nelson, C. (2013). Assessment with an “End in View”. The New Educator, 9(1), 77-93.
Wu, M. L., Adams, R. J., Wilson, M. R., & Haldane, S. A. (2007). ACER ConQuest version 2.0: Generalised item response modeling software. ACER Press.