executive summary affirmative action plan summary affirmative action plan, 2012-2013 university of...
TRANSCRIPT
EXECUTIVE SUMMARY
AFFIRMATIVE ACTION PLAN
University of Massachusetts Lowell 2012 – 2013

Executive Summary Affirmative Action Plan, 2012-2013 University of Massachusetts Lowell
EXECUTIVE SUMMARY
AFFIRMATIVE ACTION PLAN
University of Massachusetts Lowell
2012 - 2013
TABLE OF CONTENTS Chancellor’s Statement .................................................................................................... 1
Policy on Equal Opportunity ........................................................................................ 2
Statement from Associate Vice Chancellor for Human Resources and Equal Opportunity & Outreach .................................................................................. 4
Workplace Profile and Utilization Analysis ................................................................... 6
Table 1. Historically Under-Represented Groups in Workforce .............................. 10
Table 2. Overview of Workforce, March 31, 2010-2012 ........................................... 12
Table 3. Faculty Utilization Analysis ........................................................................ 13
Table 4. Non-Faculty Utilization Analysis ................................................................ 15
Areas of Special Concern ............................................................................................... 16
Affirmative Initiatives .................................................................................................... 18
Goals ............................................................................................................................ 22
Appendices ....................................................................................................................... 27
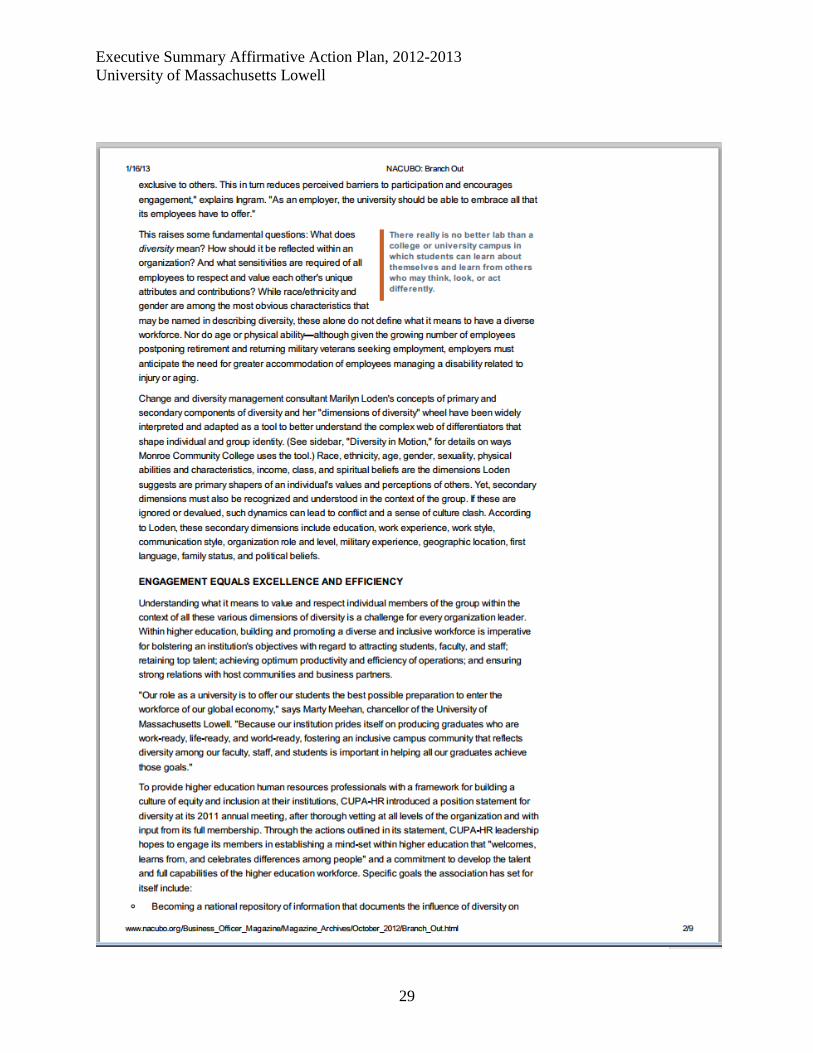
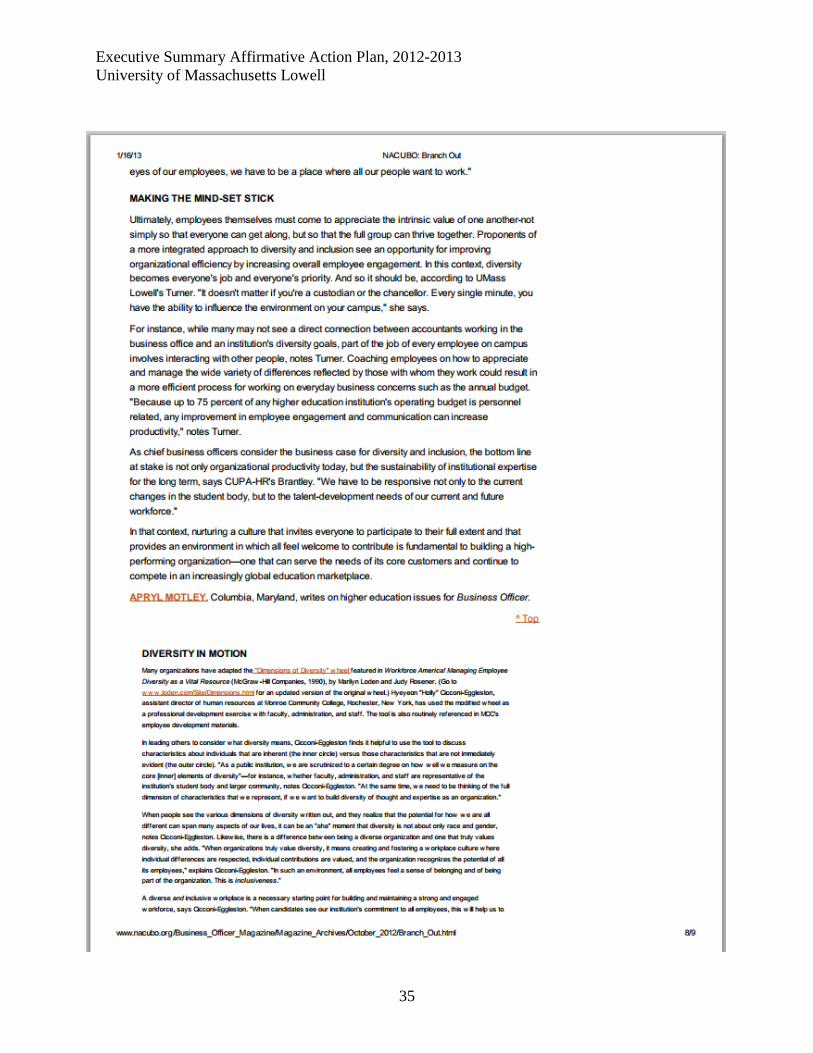
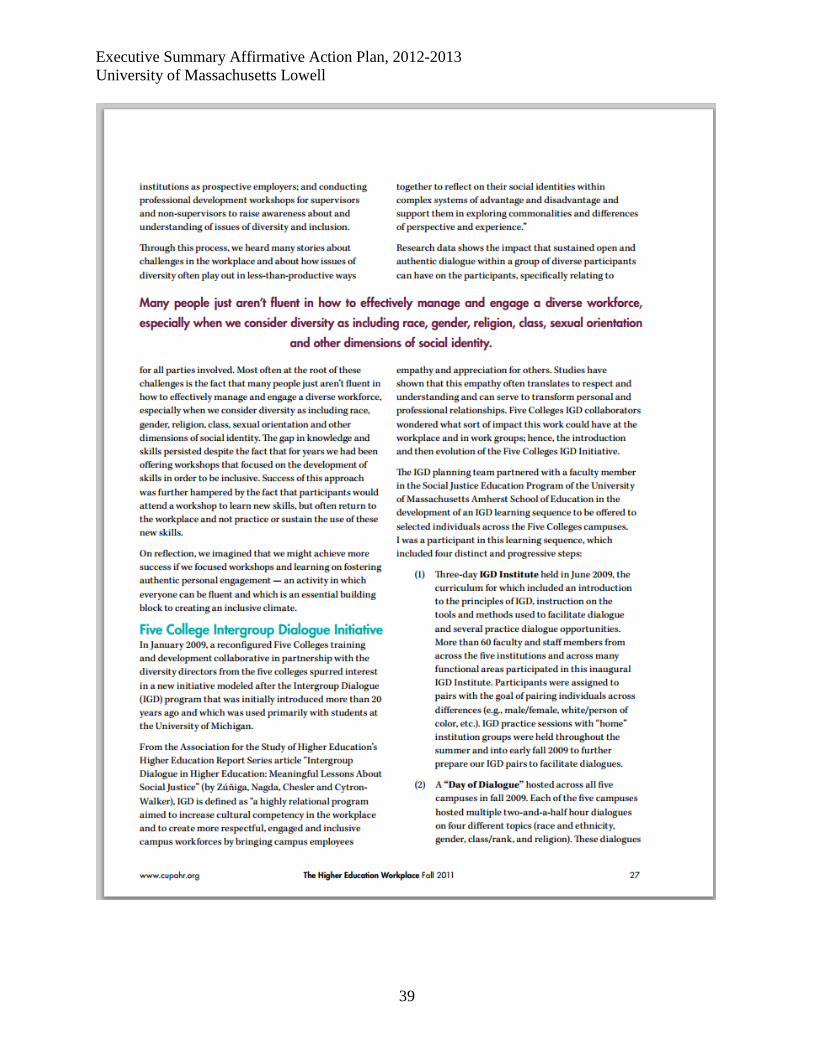
Appendix 1. Article: Branch Out ............................................................................... 27
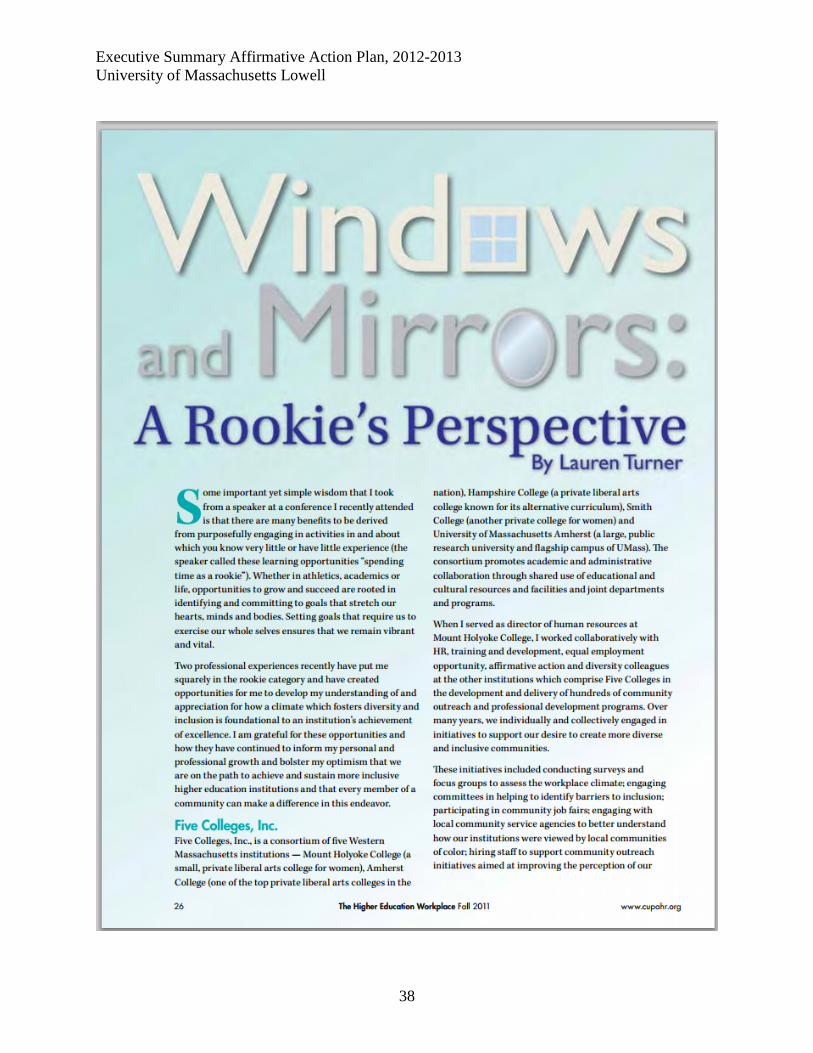
Appendix 2. Article: Windows and Mirrors: A Rookie’s Perspective ...................... 37
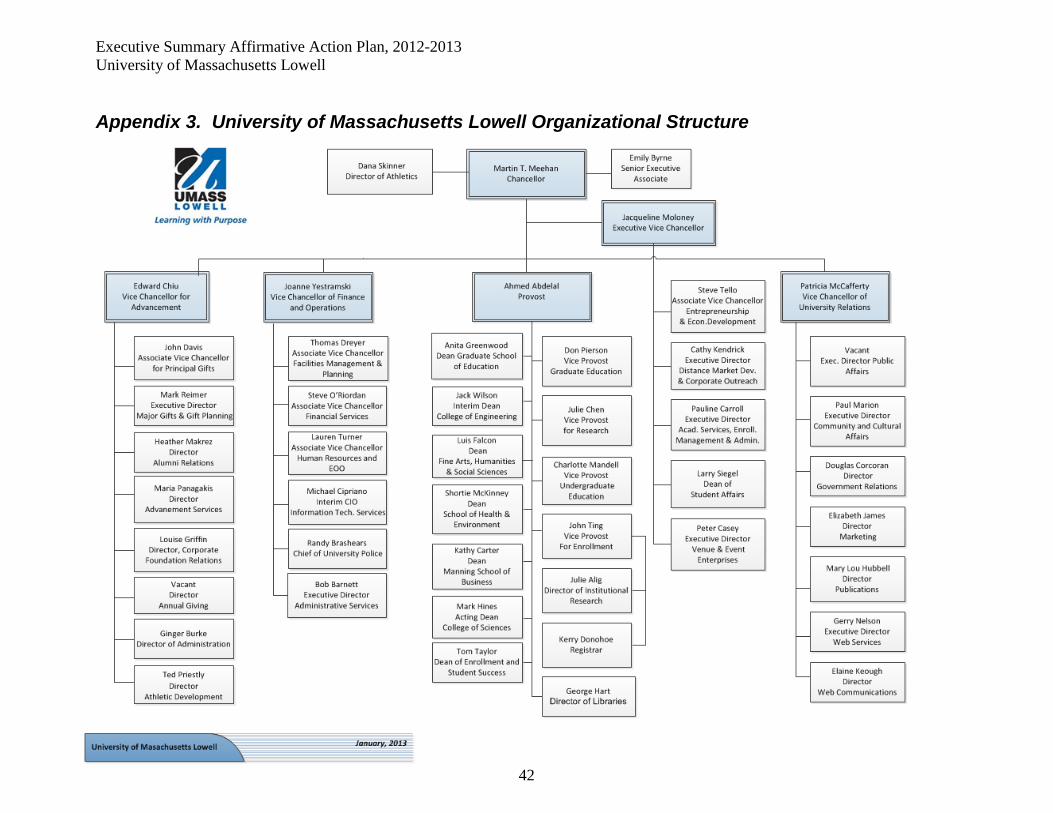
Appendix 3. University of Massachusetts Lowell Organizational Structure ........... 42
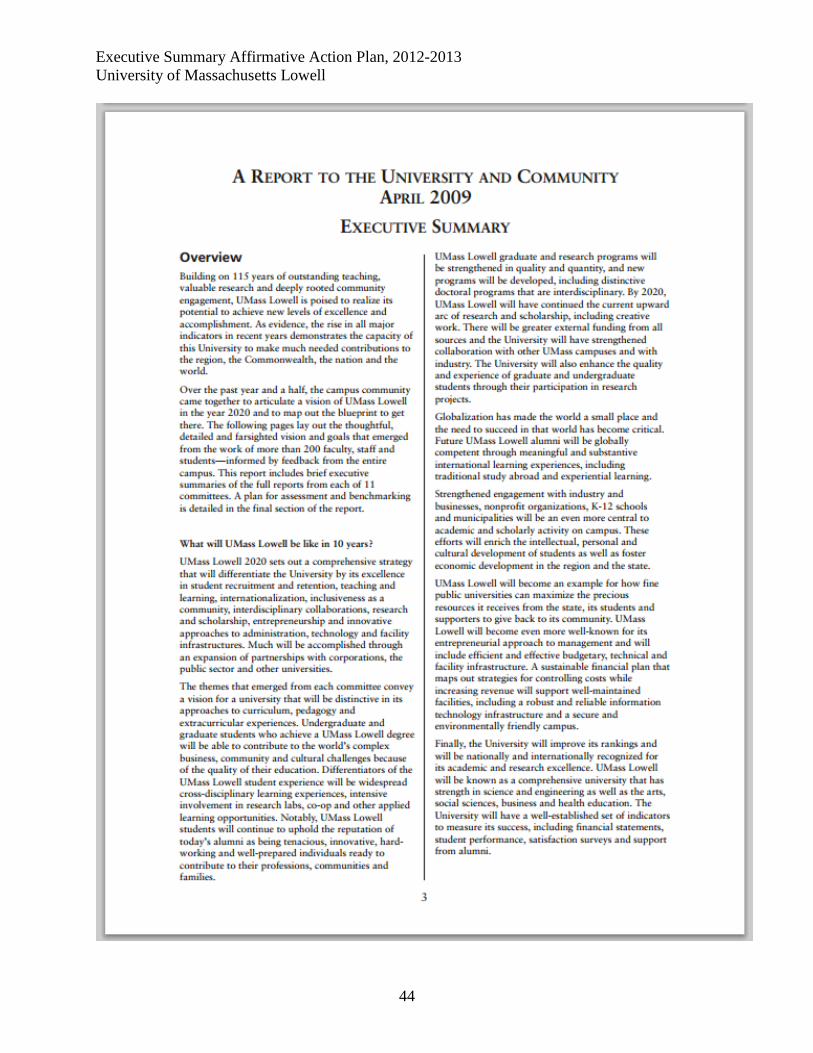
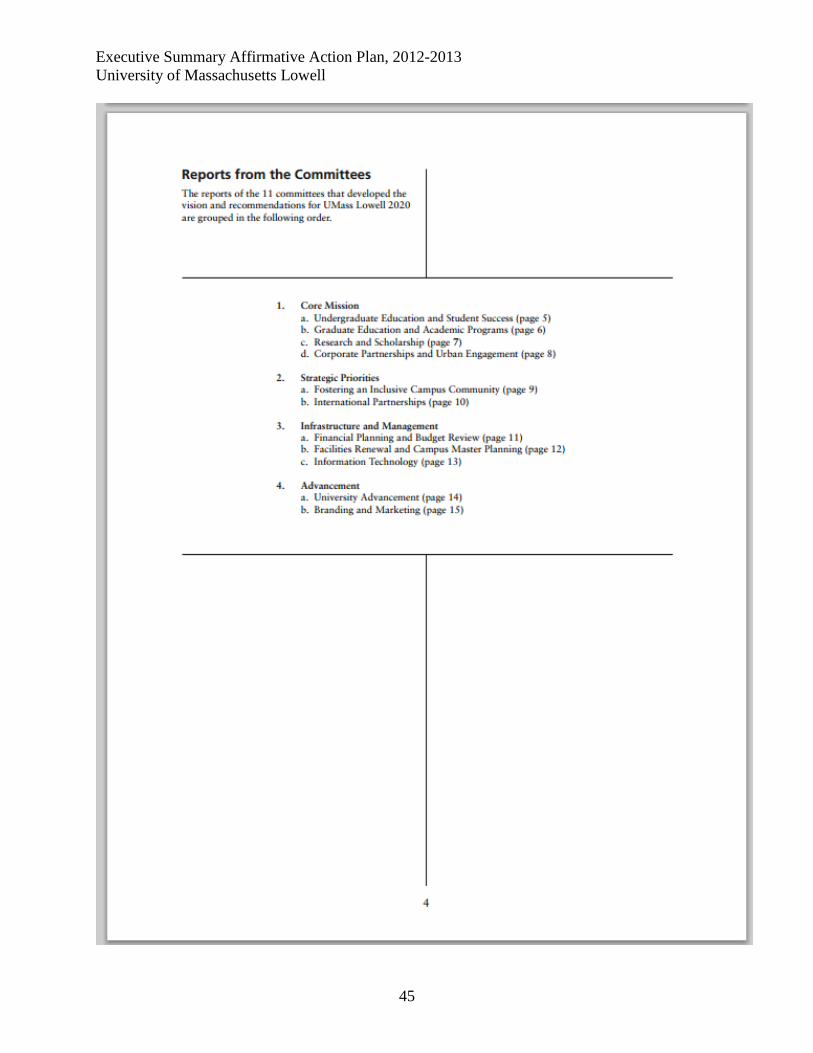
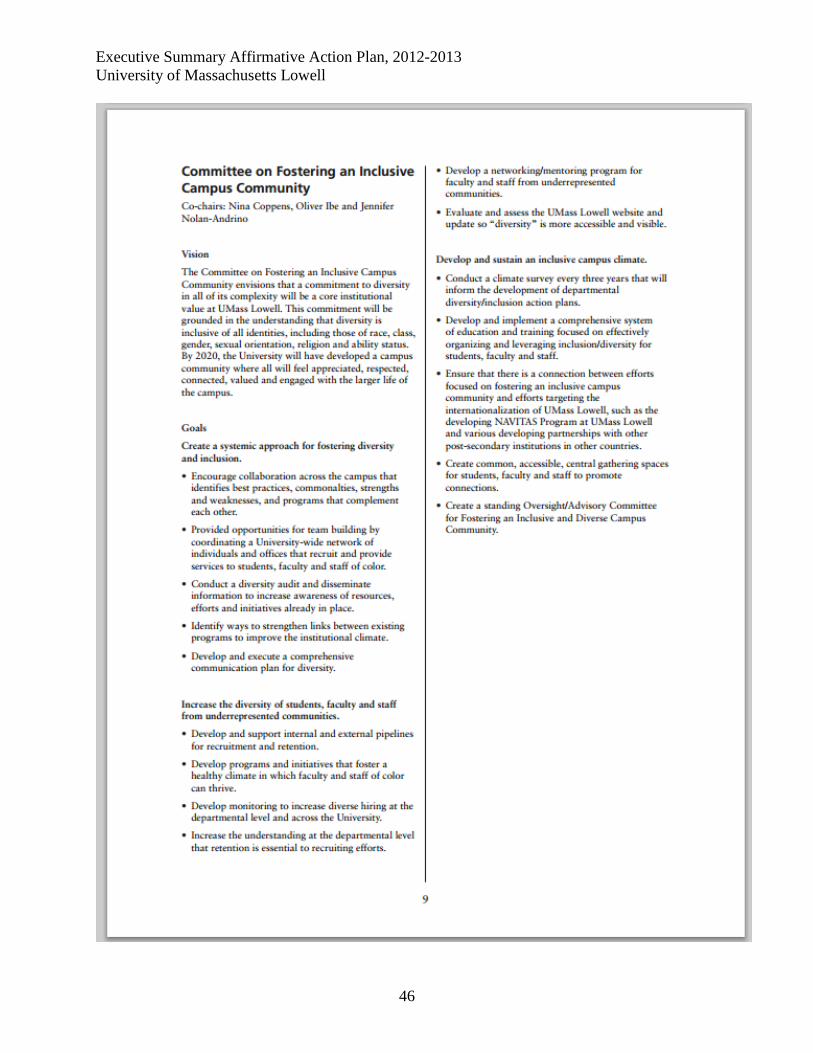
Appendix 4. Excerpts from the UMass Lowell Strategic Plan 2020 ........................ 43
Appendix 5. Mission and Pillars of Excellence for UMass Lowell 2020 ................. 47
Appendix 6. Strategic Hiring – Recruitment Search Advising Partnership ............ 48
Appendix 7. The Commonwealth Compact Pledge ................................................... 49
Appendix 8. The Merrimack Valley Commonwealth Compact ................................ 50

1
Executive Summary Affirmative Action Plan, 2012-2013 University of Massachusetts Lowell
2
Policy on Equal Opportunity
UNIVERSITY OF MASSACHUSETTS LOWELL Lowell, Massachusetts 01854
Policy on Equal Opportunity
The University of Massachusetts Lowell, as a public institution of higher education of the commonwealth, recognizes its responsibility to promote the interests and welfare of the public which it serves. In so doing, UMass Lowell reaffirms its commitment to a policy of equal opportunity in the exercise of all its charges and obligations. Equal opportunity is not only just, it is also the foundation for inclusive and highly effective working and learning environments in which all members of our community may thrive.
UMass Lowell is committed to engaging in employment and academic practices that do not discriminate. University policy dictates that factors such as gender, race, color, religion, disability, national origin, age, sexual orientation, genetic information, marital status and veteran status will not be used to determine merit. Further, these factors shall not be the basis of intimidation or other harassing behaviors that adversely impact an employee’s performance or a student’s participation. Retaliation against anyone who raises concerns about discrimination is equally prohibited. No employee will be fired, demoted, harassed, intimidated or otherwise "retaliated" against for filing a charge of discrimination, participating in a discrimination proceeding or otherwise opposing discrimination. This policy is in accord with Title VII of the Civil Rights Act of 1964, and Massachusetts General Law, ch. 151B. In compliance with Title IX of the Education Amendments Act of 1972, gender is not a factor in the University’s provision of access to its educational programs and activities. Any member of the campus community should contact Equal Opportunity and Outreach (EOO) with a concern or complaint of discrimination. Administrators, faculty and staff who direct the work of others in supervisory roles are required to report possible discrimination or hostile behavior based on membership in the protected categories above to EOO. These matters will be responded to with prompt concern to facilitate resolution. If the provisions of this policy opposing discrimination are violated, the University will take appropriate steps to halt the inappropriate behavior and address its effects. The EOO staff, located in Wannalancit Mills Suite 301, 978-934-3565, fax 978-934-3032, will assist in resolving complaints and may also be contacted for viewing of the Affirmative Action Plan.
Executive Summary Affirmative Action Plan, 2012-2013 University of Massachusetts Lowell
3
These provisions not only enact the requirements of law, they also serve as the basis for the best possible education and the most effective workplace. As a performance factor, University officials are charged with the responsibility to support this and other equal opportunity policies and the Affirmative Action Plan. They are expected to be actively engaged in developing and achieving designated objectives and goals. All employees are required to comply with this policy and are encouraged to foster inclusion with colleagues and to identify and eliminate unnecessary barriers that could impede recruitment and hiring of underrepresented qualified applicants or advancement and achievement by members of the University community. The Director of Equal Opportunity and Outreach is responsible for implementation of the affirmative action program. The University’s Affirmative Action Plan is available for inspection from 9 a.m. to 4 p.m. weekdays in Equal Opportunity and Outreach, 600 Suffolk Street, Wannalancit Mills, 3rd Floor, Lowell, MA. Additional information is also available at http://www.uml.edu/equal.
Series 2013 - 2014

Executive Summary Affirmative Action Plan, 2012-2013 University of Massachusetts Lowell
4
Statement from Associate Vice Chancellor for Human Resources and Equal Opportunity & Outreach Members of the Department of Human Resources and Equal Opportunity & Outreach at UMass Lowell work collaboratively with the University community to foster a diverse and inclusive environment. With Chancellor Meehan’s continued emphasis on excellence – achieved through diversity, innovation and entrepreneurship, the Lowell campus remains strategically focused on maintaining a workforce climate that is inclusive and a workforce that is engaged. Strategies toward this end are best articulated and results actualized when all stakeholders work in synchrony toward equal employment opportunity and affirmative action goals. Under Chancellor Meehan’s leadership, the University has experienced amazing growth and transformation. One of the hallmarks of UMass Lowell has been its dedication to innovation and entrepreneurship. UMass Lowell employees are excited about this entrepreneurial spirit, and report a high level of confidence in the stewardship being provided by the University’s senior leadership.1 This confidence invites active engagement in support of important University Affirmative Action goals and priorities. Conceptually, the Affirmative Action Plan is the result of hundreds of extensive conversations with members across every division of the University, including front-line supervisors, department managers, staff, labor union representatives, chief academic and executive administrators, deans, and faculty. These conversations involved a wide array of workforce management issues. As examples, we discussed strategies to develop more diverse applicant pools, increase opportunities for career advancement for incumbent employees, foster an inclusive workplace environment which supports employee retention and engagement, support services for veterans, remove barriers for disabled applicants and employees, improve our technology infrastructure to better track and report on workforce data, and leverage our rapid increase in student diversity to positively impact our workforce.
All of these conversations have been motivated by our shared understanding that our excellence as an institution of higher learning is laid on the foundation of principles and practices which promote an inclusive workplace. Even more critical than our creation of goals and plans is the participation of each of us in working towards their achievement. I am excited to have joined the University community after spending nearly 32 years in human resources leadership at Mount Holyoke College, a private, liberal arts college for women in western Massachusetts. The palpable campus engagement described above and the foundational mission of the University to serve the public good attracted me to the University of Massachusetts Lowell and keeps me thoroughly engaged. My personal and professional commitment to higher education human resources, diversity, inclusion and affirmative action, and my engagement in the broader community of higher education human resources nationally 1 Source: Over 55 percent of UMass Lowell employees participated in the Top 100 Places to Work Survey that the Boston Globe conducted in June. The results, compiled by an independent research company, include a summary of staff and faculty opinions about their jobs and UMass Lowell’s overall organizational health.
Executive Summary Affirmative Action Plan, 2012-2013 University of Massachusetts Lowell
6
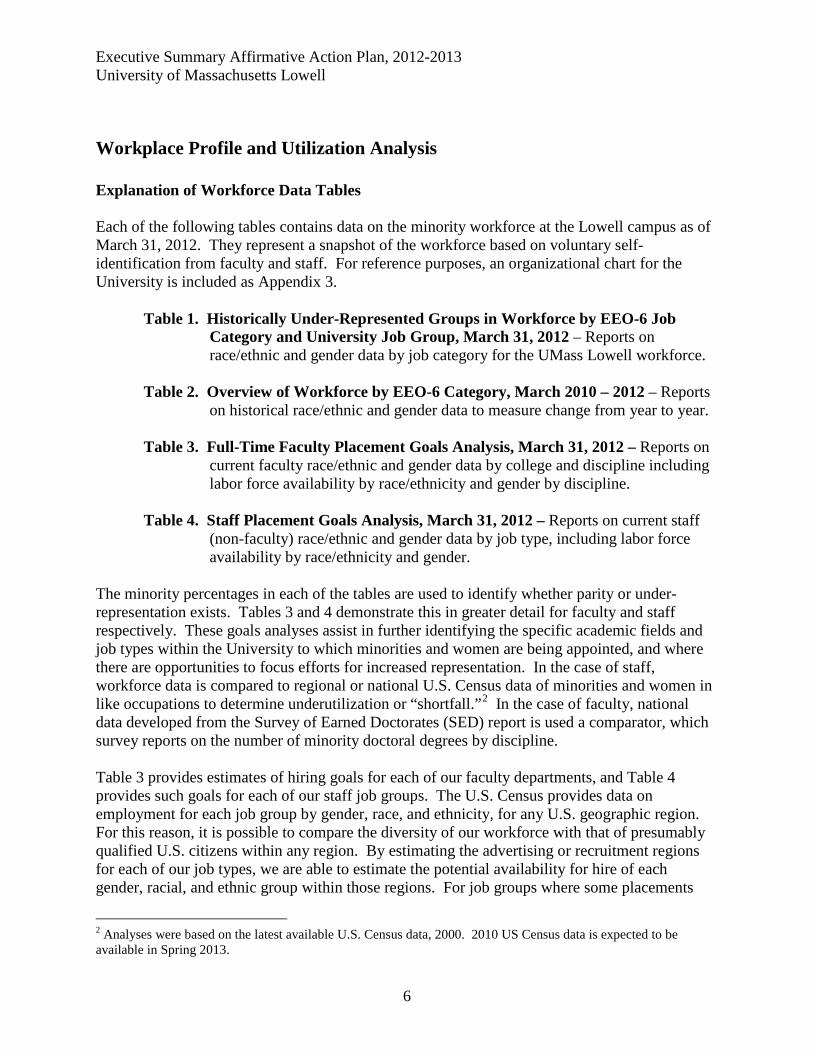
Workplace Profile and Utilization Analysis Explanation of Workforce Data Tables Each of the following tables contains data on the minority workforce at the Lowell campus as of March 31, 2012. They represent a snapshot of the workforce based on voluntary self-identification from faculty and staff. For reference purposes, an organizational chart for the University is included as Appendix 3.
Table 1. Historically Under-Represented Groups in Workforce by EEO-6 Job Category and University Job Group, March 31, 2012 – Reports on race/ethnic and gender data by job category for the UMass Lowell workforce.
Table 2. Overview of Workforce by EEO-6 Category, March 2010 – 2012 – Reports
on historical race/ethnic and gender data to measure change from year to year. Table 3. Full-Time Faculty Placement Goals Analysis, March 31, 2012 – Reports on
current faculty race/ethnic and gender data by college and discipline including labor force availability by race/ethnicity and gender by discipline.
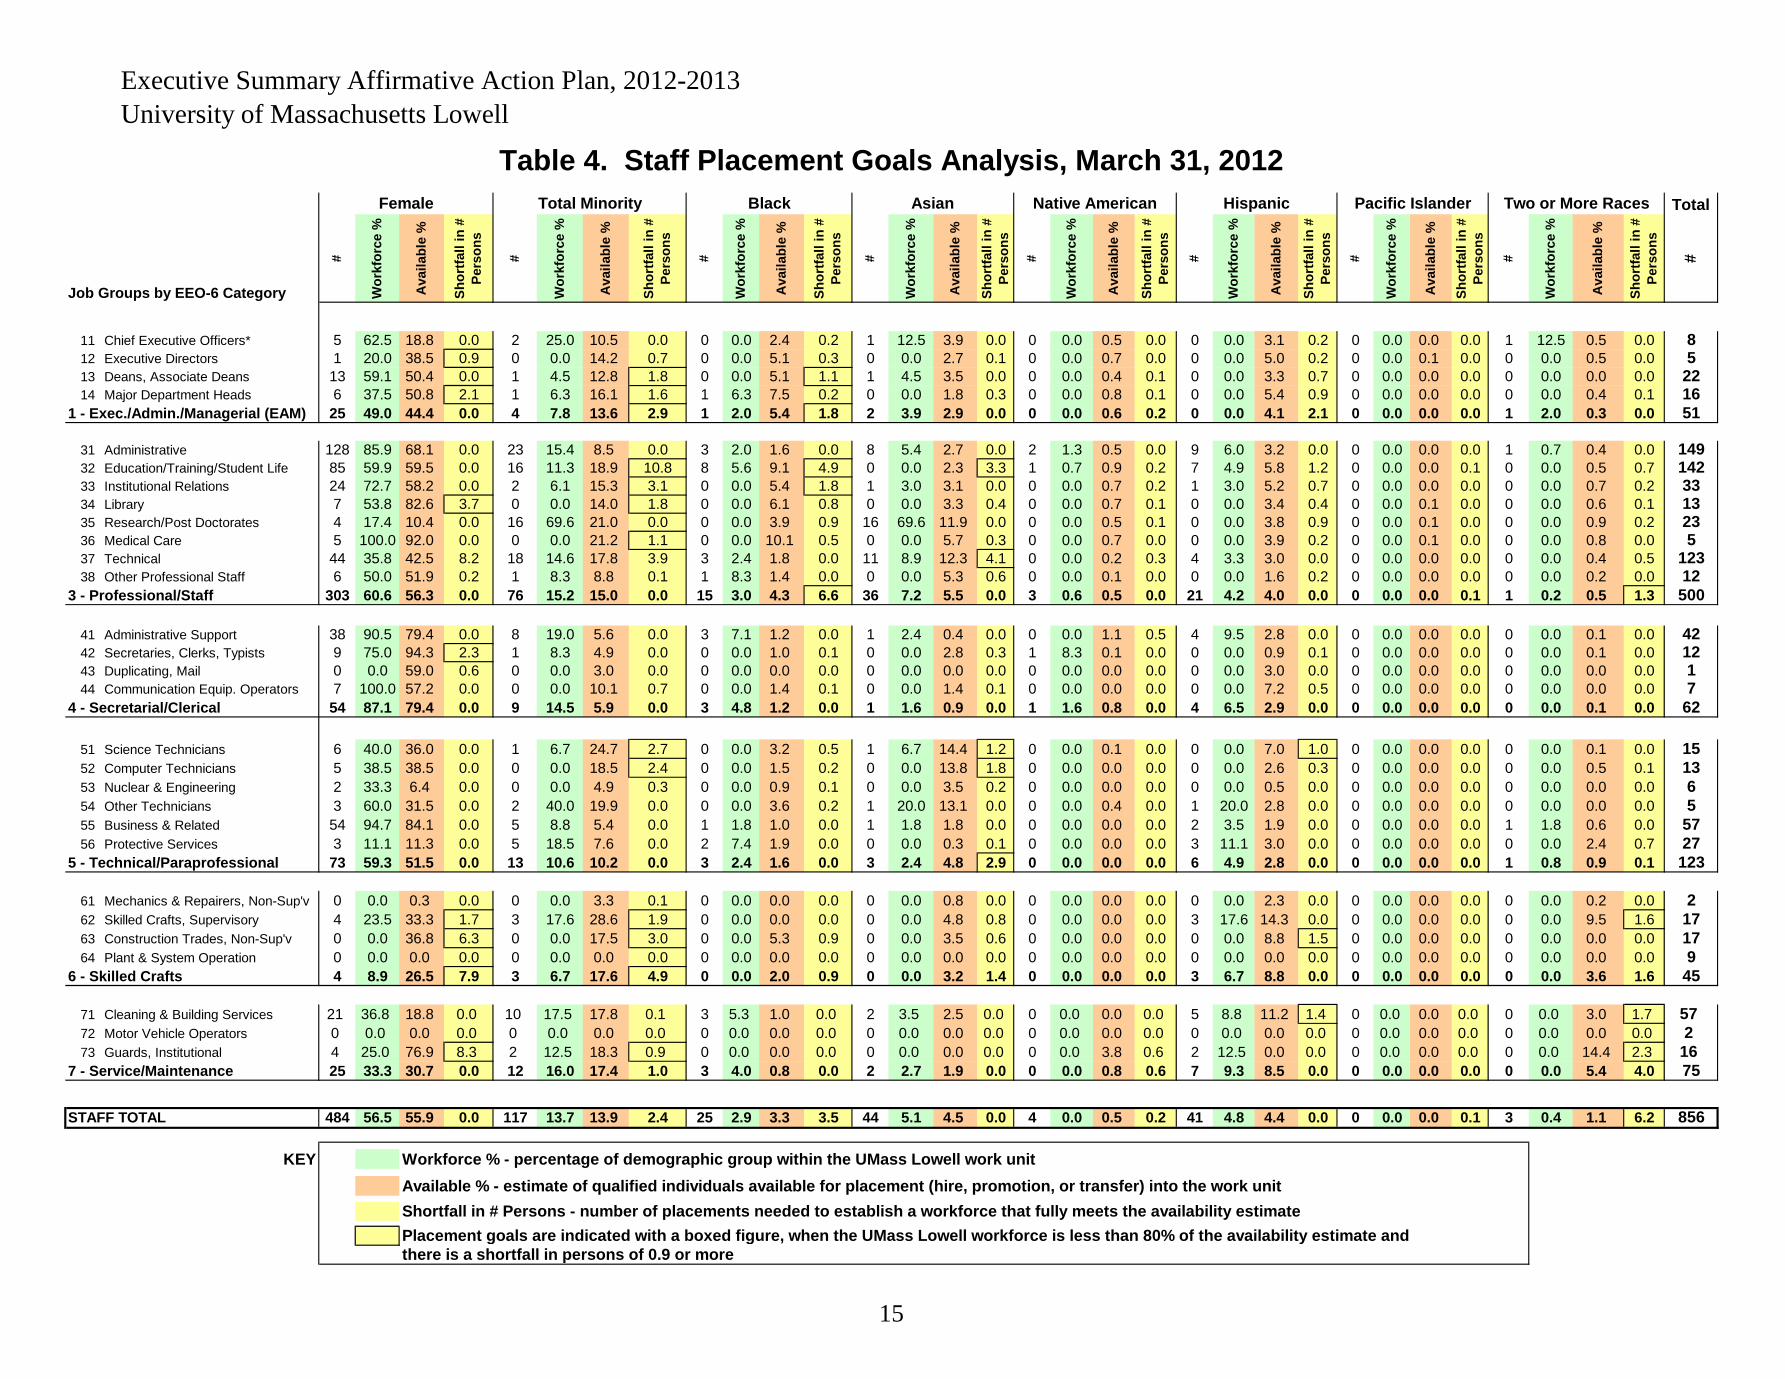
Table 4. Staff Placement Goals Analysis, March 31, 2012 – Reports on current staff
(non-faculty) race/ethnic and gender data by job type, including labor force availability by race/ethnicity and gender.
The minority percentages in each of the tables are used to identify whether parity or under-representation exists. Tables 3 and 4 demonstrate this in greater detail for faculty and staff respectively. These goals analyses assist in further identifying the specific academic fields and job types within the University to which minorities and women are being appointed, and where there are opportunities to focus efforts for increased representation. In the case of staff, workforce data is compared to regional or national U.S. Census data of minorities and women in like occupations to determine underutilization or “shortfall.”2 In the case of faculty, national data developed from the Survey of Earned Doctorates (SED) report is used a comparator, which survey reports on the number of minority doctoral degrees by discipline. Table 3 provides estimates of hiring goals for each of our faculty departments, and Table 4 provides such goals for each of our staff job groups. The U.S. Census provides data on employment for each job group by gender, race, and ethnicity, for any U.S. geographic region. For this reason, it is possible to compare the diversity of our workforce with that of presumably qualified U.S. citizens within any region. By estimating the advertising or recruitment regions for each of our job types, we are able to estimate the potential availability for hire of each gender, racial, and ethnic group within those regions. For job groups where some placements
2 Analyses were based on the latest available U.S. Census data, 2000. 2010 US Census data is expected to be available in Spring 2013.

Executive Summary Affirmative Action Plan, 2012-2013 University of Massachusetts Lowell
7
over the past three years are due to promotions or transfers, rather than hires, the Census data availability is weighted with internal availabilities accordingly. The availability estimates provide benchmarks, or goals, for the diversity of our own workforce. For example:
o The U.S. Census indicates that in the census region in which we recruit for science technicians, Greater Lowell and Southern New Hampshire, 41.41% of people working in these jobs are women. In fact, 40% of UMass Lowell employees are women – the goal for our workforce.
For faculty, a department is considered under-represented (or underutilized) for a certain gender or race/ethnicity, when our workforce has attained less than 80% of the representation goal, and when 0.9 persons or more must be hired from that group in order to achieve the goal. When underutilization exists, we find statistical support for the need to take affirmative steps to seek out and remove any possible barriers. “Affirmative” actions indicate that these are not remedial, but proactive, action-oriented steps to put best practices into place and create the most inclusive workforce climate. These goals point us in the appropriate direction, and are not to be considered quotas. We emphasize goals as a measure of progress, and consider them the foundation for affirmative action in recruitment and removing possible hiring or advancement barriers. Also, goals must be considered approximations, due to inherent error arising from many sources: Actual fitness for the workforce in a University setting; error in our estimate of the recruitment region in which our position opportunities are made public; the decision of many individuals to not report their field of employment, gender, race or ethnicity to the Census; and the decision of a few employees to not report their race or ethnicity to us. Although not indicated on these charts, the University keeps records on the veteran and disability status of the members of our workforce who provide that information. Overview of Workforce – Lowell Campus The representation of diversity among University faculty and staff is close, in aggregate, to the overall representation of diversity in the labor force. Among faculty, the total representation of minorities is 21.3%; the reported overall labor force availability is 23.1% (shortfall of 1.8%). Among staff, the total representation of minorities is 13.7%; the reported overall labor force availability is 13.9% (shortfall of 0.2%). However, this representation of diversity is not aligned with the representation of various diverse groups in the labor force. The disparities between the workforce and the available labor force vary by department and job group, as well as by race/ethnic group. Faculty: Asian faculty is the only race/ethnic group among faculty for whom the workforce representation is higher than the overall labor force availability. This group is the most highly represented within tenure and tenure-track ranks in the Colleges of Engineering at 33.3%, Science at 23.1% and Business at 43.6% - compared to labor force availability of 17.6%, 11.7% and 10.5% respectively. This is somewhat understandable given the historical and present science and technology focus of the University. A further review of the faculty labor force
Executive Summary Affirmative Action Plan, 2012-2013 University of Massachusetts Lowell
8
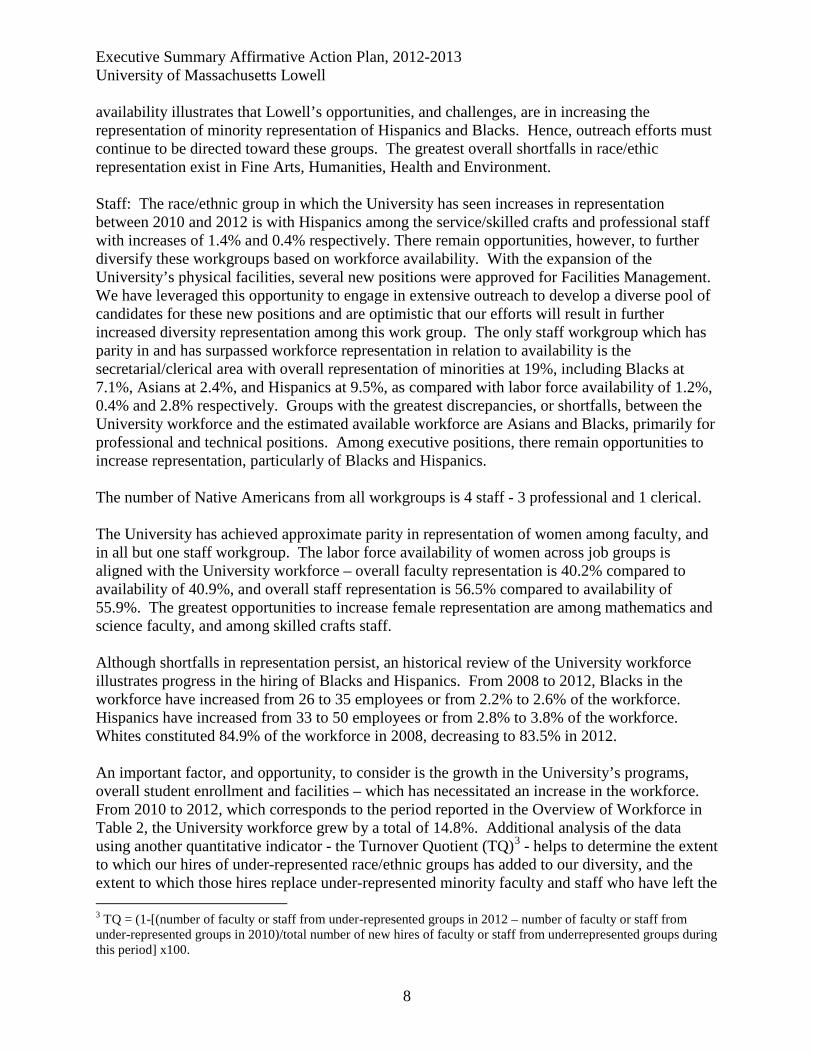
availability illustrates that Lowell’s opportunities, and challenges, are in increasing the representation of minority representation of Hispanics and Blacks. Hence, outreach efforts must continue to be directed toward these groups. The greatest overall shortfalls in race/ethic representation exist in Fine Arts, Humanities, Health and Environment. Staff: The race/ethnic group in which the University has seen increases in representation between 2010 and 2012 is with Hispanics among the service/skilled crafts and professional staff with increases of 1.4% and 0.4% respectively. There remain opportunities, however, to further diversify these workgroups based on workforce availability. With the expansion of the University’s physical facilities, several new positions were approved for Facilities Management. We have leveraged this opportunity to engage in extensive outreach to develop a diverse pool of candidates for these new positions and are optimistic that our efforts will result in further increased diversity representation among this work group. The only staff workgroup which has parity in and has surpassed workforce representation in relation to availability is the secretarial/clerical area with overall representation of minorities at 19%, including Blacks at 7.1%, Asians at 2.4%, and Hispanics at 9.5%, as compared with labor force availability of 1.2%, 0.4% and 2.8% respectively. Groups with the greatest discrepancies, or shortfalls, between the University workforce and the estimated available workforce are Asians and Blacks, primarily for professional and technical positions. Among executive positions, there remain opportunities to increase representation, particularly of Blacks and Hispanics. The number of Native Americans from all workgroups is 4 staff - 3 professional and 1 clerical. The University has achieved approximate parity in representation of women among faculty, and in all but one staff workgroup. The labor force availability of women across job groups is aligned with the University workforce – overall faculty representation is 40.2% compared to availability of 40.9%, and overall staff representation is 56.5% compared to availability of 55.9%. The greatest opportunities to increase female representation are among mathematics and science faculty, and among skilled crafts staff. Although shortfalls in representation persist, an historical review of the University workforce illustrates progress in the hiring of Blacks and Hispanics. From 2008 to 2012, Blacks in the workforce have increased from 26 to 35 employees or from 2.2% to 2.6% of the workforce. Hispanics have increased from 33 to 50 employees or from 2.8% to 3.8% of the workforce. Whites constituted 84.9% of the workforce in 2008, decreasing to 83.5% in 2012. An important factor, and opportunity, to consider is the growth in the University’s programs, overall student enrollment and facilities – which has necessitated an increase in the workforce. From 2010 to 2012, which corresponds to the period reported in the Overview of Workforce in Table 2, the University workforce grew by a total of 14.8%. Additional analysis of the data using another quantitative indicator - the Turnover Quotient (TQ)3 - helps to determine the extent to which our hires of under-represented race/ethnic groups has added to our diversity, and the extent to which those hires replace under-represented minority faculty and staff who have left the 3 TQ = (1-[(number of faculty or staff from under-represented groups in 2012 – number of faculty or staff from under-represented groups in 2010)/total number of new hires of faculty or staff from underrepresented groups during this period] x100.

Executive Summary Affirmative Action Plan, 2012-2013 University of Massachusetts Lowell
9
University. TQ for under-represented race/ethnic groups uses three data points: the number of such faculty/staff at the outset of the assessment period (2010), the number of such new hires during the period of assessment (2010-2012), and the number of such faculty/staff at the end of the assessment period (2012). UMass Lowell’s TQ for this period is 55.4%. A TQ of 0 indicates that all new hires are adding to existing diversity. What Lowell’s TQ indicates is that approximately 5.5 of every ten new underrepresented-minority hires replaced under-represented employees who had left, and 4.5 out of every ten added in overall numbers to existing diversity. Although this TQ results in an overall increase in the numbers of employees from under-represented groups, we maintain a steady representation of under-represented groups as an overall percentage of our workforce. During this same assessment period, UMass Lowell’s turnover rate, a direct measure of the change in the workforce, was approximately 9.5%, which is within normative ranges for higher education. Further analysis of this turnover will be instructive in developing a deeper understanding of issues of retention, which are just as important in advancing diversity as is hiring. The data compiled and analyzed herein are the basis of this overview and serve as the basis for the goals set forth in the Affirmative Action Plan. Additionally, areas of concern and programmatic goals which follow are informed by consultation with Vice Chancellors, Deans and hiring managers across the University.

Executive Summary Affirmative Action Plan, 2012-2013University of Massachusetts Lowell
10
Total Black Asian Native Hispanic Pacific Two or TotalMore Races
EEO-6 Category # % # % # % # % # % # % # % # % #
11 Chief Executive Officers* 5 62.5 2 25.0 0 0.0 1 12.5 0 0.0 0 0.0 0 0.0 1 12.5 912 Executive Directors 1 20.0 0 0.0 0 0.0 0 0.0 0 0.0 0 0.0 0 0.0 0 0.0 513 Deans, Associate Deans 13 59.1 1 4.5 0 0.0 1 4.5 0 0.0 0 0.0 0 0.0 0 0.0 2214 Major Department Heads 6 37.5 1 6.3 1 6.3 0 0.0 0 0.0 0 0.0 0 0.0 0 0.0 16
1 - Exec/Admin/Managerial (EAM) 25 48.1 4 7.7 1 1.9 2 3.8 0 0.0 0 0.0 0 0.0 1 1.9 52
21 Tenure System Faculty 139 35.0 96 24.2 9 2.3 79 19.9 0 0.0 8 2.0 0 0.0 0 0.0 39722 Non-Tenure System Faculty 65 59.1 12 10.9 1 0.9 9 8.2 0 0.0 2 1.8 0 0.0 0 0.0 110
2 - System Faculty 204 40.2 108 21.3 10 2.0 88 17.4 0 0.0 10 2.0 0 0.0 0 0.0 507
31 Administrative 128 85.9 23 15.4 3 2.0 8 5.4 2 1.3 9 6.0 0 0.0 1 0.7 14932 Education/Training/Student Life 85 59.9 16 11.3 8 5.6 0 0.0 1 0.7 7 4.9 0 0.0 0 0.0 14233 Institutional Relations 24 72.7 2 6.1 0 0.0 1 3.0 0 0.0 1 3.0 0 0.0 0 0.0 3334 Library 7 53.8 0 0.0 0 0.0 0 0.0 0 0.0 0 0.0 0 0.0 0 0.0 1335 Research/Post Doctorates 4 17.4 16 69.6 0 0.0 16 69.6 0 0.0 0 0.0 0 0.0 0 0.0 2336 Medical Care 5 100.0 0 0.0 0 0.0 0 0.0 0 0.0 0 0.0 0 0.0 0 0.0 537 Technical 44 35.8 18 14.6 3 2.4 11 8.9 0 0.0 4 3.3 0 0.0 0 0.0 12338 Other Professional Staff 6 50.0 1 8.3 1 8.3 0 0.0 0 0.0 0 0.0 0 0.0 0 0.0 12
3 - Professional/Non-Faculty 303 60.6 76 15.2 15 3.0 36 7.2 3 0.6 21 4.2 0 0.0 1 0.2 500
41 Administrative Support 38 90.5 8 19.0 3 7.1 1 2.4 0 0.0 4 9.5 0 0.0 0 0.0 4242 Secretaries, Clerks, Typists 9 75.0 1 8.3 0 0.0 0 0.0 1 8.3 0 0.0 0 0.0 0 0.0 1243 Duplicating, Mail 0 0.0 0 0.0 0 0.0 0 0.0 0 0.0 0 0.0 0 0.0 0 0.0 144 Communication Equip. Operators 7 100.0 0 0.0 0 0.0 0 0.0 0 0.0 0 0.0 0 0.0 0 0.0 7
4 - Secretarial/Clerical 54 87.1 9 14.5 3 4.8 1 1.6 1 1.6 4 6.5 0 0.0 0 0.0 62
*The Chancellor is included in this summary of employees working at UMass Lowell.
Job Group
FemaleMinority IslanderAmerican
Table 1. Historically Under-Represented Groups in Workforceby EEO-6 Job Category and University Job Group, March 31, 2012
Executive Summary Affirmative Action Plan, 2012-2013University of Massachusetts Lowell
11
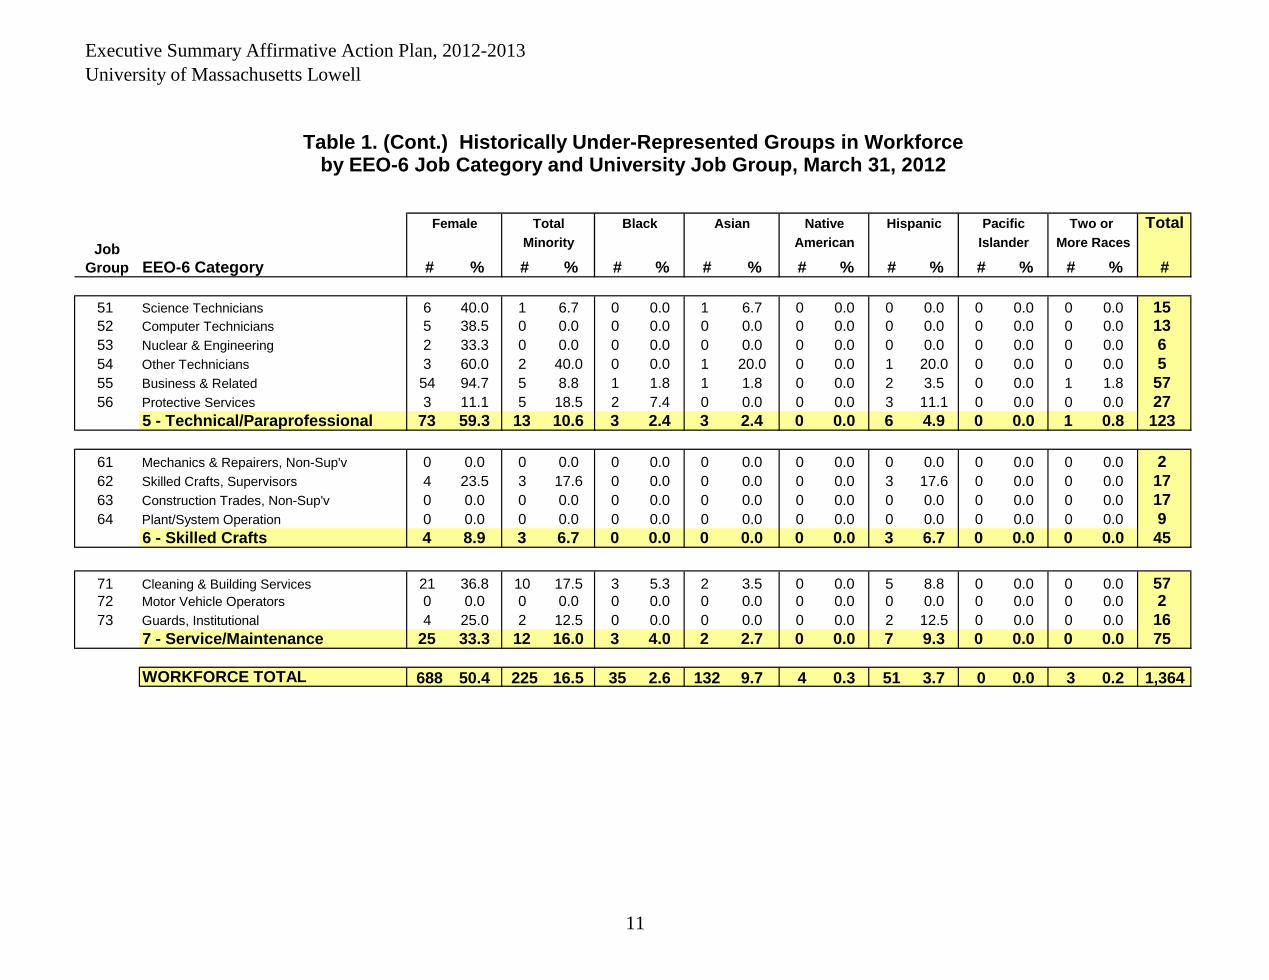
Total Black Asian Native Hispanic Pacific Two or TotalMore Races
EEO-6 Category # % # % # % # % # % # % # % # % #
51 Science Technicians 6 40.0 1 6.7 0 0.0 1 6.7 0 0.0 0 0.0 0 0.0 0 0.0 1552 Computer Technicians 5 38.5 0 0.0 0 0.0 0 0.0 0 0.0 0 0.0 0 0.0 0 0.0 1353 Nuclear & Engineering 2 33.3 0 0.0 0 0.0 0 0.0 0 0.0 0 0.0 0 0.0 0 0.0 654 Other Technicians 3 60.0 2 40.0 0 0.0 1 20.0 0 0.0 1 20.0 0 0.0 0 0.0 555 Business & Related 54 94.7 5 8.8 1 1.8 1 1.8 0 0.0 2 3.5 0 0.0 1 1.8 5756 Protective Services 3 11.1 5 18.5 2 7.4 0 0.0 0 0.0 3 11.1 0 0.0 0 0.0 27
5 - Technical/Paraprofessional 73 59.3 13 10.6 3 2.4 3 2.4 0 0.0 6 4.9 0 0.0 1 0.8 123
61 Mechanics & Repairers, Non-Sup'v 0 0.0 0 0.0 0 0.0 0 0.0 0 0.0 0 0.0 0 0.0 0 0.0 262 Skilled Crafts, Supervisors 4 23.5 3 17.6 0 0.0 0 0.0 0 0.0 3 17.6 0 0.0 0 0.0 1763 Construction Trades, Non-Sup'v 0 0.0 0 0.0 0 0.0 0 0.0 0 0.0 0 0.0 0 0.0 0 0.0 1764 Plant/System Operation 0 0.0 0 0.0 0 0.0 0 0.0 0 0.0 0 0.0 0 0.0 0 0.0 9
6 - Skilled Crafts 4 8.9 3 6.7 0 0.0 0 0.0 0 0.0 3 6.7 0 0.0 0 0.0 45
71 Cleaning & Building Services 21 36.8 10 17.5 3 5.3 2 3.5 0 0.0 5 8.8 0 0.0 0 0.0 5772 Motor Vehicle Operators 0 0.0 0 0.0 0 0.0 0 0.0 0 0.0 0 0.0 0 0.0 0 0.0 273 Guards, Institutional 4 25.0 2 12.5 0 0.0 0 0.0 0 0.0 2 12.5 0 0.0 0 0.0 16
7 - Service/Maintenance 25 33.3 12 16.0 3 4.0 2 2.7 0 0.0 7 9.3 0 0.0 0 0.0 75
WORKFORCE TOTAL 688 50.4 225 16.5 35 2.6 132 9.7 4 0.3 51 3.7 0 0.0 3 0.2 1,364
Job Group
FemaleMinority IslanderAmerican
Table 1. (Cont.) Historically Under-Represented Groups in Workforceby EEO-6 Job Category and University Job Group, March 31, 2012
Executive Summary Affirmative Action Plan, 2012-2013University of Massachusetts Lowell
12
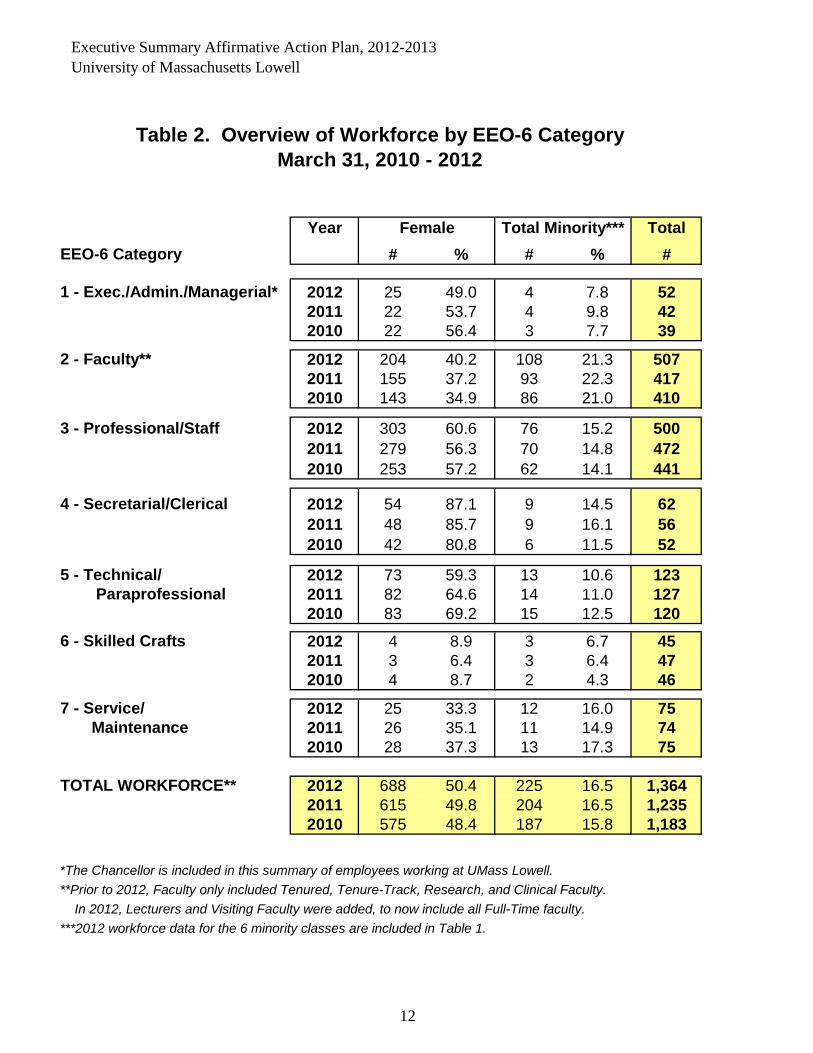
Year TotalEEO-6 Category # % # % #
1 - Exec./Admin./Managerial* 2012 25 49.0 4 7.8 522011 22 53.7 4 9.8 422010 22 56.4 3 7.7 39
2 - Faculty** 2012 204 40.2 108 21.3 507 2011 155 37.2 93 22.3 417
2010 143 34.9 86 21.0 410
3 - Professional/Staff 2012 303 60.6 76 15.2 500 2011 279 56.3 70 14.8 472
2010 253 57.2 62 14.1 441
4 - Secretarial/Clerical 2012 54 87.1 9 14.5 62 2011 48 85.7 9 16.1 56
2010 42 80.8 6 11.5 52
5 - Technical/ 2012 73 59.3 13 10.6 123 Paraprofessional 2011 82 64.6 14 11.0 127 2010 83 69.2 15 12.5 1206 - Skilled Crafts 2012 4 8.9 3 6.7 45 2011 3 6.4 3 6.4 47
2010 4 8.7 2 4.3 46
7 - Service/ 2012 25 33.3 12 16.0 75 Maintenance 2011 26 35.1 11 14.9 74 2010 28 37.3 13 17.3 75
TOTAL WORKFORCE** 2012 688 50.4 225 16.5 1,364 2011 615 49.8 204 16.5 1,235
2010 575 48.4 187 15.8 1,183
*The Chancellor is included in this summary of employees working at UMass Lowell.**Prior to 2012, Faculty only included Tenured, Tenure-Track, Research, and Clinical Faculty. In 2012, Lecturers and Visiting Faculty were added, to now include all Full-Time faculty.***2012 workforce data for the 6 minority classes are included in Table 1.
Table 2. Overview of Workforce by EEO-6 CategoryMarch 31, 2010 - 2012
Female Total Minority***

Executive Summary Affirmative Action Plan, 2012-2013University of Massachusetts Lowell
13
Total
#
Wor
kfor
ce %
Ava
ilabl
e %
Shor
tfall
in #
Pe
rson
s
#
Wor
kfor
ce %
Ava
ilabl
e %
Shor
tfall
in #
Pe
rson
s
#
Wor
kfor
ce %
Ava
ilabl
e %
Shor
tfall
in #
Pe
rson
s
#
Wor
kfor
ce %
Ava
ilabl
e %
Shor
tfall
in #
Pe
rson
s
#
Wor
kfor
ce %
Ava
ilabl
e %
Shor
tfall
in #
Pe
rson
s
#
Wor
kfor
ce %
Ava
ilabl
e %
Shor
tfall
in #
Pe
rson
s
#
Wor
kfor
ce %
Ava
ilabl
e %
Shor
tfall
in #
Pe
rson
s
#
Wor
kfor
ce %
Ava
ilabl
e %
Shor
tfall
in #
Pe
rson
s
#
TENURED/TENURE-TRACK FACULTY
Chemical 1 8.3 33.8 3.1 4 33.3 21.8 0.0 0 0.0 3.6 0.4 4 33.3 10.7 0.0 0 0.0 0.4 0.0 0 0.0 3.9 0.5 0 0.0 0.0 0.0 0 0.0 3.1 0.4 12 Civil & Environmental Engineering 2 18.2 22.5 0.5 5 45.5 25.5 0.0 0 0.0 3.6 0.4 5 45.5 12.6 0.0 0 0.0 0.4 0.0 0 0.0 5.3 0.6 0 0.0 0.0 0.0 0 0.0 3.6 0.4 11 Electrical & Computer Engineering 5 23.8 14.9 0.0 12 57.1 40.8 0.0 2 9.5 3.6 0.0 10 47.6 27.8 0.0 0 0.0 0.5 0.1 0 0.0 4.1 0.9 0 0.0 0.0 0.0 0 0.0 4.8 1.0 21 Mechanical Engineering 1 7.7 13.2 0.7 3 23.1 27.9 0.6 0 0.0 3.8 0.5 3 23.1 16.3 0.0 0 0.0 0.5 0.1 0 0.0 3.5 0.5 0 0.0 0.0 0.0 0 0.0 3.8 0.5 13 Plastics Engineering 4 23.5 23.4 0.0 3 17.6 26.1 1.4 0 0.0 4.1 0.7 3 17.6 14.2 0.0 0 0.0 0.5 0.1 0 0.0 3.9 0.7 0 0.0 0.0 0.0 0 0.0 3.3 0.6 17 Engineering Technology 0 0.0 23.4 0.2 0 0.0 26.1 0.3 0 0.0 4.1 0.0 0 0.0 14.2 0.1 0 0.0 0.5 0.0 0 0.0 3.9 0.0 0 0.0 0.0 0.0 0 0.0 3.3 0.0 1College of Engineering 13 17.3 20.8 2.6 27 36.0 29.7 0.0 2 2.7 3.7 0.8 25 33.3 17.6 0.0 0 0.0 0.4 0.3 0 0.0 4.1 3.1 0 0.0 0.0 0.0 0 0.0 3.8 2.8 75
Psychology 13 68.4 68.8 0.1 5 26.3 21.1 0.0 1 5.3 5.9 0.1 3 15.8 4.6 0.0 0 0.0 0.7 0.1 1 5.3 6.8 0.3 0 0.0 0.0 0.0 0 0.0 3.2 0.6 19 Sociology 5 55.6 62.1 0.6 3 33.3 25.5 0.0 1 11.1 9.2 0.0 1 11.1 5.6 0.0 0 0.0 0.7 0.1 1 11.1 6.6 0.0 0 0.0 0.0 0.0 0 0.0 3.4 0.3 9 Philosophy 1 16.7 26.3 0.6 0 0.0 12.2 0.7 0 0.0 2.0 0.1 0 0.0 3.0 0.2 0 0.0 0.4 0.0 0 0.0 3.6 0.2 0 0.0 0.0 0.0 0 0.0 3.2 0.2 6 English 11 61.1 58.7 0.0 3 16.7 16.1 0.0 1 5.6 4.4 0.0 2 11.1 3.8 0.0 0 0.0 0.5 0.1 0 0.0 3.8 0.7 0 0.0 0.0 0.0 0 0.0 3.6 0.6 18 Political Science 5 55.6 38.4 0.0 2 22.2 20.0 0.0 0 0.0 6.6 0.6 1 11.1 4.7 0.0 0 0.0 0.5 0.0 1 11.1 4.5 0.0 0 0.0 0.0 0.0 0 0.0 3.7 0.3 9 History 4 33.3 40.5 0.9 1 8.3 17.8 1.1 0 0.0 4.9 0.6 1 8.3 3.5 0.0 0 0.0 0.5 0.1 0 0.0 4.3 0.5 0 0.0 0.0 0.0 0 0.0 4.4 0.5 12 Cultural Studies 6 85.7 62.3 0.0 0 0.0 28.6 2.0 0 0.0 2.3 0.2 0 0.0 4.0 0.3 0 0.0 0.3 0.0 0 0.0 18.3 1.3 0 0.0 0.0 0.0 0 0.0 3.6 0.3 7 Criminal Justice 3 25.0 51.8 3.2 1 8.3 17.3 1.1 0 0.0 8.7 1.0 1 8.3 2.2 0.0 0 0.0 0.4 0.0 0 0.0 3.4 0.4 0 0.0 0.0 0.0 0 0.0 2.6 0.3 12 Economics 3 25.0 32.1 0.8 3 25.0 24.6 0.0 0 0.0 3.9 0.5 3 25.0 13.2 0.0 0 0.0 0.2 0.0 0 0.0 4.4 0.5 0 0.0 0.0 0.0 0 0.0 2.9 0.3 12 Art 3 37.5 75.4 3.0 0 0.0 13.7 1.1 0 0.0 2.0 0.2 0 0.0 4.4 0.3 0 0.0 0.3 0.0 0 0.0 3.3 0.3 0 0.0 0.0 0.0 0 0.0 3.7 0.3 8 Music 3 25.0 41.8 2.0 1 8.3 17.3 1.1 1 8.3 2.6 0.0 0 0.0 8.0 1.0 0 0.0 0.2 0.0 0 0.0 3.3 0.4 0 0.0 0.0 0.0 0 0.0 3.1 0.4 12College of Fine Arts, Humanities & Social Sciences 57 46.0 52.0 7.5 19 15.3 19.3 5.0 4 3.2 4.9 2.1 12 9.7 5.2 0.0 0 0.0 0.4 0.5 3 2.4 5.3 3.5 0 0.0 0.0 0.0 0 0.0 3.3 4.1 124
Biological Sciences 3 25.0 47.8 2.7 2 16.7 24.1 0.9 0 0.0 3.2 0.4 1 8.3 12.8 0.5 0 0.0 0.3 0.0 1 8.3 4.7 0.0 0 0.0 0.0 0.0 0 0.0 3.1 0.4 12 Chemistry 4 25.0 33.8 1.4 4 25.0 21.8 0.0 0 0.0 3.6 0.6 4 25.0 10.7 0.0 0 0.0 0.4 0.1 0 0.0 3.9 0.6 0 0.0 0.0 0.0 0 0.0 3.1 0.5 16 Mathematics 2 8.3 29.7 5.1 4 16.7 20.6 0.9 0 0.0 3.1 0.7 3 12.5 10.3 0.0 0 0.0 0.2 0.1 1 4.2 3.6 0.0 0 0.0 0.0 0.0 0 0.0 3.3 0.8 24 Envi., Earth & Atmos. Sciences 1 16.7 35.2 1.1 2 33.3 13.9 0.0 0 0.0 1.1 0.1 2 33.3 4.7 0.0 0 0.0 0.7 0.0 0 0.0 3.3 0.2 0 0.0 0.0 0.0 0 0.0 4.1 0.2 6 Physics and Applied Physics 1 5.6 15.4 1.8 4 22.2 19.1 0.0 0 0.0 2.1 0.4 4 22.2 10.0 0.0 0 0.0 0.2 0.0 0 0.0 2.9 0.5 0 0.0 0.0 0.0 0 0.0 3.9 0.7 18 Computer Science 3 20.0 18.6 0.0 7 46.7 28.4 0.0 0 0.0 2.5 0.4 7 46.7 19.1 0.0 0 0.0 0.3 0.0 0 0.0 2.5 0.4 0 0.0 0.0 0.0 0 0.0 4.0 0.6 15College of Sciences and Mathematics 14 15.4 28.5 11.9 23 25.3 21.8 0.0 0 0.0 2.7 2.5 21 23.1 11.7 0.0 0 0.0 0.3 0.2 2 2.2 3.4 1.1 0 0.0 0.0 0.0 0 0.0 3.5 3.2 91
Business School Faculty 0 0.0 39.6 0.4 0 0.0 24.2 0.2 0 0.0 8.1 0.1 0 0.0 8.8 0.1 0 0.0 0.6 0.0 0 0.0 3.6 0.0 0 0.0 0.0 0.0 0 0.0 3.2 0.0 1 Accounting 4 40.0 45.6 0.6 3 30.0 23.3 0.0 0 0.0 8.2 0.8 3 30.0 9.5 0.0 0 0.0 0.5 0.1 0 0.0 2.8 0.3 0 0.0 0.0 0.0 0 0.0 2.3 0.2 10 Management 7 36.8 39.6 0.5 9 47.4 24.2 0.0 0 0.0 8.1 1.5 8 42.1 8.8 0.0 0 0.0 0.6 0.1 1 5.3 3.6 0.0 0 0.0 0.0 0.0 0 0.0 3.2 0.6 19 Operations Info Systems 1 11.1 30.2 1.7 6 66.7 27.5 0.0 0 0.0 6.3 0.6 6 66.7 13.8 0.0 0 0.0 0.3 0.0 0 0.0 4.2 0.4 0 0.0 0.0 0.0 0 0.0 2.9 0.3 9School of Business 12 30.8 39.0 3.2 18 46.2 24.7 0.0 0 0.0 7.7 3.0 17 43.6 10.1 0.0 0 0.0 0.5 0.2 1 2.6 3.5 0.4 0 0.0 0.0 0.0 0 0.0 2.9 1.1 39
Community Health & Sustainability 2 33.3 74.9 2.5 1 16.7 32.2 0.9 0 0.0 11.8 0.7 1 16.7 11.8 0.0 0 0.0 0.4 0.0 0 0.0 5.5 0.3 0 0.0 0.0 0.0 0 0.0 2.7 0.2 6 Clinical Lab & Nutrition Sciences 6 54.5 62.5 0.9 3 27.3 25.5 0.0 2 18.2 8.0 0.0 1 9.1 9.3 0.0 0 0.0 0.3 0.0 0 0.0 3.8 0.4 0 0.0 0.0 0.0 0 0.0 4.1 0.4 11 Nursing 15 93.8 94.0 0.0 0 0.0 15.8 2.5 0 0.0 6.4 1.0 0 0.0 4.1 0.7 0 0.0 0.6 0.1 0 0.0 2.3 0.4 0 0.0 0.0 0.0 0 0.0 2.4 0.4 16 Physical Therapy 7 70.0 66.5 0.0 0 0.0 17.5 1.8 0 0.0 5.8 0.6 0 0.0 5.4 0.5 0 0.0 0.4 0.0 0 0.0 2.5 0.3 0 0.0 0.0 0.0 0 0.0 3.5 0.3 10 Work Environment 4 33.3 33.0 0.0 2 16.7 26.5 1.2 0 0.0 3.2 0.4 0 0.0 14.6 1.7 0 0.0 0.2 0.0 2 16.7 4.4 0.0 0 0.0 0.0 0.0 0 0.0 4.2 0.5 12School of Health and Environment 34 61.8 67.3 3.0 6 10.9 22.2 6.2 2 3.6 6.5 1.6 2 3.6 8.5 2.7 0 0.0 0.4 0.2 2 3.6 3.4 0.0 0 0.0 0.0 0.0 0 0.0 3.3 1.8 55
Graduate School of Education 9 69.2 74.2 0.6 3 23.1 24.6 0.2 1 7.7 11.2 0.5 2 15.4 2.9 0.0 0 0.0 0.8 0.1 0 0.0 7.2 0.9 0 0.0 0.0 0.0 0 0.0 2.5 0.3 13
139 35.0 38.1 12.1 96 24.2 23.6 0.0 9 2.3 3.3 4.2 79 19.9 15.5 0.0 0 0.0 0.1 0.4 8 2.0 2.9 3.6 0 0.0 0.0 0.0 0 0.0 1.4 5.6 397
Table 3. Full-Time Faculty Placement Goals Analysis, March 31, 2012
Female
TOTAL TENURED/TENURE-TRACK FACULTY
Two or More RacesTotal Minority Black Asian Native American Hispanic Pacific Islander

Executive Summary Affirmative Action Plan, 2012-2013University of Massachusetts Lowell
14
Total#
Wor
kfor
ce %
Ava
ilabl
e %
Shor
tfall
in #
Pe
rson
s
#
Wor
kfor
ce %
Ava
ilabl
e %
Shor
tfall
in #
Pe
rson
s
#
Wor
kfor
ce %
Ava
ilabl
e %
Shor
tfall
in #
Pe
rson
s
#
Wor
kfor
ce %
Ava
ilabl
e %
Shor
tfall
in #
Pe
rson
s
#
Wor
kfor
ce %
Ava
ilabl
e %
Shor
tfall
in #
Pe
rson
s
#
Wor
kfor
ce %
Ava
ilabl
e %
Shor
tfall
in #
Pe
rson
s
#
Wor
kfor
ce %
Ava
ilabl
e %
Shor
tfall
in #
Pe
rson
s
#
Wor
kfor
ce %
Ava
ilabl
e %
Shor
tfall
in #
Pe
rson
s
#
NON-TENURE TRACK FACULTY: Lecturers, Research Faculty, Clinical Faculty and Visiting Faculty
College of Engineering 3 27.3 18.1 0.0 1 9.1 30.2 2.3 0 0.0 3.7 0.4 1 9.1 18.0 1.0 0 0.0 0.4 0.0 0 0.0 4.1 0.4 0 0.0 0.0 0.0 0 0.0 3.9 0.4 11College of Fine Arts, Humanities & Social Sciences 19 51.4 56.1 1.7 2 5.4 19.2 5.1 1 2.7 4.3 0.6 1 2.7 4.2 0.6 0 0.0 0.4 0.1 0 0.0 6.8 2.5 0 0.0 0.0 0.0 0 0.0 3.3 1.2 37College of Sciences & Mathematics 10 50.0 32.0 0.0 3 15.0 21.0 1.2 0 0.0 2.7 0.5 3 15.0 10.9 0.0 0 0.0 0.3 0.1 0 0.0 3.6 0.7 0 0.0 0.0 0.0 0 0.0 3.5 0.7 20School of Business 6 50.0 41.1 0.0 2 16.7 24.0 0.9 0 0.0 8.1 1.0 2 16.7 9.0 0.0 0 0.0 0.5 0.1 0 0.0 3.4 0.4 0 0.0 0.0 0.0 0 0.0 2.9 0.4 12School of Health & Environment 6 100.0 74.2 0.0 1 16.7 24.6 0.5 0 0.0 11.2 0.7 1 16.7 2.9 0.0 0 0.0 0.8 0.0 0 0.0 7.2 0.4 0 0.0 0.0 0.0 0 0.0 2.5 0.1 6Graduate School of Education 21 87.5 75.4 0.0 3 12.5 19.2 1.6 0 0.0 6.0 1.4 1 4.2 6.7 0.6 0 0.0 0.4 0.1 2 8.3 2.9 0.0 0 0.0 0.0 0.0 0 0.0 3.1 0.7 24
65 59.1 51.3 0.0 12 10.9 21.3 11.5 1 0.9 5.0 4.5 9 8.2 7.6 0.0 0 0.0 0.3 0.4 2 1.8 4.6 3.1 0 0.0 0.0 0.0 0 0.0 3.2 3.5 110
TOTAL FULL-TIME FACULTY 204 40.2 40.9 3.4 108 21.3 23.1 9.1 10 2.0 3.7 8.7 88 17.4 13.8 0.0 0 0.0 0.2 0.8 10 2.0 3.3 6.5 0 0.0 0.0 0.0 0 0.0 1.8 9.1 507
KEY Workforce % - percentage of demographic group within the UMass Lowell work unit
Available % - 1998-2008 Survey of Earned Doctorates estimate of qualified individuals available for hire into the work unit
Shortfall in # Persons - number of placements needed to establish a workforce that fully meets the availability estimatePlacement goals are indicated with a boxed figure, when the UMass Lowell workforce is less than 80% of the availability estimate and there is a shortfall in persons of 0.9 or more
Hispanic Pacific Islander Two or More Races
Table 3. (Cont.) Full-Time Faculty Placement Goals Analysis, March 31, 2012
Native American
TOTAL NON-TENURE TRACK FACULTY
Female Total Minority Black Asian
Executive Summary Affirmative Action Plan, 2012-2013University of Massachusetts Lowell
15
Total
Job Groups by EEO-6 Category
#
Wor
kfor
ce %
Ava
ilabl
e %
Shor
tfall
in #
Pe
rson
s
#
Wor
kfor
ce %
Ava
ilabl
e %
Shor
tfall
in #
Pe
rson
s
#
Wor
kfor
ce %
Ava
ilabl
e %
Shor
tfall
in #
Pe
rson
s
#
Wor
kfor
ce %
Ava
ilabl
e %
Shor
tfall
in #
Pe
rson
s
#
Wor
kfor
ce %
Ava
ilabl
e %
Shor
tfall
in #
Pe
rson
s
#
Wor
kfor
ce %
Ava
ilabl
e %
Shor
tfall
in #
Pe
rson
s
#
Wor
kfor
ce %
Ava
ilabl
e %
Shor
tfall
in #
Pe
rson
s
#
Wor
kfor
ce %
Ava
ilabl
e %
Shor
tfall
in #
Pe
rson
s
#
11 Chief Executive Officers* 5 62.5 18.8 0.0 2 25.0 10.5 0.0 0 0.0 2.4 0.2 1 12.5 3.9 0.0 0 0.0 0.5 0.0 0 0.0 3.1 0.2 0 0.0 0.0 0.0 1 12.5 0.5 0.0 812 Executive Directors 1 20.0 38.5 0.9 0 0.0 14.2 0.7 0 0.0 5.1 0.3 0 0.0 2.7 0.1 0 0.0 0.7 0.0 0 0.0 5.0 0.2 0 0.0 0.1 0.0 0 0.0 0.5 0.0 513 Deans, Associate Deans 13 59.1 50.4 0.0 1 4.5 12.8 1.8 0 0.0 5.1 1.1 1 4.5 3.5 0.0 0 0.0 0.4 0.1 0 0.0 3.3 0.7 0 0.0 0.0 0.0 0 0.0 0.0 0.0 2214 Major Department Heads 6 37.5 50.8 2.1 1 6.3 16.1 1.6 1 6.3 7.5 0.2 0 0.0 1.8 0.3 0 0.0 0.8 0.1 0 0.0 5.4 0.9 0 0.0 0.0 0.0 0 0.0 0.4 0.1 16
1 - Exec./Admin./Managerial (EAM) 25 49.0 44.4 0.0 4 7.8 13.6 2.9 1 2.0 5.4 1.8 2 3.9 2.9 0.0 0 0.0 0.6 0.2 0 0.0 4.1 2.1 0 0.0 0.0 0.0 1 2.0 0.3 0.0 51
31 Administrative 128 85.9 68.1 0.0 23 15.4 8.5 0.0 3 2.0 1.6 0.0 8 5.4 2.7 0.0 2 1.3 0.5 0.0 9 6.0 3.2 0.0 0 0.0 0.0 0.0 1 0.7 0.4 0.0 14932 Education/Training/Student Life 85 59.9 59.5 0.0 16 11.3 18.9 10.8 8 5.6 9.1 4.9 0 0.0 2.3 3.3 1 0.7 0.9 0.2 7 4.9 5.8 1.2 0 0.0 0.0 0.1 0 0.0 0.5 0.7 14233 Institutional Relations 24 72.7 58.2 0.0 2 6.1 15.3 3.1 0 0.0 5.4 1.8 1 3.0 3.1 0.0 0 0.0 0.7 0.2 1 3.0 5.2 0.7 0 0.0 0.0 0.0 0 0.0 0.7 0.2 3334 Library 7 53.8 82.6 3.7 0 0.0 14.0 1.8 0 0.0 6.1 0.8 0 0.0 3.3 0.4 0 0.0 0.7 0.1 0 0.0 3.4 0.4 0 0.0 0.1 0.0 0 0.0 0.6 0.1 1335 Research/Post Doctorates 4 17.4 10.4 0.0 16 69.6 21.0 0.0 0 0.0 3.9 0.9 16 69.6 11.9 0.0 0 0.0 0.5 0.1 0 0.0 3.8 0.9 0 0.0 0.1 0.0 0 0.0 0.9 0.2 2336 Medical Care 5 100.0 92.0 0.0 0 0.0 21.2 1.1 0 0.0 10.1 0.5 0 0.0 5.7 0.3 0 0.0 0.7 0.0 0 0.0 3.9 0.2 0 0.0 0.1 0.0 0 0.0 0.8 0.0 537 Technical 44 35.8 42.5 8.2 18 14.6 17.8 3.9 3 2.4 1.8 0.0 11 8.9 12.3 4.1 0 0.0 0.2 0.3 4 3.3 3.0 0.0 0 0.0 0.0 0.0 0 0.0 0.4 0.5 12338 Other Professional Staff 6 50.0 51.9 0.2 1 8.3 8.8 0.1 1 8.3 1.4 0.0 0 0.0 5.3 0.6 0 0.0 0.1 0.0 0 0.0 1.6 0.2 0 0.0 0.0 0.0 0 0.0 0.2 0.0 12
3 - Professional/Staff 303 60.6 56.3 0.0 76 15.2 15.0 0.0 15 3.0 4.3 6.6 36 7.2 5.5 0.0 3 0.6 0.5 0.0 21 4.2 4.0 0.0 0 0.0 0.0 0.1 1 0.2 0.5 1.3 500
41 Administrative Support 38 90.5 79.4 0.0 8 19.0 5.6 0.0 3 7.1 1.2 0.0 1 2.4 0.4 0.0 0 0.0 1.1 0.5 4 9.5 2.8 0.0 0 0.0 0.0 0.0 0 0.0 0.1 0.0 4242 Secretaries, Clerks, Typists 9 75.0 94.3 2.3 1 8.3 4.9 0.0 0 0.0 1.0 0.1 0 0.0 2.8 0.3 1 8.3 0.1 0.0 0 0.0 0.9 0.1 0 0.0 0.0 0.0 0 0.0 0.1 0.0 1243 Duplicating, Mail 0 0.0 59.0 0.6 0 0.0 3.0 0.0 0 0.0 0.0 0.0 0 0.0 0.0 0.0 0 0.0 0.0 0.0 0 0.0 3.0 0.0 0 0.0 0.0 0.0 0 0.0 0.0 0.0 144 Communication Equip. Operators 7 100.0 57.2 0.0 0 0.0 10.1 0.7 0 0.0 1.4 0.1 0 0.0 1.4 0.1 0 0.0 0.0 0.0 0 0.0 7.2 0.5 0 0.0 0.0 0.0 0 0.0 0.0 0.0 7
4 - Secretarial/Clerical 54 87.1 79.4 0.0 9 14.5 5.9 0.0 3 4.8 1.2 0.0 1 1.6 0.9 0.0 1 1.6 0.8 0.0 4 6.5 2.9 0.0 0 0.0 0.0 0.0 0 0.0 0.1 0.0 62
51 Science Technicians 6 40.0 36.0 0.0 1 6.7 24.7 2.7 0 0.0 3.2 0.5 1 6.7 14.4 1.2 0 0.0 0.1 0.0 0 0.0 7.0 1.0 0 0.0 0.0 0.0 0 0.0 0.1 0.0 1552 Computer Technicians 5 38.5 38.5 0.0 0 0.0 18.5 2.4 0 0.0 1.5 0.2 0 0.0 13.8 1.8 0 0.0 0.0 0.0 0 0.0 2.6 0.3 0 0.0 0.0 0.0 0 0.0 0.5 0.1 1353 Nuclear & Engineering 2 33.3 6.4 0.0 0 0.0 4.9 0.3 0 0.0 0.9 0.1 0 0.0 3.5 0.2 0 0.0 0.0 0.0 0 0.0 0.5 0.0 0 0.0 0.0 0.0 0 0.0 0.0 0.0 654 Other Technicians 3 60.0 31.5 0.0 2 40.0 19.9 0.0 0 0.0 3.6 0.2 1 20.0 13.1 0.0 0 0.0 0.4 0.0 1 20.0 2.8 0.0 0 0.0 0.0 0.0 0 0.0 0.0 0.0 555 Business & Related 54 94.7 84.1 0.0 5 8.8 5.4 0.0 1 1.8 1.0 0.0 1 1.8 1.8 0.0 0 0.0 0.0 0.0 2 3.5 1.9 0.0 0 0.0 0.0 0.0 1 1.8 0.6 0.0 5756 Protective Services 3 11.1 11.3 0.0 5 18.5 7.6 0.0 2 7.4 1.9 0.0 0 0.0 0.3 0.1 0 0.0 0.0 0.0 3 11.1 3.0 0.0 0 0.0 0.0 0.0 0 0.0 2.4 0.7 27
5 - Technical/Paraprofessional 73 59.3 51.5 0.0 13 10.6 10.2 0.0 3 2.4 1.6 0.0 3 2.4 4.8 2.9 0 0.0 0.0 0.0 6 4.9 2.8 0.0 0 0.0 0.0 0.0 1 0.8 0.9 0.1 123
61 Mechanics & Repairers, Non-Sup'v 0 0.0 0.3 0.0 0 0.0 3.3 0.1 0 0.0 0.0 0.0 0 0.0 0.8 0.0 0 0.0 0.0 0.0 0 0.0 2.3 0.0 0 0.0 0.0 0.0 0 0.0 0.2 0.0 262 Skilled Crafts, Supervisory 4 23.5 33.3 1.7 3 17.6 28.6 1.9 0 0.0 0.0 0.0 0 0.0 4.8 0.8 0 0.0 0.0 0.0 3 17.6 14.3 0.0 0 0.0 0.0 0.0 0 0.0 9.5 1.6 1763 Construction Trades, Non-Sup'v 0 0.0 36.8 6.3 0 0.0 17.5 3.0 0 0.0 5.3 0.9 0 0.0 3.5 0.6 0 0.0 0.0 0.0 0 0.0 8.8 1.5 0 0.0 0.0 0.0 0 0.0 0.0 0.0 1764 Plant & System Operation 0 0.0 0.0 0.0 0 0.0 0.0 0.0 0 0.0 0.0 0.0 0 0.0 0.0 0.0 0 0.0 0.0 0.0 0 0.0 0.0 0.0 0 0.0 0.0 0.0 0 0.0 0.0 0.0 9
6 - Skilled Crafts 4 8.9 26.5 7.9 3 6.7 17.6 4.9 0 0.0 2.0 0.9 0 0.0 3.2 1.4 0 0.0 0.0 0.0 3 6.7 8.8 0.0 0 0.0 0.0 0.0 0 0.0 3.6 1.6 45
71 Cleaning & Building Services 21 36.8 18.8 0.0 10 17.5 17.8 0.1 3 5.3 1.0 0.0 2 3.5 2.5 0.0 0 0.0 0.0 0.0 5 8.8 11.2 1.4 0 0.0 0.0 0.0 0 0.0 3.0 1.7 5772 Motor Vehicle Operators 0 0.0 0.0 0.0 0 0.0 0.0 0.0 0 0.0 0.0 0.0 0 0.0 0.0 0.0 0 0.0 0.0 0.0 0 0.0 0.0 0.0 0 0.0 0.0 0.0 0 0.0 0.0 0.0 273 Guards, Institutional 4 25.0 76.9 8.3 2 12.5 18.3 0.9 0 0.0 0.0 0.0 0 0.0 0.0 0.0 0 0.0 3.8 0.6 2 12.5 0.0 0.0 0 0.0 0.0 0.0 0 0.0 14.4 2.3 16
7 - Service/Maintenance 25 33.3 30.7 0.0 12 16.0 17.4 1.0 3 4.0 0.8 0.0 2 2.7 1.9 0.0 0 0.0 0.8 0.6 7 9.3 8.5 0.0 0 0.0 0.0 0.0 0 0.0 5.4 4.0 75
STAFF TOTAL 484 56.5 55.9 0.0 117 13.7 13.9 2.4 25 2.9 3.3 3.5 44 5.1 4.5 0.0 4 0.0 0.5 0.2 41 4.8 4.4 0.0 0 0.0 0.0 0.1 3 0.4 1.1 6.2 856
KEY Workforce % - percentage of demographic group within the UMass Lowell work unitAvailable % - estimate of qualified individuals available for placement (hire, promotion, or transfer) into the work unitShortfall in # Persons - number of placements needed to establish a workforce that fully meets the availability estimatePlacement goals are indicated with a boxed figure, when the UMass Lowell workforce is less than 80% of the availability estimate and there is a shortfall in persons of 0.9 or more
Table 4. Staff Placement Goals Analysis, March 31, 2012BlackFemale AsianTotal Minority Two or More RacesPacific IslanderNative American Hispanic
Executive Summary Affirmative Action Plan, 2012-2013 University of Massachusetts Lowell
16
Areas of Special Concern As discussed in the Workplace Profile section, the University has been effective in developing a workforce which is representative of available hires, as well as of the diverse student population served, for most job groups and academic departments. However, we find opportunities for some areas to expand their diversity further. We examine our practices, structures, and culture to seek out and remove any barriers which may exist. In this section, we discuss areas of practice which could be further developed in order to best meet our placement goals. These areas of concern inform our Affirmative Action planning. Both current initiatives and planned goals are directly responsive to these areas of concern (see those sections below). Need for Accurate and Accessible Data as a Tool: At the beginning of the 2012-2013 Affirmative Action Plan year, human resources data included incomplete self-identification of race, ethnicity and disability status, possible incomplete self-identification of veteran status, and confinement of race/ethnicity identification to five, rather than seven, categories. Position and organizational structure codes were not completely consistent with actual workforce structures. The Applicant Tracking System did not provide ready access to applicant data over time. The Affirmative Action Plan data analysis software was not being used to its fullest reporting potential. Enhancing Internal Relationships and Commitment: Although the University’s goals and strategic priorities (cf. Appendices 4 and 5) are focused on inclusion and commitment, change is a process. Organizational climate and cultural competence of individuals are in evolution. It is increasingly apparent that the majority of the workforce has personalized these goals. At the same time, individuals must continue to seek to understand issues of diversity and inclusion. It is critical that members of search committees, and current employees who speak of the University to others, truly embrace and “buy-in” to our Plan goals. Developing Recruitment Strategies that Enhance Networking: Advertising in traditional “mainstream” publications may not always yield a high minority applicant pool. We currently do not have readily available data to analyze which sources are most effective. Search committee members have taken steps toward more active direct-contact recruitment such as through expanding their professional networks, developing local community partnerships and social media, but these types of more intensive recruitment efforts could be further supported and enhanced. Pre-selections without Full Attention to Affirmative Action Goals: Some placement opportunities may be lost when hiring officials identify candidates of interest for positions prior to conducting a full and open hiring process. If this occurs, such placements may not always be aligned with our institutional strategic hiring priorities. Opportunities for Advancement and Succession Planning: It is often possible to predict advancement placement opportunities years before opportunities actually become available, e.g., such as when individuals announce plans to retire. These planned job openings create prime
Executive Summary Affirmative Action Plan, 2012-2013 University of Massachusetts Lowell
17
opportunities for effective succession planning. When filling such positions is not urgent or time-sensitive, there is often time to develop the skills of incumbent workforce members who contribute to our affirmative goals and could then become more likely successful candidates for future vacancies. Attrition: Loss of members of some groups through voluntary separation, or in rare cases, faculty not receiving tenure, detracts from long-term progress. National research4 indicates that bidding wars may be more of a myth than a reality. In fact, workplace climate regarding inclusion and perceived opportunity for advancement seems to form a large part of the decisions of traditionally under-represented groups to apply to and remain with an institution. It is especially important for the University to provide support for junior faculty during their pre-tenure years in order to increase the likelihood of their success. We also recognize the need to learn from employees who leave the University more about the reasons for their departures.
4 Smith, Daryl G. Diversity's Promise for Higher Education: Making It Work. Baltimore, MD: Johns Hopkins UP, 2011. 148-50.

Executive Summary Affirmative Action Plan, 2012-2013 University of Massachusetts Lowell
18
Affirmative Initiatives The Areas of Concern above direct our focus toward opportunities to enhance our institutional effectiveness in meeting our goals. Initiatives undertaken currently include the following. Cultural Transformation Institutional Strategic Planning: For the past five years, the University founded its initiatives upon the Strategic Plan 2020. The Subcommittee on Fostering an Inclusive Campus Community developed comprehensive goals toward effective growth in this domain. (See Appendix 4.) This year, the University again engaged in extensive consultation with constituents across the campus which resulted in a renewal and restatement of its strategic priorities. These priorities are articulated as the Mission and Pillars of Excellence for UMass Lowell 2020, one of which is Global Engagement and Inclusive Culture. (See Appendix 5.) Transformation of Human Resources and Equal Opportunity & Outreach: To directly address areas of concern, University leadership engaged a nationally recognized consulting firm to analyze the work and effectiveness of the offices of Human Resources and Equal Opportunity & Outreach. Based on input from many constituencies, the consultants made specific recommendations to University leadership including a merging of the two work units, implementation of a more streamlined delivery of comprehensive search support services and enhanced internal public relations. The recommendations were fully implemented, as described further in additional initiatives in this section. The University community has already begun to reap important benefits from this reorganization, which has been in transition. We are optimistic and excited about the prospects of future results. Faculty Development Committee: Selected because of their recognized expertise in mentoring junior faculty, one senior faculty member from each of the six Colleges has been appointed to the newly formed Faculty Development Committee (FDC). This committee is charged with identifying faculty professional development needs and strategies to address them. Its purpose is to strengthen the quality of teaching and ultimately the retention rate of new faculty as well as students. The FDC has developed a pilot program for mentoring junior faculty, an annual promotion and tenure workshop for junior faculty, and a comprehensive orientation program for new faculty. Affinity Groups: Meet and greet socials create an opportunity for affinity groups to form for mutual support and collaborative efforts.

Executive Summary Affirmative Action Plan, 2012-2013 University of Massachusetts Lowell
19
Internal Relations Leadership Commitment:
• The Chancellor issued a comprehensive charge to the Executive Cabinet to advance minority hiring. He emphasized how this work is foundational to our success in providing excellence in education. This demonstrated commitment from the University leadership is critical toward molding institutional values and culture, and spearheading action.
• The Associate Vice Chancellor for Human Resources and Equal Opportunity & Outreach has actively developed partnerships with all campus constituencies around affirmative initiatives. With the Search Advisers, she has initiated brainstorming discussions with Deans and the Provost regarding advancing diversity among the faculty. The Dean of Fine Arts, Humanities and Social Sciences proposed the dissemination of a "diversity toolkit" to search chairs and search committees, and contributed significant resources toward it.
Search Adviser Model:
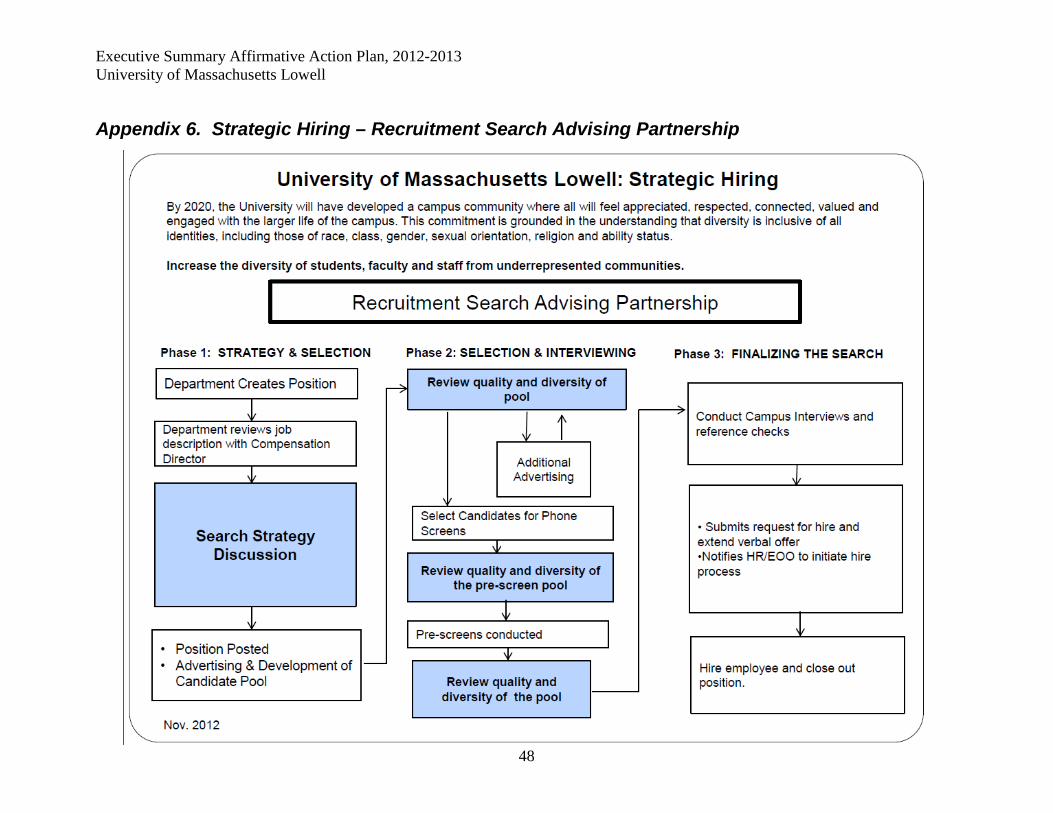
• Staff members who support searches formerly worked separately in the departments of Human Resources and of Equal Opportunity & Outreach. Now collaborating in the merged department, Search Advisers serve as a single source of contact to search chairs and their committees. They provide support and advice at all stages of the search process, from requesting a position be approved, to providing suggestions for outreach and monitoring the success of the searches at achieving diverse applicant pools at each interview stage (See Appendix 6, Strategic Hiring – Recruitment Search Advising Partnership). Additionally, a Recruitment Strategy form is utilized to assist search chairs in framing their planning for outreach efforts and reporting on search results.
• The training for search committees was revised to reflect this new model and to publicize the University’s leadership commitment to achieving our Plan goals.
Accessibility of Information:
• Inclusion of male and White employees in our internally distributed workforce analyses helps to model full inclusion and foster a shared commitment toward mutual respect.
• Data indicating goals for each of the University’s divisions – across faculty and staff – was analyzed to help division leaders formulate their strategic hiring plans.
• Non-tenure track faculty members are now reported as regular, full-time members of our workforce and are included in job group 21. This key component of our workforce may, for some departments, serve as an internal promotional resource to tenure-track faculty positions. Analyzing its representation may now be employed as an Affirmative Action planning tool.

Executive Summary Affirmative Action Plan, 2012-2013 University of Massachusetts Lowell
20
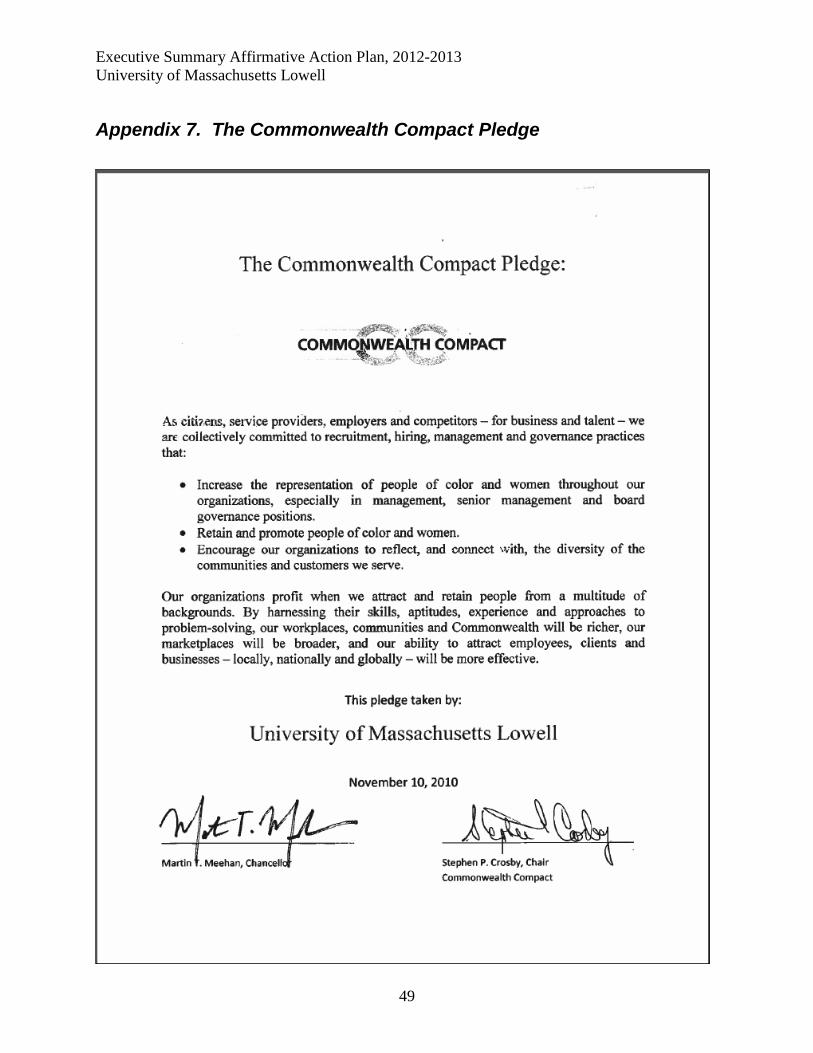
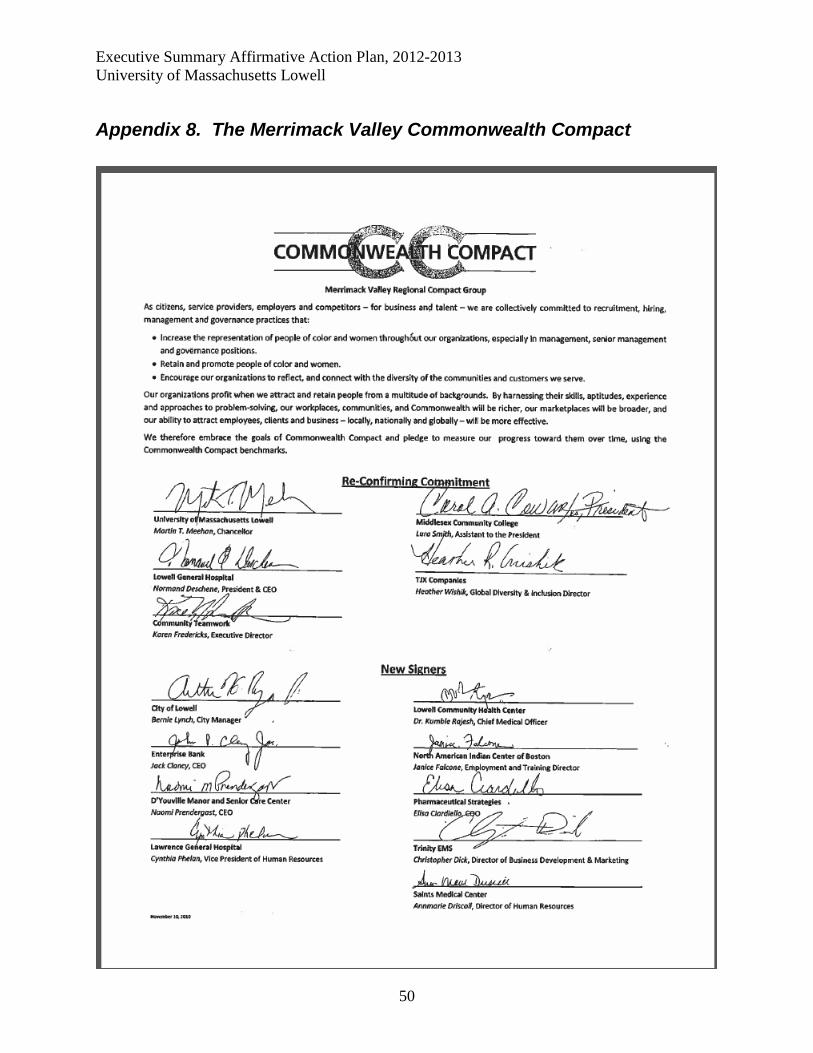
External Relations, Branding, and Partnerships New Themes: Launched via an extensive internal and external marketing campaign, the University's themes of "Work Ready, Life Ready, World Ready" serve as talking points and reminders of how the diversity of our employees equips our students for success. Diversity Branding: Photos of diverse students, male and female, are represented across the University and its buildings, throughout its publications and website, and on signposts on roads leading to campus. YouTube publicity videos and banner photos on the University blog http://blog.uml.edu/hawktalk and on University’s Facebook page are highly effective at portraying the energy and enthusiastic welcome of our diverse campus community. Membership in the Commonwealth Compact: The Commonwealth Compact (CC) is an initiative developed under the leadership of the University of Massachusetts Boston to empower Massachusetts companies to make our state a location of choice for people of color and for women. The University of Massachusetts system, and the University of Massachusetts Lowell campus individually, have pledged their commitment to this initiative. (See Appendix 7.) The Compact surveys its participants, including UMass Lowell, compiling numeric and programmatic successes and challenges, to provide state-wide benchmark reports. Topics surveyed include constitution of leadership groups, hiring and outreach efforts and vendor contracts. UMass Lowell participated in the two latest surveys, in 2010 and 2012. Benchmark reports based on the 2010 survey are now available online. The processes of responding to the survey data and of reviewing our progress against statewide benchmarks help to keep diversity and inclusion in focus in every aspect of institutional planning. Additionally, UMass Lowell is represented on the steering committee for the CC’s Higher Education Collaborative. Member colleges and universities leverage shared resources as they embrace the business case for reflecting student and societal diversity among leadership, faculty and staff. The CCHEC has provided a framework for progress now followed by other industry-specific collaboratives. The CCHEC is also planning to hold its first diversity and inclusion conference in Spring 2013. Formation of the Merrimack Valley Commonwealth Compact: In consultation with the leadership of the Commonwealth Compact, Lowell General Hospital and Middlesex Community College, UMass Lowell initiated a regional partnership to take specific steps to implement the vision of the Compact in the greater Merrimack Valley. Fourteen companies signed the Merrimack Valley Commonwealth Compact on November 10, 2010. (See Appendix 8.) Partners host local colloquia on topics such as recruiting Hispanics and effective networking.
Executive Summary Affirmative Action Plan, 2012-2013 University of Massachusetts Lowell
21
Bring Diversity to Nursing Grant: The Bring Diversity to Nursing Program at the University recruits and provides a rigorous education for nursing students of all backgrounds. The program is funded by a federal grant from the U.S. DHHS, Health Resources and Services Administration (HRSA), Bureau of Health Professions, Division of Nursing; and the Massachusetts Department of Public Health. This grant contributes to our affirmative initiatives as an institution by enhancing our visibility as a location of choice for minority students, contributing to the transformation of the University culture regarding diversity and inclusion, and creating a pipeline for future doctoral nursing students toward careers at the University. Career Fairs and Referral List: The University extends its presence and outreach in the local community to foster recruitment partnerships with 43 local agencies with high rates of service to women, minority, disabled, and veteran constituencies. These groups agree to broadcast our position opportunities and refer candidates of interest to the University. Additionally, we attend approximately eight career fairs annually, with special focus on Greater Lowell and Boston fairs which reach high percentages of traditionally under-represented applicant groups.

Executive Summary Affirmative Action Plan, 2012-2013 University of Massachusetts Lowell
22
Goals Human Resources and Equal Opportunity & Outreach (HR/EOO), the Provost, and the Executive Cabinet have identified the following goals for implementation beginning during the April 2012-March 2013 Affirmative Action Plan year. These goals build upon our current initiatives by providing measurable affirmative action steps designed to directly address the Areas of Special Concern. Progress toward the completion of these programmatic goals will be reported in the 2013-2014 Affirmative Action Plan. For that Plan, some goals will be repeated and new goals will be developed as necessary to address any remaining and newly identified Areas of Special Concern.
Executive Summary Affirmative Action Plan, 2012-2013 University of Massachusetts Lowell
23
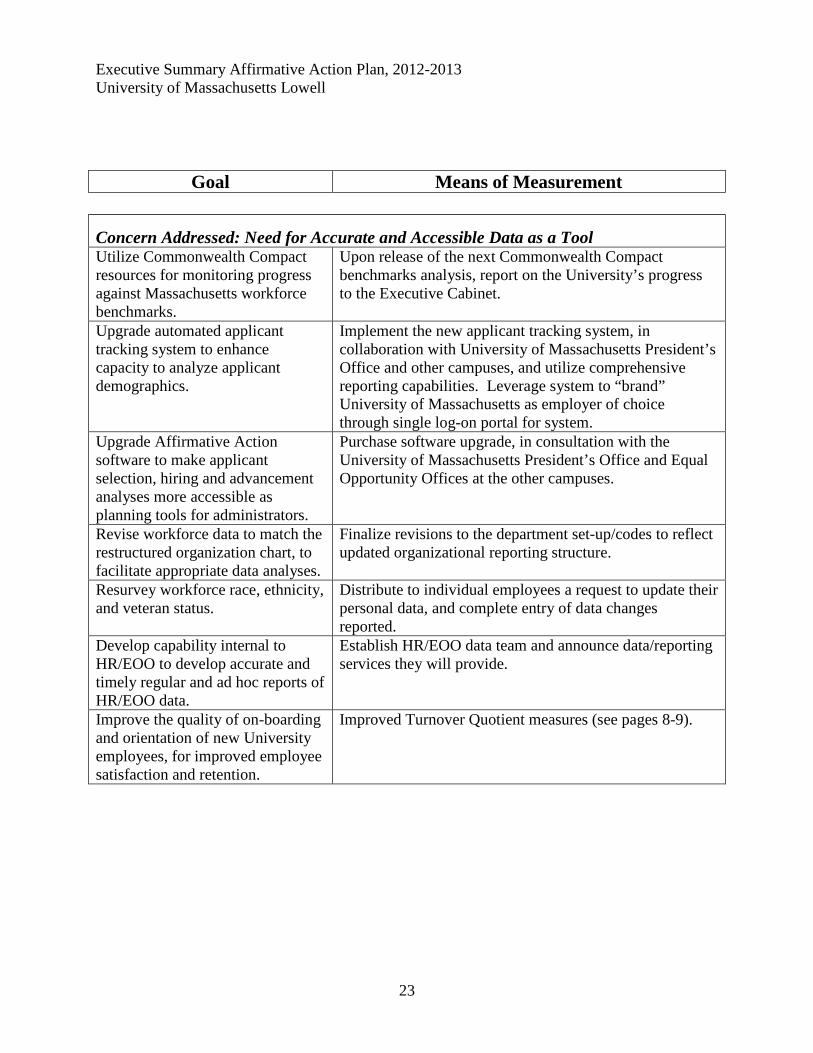
Goal Means of Measurement
Concern Addressed: Need for Accurate and Accessible Data as a Tool Utilize Commonwealth Compact resources for monitoring progress against Massachusetts workforce benchmarks.
Upon release of the next Commonwealth Compact benchmarks analysis, report on the University’s progress to the Executive Cabinet.
Upgrade automated applicant tracking system to enhance capacity to analyze applicant demographics.
Implement the new applicant tracking system, in collaboration with University of Massachusetts President’s Office and other campuses, and utilize comprehensive reporting capabilities. Leverage system to “brand” University of Massachusetts as employer of choice through single log-on portal for system.
Upgrade Affirmative Action software to make applicant selection, hiring and advancement analyses more accessible as planning tools for administrators.
Purchase software upgrade, in consultation with the University of Massachusetts President’s Office and Equal Opportunity Offices at the other campuses.
Revise workforce data to match the restructured organization chart, to facilitate appropriate data analyses.
Finalize revisions to the department set-up/codes to reflect updated organizational reporting structure.
Resurvey workforce race, ethnicity, and veteran status.
Distribute to individual employees a request to update their personal data, and complete entry of data changes reported.
Develop capability internal to HR/EOO to develop accurate and timely regular and ad hoc reports of HR/EOO data.
Establish HR/EOO data team and announce data/reporting services they will provide.
Improve the quality of on-boarding and orientation of new University employees, for improved employee satisfaction and retention.
Improved Turnover Quotient measures (see pages 8-9).
Executive Summary Affirmative Action Plan, 2012-2013 University of Massachusetts Lowell
24
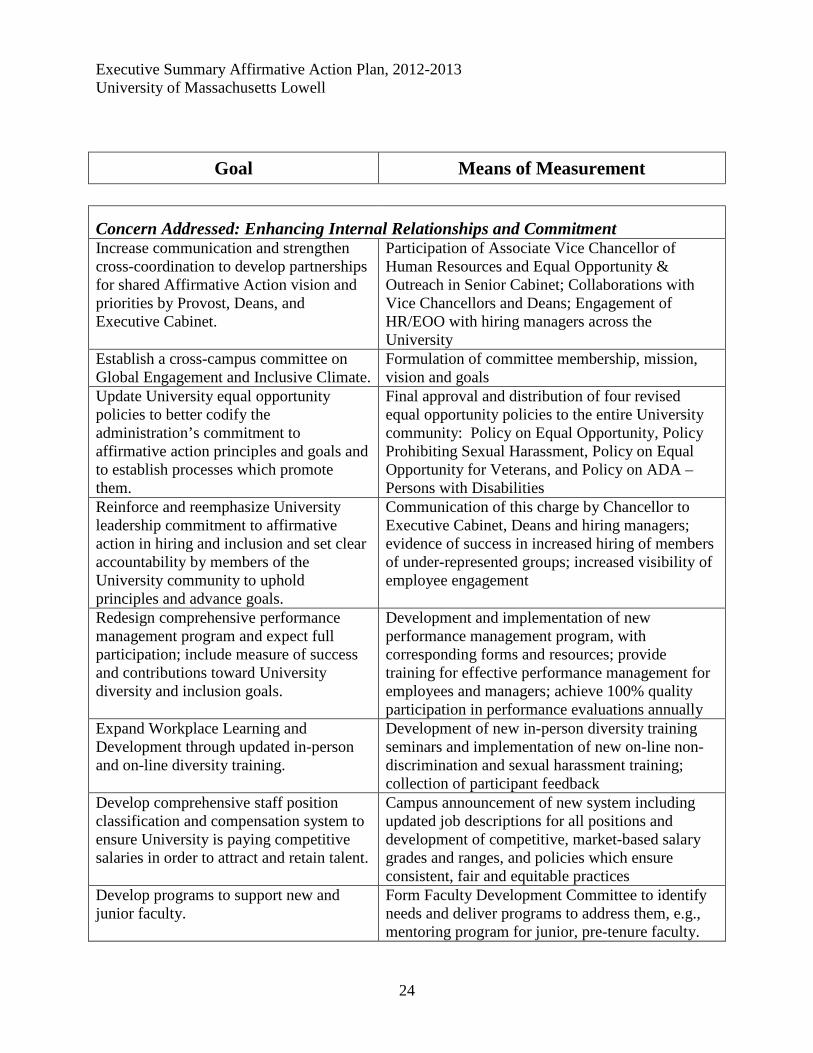
Goal Means of Measurement
Concern Addressed: Enhancing Internal Relationships and Commitment Increase communication and strengthen cross-coordination to develop partnerships for shared Affirmative Action vision and priorities by Provost, Deans, and Executive Cabinet.
Participation of Associate Vice Chancellor of Human Resources and Equal Opportunity & Outreach in Senior Cabinet; Collaborations with Vice Chancellors and Deans; Engagement of HR/EOO with hiring managers across the University
Establish a cross-campus committee on Global Engagement and Inclusive Climate.
Formulation of committee membership, mission, vision and goals
Update University equal opportunity policies to better codify the administration’s commitment to affirmative action principles and goals and to establish processes which promote them.
Final approval and distribution of four revised equal opportunity policies to the entire University community: Policy on Equal Opportunity, Policy Prohibiting Sexual Harassment, Policy on Equal Opportunity for Veterans, and Policy on ADA – Persons with Disabilities
Reinforce and reemphasize University leadership commitment to affirmative action in hiring and inclusion and set clear accountability by members of the University community to uphold principles and advance goals.
Communication of this charge by Chancellor to Executive Cabinet, Deans and hiring managers; evidence of success in increased hiring of members of under-represented groups; increased visibility of employee engagement
Redesign comprehensive performance management program and expect full participation; include measure of success and contributions toward University diversity and inclusion goals.
Development and implementation of new performance management program, with corresponding forms and resources; provide training for effective performance management for employees and managers; achieve 100% quality participation in performance evaluations annually
Expand Workplace Learning and Development through updated in-person and on-line diversity training.
Development of new in-person diversity training seminars and implementation of new on-line non-discrimination and sexual harassment training; collection of participant feedback
Develop comprehensive staff position classification and compensation system to ensure University is paying competitive salaries in order to attract and retain talent.
Campus announcement of new system including updated job descriptions for all positions and development of competitive, market-based salary grades and ranges, and policies which ensure consistent, fair and equitable practices
Develop programs to support new and junior faculty.
Form Faculty Development Committee to identify needs and deliver programs to address them, e.g., mentoring program for junior, pre-tenure faculty.

Executive Summary Affirmative Action Plan, 2012-2013 University of Massachusetts Lowell
25
Goal Means of Measurement
Concern Addressed: Developing Recruitment Strategies that Enhance Networking Provide a resource-rich “diversity toolkit” to search committees - including strategies and updated recruitment source database - to empower best practices such as direct-contact recruitment.
Distribution of toolkit during search committee trainings; publication of all resources on-line; consistent use of standard language in all advertisements which promotes diversity and as core value of University; create and host subject matter sessions on an as-needed basis addressing current issues in the workforce
Continue to develop local outreach efforts, partnerships with local referral agencies, and visibility via career fairs serving historically underrepresented groups.
Direct-contact recruitment in Lowell and Lawrence, participation in the Merrimack Valley Commonwealth Compact and Merrimack Valley Workforce Development Committee, and participation in career fair
Increase services and outreach to veterans to enhance University reputation as an employer and educator of choice for veterans.
Agreement by key stakeholders, in consultation with the recently formed Office of Veteran Services and local veterans’ agencies, on key initiatives to implement
Audit accessibility barriers for applicants and employees with disabilities.
Identification of any barriers, and development of steps to remove them
Executive Summary Affirmative Action Plan, 2012-2013 University of Massachusetts Lowell
26
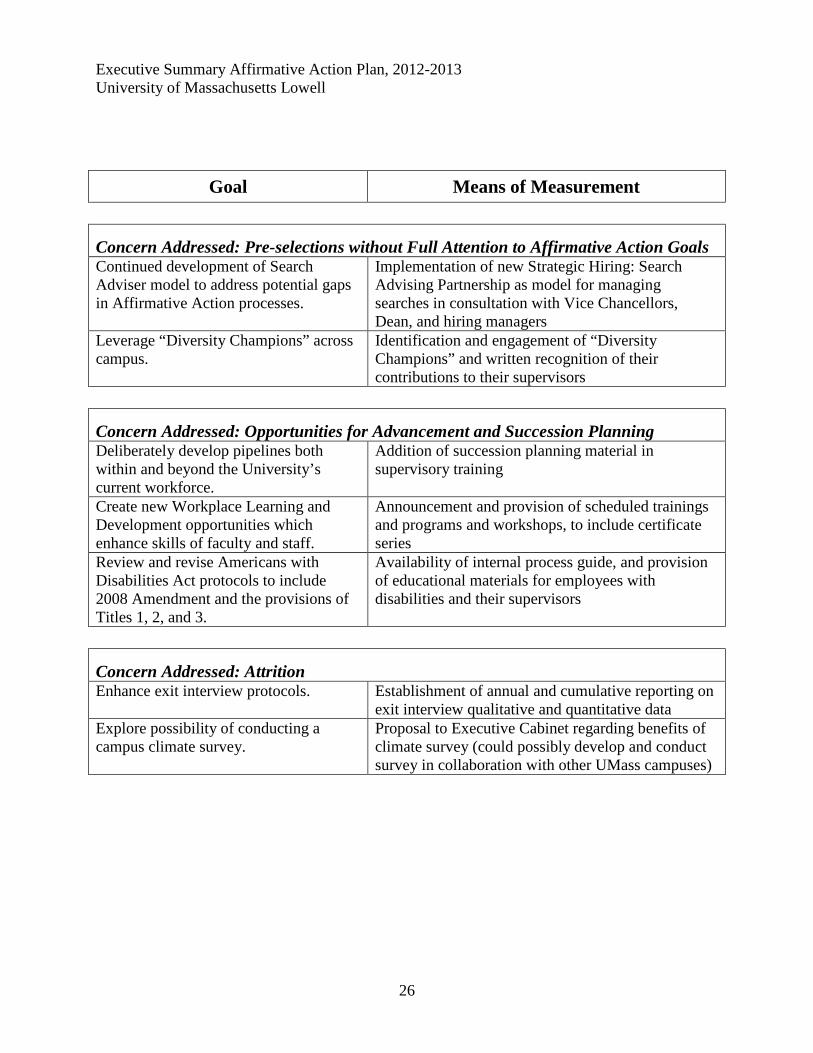
Goal Means of Measurement
Concern Addressed: Pre-selections without Full Attention to Affirmative Action Goals Continued development of Search Adviser model to address potential gaps in Affirmative Action processes.
Implementation of new Strategic Hiring: Search Advising Partnership as model for managing searches in consultation with Vice Chancellors, Dean, and hiring managers
Leverage “Diversity Champions” across campus.
Identification and engagement of “Diversity Champions” and written recognition of their contributions to their supervisors
Concern Addressed: Opportunities for Advancement and Succession Planning Deliberately develop pipelines both within and beyond the University’s current workforce.
Addition of succession planning material in supervisory training
Create new Workplace Learning and Development opportunities which enhance skills of faculty and staff.
Announcement and provision of scheduled trainings and programs and workshops, to include certificate series
Review and revise Americans with Disabilities Act protocols to include 2008 Amendment and the provisions of Titles 1, 2, and 3.
Availability of internal process guide, and provision of educational materials for employees with disabilities and their supervisors
Concern Addressed: Attrition Enhance exit interview protocols. Establishment of annual and cumulative reporting on
exit interview qualitative and quantitative data Explore possibility of conducting a campus climate survey.
Proposal to Executive Cabinet regarding benefits of climate survey (could possibly develop and conduct survey in collaboration with other UMass campuses)
Executive Summary Affirmative Action Plan, 2012-2013 University of Massachusetts Lowell
27
Appendices
Appendix 1. Article: Branch Out Source: www.nacubo.org/Business_Officer_Magazine/Magazine_Archives/
October_2012/Branch_Out.html

Executive Summary Affirmative Action Plan, 2012-2013 University of Massachusetts Lowell
28
Executive Summary Affirmative Action Plan, 2012-2013 University of Massachusetts Lowell
29

Executive Summary Affirmative Action Plan, 2012-2013 University of Massachusetts Lowell
30

Executive Summary Affirmative Action Plan, 2012-2013 University of Massachusetts Lowell
31

Executive Summary Affirmative Action Plan, 2012-2013 University of Massachusetts Lowell
32

Executive Summary Affirmative Action Plan, 2012-2013 University of Massachusetts Lowell
33

Executive Summary Affirmative Action Plan, 2012-2013 University of Massachusetts Lowell
34
Executive Summary Affirmative Action Plan, 2012-2013 University of Massachusetts Lowell
35

Executive Summary Affirmative Action Plan, 2012-2013 University of Massachusetts Lowell
36
Executive Summary Affirmative Action Plan, 2012-2013 University of Massachusetts Lowell
37
Appendix 2. Article: Windows and Mirrors: A Rookie’s Perspective Source: www.cupahr.org/hew/files/HEWorkplace-Vol3No2.pdf
Executive Summary Affirmative Action Plan, 2012-2013 University of Massachusetts Lowell
38
Executive Summary Affirmative Action Plan, 2012-2013 University of Massachusetts Lowell
39

Executive Summary Affirmative Action Plan, 2012-2013 University of Massachusetts Lowell
40

Executive Summary Affirmative Action Plan, 2012-2013 University of Massachusetts Lowell
41
Executive Summary Affirmative Action Plan, 2012-2013 University of Massachusetts Lowell
42
Appendix 3. University of Massachusetts Lowell Organizational Structure
Executive Summary Affirmative Action Plan, 2012-2013 University of Massachusetts Lowell
43
Appendix 4. Excerpts from the UMass Lowell Strategic Plan 2020 Source: UMass Lowell 2020: A Strategic Plan for the Next Decade, pages 1, 3, 4, 9, www.uml.edu/2020/docs/UML%202020%20exec%20summary.pdf.
Executive Summary Affirmative Action Plan, 2012-2013 University of Massachusetts Lowell
44
Executive Summary Affirmative Action Plan, 2012-2013 University of Massachusetts Lowell
45
Executive Summary Affirmative Action Plan, 2012-2013 University of Massachusetts Lowell
46
Executive Summary Affirmative Action Plan, 2012-2013 University of Massachusetts Lowell
47
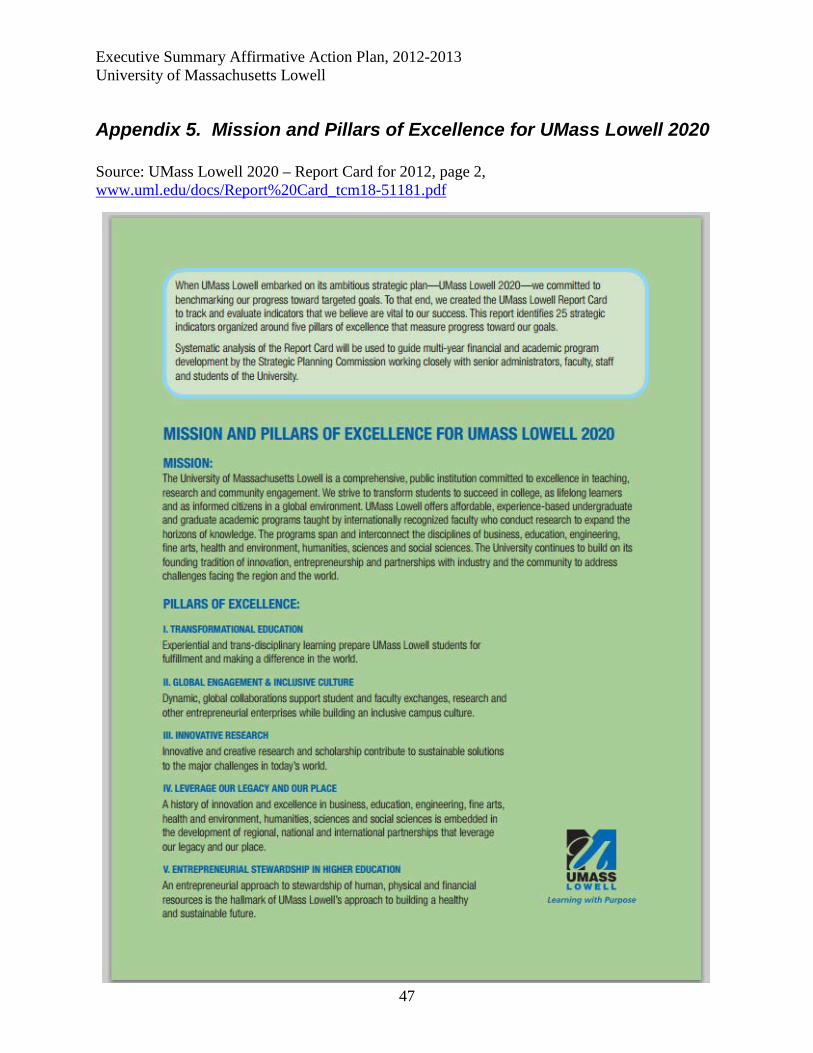
Appendix 5. Mission and Pillars of Excellence for UMass Lowell 2020 Source: UMass Lowell 2020 – Report Card for 2012, page 2, www.uml.edu/docs/Report%20Card_tcm18-51181.pdf
Executive Summary Affirmative Action Plan, 2012-2013 University of Massachusetts Lowell
48
Appendix 6. Strategic Hiring – Recruitment Search Advising Partnership
Executive Summary Affirmative Action Plan, 2012-2013 University of Massachusetts Lowell
49
Appendix 7. The Commonwealth Compact Pledge
Executive Summary Affirmative Action Plan, 2012-2013 University of Massachusetts Lowell
50
Appendix 8. The Merrimack Valley Commonwealth Compact