executive summary · executive summary. the state of the american dream in massachusetts, 2002 5...
TRANSCRIPT
4
The purpose of this report is to assess the eco-nomic health and well-being of the workersand families in Massachusetts.The recent past,at least in broad economic terms, has beenpositive in many respects. In early 2000, theU.S. economy achieved the longest continuouseconomic expansion in its history. The eco-nomic news in Massachusetts was also positivein many respects. Since 1992, the state hasadded 525,000 jobs. By 2000, the unemploy-ment rate had dropped to 2.6 percent, ourlowest rate in the last thirty years. Productivityincreases, measured by gains in output perworker, were among the highest in the coun-try over the last decade.
These facts give us an overall sense of theprogress of the Massachusetts economy, butthey tell us little about how ordinary workersand families have fared. Much has been writ-ten nationally about how the New Economy is affecting working-class and middle-class families, but there is little information at thestate level. MassINC has published a number of studies on related topics, including our inau-gural report, The State of the American Dream inNew England (1996). Other MassINC researchhas analyzed the contribution of immigrants,the types of skills needed to succeed in the NewEconomy, changes in the state’s labor force, andfactors determining the state’s high cost of living.
This research project finds that most middle-class families are working harder todaythan ever to hold onto their standard of living,despite the economic prosperity of the lastdecade. In arriving at this conclusion, we exam-ined the economic data of the last twenty yearsand used the most up-to-date informationavailable from a wide variety of governmentand other data sources. It is worth noting,however, that the purpose of this study is notto advocate for specific policy prescriptions orrecommendations. Rather, our goal is to pres-ent the facts in the most comprehensive andstraightforward way possible.We hope that byobjectively laying out the facts, this report willbe a catalyst for a more informed and thought-
ful public dialogue.As will become clear, thereare a lot of challenging questions for opinionleaders, decision-makers and concerned citizensin the public, private, and non-profit sectorsto address. We also hope that this report willhelp place in larger context the changes thatwe all are experiencing within our families andat our workplaces.
To begin, we find that there are four keyfactors at work in shaping the economic con-dition of Massachusetts families:
1. The Changing Family • Over the past two decades, high rates of
divorce and births outside of marriage havechanged the way people form families.Today,there are fewer married couples in the Com-monwealth.At the same time, there has beena rise in single-parent families, which has hada number of negative economic conse-quences for families in general.
• Within married couples, the economic roleof women has changed substantially. Two-income families are now the rule, and thesefamilies have increasingly come to depend uponthe earnings of the woman to maintain andimprove their standard of living. Not only aremore wives working outside the home, theyare also working more hours than ever before.
• A large part of a family’s economic successdepends on how many hours the family mem-bers work. Not surprisingly, those who workmore hours do better financially.We find thatmost families at the low end of the incomeladder do not work very many hours. In con-trast, middle- and upper-middle-income fam-ilies work a tremendous number of hours inorder to achieve and maintain their highstandards of living.
2. The Growing Importance of Educationand Skills
• Over the past twenty years, formal educationwith a strong base of literacy skills has becomethe economic fault line, dividing those whoenjoy economic success from those who do
The Massachusetts Institute for a New Commonwealth
Executive Summary

The State of the American Dream in Massachusetts, 2002
5
not.While workers with higher levels of edu-cation continue to have more and higher pay-ing opportunities, those with limited educa-tion have been losing ground, with fewerchances to succeed.
• The earnings premium for additional yearsof schooling has grown.As a consequence, theincome gap between the least and the mosteducated families has widened considerably.
3. The Geography of Success • The New Economy has affected geographic
regions of our Commonwealth quite differ-ently.There are at least three stories to tell.First, the economic fortunes of Greater Boston(Essex, Middlesex, Norfolk, Plymouth, andSuffolk Counties) and Central Massachusetts(Worcester County) are largely stories ofsuccess.
• Second is a mixed story for SoutheasternMassachusetts (Barnstable, Bristol, Dukes,and Nantucket Counties). Although theregion has created many jobs, these jobs oftenpay less than the new jobs in other regions.
• Finally, this report tells the story of WesternMassachusetts (Berkshire, Franklin, Hamp-shire, and Hampden Counties)—a story thatis as sobering as it is stark. The state’s eco-nomic growth of the mid to late 1990s largelybypassed the entire western half of the state.Today, the economic divide between differentregions of Massachusetts is larger than it hasbeen at any time over the last thirty years.
• A core element of the American Dream isthe ability to own one’s home.Yet, Massachu-setts has one of the lowest home ownershiprates in the country. Our high housing costswipe out the advantages of our state’s above-average incomes.While most of our analysisof home ownership pertains to the state as awhole, the problem of high housing costs isparticularly acute in Greater Boston. InEastern Massachusetts, these high housingcosts have also become an issue of economiccompetitiveness.They contribute to the out-migration of workers and exacerbate laborshortages, increasing difficulties in attractingand retaining workers.
American Dream—The ideal of freedomand opportunity that motivated the Found-ing Fathers. At its simplest, the AmericanDream is the notion that success is withinreach of anyone—regardless of one’s cir-cumstances of birth—through one’s ownhard work. The core material elements ofthe American Dream include: the ability toimprove one’s earnings over time throughhard work, a family income that providesa reasonably secure middle-class stan-dard of living, and the opportunity to ownone’s home.
Families—For the purpose of this research,we rely on the Census Bureau’s definitionof a family household, which is any house-hold that includes two or more individualswho are related by blood, marriage, oradoption. Note that according to this def-inition a family may or may not includechildren. By this definition, about two-thirds of all households in Massachusettsare families. This standard definition is
incomplete, most notably because it doesnot include domestic partners (gay or het-erosexual) if they do not have children.However, this widely used definition is thebest available option for our analysis.
Median Income—The median is the mid-dle point of the income distribution. Onehalf of the families (or households) willhave an income below the median, whilethe other half will have an income abovethe median. We often use the term “typi-cal” to refer to the median family or house-hold income. (This report also looks at themedian earnings of workers.)
Middle Class—There are a number ofways that people define the middle class.For the purpose of our analysis, we definethe middle class as families in the middlethree quintiles (i.e. the middle 60%) ofthe income distribution. Under this defi-nition, families in Massachusetts who earn$24,000 to $103,000 would be consid-
ered part of the middle class. It is impor-tant to note that if we considered thethree middle quintiles of the country, NewEngland, or specific regions of the state,the income boundaries would be differ-ent. Some researchers prefer an absolutestandard, arguing that families are middleclass if they are within fixed incomeboundaries that correspond with a certainstandard of living.
*Important Note About ComparingIncomes and Earnings Over Time
In order to adjust for the effects of infla-tion and to compare the purchasing powerof workers or families over time, we haveconverted dollars into real terms. Unlessotherwise specified, all of our compar-isons are in real terms. In addition, whenwe use the Current Population Surveys(CPS) after 1994, we rely on two-yearaverages because of the reduced samplesize.
WHAT DO WE MEAN WHEN WE SAY….

6
The Massachusetts Institute for a New Commonwealth
4. A Transformed Economy• The nature of work is fundamentally differ-
ent today than it was twenty years ago. In noteven the span of a generation, the Massachu-setts economy has fundamentally changed itsindustrial and occupational structure. Theshift from a goods-producing to a primarilyservices-providing economy has had pro-found implications for the types of jobs avail-able and for the demand for workers. Therehas been a substantial loss of semi-skilledblue-collar jobs that have traditionally paidgood wages to workers with limited educa-tion. From 1979 to 2000, the only workerswho improved their real earnings were pro-fessional, technical, and service workers.Workers in all other occupations actually lostground, although each occupation was affect-ed differently. Opportunities today for work-ers with limited education are narrower thanever before, while there are many more joboptions, and better paying ones, for collegegraduates.
• The conventional wisdom says that the Massa-chusetts economy diversified substantiallyafter the recession of the early 1990s. Ouranalysis of recent data on job growth since1992, however, indicates that job creation inour economy has not been evenly distributedacross a broad array of industries.To the con-trary, the economic recovery since 1992 hasbeen led by strong growth in a relatively smallnumber of industries, especially business serv-ices and other private services industries.
1. THE CHANGING FAMILY Over the last twenty years, there have been anumber of changes in how people form familiesand in the economic role of married women.These changes have had dramatic implicationsfor the economic condition of families. In orderto analyze the data, we rely on the CensusBureau’s definition of a family household: ahousehold that includes two or more individu-als who are related by blood, marriage, oradoption.This definition is incomplete because
it does not include domestic partners (gay orheterosexual) if they do not have children.However, this widely used definition amongresearchers is the best available one for ouranalysis. This report examines the importantdevelopments of the changing family in greatdetail, and we have organized the findings intothree general categories: 1) changes in familycomposition, especially the decline in marriedcouples; 2) the expanded economic role ofwomen within married couples; and 3) thelong hours of work needed to attain a middle-class standard of living.
The Changes in How People Form FamiliesOver the last two decades, high rates of divorce,births outside of marriage, and decisions tomarry later in life have changed the composi-tion of families. In 1970, 85 percent of all fam-ilies in Massachusetts were married couples.Today, only about 74 percent of all familiesconsist of married couples, and Massachusettshas a slightly lower proportion of marriedcouples than the nation (74% compared to77%). There are 38,000 fewer married cou-ples (with and without children) today in theBay State than there were in 1980.At the sametime, there are more single-parent families inMassachusetts and in the country. In our state,single-parent families have increased by approx-imately 39,000 since 1980.1 These changes infamily formation have had a number of nega-tive consequences for the financial well-beingof families and have contributed to growingfamily inequality and poverty.2 Due to the pres-ence of two earners and higher levels of edu-cation, married couples are more likely to beable to achieve the American Dream.
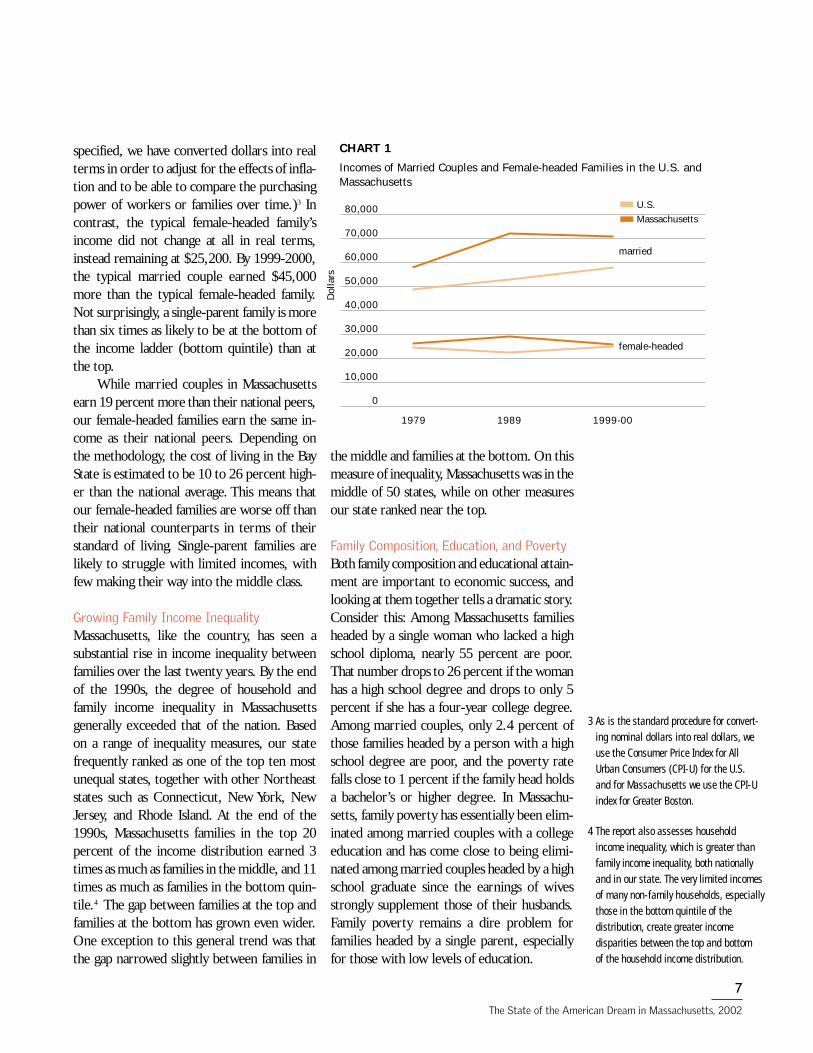
Trends in Income and Family CompositionMarried couples tend to have considerably higherincomes than families headed by a single par-ent. Over the last twenty years, in our state,the typical married couple’s income has in-creased by $11,000, to an income of $70,000.(Throughout this report, unless otherwise
1 Single-spouse families (with and withoutchildren under age 18) have increased by94,000. Single-spouse families includesingle parents with children, siblings wholive together, and adult children who livewith their parents or grandparents.
2 Some scholars argue that the problem isnot one of marriage but rather one of earlychild-bearing. Most scholars also arguethat helping prevent out-of-wedlockbirths, especially in the teen years, wouldbe the best anti-poverty measure.
The State of the American Dream in Massachusetts, 2002
7
specified, we have converted dollars into realterms in order to adjust for the effects of infla-tion and to be able to compare the purchasingpower of workers or families over time.)3 Incontrast, the typical female-headed family’sincome did not change at all in real terms,instead remaining at $25,200. By 1999-2000,the typical married couple earned $45,000more than the typical female-headed family.Not surprisingly, a single-parent family is morethan six times as likely to be at the bottom ofthe income ladder (bottom quintile) than atthe top.
While married couples in Massachusettsearn 19 percent more than their national peers,our female-headed families earn the same in-come as their national peers. Depending onthe methodology, the cost of living in the BayState is estimated to be 10 to 26 percent high-er than the national average. This means thatour female-headed families are worse off thantheir national counterparts in terms of theirstandard of living. Single-parent families arelikely to struggle with limited incomes, withfew making their way into the middle class.
Growing Family Income InequalityMassachusetts, like the country, has seen asubstantial rise in income inequality betweenfamilies over the last twenty years. By the endof the 1990s, the degree of household andfamily income inequality in Massachusettsgenerally exceeded that of the nation. Basedon a range of inequality measures, our statefrequently ranked as one of the top ten mostunequal states, together with other Northeaststates such as Connecticut, New York, NewJersey, and Rhode Island. At the end of the1990s, Massachusetts families in the top 20percent of the income distribution earned 3times as much as families in the middle, and 11times as much as families in the bottom quin-tile.4 The gap between families at the top andfamilies at the bottom has grown even wider.One exception to this general trend was thatthe gap narrowed slightly between families in
the middle and families at the bottom. On thismeasure of inequality, Massachusetts was in themiddle of 50 states, while on other measuresour state ranked near the top.
Family Composition, Education, and PovertyBoth family composition and educational attain-ment are important to economic success, andlooking at them together tells a dramatic story.Consider this: Among Massachusetts familiesheaded by a single woman who lacked a highschool diploma, nearly 55 percent are poor.That number drops to 26 percent if the womanhas a high school degree and drops to only 5percent if she has a four-year college degree.Among married couples, only 2.4 percent ofthose families headed by a person with a highschool degree are poor, and the poverty ratefalls close to 1 percent if the family head holdsa bachelor’s or higher degree. In Massachu-setts, family poverty has essentially been elim-inated among married couples with a collegeeducation and has come close to being elimi-nated among married couples headed by a highschool graduate since the earnings of wivesstrongly supplement those of their husbands.Family poverty remains a dire problem forfamilies headed by a single parent, especiallyfor those with low levels of education.
Dol
lars
80,000
70,000
60,000
50,000
40,000
30,000
20,000
10,000
0
CHART 1
Incomes of Married Couples and Female-headed Families in the U.S. andMassachusetts
1979 1989 1999-00
U.S.
Massachusetts
married
female-headed
3 As is the standard procedure for convert-ing nominal dollars into real dollars, weuse the Consumer Price Index for AllUrban Consumers (CPI-U) for the U.S. and for Massachusetts we use the CPI-Uindex for Greater Boston.
4 The report also assesses householdincome inequality, which is greater thanfamily income inequality, both nationallyand in our state. The very limited incomesof many non-family households, especiallythose in the bottom quintile of the distribution, create greater income disparities between the top and bottom of the household income distribution.

8
The Massachusetts Institute for a New Commonwealth
The Changing Economic Role of Womenwithin Married CouplesOver the past two decades in Massachusetts,the income of the typical married couple(with a husband under age 65) increased by 23percent to almost $76,000.5 The fact is thatthis gain would not have occurred if it werenot for the changing economic role of thewomen in these families. More marriedwomen have started working outside thehome, working wives have begun logging inmore hours at work, and the real earnings ofthe typical woman have increased over the pasttwo decades. As a result, the income gainsenjoyed by married couples are overwhelm-ingly the result of increased earnings by thewives in these families.
More Wives Are Working Outside the HomeTwo-income families are now the rule, not theexception, both here and across the nation. By1999-2000, three out of every four wives inMassachusetts worked outside the home.While women without children have beenworking outside the home for many years, thebiggest change has occurred in families withchildren. In the last twenty years, the numberof mothers with children under 18 who workoutside the home increased from 61 to 75 per-cent.The result is that today women with chil-dren and women without children work out-side the home at essentially the same rate.
There are also substantial differences inwork behavior depending on the family’s edu-cation. Women in more educated families aremore likely to work outside the home thanwomen in less educated families. In Massa-chusetts today, 80 percent of wives in coupleswhere the husband has a graduate degreework.6 That number drops to 57 percent infamilies where the husband is a high-schooldropout. These gaps have widened over thelast twenty years, as more wives in well-educated families have entered the labor market.
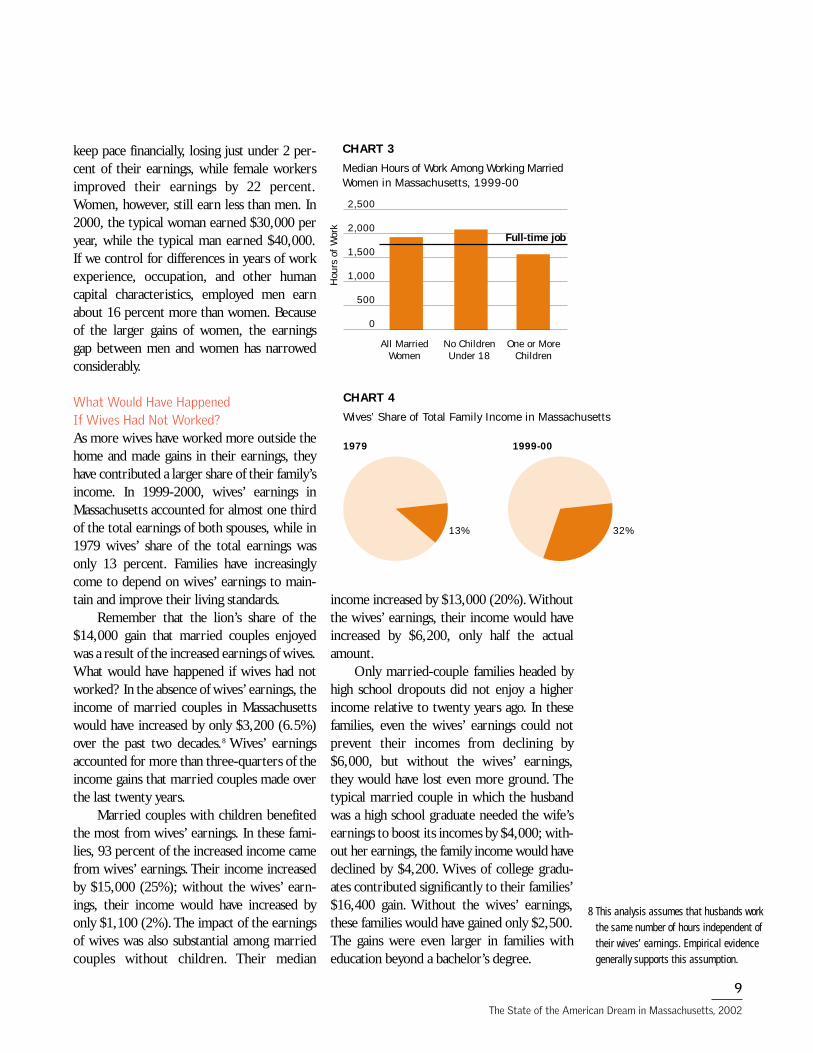
Wives Work More HoursNot only do more wives work, but they alsowork more hours than in previous generations.Consider that a full-time, year-round workerwill work a minimum of 1,800 hours per year.7
Over the last two decades, working wives inMassachusetts have added an extra 456 hoursof work outside the home.The typical workingwife now works 1,976 hours per year. That ismore than the equivalent of a full-time job.Moreover, because that number refers to themedian hours worked, it also means that halfof all working wives actually work even morethan 1,976 hours.Today, the typical wife with-out children present in the home works 2,080hours in a year. But it is mothers with childrenwho have added the most hours of work to theirdays. In 1979, the typical mother with chil-dren worked about 20 hours per week.Twentyyears later, mothers with children work about30 hours per week (1,560 hours per year).
The Gender Earnings Gap NarrowsOver the last twenty years, the typical full-time, year-round Massachusetts worker’sannual earnings increased by about 7 percent,from $33,000 to $35,000.That story, howev-er, is different for male and female workers.During this period, male workers struggled to
perc
ent
80
70
60
50
40
30
20
10
0
CHART 2
Proportion of Massachusetts Families with Both Husband and Wife Employed
1979 1989 1999-00
no children under 18one or more children
5 This analysis is based only on marriedcouples in which the husband is underage 65. Our earlier analysis looked at all families, which explains the slightlydifferent income figures.
6 We measure the education of the family bythe education of the husband in a marriedcouple. However, since people tend to marryothers with similar educational back-grounds, a well-educated husband isoften married to a well-educated woman.
7 1,800 hours is the number of hours thateconomists consider “full-time, year-round.”This assumes a person works 35 hoursper week for 52 weeks.
The State of the American Dream in Massachusetts, 2002
9
keep pace financially, losing just under 2 per-cent of their earnings, while female workersimproved their earnings by 22 percent.Women, however, still earn less than men. In2000, the typical woman earned $30,000 peryear, while the typical man earned $40,000.If we control for differences in years of workexperience, occupation, and other human capital characteristics, employed men earnabout 16 percent more than women. Becauseof the larger gains of women, the earnings gap between men and women has narrowedconsiderably.
What Would Have Happened If Wives Had Not Worked?As more wives have worked more outside thehome and made gains in their earnings, theyhave contributed a larger share of their family’sincome. In 1999-2000, wives’ earnings inMassachusetts accounted for almost one thirdof the total earnings of both spouses, while in1979 wives’ share of the total earnings wasonly 13 percent. Families have increasinglycome to depend on wives’ earnings to main-tain and improve their living standards.
Remember that the lion’s share of the$14,000 gain that married couples enjoyedwas a result of the increased earnings of wives.What would have happened if wives had notworked? In the absence of wives’ earnings, theincome of married couples in Massachusettswould have increased by only $3,200 (6.5%)over the past two decades.8 Wives’ earningsaccounted for more than three-quarters of theincome gains that married couples made overthe last twenty years.
Married couples with children benefitedthe most from wives’ earnings. In these fami-lies, 93 percent of the increased income camefrom wives’ earnings. Their income increasedby $15,000 (25%); without the wives’ earn-ings, their income would have increased byonly $1,100 (2%).The impact of the earningsof wives was also substantial among marriedcouples without children. Their median
income increased by $13,000 (20%).Withoutthe wives’ earnings, their income would haveincreased by $6,200, only half the actualamount.
Only married-couple families headed byhigh school dropouts did not enjoy a higherincome relative to twenty years ago. In thesefamilies, even the wives’ earnings could notprevent their incomes from declining by$6,000, but without the wives’ earnings,they would have lost even more ground. Thetypical married couple in which the husbandwas a high school graduate needed the wife’searnings to boost its incomes by $4,000; with-out her earnings, the family income would havedeclined by $4,200. Wives of college gradu-ates contributed significantly to their families’$16,400 gain. Without the wives’ earnings,these families would have gained only $2,500.The gains were even larger in families witheducation beyond a bachelor’s degree.
Hou
rs o
f W
ork
2,500
2,000
1,500
1,000
500
0
All Married No Children One or MoreWomen Under 18 Children
CHART 3
Median Hours of Work Among Working Married Women in Massachusetts, 1999-00
Full-time job
CHART 4
Wives’ Share of Total Family Income in Massachusetts
1979 1999-00
13% 32%
8 This analysis assumes that husbands workthe same number of hours independent oftheir wives’ earnings. Empirical evidencegenerally supports this assumption.

Working Long Hours to Join the Middle ClassIn Massachusetts, in 1999, the average family,including all adults, worked 2,850 hours—the equivalent of about one and one-half full-time workers. This average number of hoursdoes not tell the whole story, however, becauseof the big differences among families and, notsurprisingly, those who work more hours dobetter financially.
Middle-class families work long hours—about 2,000 to 3,900 hours per year.They relyon more than the equivalent of a full-timeworker. Upper-middle-class and most affluentfamilies rely on more than the equivalent oftwo full-time workers. While higher wagescertainly help middle-class families achievetheir standard of living, it is also clear thattheir long working hours also make a big difference. Working long hours is a necessarypart of the strategy to hold onto a middle-classstandard of living.
Families at the top of the income ladder(the top 20%) work the most hours—a majorfactor in their economic success. These fami-lies work an average of 4,384 hours a year—substantially more than the equivalent of two full-time, year-round workers. Families atthe bottom of the income ladder (the bottom20%) work an average of 992 hours—sub-stantially less than the equivalent of one full-time worker. In other words, the most affluentMassachusetts families worked 4.4 times as
many hours as the poorest families.How hard do Massachusetts families work
compared to their national peers? Again, thisvaries significantly depending upon the incomebracket. Even though middle-class families inMassachusetts work many hours, they actuallywork slightly fewer hours than their nationalpeers. The difference is more striking thoughat the bottom of the income ladder.The poor-est families in our state work far fewer hoursthan their national peers (992 compared to1,235 hours).The opposite is true for familiesat the top of the income ladder. Upper-incomefamilies in Massachusetts work more hoursthan their national peers (4,384 hours com-pared to 4,101 hours).
A variety of demographic and economicfactors influence how many hours a familyworks. One key reason that families in the topquintile work more hours is because the vastmajority of these families are married coupleswho are highly educated. Having two workingadults helps families log the necessary hours toachieve financial security. Significant educa-tional differences also separate the families inthe top quintile from those in the bottomquintile. The limited schooling of families atthe bottom (many of whom lack a high schooldiploma) makes it difficult for them to securestable, well-paying jobs. They are more likelyto be out of the labor force, unemployed, orunderemployed. In addition, child-care diffi-culties and health problems further complicatetheir ability to work more hours. Finding waysto help these families more actively participatein the labor market is critical.
2. THE GROWING IMPORTANCE OF EDUCATION AND SKILLS
Increasingly, formal education has become thefault line dividing those who enjoy economicsuccess from those who do not. The earningspremium from additional years of schoolinghas grown steadily as the demand for bettereducated workers has increased. At the sametime, the Massachusetts economy has become
10
The Massachusetts Institute for a New Commonwealth
hour
s of
wor
k
Bottom 2nd Lowest Middle 2nd Highest TopQuintile Quintile Quintile Quintile Quintile
5,000
4,000
3,000
2,000
1,000
0
CHART 5
Average Hours of Work Among All Family Members by Quintile, 1999
U.S.
Massachusetts

The State of the American Dream in Massachusetts, 2002
11
less forgiving, sharply penalizing those withlimited education and literacy skills.9
As the demand for workers has changed,so has the educational composition of theworkforce. Today, there are 415,000 moreworkers who have at least a four-year collegedegree than there were twenty years ago.During this same time period, the number offull-time workers with a high school diplomaor less has decreased by 156,000. Because ofmore limited opportunities for work and lowwages, some high school dropouts have with-drawn from the labor force, others haveretired early, and still others have left the state.By 2000, 37 percent of the workers in Massa-chusetts held a bachelor’s or higher degree.
Over the last twenty years, workers witha college degree or higher saw their real annualearnings increase, while those with a high schooldegree or less suffered substantial declines intheir real earnings. In Massachusetts, familiesheaded by high school dropouts lost consider-able economic ground.Their incomes declinedby almost $7,000, a 21 percent decline. Familiesheaded by high school graduates struggled tokeep pace, and their incomes declined by 1percent. Even families headed by someonewith some college education lost 10 percent oftheir incomes. In sharp contrast, families head-ed by four-year college graduates enjoyed an
increase of almost $8,000 (11%), and familiesheaded by someone with a master’s degree orhigher were the big winners, increasing theirincomes by $24,000 (30%).
Not surprisingly, families with more edu-cation are clustered at the top of the incomeladder. The majority of families in the top 20percent are headed by someone with at least acollege degree, and less than 2 percent of thesefamilies are headed by a high school dropout.Moreover, the difference in income betweenthe best and least educated families has widenedconsiderably. In 1979, Massachusetts familiesheaded by a college graduate earned 2.2 timesas much as families headed by a high schooldropout. By 1999-2000, that factor had in-creased to 3.1. A four-year college degree, orat least a two-year college degree, has becomemore of a necessity in order to achieve thematerial elements of the American Dream,especially in the Commonwealth.
3. THE GEOGRAPHY OF SUCCESSThe story of how the middle class in Massa-chusetts has fared is really two stories. One isthe story of the great economic disparitiesacross the geographic regions of our state andthe second is about the high cost of living, inparticular the cost of housing, in our statecompared to the rest of the country. First, we
Workers with Workers witha high school at least a degree or less college degree
400,000
300,000
200,000
100,000
0
-100,000
-200,000
CHART 6
Changes in the Education of Full-TimeWorkers in Massachusetts Since 1979
dolla
rs
Less than High College Post-High School School Degree baccalaureate
Degree
25,000
20,000
15,000
10,000
5,000
0
-5,000
-10,000
CHART 7
Change in Family Income by Education in Massachusetts Since 1979
9 For more discussion on the role that aperson’s basic skills play in shaping his or her economic success, see JohnComings, Andrew Sum, and Johan Uvin,New Skills for a New Economy: AdultEducation’s Key Role in SustainingEconomic Growth and ExpandingOpportunity, Boston: MassINC, 2000.

consider job creation, incomes, and earningsacross the different regions and counties with-in the state. There are large differences bet-ween regions and even within regions. Thesuccesses of our economy have most definite-ly not been shared evenly across the state. Infact, the economic growth of the late 1990slargely bypassed the entire western part ofMassachusetts.The result is that the economicdivide between different regions of Massachu-setts is larger today than it has been at anytime over the last thirty years.
To tell the second story, we compare thecost of housing in Massachusetts to the rest ofthe country. Housing costs are the primarydeterminant of a state’s cost of living, and ourhigh housing costs account for much of ourstate’s high cost of living. Our state’s low rateof home ownership is primarily the result ofour high housing costs.
Job Creation Across RegionsJob creation in the 1990s varied widely acrossthe different regions. Each of the four regionsof the state lost jobs at roughly the same rateduring the recession of the early 1990s. As thestate recovered from the recession, though, therates of new job creation were quite differentfrom region to region. Southeastern Massachu-setts led the state, increasing the number of itsjobs by 27 percent—although some analystshave voiced concern about the relatively lowwages of these jobs. Greater Boston and CentralMassachusetts added jobs at a rate of about 20
percent.Western Massachusetts, however, laggedfar behind, increasing the number of its jobs byonly 11 percent. By 2000, despite a period ofstrong economic expansion within the state,Western Massachusetts still had not recoveredall of the jobs it had lost during the recession.
TABLE 1
Growth in Job Creation and Wages, by Region1991-2000
Job Creation (%) Wages (%)
Central Mass. 20 20
Greater Boston 21 27
Southeastern Mass. 27 12
Western Mass. 11 6
There were even more significant differ-ences across the counties, and even withincounties there are vast differences. For instance,the city of Lawrence has been plagued by oneof the highest unemployment rates in thestate, but Essex County, where Lawrence islocated, has been able to expand its jobs by 20percent. Nantucket led the state in job cre-ation, adding 61 percent new jobs from 1991to 2000. Other leading counties included Barn-stable, Bristol, Dukes, Middlesex, Plymouth,
The Massachusetts Institute for a New Commonwealth
12
CHART 8The Regions of Massachusetts
Berkshire
Franklin
HampshireWorcester
WESTERN
CENTRAL
GREATER BOSTON
SOUTHEASTERN
Middlesex
Norfolk
–––––– Suffolk
Bristol Plymouth
Barnstable
Dukes
Essex
Hampden
Nantucket

and Suffolk. Even Hampshire County in West-ern Massachusetts was able to expand its jobsby 21 percent during the economic boom. Itwas Berkshire and Hampden counties thatreally struggled. Both counties expanded theirjobs by less than 10 percent during the recenteconomic prosperity.These findings challengepolicymakers, both state and local, to findways to help those areas of the state that havenot shared as fully in the state’s economicprosperity.
Earnings and Incomes Across RegionsIn the last ten years, average wages and salariesper employee have grown in each of the state’sfour regions, but there were great disparitiesin the rate of growth. The wages and salariesper employee in Greater Boston increasedmore than four times as much as in WesternMassachusetts (27% versus 6%).10 There are,however, important unanswered questionsabout the degree to which these real earningsincreases in Greater Boston were shared acrossworkers. Earning inequalities appear to haveincreased. There are even larger differencesacross the state’s counties and more differ-ences within counties. At the very top, ourwage increases were among the best in thecountry. The typical worker’s earnings inMiddlesex County increased by 36 percent.
During this same period, the average worker’searnings in Hampshire County increased byless than 1 percent.As most of the state surgedforward, workers in Western Massachusettsstruggled to keep pace financially.
Over the last twenty years, the gapsbetween the incomes of families and residentsin different counties have become more pro-nounced. In 2000, the typical families inMiddlesex and Norfolk Counties earned about$75,000. In Suffolk (Boston) and Hampden(Springfield) Counties, the two poorest coun-ties, the typical family earned $45,000 to$48,000. Some of these differences in incomesare offset by the differences in the cost of living. In particular, the cost of housing ismuch less in the western part of the state.Suffolk County, one of the poorest counties asmeasured by family income, is also located inGreater Boston, the region with the highestcost of living. Overall, a family’s economicopportunities and well-being are increasinglybeing shaped by where the family lives withinthe state.
The High Costs of Home OwnershipThe ability to own one’s home is a core ele-ment of the American Dream. For most work-ing-class and middle-class families, the homeis the most important part of their economic
The State of the American Dream in Massachusetts, 2002
13
70
60
50
40
30
20
10
0
Berksh
ire
Hampd
en
Fran
klin
Middles
ex
Worces
ter
Esse
x
Norfolk
Hamps
hire
Suffo
lk
Bristol
Plym
outh
Barnsta
ble
Dukes
Nantu
cket
CHART 9
Job Creation by County, 1991-2000
perc
ent
10 The ES202 data are based on the loca-tion of the jobs, not the place of resi-dence of the worker. For instance, work-ers at a firm in Greater Boston mightcommute to work from another region.Therefore it is important to interpretthese findings with a certain degree ofcaution. This is particularly true forSuffolk County, where a high fraction ofjobs are held by people who commutefrom other counties or even other states.In addition, the ES202 wage and salarydata do not include income earned byself-employed workers.

wealth. During the last twenty years, Massa-chusetts has made modest improvements inthe rate of home ownership, with 62 percentof all households owning their own home by2000.These gains have narrowed a historic gapbetween our state and the U.S., but Massa-chusetts still has the fifth lowest rate of homeownership among the 50 states, despite ourstate’s above-average incomes.The gaps in homeownership rates between U.S. and Massachu-setts households are the largest for householdswith incomes below $55,000.
The lower rates of home ownership inMassachusetts are primarily a result of the highcost of housing. In 1980, the median home inour state cost roughly twice as much as themedian household’s income. By this measure,housing was more affordable than the nationalaverage, and Massachusetts ranked in the mid-dle of the pack of the 50 states. During the1980s, home prices shot up more rapidly inMassachusetts than in any other state. In 1990,the median house cost 4.41 times as much asthe typical household’s income, a tremendousincrease in only ten years.
In 2000, the median house cost 3.9 timesas much as the median household’s income—a slight improvement from ten years earlier.Nonetheless, this ratio was well above that ofthe nation as a whole (2.9) and ranked 3rdhighest among the states. In recent years, homeprices in Massachusetts also rose far more rap-idly than in the nation. Our research finds thatif median home prices in Massachusetts in
2000 had been equal to those of states in themiddle of the pack—where Massachusetts wasjust twenty years ago—an additional 160,000Massachusetts households would own theirhomes.
The failure to build more housing inMassachusetts is a critical factor in the highcost of housing. The rate of new home con-struction in Massachusetts during the 1990swas one of the lowest in the country.The lim-ited supply of new housing combined with thevery high average prices of new homes hascontributed to growing affordability problemsand increased housing burdens on renters andhome owners. We believe there are severalreasons to be concerned about the high hous-ing burden in our state, both for families andfor our state’s economic competitiveness.High housing costs increase inequality amongfamilies.They also contribute to the outmigra-tion of workers and exacerbate labor short-ages, including difficulties in attracting andretaining skilled workers.
4 . A TRANSFORMED ECONOMYOver the last two decades, the Massachusettseconomy has fundamentally changed, shiftingfrom a goods-producing to primarily a servic-es-providing economy.These changes have hadprofound impacts on the types of jobs andopportunities that are available to Massachu-setts workers. The nature of these changesbecomes evident as one analyzes three distincteconomic periods: the 1980s expansion, therecession of 1989 to 1991, and the recoveryand job boom of the 1990s. As the economyhas changed, the opportunities for economicsuccess have narrowed for those workers withlimited education and skills.
The 1980s ExpansionAfter the national recession of the early1980s, which affected our state less than manyother states, Massachusetts was well positionedfor an economic expansion. At that time, thestate’s jobs were concentrated in three key
The Massachusetts Institute for a New Commonwealth
14
TABLE 2
A Measure of Housing Affordability* in the U.S. and Massachu-setts, 1980-2000
Massachusetts Rank Year U.S. Massachusetts Among 50 States
1980 2.22 1.99 26th
1990 2.63 4.41 3rd
2000 2.92 3.89 3rd
*The ratio of median housing price to median household income.
sectors: manufacturing, trade, and privateservices. Manufacturing industries, tradition-ally the source of many good-paying blue-col-lar jobs, accounted for one in four jobs in ourstate. During the 1980s expansion, Massachu-setts added many new jobs, but the jobs werenot distributed evenly across sectors. Employ-ment in some sectors surged ahead rapidly.The private services sector, the leading sourceof new jobs, expanded by more than 190,000,accounting for 44 percent of all the new jobscreated between 1983 and 1988. Wholesaleand retail trade also experienced large gains inemployment. And although the constructionsector represented a small portion of theeconomy, it was an important source of newjobs, adding nearly 60,000. The only majorsector to shrink during this period of econom-ic prosperity was manufacturing. By 1988,manufacturing jobs had declined by 7 percent(44,000 jobs).
The Recession of 1989 to 1991The prosperity of the 1980s ended abruptly inDecember 1988, and for almost four years,the Commonwealth experienced substantialjob losses, more severely than in any otherpart of the country. Massachusetts lost 11 per-cent of its wage and salary jobs, a decline notseen since the Great Depression. Overall, therecession cost Massachusetts 335,000 jobs.
The recession wiped out much of the jobgains that the state had made in the 1980s. Joblosses were concentrated in specific sectors,most notably manufacturing, construction,and wholesale and retail trade. The state’smanufacturing sector entered the recession ina weakened position (having lost jobs duringthe 1980s expansion), and during the reces-sion, one out of every five manufacturing posi-tions was lost (118,000 jobs). Constructionindustry jobs fell by nearly half between 1988and 1992. Together, manufacturing and con-struction jobs accounted for 55 percent of alljobs lost in Massachusetts. These severe joblosses had a huge impact on blue-collar work-
ers. But these losses did not happen in isola-tion. Employment in other sectors, such astrade, retail, and construction, also droppedconsiderably.
The only major sector that did not losejobs during the recession was the private serv-ices sector. Despite the economic hard times,firms in services were able to add 17,000 netnew jobs.These jobs were in industries such ashealth services and computer software and dataprocessing services. Even during the reces-sion, the mix of jobs continued to change.Many of the growth industries in the servicessector employed large numbers of collegegraduates. Thus, during the recession, collegegraduates were more insulated from the joblosses that plagued less educated workers.
The Recovery and Job Boom of the 1990sBeginning in 1992, the Massachusetts (andNew England) economy began to recover.Therecovery was steady but slow. It took until late1997 for the state to fully recover all the jobsthat had been lost during the recession. Bet-ween 1992 and 2000, the state added 525,000new jobs—recovering the 335,000 jobs thathad been lost and gaining 190,000 new jobs.The Massachusetts economy continued to fundamentally change its industrial structure.Many of the new jobs were created in differentindustries than the jobs that had been lost, andthis latest round of job creation further shiftedthe Massachusetts economy toward jobs thatrequire college degrees.
The rates of job creation again varied con-siderably across industry sectors.The new jobswere heavily concentrated in the state’s privateservices, trade, and construction industries.The services sector created 295,000 new jobs.It alone accounted for 56 percent of the newjobs. The trade sectors also added many newjobs.Together, the services sector and the tradesector accounted for three-quarters of the newjobs created from 1992 to 2000.The construc-tion sector grew rapidly as well, although in2000 it still had not recovered all of the jobs it
The State of the American Dream in Massachusetts, 2002
15

had lost during the recession. Other sectors,such as finance, insurance, real estate (FIRE) andtransportation, communications and utilities(TCU) also added jobs. As the economy accel-erated toward full employment, however, themanufacturing sector continued to lose jobs. Inthe past eight years, the Massachusetts econo-my shed another 30,000 manufacturing jobs.
As a consequence of this strong jobgrowth and very limited labor force growth,from 1991 to 2000, the state’s unemploymentrate fell from 9.1 to 2.6 percent—the lowestrate recorded in the past thirty years.The com-bination of strong job growth and extraordi-narily low unemployment rates led to laborshortages in a growing number of industriesand occupations across many skill levels. Inaddition, the absence of any growth in the sup-ply of native-born workers made Massachu-setts employers highly dependent on new for-eign immigrants to meet their needs.11
Slow Labor Force Growth and the Out-migration of Young, Well-Educated WorkersMassachusetts has built its economic successon the brains and skills of its workers. Humancapital is our most important resource. Yetover the entire decade of the 1990s, our resi-dent labor force grew by less than 2 percent,while the nation’s labor force grew by nearly14 percent. Our state had the fourth lowestrate of labor force growth in the country inthe 1990s. In fact, our state’s extraordinarilylow unemployment rate at the end of the 1990swas partially a reflection of the lack of growthin the labor force.The slow growth in the sizeof the state’s labor force poses a serious threatto the state’s ability to sustain a healthy econ-omy. The lack of adequate labor supply mayprevent new companies from locating inMassachusetts and prevent existing firms fromexpanding their operations in our state.
The limited growth in the labor force ispartially explained by the fact that Massachu-setts has been losing workers to other states,even during the economic boom years of the
late 1990s. Every year in the 1990s, more peo-ple moved out of Massachusetts than movedinto it. In the recession of the early 1990s, welost about 60,000 people each year. Even dur-ing the boom, we lost people. In 2000, thepeak of the economic cycle, Massachusetts isestimated to have lost 20,000 people.What isalso important to realize is that many of thepeople who leave Massachusetts are adults ofprime working-age, and many are college-educated. Their departure is a double threat to a state with both a limited labor forcegrowth and an aging population. Developingstrategies to stop the outmigration of young,well-educated workers is a promising way toexpand our labor force.
Foreign immigrants have helped to fill thegap, playing a key role in our state’s economicsuccess in the 1990s. Massachusetts and severalof our neighboring states have become almostentirely dependent on immigrants to meettheir needs for workers. New immigrant work-ers accounted for all of the net growth in thestate’s labor force over the past decade.With-out these immigrant workers, the state’s laborforce would have actually shrunk.These work-ers allowed us to expand our labor force, andother states are waging active campaigns toattract new immigrants for precisely this rea-son.While some immigrants are highly skilled,many of the newer immigrants do not speakEnglish well and also have limited formalschooling. As our state relies more and moreon immigrant workers, we face the associatedchallenges of making certain they have the
The Massachusetts Institute for a New Commonwealth
16
U.S. Massachusetts
20
15
10
5
0
CHART 10
Labor Force Growth, 1989-2000
perc
ent
11 The job growth of the late 1990s endedin the last quarter of 2000. In early 2001,the economy began to show signs of aneconomic slowdown. Preliminary indica-tors include rising layoffs, reductions injobs, hiring freezes, increasing unem-ployment, and a marked slowdown inwage and benefits growth. Since the fallof 2000, unemployment in Massachusettshas risen by nearly two percentage pointsto 4.5 percent. The job losers in this eco-nomic downturn include many collegegraduates in information technology andtelecommunications industries as wellas production workers in manufacturing.Nationally, younger workers between theages of 16 and 24 have been hit muchharder by the job losses. While it willtake some time to know the full scopeand dimensions of this downturn, manyworkers and families are already feelingits effects.

skills needed to succeed in and contribute totoday’s economy.
The size of a state’s labor force dependson the rate of participation of residents in thelabor force—that is, how many of the working-age residents are either working or activelylooking for work (unemployed). In terms oflabor force participation, our comparativeranking has deteriorated since the late 1980s,and Massachusetts now ranks 32nd out of the50 states. Thus, there is plenty of room forimprovement. In Massachusetts, the laborforce participation rate peaked in the late1990s with 69 percent of the state’s working-age population working or actively looking forwork. Consider that the average participationrate of the top ten states in the country is 72.8percent. If Massachusetts could have matchedthis rate, the state would have added 260,000workers to its labor force in 2000. Dependingon the educational and occupational back-grounds of these potential workers, the statecould have effectively addressed many of thelabor shortages it faced at the end of the 1990s.It is clear that we need to identify and removebarriers that discourage our working-age resi-dents from seeking employment.
The Outcome: An Economy with NarrowedRoutes to SuccessDuring the past two decades, the compositionof industries and jobs in Massachusetts hasdramatically changed. Since 1983, Massachu-setts has gained 623,600 new jobs. During thissame period, the state lost 193,100 manufac-turing jobs. In 1983, manufacturing jobs rep-resented almost one quarter of all jobs. By2000, they had shrunk to 13 percent of thejobs in our state. In sharp contrast, the privateservices sector expanded from about onequarter of the state’s jobs to 36 percent of alljobs in the Commonwealth by 2000.
How Diverse was the Recovery?The conventional wisdom says that the Massa-chusetts economy diversified substantially
after the recession of the early 1990s andwould now be better able to generate long-term economic growth and withstand anothereconomic downturn. An analysis of recentdata on job growth since 1992, however, indi-cates that job creation in our economy was notevenly distributed across a broad array ofindustries. To the contrary, the recovery wasled by strong growth in a relatively small num-ber of industries.
For instance, the business services sector(a subsector of private services) created morethan 134,000 jobs. Although this sector rep-resented only 6 percent of all jobs in the early1990s, it accounts for more than 25 percent ofthe new jobs in the 1990s. The business serv-ices sector consists of a diverse array of indus-tries, and much of the growth came from tem-porary-help firms and the computer software,computer services, and data processing indus-tries.Another strong source of job growth waswithin the specialty trades construction indus-try.These workers engage in activities such asplumbing, painting, electrical work, and car-pentry work that is often associated with resi-dential and commercial construction and isless associated with the heavy construction ofBoston’s “Big Dig.” The health services sectorwas also an important source of job growth,adding 37,000 new jobs. These jobs weremostly concentrated in outpatient services,such as home health care, physicians’ offices,and nursing homes. Because of the narrownessof the jobs recovery, the Massachusetts econo-my might be more vulnerable to economic
The State of the American Dream in Massachusetts, 2002
17
CHART 11
Distribution of Employment by Sector
1983 2000
All other sectors
Services 26%
Manufacturing 24%
All other sectors
Services 36%
Manufacturing 13%

downturns than has been widely assumed.Equally important are the implications fortoday’s workers. The evidence suggests justhow difficult it is for families to succeed if theyare not connected to one of the handful of job-creating sectors. In addition, it highlights theneed for better education and job-trainingopportunities.
Labor Productivity Over the last decade, real output per worker—a key measure of labor productivity—grewat a strong rate, although well below our per-formance in the 1980s. Even during the reces-sion of the early 1990s, output per worker inMassachusetts increased. Overall, from 1989to 1999, real output per worker in Massachu-setts increased by 24 percent, surpassing a ris-ing national rate by 10 percentage points. Onthis measure, Massachusetts ranked 5th high-est among the 50 states in the 1990s. Thegrowth in output, however, varied consider-ably among different industries. A very highshare of the output growth occurred in a fewkey industries (electrical and electronic equip-ment, industrial machinery, stockbroker andmutual fund industries, business services, andreal estate). This relatively small number ofindustries also saw very high rates of growth inreal wages and salaries per worker. Thus, thevery large gains in labor productivity in Massa-chusetts were specific to a few industries andnot widespread across all industries.
Changing Demand for WorkersShifts in employment across industries havecontributed to powerful changes in the demandfor workers by education and occupation. Inaddition, the skills requirements of jobs havechanged considerably. As the state has shiftedfrom a goods-producing to primarily a servic-es-providing economy, the increase in demandfor workers has been almost exclusively foroccupations dominated by college graduates.But lower-skilled jobs in service occupationshave also increased at an above-average rate.
Employment in executive and managerialpositions has grown tremendously since theearly 1980s. Professional employment has alsoincreased strongly, and jobs in technician occu-pations grew modestly as well.The jobs with-in these occupations generally require workersto have a college education. In 1983-84, 30percent of all jobs in the state were concen-trated in occupations that generally require acollege degree. By 1999-2000, that number hadincreased to at least 38 percent.12 According toemployment projections, the future likely holdsmore of the same: more demand for workerswith four or more years of college.
At the same time that the demand for col-lege graduates has grown, there have beenlarge declines in clerical and semi-skilled blue-collar jobs. Between 1983 and 1999-2000,largely because of the shrinking manufacturingindustry, the state lost 103,000 semi-skilledblue-collar jobs. It also lost 48,000 administra-tive support/clerical jobs. Unskilled blue-col-lar employment fell by another 8,000 jobs.These declines substantially reduced the num-ber of well-paid opportunities for high schooldropouts and even for high school graduates.As the demand for workers has changed, sohas the educational profile of workers. Manyworkers without a high-school degree havewithdrawn from the labor force. They alsoexperience relatively high rates of unemploy-ment and underemployment when they seekto enter the labor market.
The economy’s demand for certain typesof workers is reflected in the willingness of
The Massachusetts Institute for a New Commonwealth
18
1983-84 1999-00
perc
ent
40
30
20
10
0
CHART 12
Jobs in Massachuestts That Generally Requirea College Degree
12 If we were to include workers in high-levelsales occupations (sales representatives,stock brokers, buyers) which oftenrequire college degrees, that numberwould rise to above 40 percent.
employers to pay them more, while reducingthe pay of workers not in demand. From 1979to 2000, only workers in a few occupationalgroups saw their earnings increase, while mostother workers actually lost ground. In ourstate, the only workers who improved theirearnings were professional, technical, andservice workers.Technical workers gained themost, increasing their salaries by 25 percent.The median earnings of executives and man-agers stayed the same, but earnings for thosein the higher management ranks increasedsharply. All other workers lost ground.Lower-level sales workers and unskilled blue-collar workers saw their earnings decline themost. Laborers, helpers, and cleaners have lostmore than one third of their earnings since1979. As a consequence of these divergenttrends, the occupational salary structure inMassachusetts and across the country has be-come more unequal over the past two decades.
Concluding ThoughtsThe routes to economic success have narrowedover the last two decades. Nowhere is this truerthan in our state.While there are no iron-cladguarantees to achieving economic success, asthe above analysis makes clear, certain behav-iors make success more likely, while others fore-cast economic troubles. In fact, increasinglythere appears to be a straightforward formulathat enables families to achieve a middle-classstandard of living. It is essential to understandthe “rules of the game” for success in today’seconomy, whether one agrees with them or not.The families that are getting ahead financiallylook alike in key respects. Most are college-educated with two income earners who bothwork a substantial number of hours. Virtuallyevery family who fits this description can beexpected to achieve economic success.
How people choose to form families makesan important difference in their economic lifechances. Getting into and staying in the middleclass today tends to require two incomes, whichfor most people means being a married couple
or being in a stable, long-term relationship. Itturns out that families with two adults have a substantially better chance of being able to logthe necessary hours to achieve financial security.
For much of the last twenty years, a keystrategy that married couples have used toincrease their income has been to work morehours, and they have accomplished this by hav-ing the women in these families work outsidethe home and work for more hours per year.This is particularly true for families with chil-dren. While we have come to understand thedegree to which our economy rewards work-ers with advanced skills and college degrees,what we have not appreciated enough is theextent to which married couples have had toexpand their working hours to increase theirfamily incomes.What is most troubling at thispoint is that most middle-class families havefew, if any, hours left for the adults to add totheir work-days. One of the principal strate-gies of working-class and middle-class familieshas come close to being exhausted.
In addition, as most people now know: agood education with a solid base of literacyskills is indispensable for economic success.With each educational degree—high school,associate’s, bachelor’s, and master’s—a per-son’s opportunities expand. In addition,extensive formal and apprenticeship trainingprograms of employers also help a person’sability to succeed.The labor market continuesto increase its rewards for highly educatedworkers. At the same time, the routes to suc-cess have narrowed for those who do not havesome post-secondary education or who havelimited basic skills. Some would even say that acollege education, or at least a two-year degree,has become necessary to achieve the AmericanDream in the Commonwealth today.
Finally, increasingly, a family’s economicfortunes are being shaped by where that familylives within Massachusetts.The economic pros-perity of recent years has not been sharedevenly across the Commonwealth.While aver-age earnings per worker in most of Greater
The State of the American Dream in Massachusetts, 2002
19
Boston and Central Massachusetts increasedconsiderably over the last decade, workers inWestern Massachusetts struggled to makegains. Workers in Southeastern Massachusettsmade gains but the wages of many of the jobsthere are below the wages in other regions ofthe state. As a consequence, the income gapsbetween families in different counties of thestate have widened considerably.
Overall, residents in our state have a hardtime buying a house. Our state has one of thelowest rates of home ownership, and this isprimarily due to high housing costs. Highhousing costs are a particular problem withinGreater Boston. In addition, working-class andmiddle-class families bear the burden of highhousing costs.The ability to own one’s home isa central element of the American Dream andan important way for families to build wealth.
As we enter a new century, the rules foreconomic success are unmistakable.To be clear,we are not arguing that these are what therules should be. Rather, we have presented theeconomic evidence of what it takes to succeedin today’s economy. This study examines long-term economic trends, and the challenges raisedare not ones that can be solved tomorrow.
Our findings raise interesting questionsabout the appropriate roles of the public, pri-vate and non-profit sectors. It is true that the
government has an important role to play inexpanding economic opportunity, especiallythrough strategic investments in education,training, and infrastructure.As the governmentmakes these investments, it is critical that it also play a role in reforming practices andmeasuring outcomes so that people and pro-grams are held accountable for their perform-ance. In some areas, the government’s role maysimply be to disseminate information and usethe bully pulpit to spur actions by others.
While highlighting the important role thatgovernment can and should play in addressingmany of the issues raised in this analysis, wemust also acknowledge that many of our mostinnovative problem-solving efforts are takingplace outside of government in the private andnot-for-profit sectors. It is essential that weleverage the capacity of these sectors to con-tribute proactively to address our economicchallenges.
It is our hope that by documenting thenew economic reality—and especially what it takes to achieve a middle-class standard of living—an informed and ongoing public dia-logue can take place. Middle-class families areat a crossroads.The time is ripe to engage in athoughtful discussion of these issues, for thesake of the health and well-being of our fami-lies and our commonwealth.
The Massachusetts Institute for a New Commonwealth
20

*Important Note About ComparingIncomes and Earnings Over Time—Inorder to adjust for the effects of inflation andto compare the purchasing power of workers orfamilies over time, we have converted dollarsinto real terms. Unless otherwise specified, allof our comparisons are in real terms. In addi-tion, when we use the Current PopulationSurveys (CPS) after 1994, we rely on two-yearaverages because of the reduced sample size.
✔ THE CHANGING FAMILY Family CompositionIn Massachusetts and the U.S., the fraction offamilies that are married couples has declined.In Massachusetts, in 1970, 85 percent of allfamilies were married couples. In 2000-01, 74percent of all families were married couples. . . . . . . . . . . . . . . . . . . . . . . . .page 151
Since 1980, the number of married couples(with or without children) in Massachusettshas decreased by 38,000, and the number ofsingle-parent families has increased by 39,000. . . . . . . . . . . . . . . . . . . . . . . . .page 105
Fewer Massachusetts families have children under18 present in the home. There were 119,300more childless families in the state in 2000-01than in 1980 (17.3% increase). . . .page 105
Family Income and Family CompositionIn 1999-00, median family income in Massa-chusetts was $59,597. Median family incomewas still below its 1989 peak level of $62,382. . . . . . . . . . . . . . . . . . . . . . . . .page 108
Since 1979, the median income of married cou-ples increased by $11,468 (19.6%) to $70,015.During this same period, the median incomeof female-headed families stayed virtually thesame at $25,200. In 1979, married couplesearned 2.4 times as much as female-headedfamilies. In 1999-00, married couples earned2.8 times as much as female-headed families. . . . . . . . . . . . . . . . . . . . . . . . .page 108
Of the families in the top income quintile, 91percent are married couples, even though mar-ried couples account for only 74 percent of allfamilies. A married couple is more than twotimes as likely to be in the top quintile than inthe bottom quintile. . . . . . . . . . .page 132
Of the families in the bottom income quintile,60 percent are single-adult families (with orwithout children), even though they accountfor only 25 percent of the state’s families. Asingle-adult family is more than six times aslikely to be in the bottom quintile than in thetop quintile. . . . . . . . . . . . . . . . .page 132
Only 2.5 percent of married couples are poorcompared to 27 percent of female-headedhouseholds. The “feminization of poverty” hasbeen more severe in Massachusetts than in thenation as a whole. . . . . . . . . . . . .page 150
If the family composition in Massachusetts hadbeen the same in 1999-00 as it was in 1980,then the state’s family poverty rate would havebeen only 6.6 percent rather than nearly 8percent. . . . . . . . . . . . . . . . . . .page 152
Growing Income InequalityThe degree of household income inequality inMassachusetts as measured by the differencebetween the mean and the median was nearlytwice as high in 2000 as it was in 1979 (34%vs. 18%). . . . . . . . . . . . . . . . . . .page 122
In 1998-99, on each of our five measures ofhousehold income inequality, Massachusettshad a higher degree of income inequality thanthe nation. . . . . . . . . . . . . . . . . .page 125
During 1999, the top 10 percent of house-holds received nearly one third of all incomein the state, 32 times as large a share as the bot-tom 10 percent, which received only 1 percentof the income pie. . . . . . . . . . . . .page 127
The State of the American Dream in Massachusetts, 2002
21
Key Findings
In-kind transfer programs of federal and stategovernment and the federal EITC programhelped to reduce the degree of family incomeinequality. The federal and state tax system reduced the relative size of the income gapbetween the top and bottom quintiles of thefamily income distribution in Massachusettsfrom 10 to 1 to 8.2 to 1 in the late 1990s. . . . . . . . . . . . . . . . . . . . . . . . .page 140
Since 1993, individual poverty rates have de-clined sharply in the nation but have remainedessentially unchanged in Massachusetts, rangingfrom 10 to 11 percent. In 1997-99, the state’spoverty rate was only 1.7 percentage pointsbelow the nation’s and ranked 20th lowest. . . . . . . . . . . . . . . . . . . . . . . . .page 148
Poverty rates vary substantially by racial andethnic group. Both Hispanics and Blacks facepoverty rates in the thirty-percent-plus range,four to five times as high as the poverty rate ofWhite, non-Hispanics. . . . . . . . . .page 149
In Massachusetts, poverty rates for familieswith children rise continuously with the num-ber of children under 18 in the home. Childrenare the most poverty prone age group in Massa-chusetts.The poverty rate for families with onechild was 6.5 percent, and it increased to 13.4percent in families with two children and to20.1 percent in families with three or morechildren. . . . . . . . . . . . . . . . . . .page 156
The Changing Economic Role of Women Since 1979, the number of Massachusetts womenemployed full-time, year-round has increasedby 44 percent. By 2000, women accounted fornearly 40 percent of the state’s full-time, year-round workers, up from 35 percent in 1979. . . . . . . . . . . . . . . . . . . . . . . . . .page 83
Women in Massachusetts have enjoyed a 22percent gain in annual earnings since 1979. In2000, the median annual earnings of womenwas $30,000. The median annual earnings ofmen has fallen 1.5 percentage points to$40,000 during the same period. . . .page 86
In 1979, wives’ earnings accounted for 13 per-cent of the total earnings of both spouses. By1999-00, wives’ earnings accounted for 32percent of the total earnings. . . . . .page 118
In 1999-00, 75 percent of all married women inMassachusetts worked outside the home. In1979, 64 percent of all married women workedoutside the home. . . . . . . . . . . . .page 115
The group whose economic role changed themost in the last twenty years was wives withchildren. In 1979, 61 percent of wives withchildren worked outside the home, and 68 per-cent of wives without children worked outsidethe home. Today, 75 percent of wives withchildren work outside the home, nearly iden-tical to 76 percent of wives without childrenwho work outside the home. . . . .page 115
Over the last twenty years, wives have sub-stantially increased the annual number of hoursthat they work outside the home.Today, the typ-ical working wife works 1,976 hours per year.Again, the biggest increases have occurredamong wives with children. Over the last twen-ty years, their median hours of work increasedfrom 1,040 to 1,560.They now work about 30hours per week.Wives without children work2,080 hours annually. (In chapter 5, we also in-clude hours of work for all married women.) . . . . . . . . . . . . . . . . . . . . . . . .page 117
The Massachusetts Institute for a New Commonwealth
22
Wives with more education are more likely towork outside the home. In 1999-00, 77 per-cent of wives worked in families in which thehusband is a college graduate compared to 57percent of wives in families in which the hus-band is a high school dropout. More educatedwomen also work more hours than less edu-cated women. . . . . . . . . . . . . . . .page 115
The typical (nonelderly) married couple wasable to increase its income by $14,200 (23.1%)since 1979.The bulk of this increase was due tothe increased earnings of wives in these families.In the absence of wives’ earnings, the median in-come of married couples in Massachusetts wouldhave increased by $3,200 (6.5%). . . .page 114
Among married couples with children, the medi-an family income increased by $15,000 (25%)since 1979.Without the wives’earnings, the medi-an income of these families would have increasedby only $1,100 (2%).Among married coupleswithout children, their income increased by$13,000 (20%). In the absence of wives’ earn-ings, the median income of these families wouldhave increased by only $6,200 (13%).page 114
Wives in more educated families contributedmore to family incomes. In Massachusetts, since1979, the typical income of married coupleswith husbands who were high school dropoutswould have declined by $7,700 (-21%) if wives’earnings were excluded—compare this to theactual decline of $6,000 (-14%). The medianincome of married couples in which the hus-band was a high school graduate would havefallen by $4,200 without the wives earnings.Instead, their incomes rose by $4,000 (7%).The median income of married couples withhusbands holding a bachelor’s degree rose by$16,400 compared to a gain of only $2,500 ifwives’ earnings were excluded.The median in-come among married couple families with a hus-band holding a post-baccalaureate degree roseby $40,200 compared to a gain of $13,900 ifwives’ earnings had been excluded. page 114
Working Long Hours to Join the Middle ClassIn 1999, in the U.S., the average annual num-ber of hours that families worked was 2,875.In Massachusetts, the average family worked2,850 hours (These averages include all fami-lies, including those with no paid workers). . . . . . . . . . . . . . . . . . . . . . . . .page 135
Middle-class families in Massachusetts work2,000 to 3,900 hours per year. (This is therange of hours for the middle three quintiles).At the bottom end of the range, these hoursare slightly more than the equivalent of onefull-time worker. Upper middle-class familieswork more than the equivalent of two full-time workers. . . . . . . . . . . . . . . .page 135
Families in the middle quintile work 3 times asmany hours as families in the bottom quintile(2,998 hours compared to 992 hours). Familiesin the top quintile work 4.4 times as many hoursas families in the bottom quintile (4,384 hoursper year compared to 992 hours). .page 135
The poorest families in Massachusetts workfewer hours than their national peers (992hours compared to 1,235 hours). In contrast,the wealthiest families in Massachusetts workmore hours than their national peers (4,384hours compared to 4,101 hours). . .page 135
The average hourly wage for families in thebottom quintile was $7.29, while the averagewage for families in the top quintile was $35.30.Average hourly wages for middle-class familiesranged from $11.68 to $20.58. . . .page 135
The State of the American Dream in Massachusetts, 2002
23
The employment rates of poor families in ourstate are lower than those of their nationalcounterparts. Only 41 percent of poor familiesin Massachusetts worked at some point during1998-99 compared to 55 percent of theirnational counterparts.Work rates of poor fam-ilies in our state varied considerably across age and educational level. The oldest (65 andolder) and the youngest (under 25) familyheads had the lowest employment rates, andpoor high school dropouts were employed atonly one-half the rate of poor high schoolgraduates. . . . . . . . . . . . . . . . . .page 157
During 1998-99, the typical poor family inMassachusetts worked 15 weeks and 478hours. . . . . . . . . . . . . . . . . . . . .page 157
One third of Massachusetts families who werejobless in the late 1990s were poor compared to21 percent of those who worked 1-1000 hoursper year and only 1.5 of those who worked1800 or more hours. . . . . . . . . . .page 158
✔ THE GROWING IMPORTANCE OFEDUCATION AND SKILLSThe educational composition of the workforcehas changed markedly over the past two de-cades. The state has added 415,000 full-time,year-round workers who have at least a four-year college degree, and the number of full-time, year-round workers with a high schooldegree or less has decreased by 156,000. . . . . . . . . . . . . . . . . . . . . . . . . .page 83
In Massachusetts, the proportion of full-time,year-round workers with a bachelor’s or higherdegree increased from 26 percent in 1979 to37 percent in 2000. During that same timeperiod, the proportion of full-time, year-roundworkers with a high school degree or lessdecreased from 58 percent to 38 percent. . . . . . . . . . . . . . . . . . . . . . . . . .page 83
The biggest difference between Massachusettsfamilies and their U.S. counterparts is in levelof education. The heads of families in Massa-chusetts are considerably more likely to becollege graduates who have completed 16 ormore years of schooling. . . . . . . . .page 83
In 1983-84, 30 percent of employment in ourstate was concentrated in jobs that generally require a college degree. By 1999-2000, thatfigure had increased to 38 percent. .page 73
Since 1979, the earnings of full-time, year-round workers who lack a high school degreedeclined by $7,491 (27%). Full-time workerswith a high school degree gained $468 (1.6%).Full-time workers with a four-year collegedegree gained $1,702 (3.8%), and those withmore than a college degree gained $6,419(12%).As a result, the gap in earnings betweenthe most educated and less educated workerswidened. . . . . . . . . . . . . . . . . . . .page 89
In Massachusetts, over the last twenty years,the median income of families headed by highschool dropouts declined by almost $6,966 (-21%). The median income of families head-ed by high school graduates declined by $566(-1%). In sharp contrast, families headed bycollege graduates gained $7,924 in additionalincome (11%), and families headed by some-one with a master’s or higher degree gained$24,630 (30%). . . . . . . . . . . . . .page 110
In 1979, the typical family headed by a personwith a bachelor’s degree earned 2.2 times asmuch as the typical family headed by a highschool dropout. By 1999-00, this factor hadincreased to 3.1. . . . . . . . . . . . . .page 110
The Massachusetts Institute for a New Commonwealth
24
Of the families in the top quintile, 62 percenthave at least a four-year college degree,although this type of family accounts for only33 percent of the state’s families. Only 1.4percent of families at the top are high schooldropouts, even though this type of familyaccounts for 15 percent of the state’s families. . . . . . . . . . . . . . . . . . . . . . . . .page 133
In the bottom quintile, 39 percent of familiesare headed by high school dropouts, eventhough this type of family accounts for 15 per-cent of the state’s families. In contrast, only 6percent of families in the bottom quintile areheaded by someone with a college degree orhigher, while this type of family accounts for33 percent of the state’s families. . .page 133
In Massachusetts, 21.7 percent of families head-ed by a high school dropout are poor, com-pared to only 8.3 percent of those headed by ahigh school graduate, and 2.7 percent of thoseheaded by a college graduate. . . . .page 153
The employment rates of Massachusetts 20-64-year-old workers increase strongly withtheir amount of education, ranging from 66percent for those adults lacking a high schooldiploma to 91 percent for those holding abachelor’s degree or higher. . . . . . .page 55
The average annual weeks of employmentamong 20-64-year-olds in Massachusetts rangesfrom 31 weeks for high school dropouts to 45weeks for those who have completed at leastfour years of college. . . . . . . . . . . .page 55
The average annual number of hours workedby all 20-60-year-olds (including the unem-ployed) varies widely by educational group,ranging from 1,200 hours for high schooldropouts to 1,888 hours for four-year collegegraduates. . . . . . . . . . . . . . . . . . .page 56
Less educated workers are also more likely tobe underemployed and members of the laborforce reserve. . . . . . . . . . . . . . . . .page 57
✔ THE GEOGRAPHY OF SUCCESSEarnings, Income, and Poverty Rates Across Regions and CountiesFrom 1980 to 2000, the total amount of wagesearned in Greater Boston (Essex, Middlesex,Plymouth and Suffolk Counties) increasedfrom $44.8 billion to $95.3 billion (112%),while in Western Massachusetts (Berkshire,Franklin, Hampden, and Hampshire Counties)it increased from $6.7 billion to $8.9 billion (33%). In Southeastern Massachusetts(Barnstable, Bristol, Dukes, and NantucketCounties), it increased from $4.6 billion to $8.4billion (83%), and in Central Massachusetts(Worcester County), it increased from $6.0billion to $10.4 billion (73%). . . . .page 166
The growth of aggregate wage and salary pay-ments was much more uneven in the 1990sthan the 1980s. From 1989 to 2000, the totalamount of wages and salaries paid to workersin Greater Boston increased eight times as muchas in Western Massachusetts (40% versus 5%).In Southeastern Massachusetts and CentralMassachusetts, it increased 26 percent and 28percent, respectively. . . . . . . . . . .page 167
Annual pay per employee grew in all regionsof the state but at substantially different ratesbetween 1989 and 2000. In Greater Boston,the average earnings per employee increased from $29,754 to $47,969 (61%). In WesternMassachusetts, they increased from $26,057to $30,474 (17%). In Southeastern Massa-chusetts, they increased from $22,587 to$29,650 (31%), and in Central Massachusetts,they increased from $26,906 to $37,667(40%). . . . . . . . . . . . . . . . . . . .page 171
The State of the American Dream in Massachusetts, 2002
25
The income disparities between differentcounties are large. In the 1990s, average earn-ings in all of the state’s 14 counties increased,but at vastly different rates. The earnings perprivate sector employee in Suffolk Countyincreased by 39 percent, while earnings inHampshire County increased by less than 1percent. Other leading counties in terms ofincreased earnings include: Middlesex, Norfolk,Nantucket, and Essex Counties. . . .page 173
Over each of the past three decades, the rate ofgrowth of the per capita incomes of Massachu-setts residents varied widely from county tocounty. During 1999, the per capita incomesranged from lows of $26,000 to $27,000 inHampshire and Franklin Counties to highs of$42,000 to $46,000 in Norfolk, Middlesex, andNantucket Counties. In 1979, the per capitaincome of the highest-income county (NorfolkCounty) was 39 percent higher than that of thelowest-income county (Hampshire County).By 1999, the per capita income of the highest-income county (Nantucket County) was 75 per-cent higher than that of the lowest-incomecounty (Hampshire County). . . . . .page 176
The gaps between the incomes of families indifferent counties have also increased. In 2000,the median families in Middlesex and NorfolkCounties earned about $75,000. In Suffolk andHampden Counties, the two least affluent coun-ties in terms of family income, the median fam-ily earned $45,000 to $48,000. . . .page 179
The poverty rates of residents in differentcounties vary considerably.With a rate of 17.3percent in 2000, Suffolk County has the highest poverty rate. Norfolk County has thelowest, with a rate of 4.9 percent. Over thelast decade, poverty has increased the most inHampden, Plymouth, and Worcester Counties. . . . . . . . . . . . . . . . . . . . . . . . .page 180
Job Creation Across RegionsThe rate of job creation has varied considerablyacross the different regions. All parts of thestate lost jobs at about the same rate duringthe early 1990s. As the state recovered andthen surpassed its previous employment peak,Southeastern Massachusetts led the state in jobcreation, increasing its jobs by 27 percent.Greater Boston and Central Massachusetts alsoadded jobs, at a rate of 21 percent and 20 per-cent, respectively. Western Massachusetts in-creased the number of its jobs by only 11 per-cent. In 2000,Western Massachusetts had stillnot recovered all of the jobs it had lost duringthe recession of the early 1990s. . .page 169
Among the counties, Nantucket led the statein job creation, adding new jobs at a rate of 61percent from 1991 to 2000. Other leaders in terms of job creation included Barnstable,Dukes, Bristol, and Plymouth. Even HampshireCounty in Western Massachusetts was able toadd new jobs at a rate of 21 percent during the economic boom. Berkshire and HampdenCounties lagged the rest of the state, addingnew jobs at a rate of less than 10 percent duringthe recent economic prosperity. . .page 172
High Housing CostsIn 2000, with a rate of 62.2 percent, Massa-chusetts had the sixth lowest rate of homeownership in the country. . . . . . . .page 184
Home ownership rates of households inMassachusetts have consistently lagged behindthose of their U.S. counterparts over the entire1940-2000 period, although this gap has nar-rowed since the 1980s. By 2000, the gap bet-ween the home ownership rates of the nationand state had narrowed to 4 percentage points(66.2% compared to 62.2%). . . . .page 184
The Massachusetts Institute for a New Commonwealth
26

Across the 14 counties, home ownership ratesvaried considerably in 2000. Home ownershiprates varied from a low of just under 34 per-cent in Suffolk County to a high of nearly 78percent in Barnstable County. Three of thestate’s counties (Dukes, Plymouth, and Barn-stable) had home ownership rates above 70percent, ten had home ownership rates bet-ween 61 and 69 percent, and one, SuffolkCounty, ranked far behind at the very bottomof the distribution at 34 percent. . .page 187
Since 1996, home prices have risen sharply ineach of six large metropolitan areas, withBoston, Lawrence and Lowell experiencing atwo-thirds increase in their housing prices bet-ween 1996 and 2001. In contrast, home pricesonly rose by 26 percent in the Springfield met-ropolitan area, reflecting the lower growth ratesof jobs and incomes in the western part of thestate during the 1995-2000 period. page 189
For homeowners in the Boston metro area,the median housing burden (monthly owner-ship costs as a percent of gross income) was 19percent, versus 17 percent for the U.S.Thesehousing burdens vary widely by income group,with the highest burden for lower middle andmiddle income families. Boston’s median hous-ing burden ratio ranked 7th highest among 21metro areas across the country. . . .page 194
In Massachusetts, home prices more thantripled between 1980 and 1990, while they in-creased by only 71 percent in the U.S. over thesame decade. Massachusetts led all 50 stateson home price increases over the decade.During the first half of the 1990s, the prices ofexisting homes in the Commonwealth werebasically stagnant, declining by 0.4 percentbetween 1990 and 1996. Following 1996, homeprices in Massachusetts once again experiencedexplosive growth, rising by 62 percent between1996 and 2001 while home prices increasedby 36 percent in the U.S. over the same timeperiod. . . . . . . . . . . . . . . . . . . .page 188
In 1980, in Massachusetts, the median homecost roughly twice (1.99 times) as much as themedian household’s income. During the 1980s,the extraordinarily rapid rise in home prices inour state far outstripped the growth in medianhousehold income. As a consequence, the rel-ative housing affordability ratio more than dou-bled to 4.41. In 2000, the ratio decreasedslightly to 3.89, but the state continued tohave the 3rd highest housing burden in thecountry. . . . . . . . . . . . . . . . . . .page 190
If the housing burden in Massachusetts in 2000had been equal to the value for the median state(2.79), the home ownership rate in Massachu-setts in 2000 would have been 68.2 percent,six percentage points higher than the actualrate of home ownership. This would have increased the number of homeowners inMassachusetts by 150,000 during that year. . . . . . . . . . . . . . . . . . . . . . . . .page 196
Massachusetts has largely failed to add newhouses to its housing stock. The number ofhousing permits in our state fell in the early1990s and increased only modestly from 1992onward; however, the relative size of theincrease was considerably smaller than in theU.S. overall. In 2000, there were only 10 per-cent more housing permits in Massachusettsthan there were in 1990. . . . . . . .page 192
Of the 115.7 million housing units in the U.S.in 2000, 17.1 percent had been built between1990 and 2000. In contrast, only 8 percent ofall of the housing units (rental and owner occu-pied) in Massachusetts in 2000 had been builtin the prior decade. The percentage of “new”housing units in Massachusetts was less thanone-half as high as that of the nation, and ourperformance ranked 48th among the 50 states. . . . . . . . . . . . . . . . . . . . . . . . .page 192
The State of the American Dream in Massachusetts, 2002
27

✔ A TRANSFORMED ECONOMYOver the period of 1983 to 2000, Massachu-setts lagged well behind the nation in the rateof new job creation. During this period, thenumber of jobs in the U.S. increased by 46percent. In Massachusetts, the number of jobsincreased by 23 percent. . . . . . . . .page 62
The 1980s ExpansionIn 1983, manufacturing industries accounted fornearly one in four jobs (24%) in the state.Theprivate services sector was slightly larger andwas the state’s largest employer, accounting for26 percent of all jobs in the state. . .page 64
During the expansion of the 1980s, the privateservices sector was the leading source of newjob creation.The services sector accounted for44 percent of all net new jobs. Constructionjobs increased by nearly 60,000, a growth rateof 72 percent. . . . . . . . . . . . . . . .page 65
The Economic Recession of 1989 to 1991Between 1988 and 1992, wage and salary jobsdeclined by 335,000 jobs (10.7%) in Massa-chusetts. . . . . . . . . . . . . . . . . . . .page 66
Between 1988 and 1992, the state’s manufac-turing sector lost one out of five positions(118,000 jobs). Construction jobs declined bymore than 68,000 positions. During the sametime period, the private services sector added17,000 net new jobs. . . . . . . . . . . .page 66
The Economic Recovery and Job Boom ofthe 1990sIt was not until late 1997 that the state fullyrecovered the jobs lost during the recession of1989-1992. Overall, between 1992 and 2000,the state added 525,000 jobs—recovering the335,000 jobs lost during the recession andgaining an additional 190,000 jobs. .page 69
The job expansion was led by the private serv-ices sector, which added 295,000 new jobs.The private services sector by itself accountedfor 56 percent of the net increase in wage andsalary employment from 1992 to 2000. Duringthe recovery, manufacturing jobs continued todecline, losing 30,000 more jobs. . .page 69
Only one of every 500 labor force participantsin Massachusetts experienced a hard-core un-employment problem in 2000 (unemployed for27 or more weeks) compared to one out ofevery 33 workers in 1992. . . . . . . .page 52
The Outcome: An Economy with NarrowedRoutes to SuccessSince 1983, Massachusetts has gained 623,600new jobs. During this same period, the statelost 193,100 manufacturing jobs. In 1983,manufacturing jobs represented almost onequarter of all jobs. By 2000, they had shrunkto 13 percent of the jobs in our state. In sharpcontrast, the private services sector expandedfrom about one quarter of the state’s jobs to36 percent of all jobs in the Commonwealthby 2000. . . . . . . . . . . . . . . . . . . .page 69
The economic recovery was led by strongemployment growth in a relatively small num-ber of industries. The business services sectorby itself created more than 134,000 jobs. In1992, the business services sector accountedfor only 6 percent of private sector employ-ment, yet it accounted for more than one infour net new private sector jobs in Massa-chusetts. Another strong source of new jobcreation was the specialty trade constructionindustry. . . . . . . . . . . . . . . . . . . .page 70
The Massachusetts Institute for a New Commonwealth
28

Slow Labor Force GrowthFrom 1989 to 2000, the Massachusetts residentlabor force increased by only 57,000 workers—less than 2 percent—while the country’slabor force increased by almost 14 percent. . . . . . . . . . . . . . . . . . . . . . . . . .page 43
During the 1990s, the working-age populationof Massachusetts increased by 2 percent, whilethe working-age population in the nation in-creased by just under 11 percent. . . page 45
The proportion of 20-34-year-olds in Massa-chusetts declined by nearly 18 percent bet-ween 1990 and 2000. . . . . . . . . . .page 50
In 2000, the labor force participation rate inMassachusetts was below the national average.Our state’s ranking fell to 32nd place. Thelabor force participation rate of men in Massa-chusetts declined by nearly 4 percentage pointsover the last decade. . . . . . . . . . . .page 46
Labor ProductivityFrom 1991 to 1999, real output per capita inMassachusetts increased by 32 percent. Massa-chusetts ranked 6th highest among the 50states. . . . . . . . . . . . . . . . . . . . . .page 75
From 1991 to 1999, real output per worker in-creased by 19.5 percent. Massachusetts ranked5th highest among the 50 states. . . .page 76
Changing Demand for WorkersThe changes in the industrial structure ofemployment in Massachusetts have led tomarked shifts in the demand for workers byoccupation and educational attainment. Em-ployment in executive and managerial posi-tions grew by 61 percent since the early 1980s.Employment in semi-skilled, blue-collar jobsfell by 41 percent. . . . . . . . . . . . .page 72
The occupational characteristics of full-timeworkers in Massachusetts have changed overthe past two decades and are different in anumber of respects from the occupationalcharacteristics of the country. In Massachu-setts, a higher share of the full-time, year-roundworkforce is composed of professional andmanagerial workers than in the nation (39% vs.36%); the state also contains more serviceworkers (12% vs. 10%). On the other hand,the shares of Massachusetts workers in admin-istrative support/clerical occupations and insemi-skilled blue-collar occupations were belowthe U.S. average (11.8% vs. 13.1% and 7.8%vs. 10.3%, respectively). . . . . . . . .page 84
In 2000, the median earnings of full-time,year-round workers in Massachusetts rangedfrom $16,000 for lower level sales workers to$26,500 for administrative support workersto $50,000 for professional workers. Similarto developments across the country, the occu-pational earnings structure has become char-acterized by a higher degree of inequality overthe past two decades. . . . . . . . . . . .page 91
At the end of the 1970s, earnings inequalityboth in Massachusetts and in the U.S. was lowerthan it was at the end of the 1990s, and thedegree of earnings inequality in Massachusettswas generally lower than it was in the nation asa whole. During the last two years, however,earnings inequality in Massachusetts has beenessentially identical to that of the nation. . . . . . . . . . . . . . . . . . . . . . . . . .page 92
The State of the American Dream in Massachusetts, 2002
29

The Massachusetts Institute for a New Commonwealth
30