executive summary india solar market update q2...
TRANSCRIPT
Executive Summary India Solar Market Update – Q2 2017

www.mercomindia.com
India Solar Demand Forecast
• The Indian solar industry is witnessing its best year, with nearly
4.8 GW installed during first six months of 2017, more than all
of the solar installed in 2016.
• Cumulative installed solar capacity now stands at nearly 14.7
GW.
• Mercom forecasts nearly 10.5 GW of solar installations in
calendar year 2017, due to robust project development pipeline
slated to be commissioned by year end.
• Andhra Pradesh became the first Indian state to reach an
installed solar capacity of over 2 GW, closely followed by
Rajasthan with 1.9 GW.
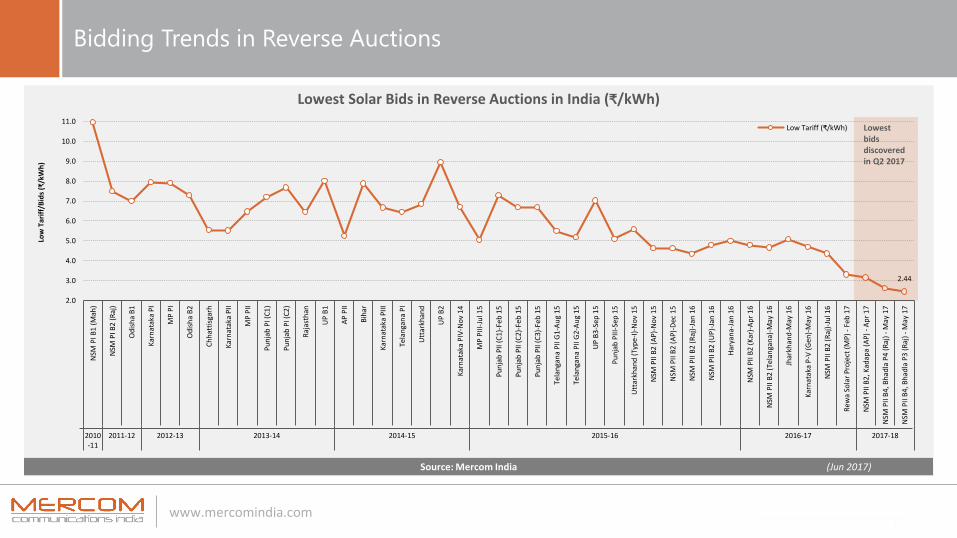
• In Q2 2017, an all time low solar tariff of ₹2.44 (~$0.038) per
kWh was discovered at Bhadla Phase III solar auction in
Rajasthan.
• The lowest bid in solar reverse auctions declined by about 26
percent from Q1 to Q2 2017
• Solar now accounts for nearly 4.4 percent of total installed
electricity generation capacity, and provided nearly one percent
of the total power generated during FY2016-17.
0
10,000
20,000
30,000
40,000
50,000
60,000
70,000
0
2,000
4,000
6,000
8,000
10,000
12,000
2009 2010 2011 2012 2013 2014 2015 2016 2017F 2018F 2019F 2020F 2021F
Cu
mu
lati
ve In
stal
lati
on
s (M
W)
An
nu
al In
stal
lati
on
s (M
W)
Annual Rooftop Solar Installations (MW)
Annual Utility-scale Solar Installations (MW)
Cumulative Solar Installations (MW)
Source: Mercom India (Jun 2017)
India Solar Demand Forecast (MW)
www.mercomindia.com
All India Cumulative Utility-scale Solar Installations by Policy Type
1,6
55
1,4
00
1,3
99
1,2
43
1,0
44
870
867
777
729
680
393
330
330
306
220
211
200
145
140
106
94 90 69 65 48 38 33 29 24 21 16 15 11 5 5 3 3 3 1
0
200
400
600
800
1,000
1,200
1,400
1,600
1,800
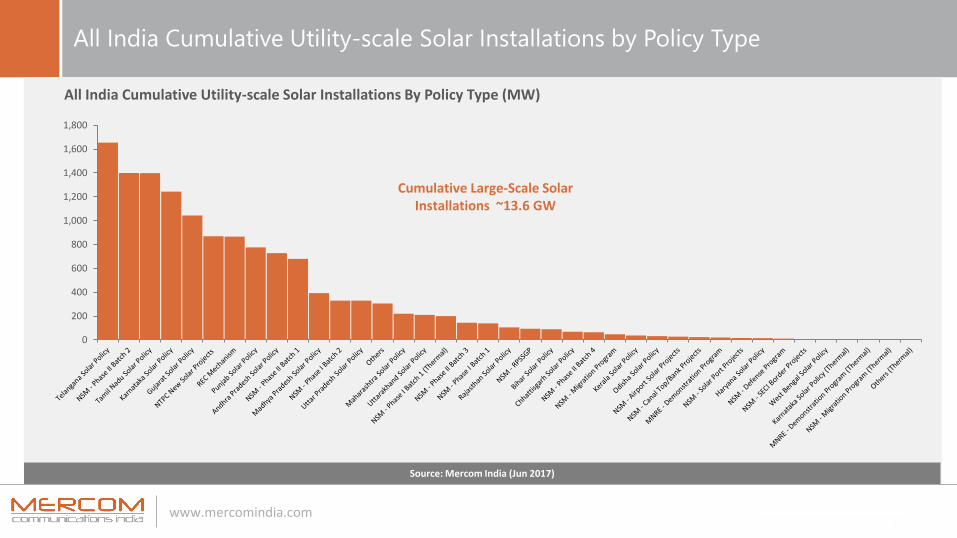
All India Cumulative Utility-scale Solar Installations By Policy Type (MW)
Cumulative Large-Scale Solar Installations ~13.6 GW
Source: Mercom Capital Group (Dec 2016)Source: Mercom India (Jun 2017)
0
200
400
600
800
1,000
1,200
1,400
1,600
1,800
All India Cumulative Utility-scale Solar Installations By Policy Type (MW)
Cumulative Large-Scale Solar Installations ~13.6 GW
Source: Mercom Capital Group (Dec 2016)Source: Mercom India (Jun 2017)
www.mercomindia.com
Policy Updates
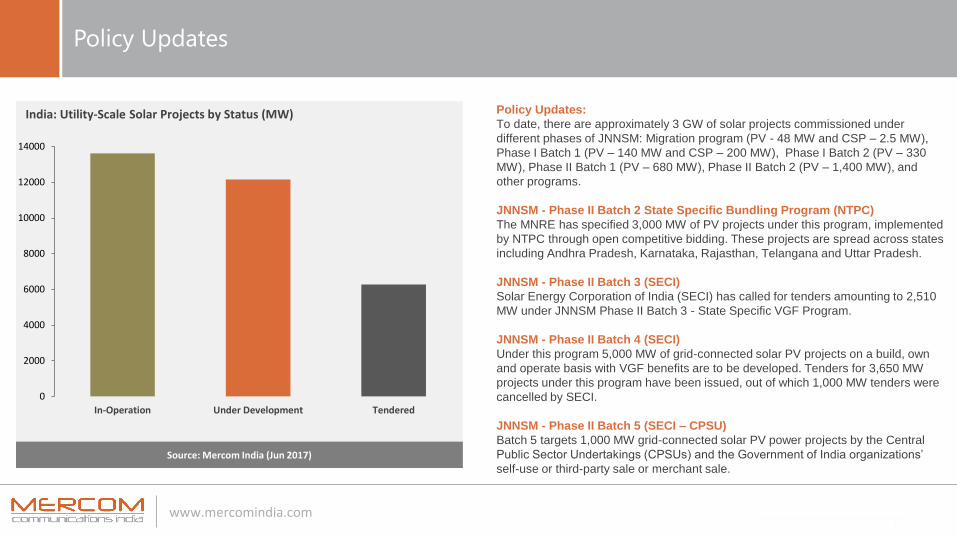
Policy Updates:
To date, there are approximately 3 GW of solar projects commissioned under
different phases of JNNSM: Migration program (PV - 48 MW and CSP – 2.5 MW),
Phase I Batch 1 (PV – 140 MW and CSP – 200 MW), Phase I Batch 2 (PV – 330
MW), Phase II Batch 1 (PV – 680 MW), Phase II Batch 2 (PV – 1,400 MW), and
other programs.
JNNSM - Phase II Batch 2 State Specific Bundling Program (NTPC)
The MNRE has specified 3,000 MW of PV projects under this program, implemented
by NTPC through open competitive bidding. These projects are spread across states
including Andhra Pradesh, Karnataka, Rajasthan, Telangana and Uttar Pradesh.
JNNSM - Phase II Batch 3 (SECI)
Solar Energy Corporation of India (SECI) has called for tenders amounting to 2,510
MW under JNNSM Phase II Batch 3 - State Specific VGF Program.
JNNSM - Phase II Batch 4 (SECI)
Under this program 5,000 MW of grid-connected solar PV projects on a build, own
and operate basis with VGF benefits are to be developed. Tenders for 3,650 MW
projects under this program have been issued, out of which 1,000 MW tenders were
cancelled by SECI.
JNNSM - Phase II Batch 5 (SECI – CPSU)
Batch 5 targets 1,000 MW grid-connected solar PV power projects by the Central
Public Sector Undertakings (CPSUs) and the Government of India organizations’
self-use or third-party sale or merchant sale.
0
2000
4000
6000
8000
10000
12000
14000
In-Operation Under Development Tendered
India: Utility-Scale Solar Projects by Status (MW)
Source: Mercom India (Jun 2017)

www.mercomindia.com
Solar Tenders and Auctions
0
500
1,000
1,500
2,000
2,500
3,000
3,500
4,000
Q3 2016 Q4 2016 Q1 2017 Q2 2017
India Solar Tenders and Auctions by Quarter (MW)
Tenders Auctions
Source: Mercom India
Q3’16 - Out of the total 555 MW, 300 MW tender was cancelled by SECI, due to recently discovered low bids in Rajasthan
Q1’17 - Of the total 1,856 MW, 1,000 MW is a re-tender by NTPC which was earlier tendered in 2016

www.mercomindia.com
Historical Average Module Spot Price Trends in China
• Chinese module prices in India fell by approximately 5% in the
second quarter of 2017.
• Price quotes for Chinese modules in India ranged from $0.28
(~₹18.03)/W to $0.34 (~₹21.9)/W based on size of the orders and
other parameters.
• According to our channel checks, price drop in Q3 could be less
than Q3 of last year as demand in China is a lot stronger due to Top
Runner, Poverty Alleviation programs and increased demand from
the U.S. in anticipation of antidumping ruling in the Suniva case.
• Currently, record-low bids in India are mostly driven by extremely
low Chinese module prices which have enabled developers to be
aggressive in reverse auctions in anticipation of falling Chinese
module prices.0.25
0.30
0.35
0.40
0.45
0.50
0.55
0.60
0.65
Q1'15 Q2'15 Q3'15 Q4'15 Q1'16 Q2'16 Q3'16 Q4'16 Q1'17 Q2'17
Indian Modules ($/W)
Chinese Modules ($/W)
Chinese and Indian Module ASPs Q2 2017
Source: Mercom India (Q2 2017)
www.mercomindia.com
Bidding Trends in Reverse Auctions
2.44
2.0
3.0
4.0
5.0
6.0
7.0
8.0
9.0
10.0
11.0
NSM
PI B
1 (
Mah
)
NSM
PI B
2 (
Raj
)
Od
ish
a B
1
Kar
nat
aka
PI
MP
PI
Od
ish
a B
2
Ch
hat
tisg
arh
Kar
nat
aka
PII
MP
PII
Pu
nja
b P
I (C
1)
Pu
nja
b P
I (C
2)
Raj
asth
an
UP
B1
AP
PII
Bih
ar
Kar
nat
aka
PII
I
Tela
nga
na
PI
Utt
arkh
and
UP
B2
Kar
nat
aka
PIV
-No
v 14
MP
PII
I-Ju
l 15
Pu
nja
b P
II (
C1)
-Feb
15
Pu
nja
b P
II (
C2)
-Feb
15
Pu
nja
b P
II (
C3)
-Feb
15
Tela
nga
na
PII
G1-
Au
g 1
5
Tela
nga
na
PII
G2-
Au
g 1
5
UP
B3
-Sep
15
Pu
nja
b P
III-
Sep
15
Utt
arkh
and
(Ty
pe-
I)-N
ov
15
NSM
PII
B2
(AP
)-N
ov
15
NSM
PII
B2
(AP
)-D
ec 1
5
NSM
PII
B2
(Raj
)-Ja
n 1
6
NSM
PII
B2
(UP
)-Ja
n 1
6
Har
yan
a-Ja
n 1
6
NSM
PII
B2
(Kar
)-A
pr
16
NSM
PII
B2
(Tel
anga
na)
-May
16
Jhar
khan
d-M
ay 1
6
Kar
nat
aka
P-V
(G
en)-
May
16
NSM
PII
B2
(Raj
)-Ju
l 16
Rew
a So
lar
Pro
ject
(M
P)
- Fe
b 1
7
NSM
PII
B2,
Kad
apa
(AP)
- A
pr
17
NSM
PII
B4,
Bh
adla
P4
(R
aj)
- M
ay 1
7
NSM
PII
B4,
Bh
adla
P3
(R
aj)
- M
ay 1
7
2010-11
2011-12 2012-13 2013-14 2014-15 2015-16 2016-17 2017-18
Low
Tar
iff/
Bid
s (₹
/kW
h)
Low Tariff (₹/kWh) Lowest bids discovered in Q2 2017
Source: Mercom India (Jun 2017)
Lowest Solar Bids in Reverse Auctions in India (₹/kWh)
www.mercomindia.com
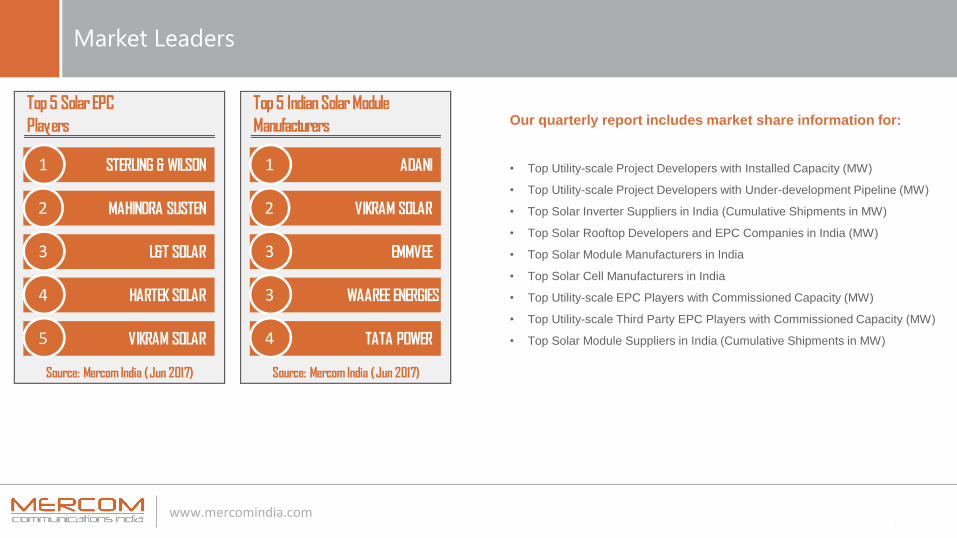
Market Leaders
Source: Mercom India (Jun 2017)
Top 5 Indian Solar Module
Manufacturers
ADANI
VIKRAM SOLAR
EMMVEE
WAAREE ENERGIES
TATA POWER
1
2
3
3
4
Source: Mercom India (Jun 2017)
Top 5 Solar EPC
Players
STERLING & WILSON
MAHINDRA SUSTEN
L&T SOLAR
HARTEK SOLAR
VIKRAM SOLAR
1
2
3
4
5
Our quarterly report includes market share information for:
• Top Utility-scale Project Developers with Installed Capacity (MW)
• Top Utility-scale Project Developers with Under-development Pipeline (MW)
• Top Solar Inverter Suppliers in India (Cumulative Shipments in MW)
• Top Solar Rooftop Developers and EPC Companies in India (MW)
• Top Solar Module Manufacturers in India
• Top Solar Cell Manufacturers in India
• Top Utility-scale EPC Players with Commissioned Capacity (MW)
• Top Utility-scale Third Party EPC Players with Commissioned Capacity (MW)
• Top Solar Module Suppliers in India (Cumulative Shipments in MW)
www.mercomindia.com
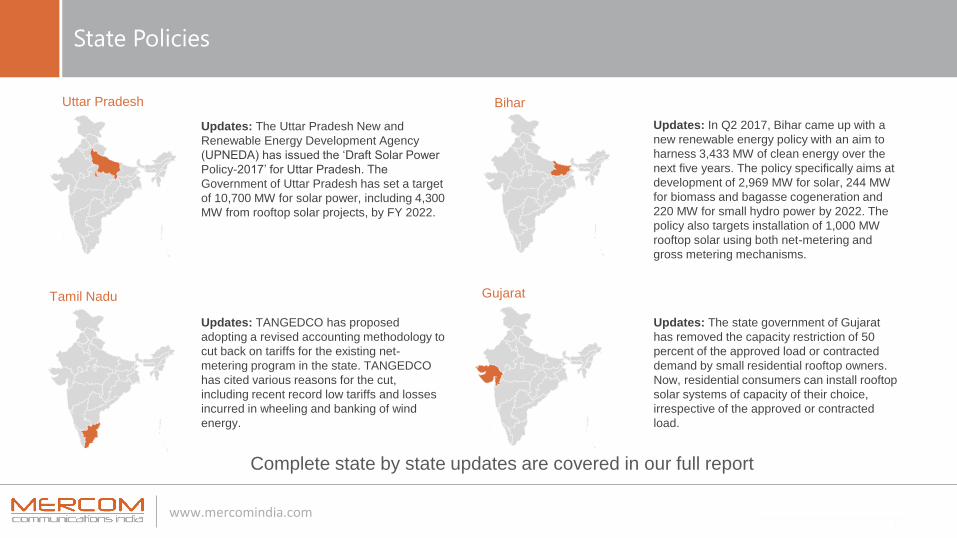
State Policies
Updates: The Uttar Pradesh New and
Renewable Energy Development Agency
(UPNEDA) has issued the ‘Draft Solar Power
Policy-2017’ for Uttar Pradesh. The
Government of Uttar Pradesh has set a target
of 10,700 MW for solar power, including 4,300
MW from rooftop solar projects, by FY 2022.
Updates: TANGEDCO has proposed
adopting a revised accounting methodology to
cut back on tariffs for the existing net-
metering program in the state. TANGEDCO
has cited various reasons for the cut,
including recent record low tariffs and losses
incurred in wheeling and banking of wind
energy.
Updates: In Q2 2017, Bihar came up with a
new renewable energy policy with an aim to
harness 3,433 MW of clean energy over the
next five years. The policy specifically aims at
development of 2,969 MW for solar, 244 MW
for biomass and bagasse cogeneration and
220 MW for small hydro power by 2022. The
policy also targets installation of 1,000 MW
rooftop solar using both net-metering and
gross metering mechanisms.
Updates: The state government of Gujarat
has removed the capacity restriction of 50
percent of the approved load or contracted
demand by small residential rooftop owners.
Now, residential consumers can install rooftop
solar systems of capacity of their choice,
irrespective of the approved or contracted
load.
Uttar Pradesh
Tamil Nadu
Bihar
Gujarat
Complete state by state updates are covered in our full report

Top Seven states which now have over 1 GW of installed solar capacity represent approximately 82 percent of the total installed capacity
1
Total Installations - 2,130 MW Total Installations - 1,921 MW Total Installations - 1,867 MW Total Installations - 1,608 MW Total Installations - 1,271 MW
Total Installations - 1,171 MW Total Installations - 1,165 MW Total Installations - 792 MW Total Installations - 551 MW Total Installations - 479 MW
Top 10 Solar States in IndiaState Ranking Based on Total Installed Utility-scale Solar as of Jun 2017
Andhra Pradesh Rajasthan Telangana
Data from Mercom's India Solar Project Tracker
Karnataka
Gujarat Madhya Pradeh Punjab Maharashtra Uttar Pradesh
Tamil Nadu1 2 3 4 5
6 7 8 9
13.6 GWCumulat ive Solar Capacity
1.6 GWSolar Installat ions Q2 2017
www.mercomindia.com
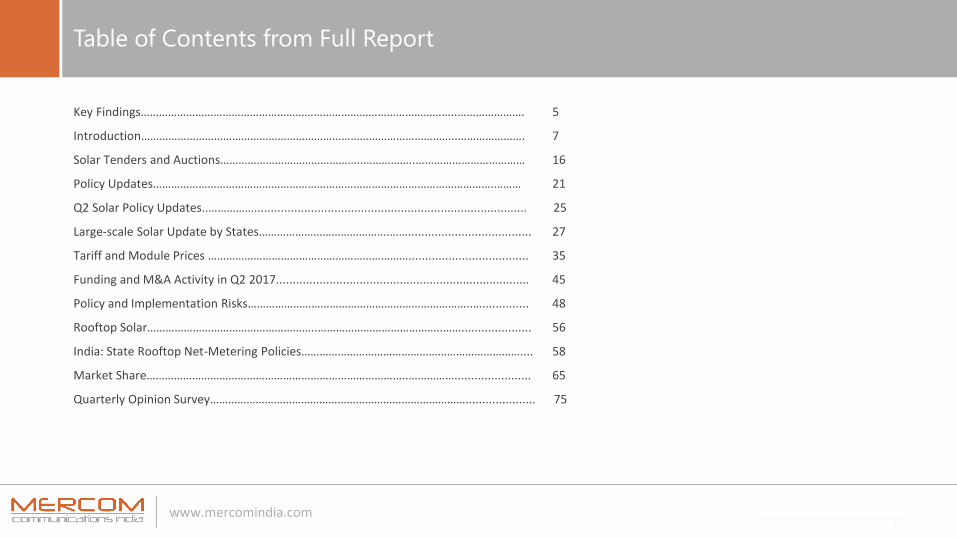
Table of Contents from Full Report
Key Findings…………………………………………………………………………………………..…………………. 5
Introduction…………………………………………………………………………………………..…………………. 7
Solar Tenders and Auctions………………………………………..……………..……………………………… 16
Policy Updates………………………………………………………………………………………………….……… 21
Q2 Solar Policy Updates..…………….................................................................................. 25
Large-scale Solar Update by States…………………………………….……..................................... 27
Tariff and Module Prices ………………………………………………………….................................... 35
Funding and M&A Activity in Q2 2017............................................................................ 45
Policy and Implementation Risks………………………………………………………………..….............. 48
Rooftop Solar………………………………………………..…………………………………..……..................... 56
India: State Rooftop Net-Metering Policies……………………………………………………………….... 58
Market Share…………………………………………………………………………..……………....................... 65
Quarterly Opinion Survey…………………………………………………………………………..................... 75

www.mercomindia.com
List of Charts/Tables from Full Report
India Solar Demand Forecast (MW)……………………….………………………………..…………..…….. 7Installation and Forecast by Market Segment (MW)……………………..…………………..………. 8Solar Installations in 2017 by Quarter (MW) ..……………………………………...……………..……. 9Quarterly Utility-scale Solar Installations in India (MW) ..………………………..………..………. 10Share of New Power Generating Capacity Additions in India ..……………..….………..………. 10All India Cumulative Utility-scale Solar Installations by Policy Type (MW)……..……….…… 11India Utility-scale Solar Project Pipeline (MW) ………………………………............................... 11All India Cumulative Large-Scale Solar Installations By Policy Type................................. 12India Utility-scale Solar Project Pipeline by Policy (MW) …………………............................. 13State-wise Utility-scale Solar Installations in Q2 2017 (MW) ……………….......................... 14India Utility-scale Cumulative Solar Installations by States (MW) …………........................ 15Solar Project Development Pipeline by State (MW)………………………………………………........ 16State-Wise Solar Project Development Pipeline………..………………………………………........... 17India Solar Tenders and Auctions by Quarter (MW) …..................................................... 18Solar Auctions in Q2 2017 ………........................................................................................ 19New Solar Tenders Announced in Q2 2017…………………………………………..…...................... 20Utility-scale Solar Projects by Status (MW)………………………………….……..……..................... 21Status of Projects Under JNNSM Phase-II, Batch-5, CPSU Program………………................ 23Targets for Solar Projects to be Developed by the Ministry of Defense…………………....... 2350 MW Solar Projects Under Canal Top Program…………………..………….………................... 2450 MW Solar Projects Under Canal Bank Program……………………………….……………………… 24Chinese and Indian Module ASPs Q2 2017………………………………….................................... 35Average Solar Project Cost per MW…………………………..……….………………………….....…….….. 37Breakdown of Solar Project Cost per MW in India (₹ Lakh) Q2 2017....……………………..….. 37
Lowest Solar Bids in Reverse Auctions in India (₹/kWh)………………..………………….…….….. 38Indian Solar PV Imports and Exports………………………..………………….…….……………………..…. 40Country-wise Breakdown of Indian Solar Imports (%) FY2016-17……………………….…….…. 41Country-wise Breakdown of Indian Solar Exports (%) FY2016-17…………………………….…. 41India: Solar Electricity Generation (MU)………………..………………………………………………….…. 42Electricity Generation by Source in FY2016-17………………………………………….……………….…. 43India: Installed Power Capacity Mix (%)…………………………………………………..…..………….…. 43India Solar Funding and M&A Transactions (1H 2016 – 1H 2017)……………….…………….…. 45Comparison of Solar Park Charges Across Various Indian States……………………………….…. 48Detailed Analysis of Solar Park Fees in India….……………………………..………………………….…. 50Fifth Integrated Rating for State DISCOMs: Utility-wise Grades………………………………..…. 53India: Solar Cell and PV Module Manufacturing Capacity as of June 2017 (MW)..…….…. 55Amendment in Tariff for SECI 500 MW Phase-I Rooftop Tender……………….……………...…. 56Rooftop Net-Metering Policies by States and UTs………………............................................ 60Top 10 Utility-scale Project Developers with Installed Capacity (MW)……………………….…. 65Top 10 Utility-scale Project Developers with Under-development Pipeline (MW)…….…. 66Top 10 Solar Inverter Suppliers in India (Cumulative Shipments in MW)………..………….… 67Top 10 Solar Rooftop Developers and EPC Companies in India (MW)……………………….…. 68Top 10 Solar Module Manufacturers in India…………………………………………………………….…. 69Top 10 Solar Cell Manufacturers in India…………………………………..………………………..…….…. 70Top 10 Utility-scale EPC Players with Commissioned Capacity (MW)……..………………….…. 71Top 10 Utility-scale Third Party EPC Players with Commissioned Capacity (MW)……….…. 72Top 10 Solar Module Suppliers in India (Cumulative Shipments in MW)…………………….…. 73Capacity of Solar Projects Financed by Different Banks/FIs (MW)……….…………………….…. 74
www.mercomindia.com
Disclaimer/Copyright
- 13 -
© 2017 by Mercom Capital Group, llc. All rights reserved.
Ownership Rights: This report is owned by Mercom Capital Group, llc. (Mercom) and is protected by United States copyright and trademark laws and
international copyright/intellectual property laws under applicable treaties and/or conventions.
Grant of License Rights: Mercom hereby grants user a non-exclusive, non-refundable, non-transferable license to use the report or its data for research
purposes only. Mercom retains exclusive and sole ownership of the report and its data disseminated under this license agreement. User agrees not to
permit any unauthorized use, reproduction, distribution, publication or electronic transmission of any report or the information/data therein without the
express written permission of Mercom. By purchasing this report, user is prohibited from distributing the report or the data to anyone person or entity not
covered by the license agreement.
Disclaimer of Warranty and Liability: Disclaimer of Warranty and Liability: Mercom has used best efforts in collecting and preparing each report and
compiling data. Mercom owners, their employees, affiliates, agents, subsidiaries and licensors do not warrant the accuracy, completeness, correctness,
non-infringement, merchantability, or fitness for a particular purpose of reports or data. Owners, their employees, affiliates, agents, subsidiaries, or licensors
shall not be liable to User or any third party for losses or injury caused in whole or part by our negligence or contingencies beyond Mercom’s control in
compiling, preparing or disseminating Reports or Data or for any decision made or action taken by User or any third party in reliance on such information or
for any consequential, special, indirect or similar damages, even if one or more employee, owner, affiliate, agent, subsidiary, and licensor at Mercom were
advised of the possibility of the same. User agrees that the liability of Mercom, their employees, affiliates, agents, subsidiaries and licensors, if any, arising
out of any kind of legal claim (whether in contract, tort or otherwise) in connection with its goods/services under this license and sale shall not exceed the
amount User paid to Mercom for use of its reports and data. A copy of the full Terms and Conditions that you agreed to can be found at:
http://mercomcapital.com/termsandconditions.php.
www.mercomindia.com
Pricing Information
Mercom Communications India, Pvt. Ltd.S-3, Harshita Arcade No.138, First Main Road SheshadripuramBangalore- 560020t | +91.80.23560436
USA:Mercom Capital Group, llc4611 Bee Caves Road, Suite 303Austin, Texas 78746t | +1.512.215.4452
w | www.mercomindia.come | [email protected]
Purchase your copy of the report here!
Full Quarterly Report: $1,499
Annual Subscription: $3,499
Full Quarterly Report – Mercom Clients: $999
Annual Subscription – Mercom Clients: $2,499
- all reports come with an Enterprise License.