executive summary - seattle
TRANSCRIPT

ii
EXECUTIVE SUMMARY A benefit-cost analysis (BCA) was conducted for the East Marginal Way Corridor Improvement project for submission to the U.S. Department of Transportation (U.S. DOT) as a requirement of a discretionary grant application for the Better Utilizing Investments to Leverage Development (BUILD) 2020 program. The analysis was conducted in accordance with the benefit-cost methodology as recommended by the U.S. DOT in the Benefit-Cost Analysis Guidance for Discretionary Grant Programs1. The period of analysis corresponds to thirty-four years and includes four years of pre-completion and construction and thirty years of benefits, after full completion of all the identified projects is assumed to begin in May 2024.
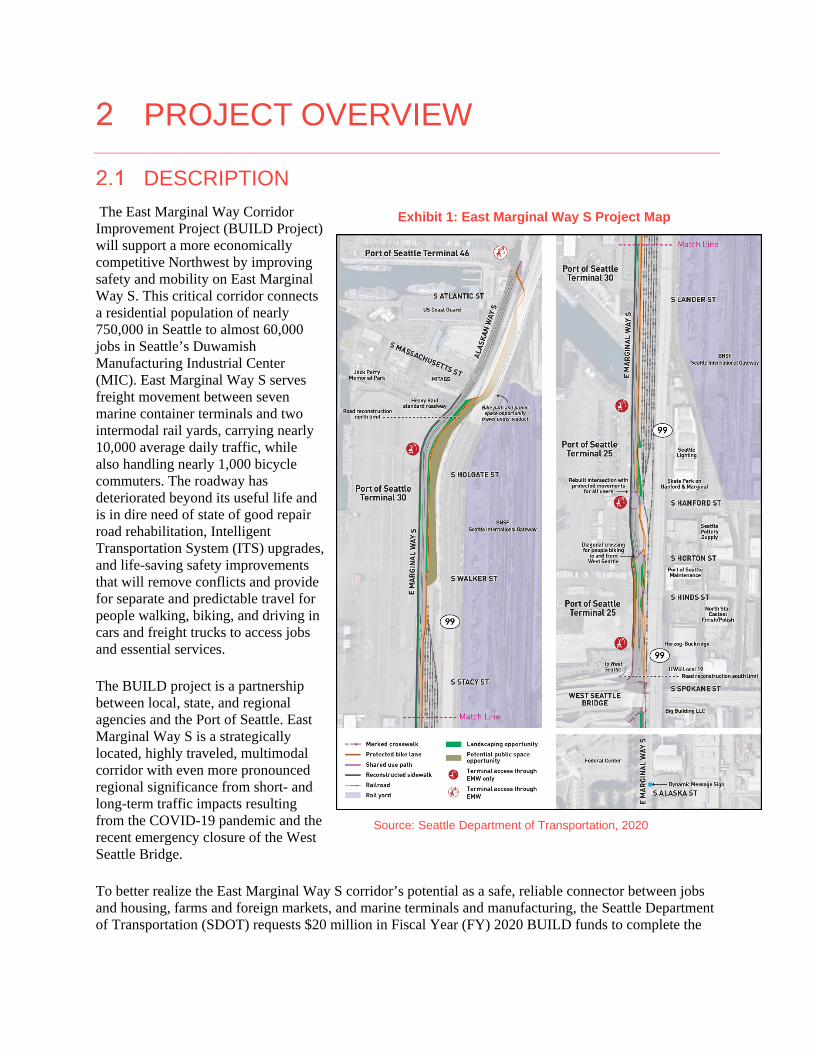
The East Marginal Way Corridor Improvement Project (BUILD Project) will support a more economically competitive Northwest by improving safety and mobility on East Marginal Way S. This critical corridor connects a residential population of nearly 750,000 in Seattle to almost 60,000 jobs in Seattle’s Duwamish Manufacturing Industrial Center (MIC). East Marginal Way S serves freight movement between seven marine container terminals and two intermodal rail yards, carrying nearly 10,000 average daily traffic, while also handling nearly 1,000 bicycle commuters. The roadway has deteriorated beyond its useful life and is in dire need of state of good repair road rehabilitation, Intelligent Transportation System (ITS) upgrades, and life-saving safety improvements that will remove conflicts and provide for separate and predictable travel for people walking, biking, and driving in cars and freight trucks to access jobs and essential services.
COVID-19 AND WEST SEATTLE BRIDGE The East Marginal Way Corridor Improvement Project has been significantly impacted by two major global and regional events:
— The COVID-19 pandemic impacting much of the world has reduced transit trips in the Seattle area by 75 percent for King County Metro, the regions largest transit provider, and freight traffic by 50 percent in the South Seattle Area on I-5, as of mid-April, 20202. When and if volumes return to previous levels is unknown at this time as there could be longer term impacts to commute trip generation. More people may continue to work from home if they are able, and changes in travel behavior as decreased commute vehicle trips will in theory provide more capacity for mode shift, specifically from transit. This could be further impacted by potential reluctance to use public transit in fear of contracting any future viruses.
— On March 24, 2020, the West Seattle Bridge was suddenly closed to vehicular traffic due to cracking, and its reopening is not expected until approximately 2022. Even if the bridge can be repaired in the near-term, it will not open until 2022. The bridge handled approximately 84,000 vehicle and 17,000 transit trips per day prior to the COVID-19 pandemic. One of the key alternative routes to the West Seattle Bridge is the lower bridge on Spokane St, which feeds directly into East Marginal Way S. Spokane St is also the location of the West Seattle Bridge bike trail, which is part of a regional bicycle route extending to communities south of Seattle. Since the closure of the bridge, bike trips
1 U.S. Department of Transportation. Benefit-Cost Analysis Guidance for Discretionary Grant Programs. January 2020. https://www.transportation.gov/sites/dot.gov/files/2020-01/benefit-cost-analysis-guidance-2020_0.pdf 2 Washington State Department of Transportation, Transportation System Performance, May 6, 2020. https://public.tableau.com/profile/washington.state.dept.transportation.tssa#!/vizhome/WSDOT_COVID-19_Transit/FrontPage_Transit

have appeared to rebound to close to 80% of pre-COVID levels compared to 23% for general vehicle trips. On weekends, bike trips have increased 110% compared with the same period in 2019.
The BUILD project is a partnership between local, state, and regional agencies and the Port of Seattle. East Marginal Way S is a strategically located, highly traveled, multimodal corridor with even more pronounced regional significance from short- and long-term traffic impacts resulting from the COVID-19 pandemic and the recent emergency closure of the West Seattle Bridge (see text box below).
To better realize the East Marginal Way S corridor’s potential as a safe, reliable connector between jobs and housing, farms and foreign markets, and marine terminals and manufacturing, the Seattle Department of Transportation (SDOT) requests $20 million in Fiscal Year (FY) 2020 BUILD funds to complete the BUILD Project. The proposed improvements would immediately address the following existing constraints:
— Reconstructing the East Marginal Way S roadway and upgrading the route to Heavy Haul Network standards along a 1.1-mile segment from a point south of S Massachusetts St to S Spokane St to enhance efficient freight flow and reduce operations and maintenance (O&M) costs for shippers and others in the supply chain
— Removing conflicts between motorists and non-motorists, and constructing a 2-way protected bike lane along a 1.4-mile segment between S Atlantic St and S Spokane St to eliminate fatalities, increase visibility, and protect the approximately 1,000 daily bicycle riders that use this corridor
— Constructing adaptive traffic signals working dynamically together using Split Cycle Offset Optimization Technique (SCOOT) technology to enhance safety and improve traffic flow at several of the City’s busiest freight intersections
— Relocating the railroad tracks at S Hanford St to provide more space between truck traffic and the bicycle facility
— Rebuilding the sidewalk on the west side of East Marginal Way S adjacent to the roadway reconstruction to provide a safe, accessible route for people walking
— Installing adequate lighting and appropriate landscaping along the corridor to improve safety and the environment
— Adding a Dynamic Message Sign (DMS) just north of S Alaska St to provide a means of informing motorists about traffic conditions and direct them to the BUILD Project corridor on East Marginal Way S
The East Marginal Way S project has the potential to transform a critical roadway that links regional and national industries with the global market and provide a safe link to thousands of vehicles and cyclists accessing jobs and recreational activities in the region.

iv
CAPITAL COSTS
The overall capital cost of the Project is expected to be $43.3 million in undiscounted 2019 dollars through 2025. The effective costs used in this BCA of $43.3 million include $1 million for prior planning and project development, $4.1 for preliminary engineering and environmental work, and $38.2 million for construction including construction closeout. The total construction period is anticipated to be four years and go through 2025 when including close out activities. Project expenses are anticipated to be incurred over the timeline shown in Table ES-1.
TABLE ES-1: Project Capital Costs by Year, in Undiscounted 2019 Dollars (Millions)
* Construction costs inclusive of: road replacement from south of S Massachusetts St to S Spokane St, upgraded traffic signals at S Hanford St, new traffic signal at S Horton St, protected bicycle lanes, SCOOT traffic management system, drainage, landscaping, lighting, sidewalk, relocation of Union Pacific rail tracks, installation of Dynamic Message Sign at S Alaska St, removal of existing facilities, construction management, engineering design, and construction contingency of 15 percent.
Source: WSP Estimates 2020
All cost values were recently developed and estimated in 2019 dollars, and deflated to 2018 dollars, consistent with BUILD BCA valuation requirements. A deflation factor of 0.9849 was applied to express 2019 values to 2018 dollars.
BENEFITS
In undiscounted 2018 dollars, the East Marginal Way S project creates benefits of $486.4 million, or $126.8 million when discounted at 7 percent and $259.5 million when discounted at 3 percent. These benefits are primarily achieved through reduction in vehicle maintenance, safety improvements, and benefits such as health associated with increased access to active transportation. Despite the potential for diversion to, and potentially from, more circuitous routes without the improvements, as a conservative approach there was no reduction in vehicle miles traveled or travel time savings assumed as a result of improving East Marginal Way S as a direct access route. Travel time savings for freight and passenger vehicles are associated to improvements in signal timing and flow of traffic as a result of signal and ITS improvements, including the SCOOT system. Cyclists are projected to experience a potential increase in travel times due to the additional intersection signalization at Horton.
Benefits from cost savings include a reduction in operating and maintenance costs attributed to the new roadway facility that will replace the existing deteriorating facility. The reduction in roadway operating costs are slightly offset by new costs for maintenance of the protected bicycle lane and additional signal and ITS components. The new roadway asset is also expected to have a residual value, after consideration of depreciation, consistent with its anticipated useful life of 50 years and assumes fully funded annual maintenance. The overall project benefit matrix can be seen in Table ES-2 with total cost savings for the 30-year benefit analysis period.
2019 $sCalendar Years Prior Years 2020 2021 2022 2023 2024 2025 TotalPlanning 1,025,000$ 1,025,000$ Design 315,000$ 2,582,500$ 877,000$ 313,500$ 4,088,000$ Construction 1,581,500$ 11,011,000$ 15,825,000$ 8,106,500$ 1,711,000$ 38,235,000$
Total 1,340,000$ 2,582,500$ 2,458,500$ 11,324,500$ 15,825,000$ 8,106,500$ 1,711,000$ 43,348,000$
PRO
JECT
ES
TIM
ATE
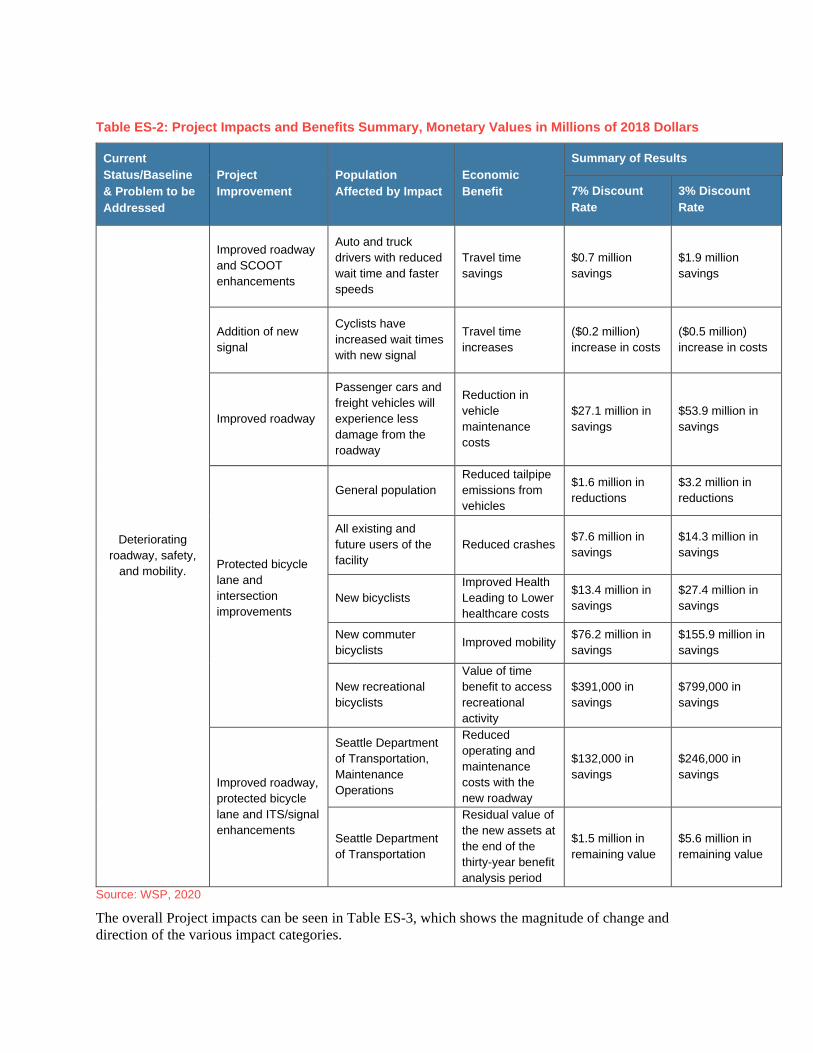
Table ES-2: Project Impacts and Benefits Summary, Monetary Values in Millions of 2018 Dollars
Current Status/Baseline & Problem to be Addressed
Project Improvement
Population Affected by Impact
Economic Benefit
Summary of Results
7% Discount Rate
3% Discount Rate
Deteriorating roadway, safety,
and mobility.
Improved roadway and SCOOT enhancements
Auto and truck drivers with reduced wait time and faster speeds
Travel time savings
$0.7 million savings
$1.9 million savings
Addition of new signal
Cyclists have increased wait times with new signal
Travel time increases
($0.2 million) increase in costs
($0.5 million) increase in costs
Improved roadway
Passenger cars and freight vehicles will experience less damage from the roadway
Reduction in vehicle maintenance costs
$27.1 million in savings
$53.9 million in savings
Protected bicycle lane and intersection improvements
General population Reduced tailpipe emissions from vehicles
$1.6 million in reductions
$3.2 million in reductions
All existing and future users of the facility
Reduced crashes $7.6 million in savings
$14.3 million in savings
New bicyclists Improved Health Leading to Lower healthcare costs
$13.4 million in savings
$27.4 million in savings
New commuter bicyclists Improved mobility $76.2 million in
savings $155.9 million in savings
New recreational bicyclists
Value of time benefit to access recreational activity
$391,000 in savings
$799,000 in savings
Improved roadway, protected bicycle lane and ITS/signal enhancements
Seattle Department of Transportation, Maintenance Operations
Reduced operating and maintenance costs with the new roadway
$132,000 in savings
$246,000 in savings
Seattle Department of Transportation
Residual value of the new assets at the end of the thirty-year benefit analysis period
$1.5 million in remaining value
$5.6 million in remaining value
Source: WSP, 2020
The overall Project impacts can be seen in Table ES-3, which shows the magnitude of change and direction of the various impact categories.

vi
Table ES-3: Project Impacts for Project, Cumulative 2020-53
Category Unit Quantity Direction Person-Hours Traveled PHT 122,906 ▼ Vehicle Miles Traveled (vehicle maintenance) VMT 194,173,804 n/a Fatalities # 2 ▼ Injury Accidents # 24 ▼ Property Damage Only (PDO) # 35 ▼ Emissions Tons 552 ▼
Annual health benefits new cyclists 10,976 (avg. new bicyclists per year
▲
Commuter Mobility Benefits - Bicyclists hours 584,663 (avg. new bicyclists hours per year)
▲
Recreational Benefits – Bicyclists new cyclists
4,090 (avg. new recreational bicyclists per year)
▲
Source: WSP, 2020
Table ES-4 below shows the overall results of the BCA. At a 7 percent discount rate, the East Marginal Way Corridor Improvement Project yields a benefit-cost ratio of 3.78 over a 34-year analysis period and using an alternative 3 percent discount rate a benefit-cost ratio of 6.76.
Table ES-4: Benefit Cost Analysis Summary Results
Scenario Net Present Value (2018 $ millions discounted to 2019) Benefit Cost Ratio
Base Case - 7 percent discount rate $93,287,236 3.78 Alternative - 3 percent discount rate $221,093,652 6.76
Source: WSP, 2020
Sensitivity tests were conducted utilizing a range of valuations for benefit categories and impacts for low and high unit values and reductions in network benefits. While the results displayed are the baseline and most likely numbers, further statistical analysis was conducted to meet the U.S. DOT’s recommendations of a thorough sensitivity analysis, and in all cases the B/C ratio remains above 1.0.

APPENDIX A
1
CONTENTS EXECUTIVE SUMMARY ........................................... II
LIST OF TABLES ...................................................... 3
INTRODUCTION ............................................. 4
BCA Framework ............................................................ 4
PRISM ............................................................................. 5
Evaluation period .......................................................... 5
PROJECT OVERVIEW ................................... 6
Description ..................................................................... 6
General Assumptions ................................................... 7
Base Case and Build Case ........................................... 9 Model Overview .................................................................................. 9 Extrapolation of Forecast Values .......................................................10 Vehicle Adjustments ..........................................................................15 Bicycle Adjustments ..........................................................................15
Analysis Tool ............................................................... 17
Overview of Benefits and costs ................................. 17
Project Costs ............................................................... 18 Capital Costs .....................................................................................18 Residual Value ..................................................................................18 Operations and Maintenance Costs ..................................................18 Repair and Rehabilitation (R&R) Costs .............................................19
Project Benefits ........................................................... 19 Travel Time Savings ..........................................................................20 Operating Cost Savings .....................................................................21
Safety ............................................................................ 21
Emissions ..................................................................... 23
Livability ....................................................................... 24

SUMMARY OF RESULTS ............................ 27
Evaluation Measures ................................................... 27
BCA Results ................................................................. 27 Results in Brief ..................................................................................27
Benefits by Category .................................................. 28
Sensitivity Testing ....................................................... 28

APPENDIX A
3
LIST OF TABLES TABLE 1: ANNUAL EXTRAPOLATION OF VEHICLE
MILES TRAVELED (VMT) AND VEHICLE HOURS TRAVELED (VHT) ........................................................... 12
TABLE 2: ANNUAL EXTRAPOLATION OF BICYCLE TRIPS ................................................ 14
TABLE 3: CUMULATIVE NEW BICYCLE USERS ....... 16 TABLE 4: PROJECT BENEFITS AND COSTS ............ 17 TABLE 5: PROJECT SCHEDULE AND COSTS, 2018
DOLLARS .......................................... 18 TABLE 6: U.S. DOT RECOMMENDED VALUES OF
TIME, 2020; (PERCENTAGE SPLIT BETWEEN PERSONAL AND BUSINESS TRAVEL) ........................ 20
TABLE 7: U.S. DOT RECOMMENDED VALUES OF TIME, 2018 $S ................................... 20
TABLE 8: INCREMENTAL OPERATING COST SAVINGS ASSUMPTIONS AND SOURCES ......................................... 21
TABLE 9: EAST MARGINAL WAY S CRASH HISTORY BETWEEN S ATLANTIC ST AND S SPOKANE STREET (2010-2020 MARCH)............................................. 22
TABLE 10: MONETIZED INJURY AND DAMAGE VALUES ............................................. 23
TABLE 18: AUTO EMISSIONS RATES (GRAMS PER VEHICLE-MILE TRAVELED) ............ 24
TABLE 20: EMISSIONS COSTS (2018 $ / SHORT TON) ........................................................... 24
TABLE 11: BENEFIT COST ANALYSIS SUMMARY RESULTS .......................................... 27
TABLE 12: PROJECT BENEFIT IMPACTS, CUMULATIVE 2024-53 ..................... 28
TABLE 13: BENEFIT COST ANALYSIS SUMMARY RESULTS FOR SENSITIVITY TESTS ........................................................... 29

INTRODUCTION A benefit-cost analysis (BCA) was conducted for the East Marginal Way Corridor Improvement Project for submission to the U.S. Department of Transportation (U.S. DOT) as a requirement of a discretionary grant application for the Better Utilizing Investments to Leverage Development (BUILD) 2020 program. The analysis was conducted in accordance with the benefit-cost methodology as recommended by the U.S. DOT in the Benefit-Cost Analysis Guidance for Discretionary Grant Programs3. The period of analysis corresponds to thirty-four years and includes four years of pre-completion and construction and thirty years of benefits, after full completion of all the identified projects is assumed to begin in May 2024.
BCA FRAMEWORK A BCA is an evaluation framework to assess the economic advantages (benefits) and disadvantages (costs) of an investment opportunity. Benefits and costs are broadly defined and are quantified in monetary terms to the extent possible. The overall goal of U.S. DOT’s BCA is to assess whether the expected benefits of a project justify the costs to inform prioritization of project applications received from across the country. A BCA framework attempts to capture the net welfare change created by a project, including cost savings and increases in welfare (benefits), as well as dis-benefits where costs can be identified (e.g., project capital costs), and welfare reductions where some groups are expected to be made worse off as a result of the proposed project.
The BCA framework involves defining a Base Case or “No Build” Case, which is compared to the “Build” Case, where the grant request is awarded, and the project is built as proposed. The BCA assesses the incremental difference between the Base Case and the Build Case, which represents the net change in welfare. BCAs are forward-looking exercises which seek to assess the incremental change in welfare over a project lifecycle. The importance of future welfare changes is determined through discounting, which is meant to reflect both the opportunity cost of capital as well as the societal preference for the present.
The analysis was conducted in accordance with the benefit-cost methodology as recommended by the U.S. DOT in the 2020 Discretionary Grant Benefit-Cost Analysis Guidance4. This methodology includes the following analytical assumptions:
— Defining existing and future conditions under a No Build base case as well as under the Build Case; — Estimating benefits and costs during project construction and operation, including up to 30 years of
operations beyond the Project completion when benefits accrue; — Using U.S. DOT recommended monetized values for reduced fatalities, injuries, property damage,
travel time savings, and emissions, while relying on best practices for monetization of other benefits; — Presenting dollar values in real 2018 dollars. In instances where cost estimates and benefits valuations
are expressed in historical dollar years, using an appropriate Consumer Price Index (CPI) to adjust the values;
3 U.S. Department of Transportation. Benefit-Cost Analysis Guidance for Discretionary Grant Programs. January 2020. https://www.transportation.gov/sites/dot.gov/files/2020-01/benefit-cost-analysis-guidance-2020_0.pdf 4 ibid

APPENDIX A
5
— Discounting future benefits and costs with real discount rates of 7 percent consistent with U.S. DOT guidance.
PRISM This benefit cost analysis was done using PRISMTM, a benefit cost analysis tool developed by WSP that uses a methodology consistent with the most recent guidelines developed by USDOT. The tool results and analysis are provided in an Excel file supporting the findings for the base case analysis with a 7 percent discount rate in the BCA Report.
EVALUATION PERIOD The East Marginal Way Corridor Improvement Project evaluation period includes the relevant engineering and design costs through 2022, construction of the project between 2021 and late April 2024, with allowances for project close out through 2025, and 30 years of operations beyond the assumed construction completion at the end of April 2024.
The construction period continues through late 2024 with operations assumed to begin the first day of May 2024. The analysis period, therefore, begins with the first expenditures, including prior expenditures, recorded in 2020 and continues through construction and 30-years of operations, or through 2053.
All benefits and costs are assumed to occur at the end of each year.
PROJECT OVERVIEW
DESCRIPTION The East Marginal Way Corridor Improvement Project (BUILD Project) will support a more economically competitive Northwest by improving safety and mobility on East Marginal Way S. This critical corridor connects a residential population of nearly 750,000 in Seattle to almost 60,000 jobs in Seattle’s Duwamish Manufacturing Industrial Center (MIC). East Marginal Way S serves freight movement between seven marine container terminals and two intermodal rail yards, carrying nearly 10,000 average daily traffic, while also handling nearly 1,000 bicycle commuters. The roadway has deteriorated beyond its useful life and is in dire need of state of good repair road rehabilitation, Intelligent Transportation System (ITS) upgrades, and life-saving safety improvements that will remove conflicts and provide for separate and predictable travel for people walking, biking, and driving in cars and freight trucks to access jobs and essential services.
The BUILD project is a partnership between local, state, and regional agencies and the Port of Seattle. East Marginal Way S is a strategically located, highly traveled, multimodal corridor with even more pronounced regional significance from short- and long-term traffic impacts resulting from the COVID-19 pandemic and the recent emergency closure of the West Seattle Bridge.
To better realize the East Marginal Way S corridor’s potential as a safe, reliable connector between jobs and housing, farms and foreign markets, and marine terminals and manufacturing, the Seattle Department of Transportation (SDOT) requests $20 million in Fiscal Year (FY) 2020 BUILD funds to complete the
Source: Seattle Department of Transportation, 2020
Exhibit 1: East Marginal Way S Project Map

APPENDIX A
7
BUILD Project. The proposed improvements would immediately address the following existing constraints:
— Reconstructing the East Marginal Way S roadway and upgrading the route to Heavy Haul Network standards along a 1.1-mile segment from a point south of S Massachusetts St to S Spokane St to enhance efficient freight flow and reduce operations and maintenance (O&M) costs for shippers and others in the supply chain
— Removing conflicts between motorists and non-motorists, and constructing a 2-way protected bike lane along a 1.4-mile segment between S Atlantic St and S Spokane St to eliminate fatalities, increase visibility, and protect the approximately 1,000 daily bicycle riders that use this corridor
— Constructing adaptive traffic signals working dynamically together using Split Cycle Offset Optimization Technique (SCOOT) technology to enhance safety and improve traffic flow at several of the City’s busiest freight intersections
— Relocating the railroad tracks at S Hanford St to provide more space between truck traffic and the bicycle facility
— Rebuilding the sidewalk on the west side of East Marginal Way S adjacent to the roadway reconstruction to provide a safe, accessible route for people walking
— Installing adequate lighting and appropriate landscaping along the corridor to improve safety and the environment
— Adding a Dynamic Message Sign (DMS) just north of S Alaska St to provide a means of informing motorists about traffic conditions and direct them to the BUILD Project corridor on East Marginal Way S
The East Marginal Way S project has the potential to transform a critical roadway that links regional and national industries with the global market and provide a safe link to thousands of vehicles and cyclists accessing jobs and recreational activities in the region.
GENERAL ASSUMPTIONS The East Marginal Way Corridor Improvement Project presents the unique opportunity to address the critical needs of both the freight and cycling community in replacing a badly deteriorating roadway with serious safety concerns. As such the analysis focuses on benefits for current users in reduced vehicle maintenance costs and improved safety, and new users, specifically bicyclists, who will use the facility as a result of the infrastructure improvements. In addition, the new signalization and implementation of a SCOOT traffic managements system will improve the flow of vehicles, specifically freight vehicles, during peak operating periods. The incremental routine maintenance costs attributed to the project improvements are projected to be lower than the projected annual maintenance requirements for the city to keep the facility operational.
The East Marginal Way Corridor Improvement Project has also been significantly impacted by both major global and regional events that influence the current vehicle traffic and bicycle trip data used to

inform the underlying forecast projections and creates a less certain outlook for future trends. Events that will impact both current and future assumptions include:
— The COVID-19 pandemic impacting much of the world has reduced transit trips in the Seattle area by 75 percent for King County Metro, the regions largest transit provider, and freight traffic by 50 percent in the South Seattle Area on I-5, as of mid-April, 20205. When and if volumes return to previous levels is unknown at this time as there could be longer term impacts to commute trip generation. More people may continue to work from home if they are able, and changes in travel behavior as decreased commute vehicle trips will in theory provide more capacity for mode shift, specifically from transit. This could be further impacted by potential reluctance to use public transit in fear of contracting any future viruses. As the impact of COVID-19 is largely unknown at the time this application was prepared, and changes will likely favor further growth in bicycle and vehicle trips which will improve the overall BCR, we assumed a conservative approach and used existing pre COVID-19 volumes as the basis for our analysis.
— On March 24, 2020, the West Seattle Bridge was suddenly closed to vehicular traffic due to cracking, and its reopening is not expected until approximately 2022. Even if the bridge can be repaired in the near-term, it will not open until 2022. The bridge handled approximately 84,000 vehicle and 17,000 transit trips per day prior to the COVID-19 pandemic. One of the key alternative routes to the West Seattle Bridge is the lower bridge on Spokane St, which feeds directly into East Marginal Way S. Spokane St is also the location of the West Seattle Bridge bike trail, which is part of a regional bicycle route extending to communities south of Seattle. Since the closure of the bridge, bike trips have appeared to rebound to close to 80% of pre-COVID levels compared to 23% for general vehicle trips. On weekends, bike trips have increased 110% compared with the same period in 20196. To account for the combined impact of COVID-19 and the closure of the West Seattle Bridge, the baseline bike trips have been adjusted to reflect a 29 percent increase in baseline trips. The increase is based on a combination of the current resiliency in trips compared to transit and vehicles, approximately 50 percent higher than baseline before COVID-19 and the West Seattle Bridge closure, and general compound average growth in bicycle trips of 2.96 percent between 2014-2019. This is a conservative assumption in the sense that part of the increase in bike trips that may have previously been associated to the East Marginal Way build scenario is now captured in the no-build baseline, reducing the incremental benefits. However, it is less conservative in the context of higher potential for crashes with the increased volume of bike trips on East Marginal Way S, combined with heavy vehicle and transit use due to diversions to SW Spokane St. and East Marginal Way S from the closed West Seattle Bridge. The increase in heavy truck and transit trips on East Marginal Way S has not been considered, as a conservative approach.
The underlying primary approach and assumptions include:
— Current trip generation, travel times, and miles traveled were derived from loop data collected in 2019-2020 with bicycle counts derived from a permanent bicycle counter on Spokane Street which feeds trips directly into East Marginal Way S and through downtown Seattle, and verified through
5 Washington State Department of Transportation, Transportation System Performance, May 6, 2020. https://public.tableau.com/profile/washington.state.dept.transportation.tssa#!/vizhome/WSDOT_COVID-19_Transit/FrontPage_Transit 6 Seattle bike counter for SW Spokane St. Bike counter (W. Seattle Bridge) as a proxy for E. Marginal Way bike trips. https://www.seattle.gov/transportation/projects-and-programs/programs/bike-program/bike-counters/spokane-bike-counters
APPENDIX A
9
quarterly video counts conducted at East Marginal Way S and S Hanford St. As indicated above an adjustment factor of 29 percent has been applied to bike trips to account for the combined impact of COVID-19 and the closure of the West Seattle Bridge.
— Forecasted vehicle trips are based on model output from the Puget Sound Regional Council, the regional Metropolitan Planning Organization, adjusted for recently announced developments by the Port of Seattle, including the transition of parts of Pier 46 at the North end of the project boundaries into a cruise ship terminal.
— Forecasted bicycle trips are based on historical annual growth from the Spokane Street bicycle counter with the adjustment for COVID-19 and the closure of the West Seattle Bridge, and incremental trip experience on other recently installed bicycle infrastructure in Seattle.
— Commuter and recreational bicycle use benefits were estimated using NCHRP guidance as stated in report 522.
— Existing safety data is derived from 10 years of data on East Marginal Way S with safety reduction benefits based on anticipated improvements from experience on other similar facilities in Seattle.
Other benefits included in the analysis have been adjusted to incorporate primarily conservative approaches and are described in more detail in the corresponding sections below.
BASE CASE AND BUILD CASE The following section summarized the methodology used to develop the underlying assumptions used as inputs in the benefit calculations.
MODEL OVERVIEW
The PSRC travel demand model was used as the basis for the no-build analysis. As described by PSRC: “For every household in the region, the model estimates how many trips are made each day, where they go, what time of day they travel, which modes they use, and which routes they follow. The relationships that are estimated for the 2010 base year are combined with future population, employment, and transportation infrastructure growth assumptions to produce future travel forecasts. The future travel forecasts are then analyzed to inform regional transportation studies and plans. The model uses Inro’s Emme software and is built entirely in the Emme macro language7.” The model considers some of the underlying port growth plan assumptions but was refined to consider recent developments in the no-build case. As a conservative assumption no additional vehicle trips are assumed in the build case, despite the improved operations of the facility and likely diversion back to East Marginal Way S from current alternative preferred routes due to the condition of the roadway on East Marginal Way S.
7 PSRC, Trip Based Modeling Methodology, 2020: https://www.psrc.org/trip-based-travel-model-4k

EXTRAPOLATION OF FORECAST VALUES
The no-build trip forecast is based on current vehicle counts on East Marginal Way S prior to evaluation of the impact from both replacement of the aging SR 99 Alaskan Way Viaduct through downtown Seattle, with a tunnel that has limited access to downtown Seattle for commuter trips, as well as the tolling of the tunnel in early November, 2019. With two months of reported data the combined impact of transitioning to the tunnel and tolling of the tunnel has resulted in an average increase in average weekday traffic on East Marginal Way S of 4.2 percent, with some weeks experiencing volume increases in excess of 12 percent. With a baseline average daily traffic volume of 9,275 vehicles per day, applying a 4.2 percent increase to account for the impacts from transitioning to the SR 99 Alaskan Way Tunnel results in a baseline 2019 vehicle volume of 9,666 per day. Furthermore, the following considerations were made in the vehicle trip forecast:
— Underlying modeling analysis provided by the Puget Sound Regional Council forecast indicates a 1.12% annual growth rate for passenger vehicles, and a 2.81% annual growth rate for trucks between 2019 and 2035.
— Improvements at Terminal 5 (T-5) are embedded in the baseline forecasts based on the Port of Seattle’s current plans. As a verified timeline is not currently available for when various operations will come online, it was assumed that by the start of operations on East Marginal Way S in 2024, T-5 will be fully operational and accounted for in the underlying growth rate.
— Improvements at Terminal 46 and Terminal 30 are treated as one facility in the Port’s Container Terminal Access Study. The forecasts assumed 1,920 trucks/day for T-30 and 1,990 trucks/day for T-46.
— Transition of parts of Terminal 46 to a Cruise Ship terminal, with the assumption of one cruise ship a day, on average, would generate approximately 2,150 passenger vehicles and 200 trucks.
— Other major investments that could impact the future use of the East Marginal Way Corridor for both vehicles and bicycles were not incorporated as not enough information is available at this time to inform forecast values
— ProLogis recently opened a three-story 590,000 square foot fulfillment center on East Marginal Way S in 2018 that is currently fully leased by Amazon. As operations are still ramping up the impact on vehicle volumes, specifically heavy freight and delivery vehicles, is unknown at this time. Excluding the impact of the ProLogis site is a conservative approach for purposes of a BCA.
— Sound Transit’s Ballard to West Seattle Link Light Rail line is anticipated to start operations in 2035 with planning only recently commencing on the project. The line is currently projected to cross over to West Seattle on a facility parallel to the West Seattle Bridge that will also cross East Marginal Way S. While the facility will have limited impact on freight vehicle volumes there is a possibility of reduced passenger vehicle trips and bicycle trips. As the impacts, either higher or lower, are difficult to estimate without the final alignment being established, they are excluded from the analysis.
— The Port of Seattle issued a Request for Proposals for redevelopment of Terminal 106 in summer 2019. This terminal is located just south of the project limits. Depending on the ultimate use of this facility, it could impact traffic volumes on East Marginal Way S, however this potential impact has been excluded from the analysis as the use is unknown at this time.
Travel time and travel distance on East Marginal Way S are generally aligned with the distance of the facility and posted speed limits as the facility has limited access points. As such the average trip length is

APPENDIX A
11
assumed to be the full length of the proposed facility at 1.3 miles with travel times based on current average speeds of 27 to 29 mph and level of service A. or free flow, in the northbound direction during peak periods and level of service B, or reasonable free flow with some restricted movement, in the southbound direction during peak periods. Backups occasionally happen during peak periods and during major events at the two major sports venues located on the North End of the facility, which include concerts, major conference/corporate events, and professional sports events, primarily the Seattle Mariners, Seattle Seahawks, and Seattle Sounders.
The level of service in the no-build case is anticipated to decline slightly in the 2035 model year but does not have a significant enough impact on traffic volumes and times to include in the underlying extrapolation assumptions. As a conservative approach for purposes of the BCA deteriorating level of service and increasing travel times has been excluded in the no-build case.
The resulting values for vehicle miles traveled (VMT) and vehicle hours traveled (VHT) are provided in Table 1 and are based on the growth rates used for the no-build scenario.

Table 1: Annual Extrapolation of Vehicle Miles Traveled (VMT) and Vehicle Hours Traveled (VHT)
Source: WSP based on baseline model results and extrapolation, 2020
For purposes of the Build case it was assumed that there would be an increase in travel times during construction and as a result of the infrastructure improvements over the long term due to the additional signal at S Horton St for safety improvements, where one does not exist today. However, the additional delay time from the new signal is anticipated to be more than offset through improved pavement conditions and timing of the signals as the result of installation of a SCOOT dynamic traffic system. Initial Synchro traffic modeling results have shown potential 30 seconds or more of travel time savings during peak operational periods. On average the analysis assumes the overall savings will be 15 seconds per vehicle as a result of the SCOOT dynamic traffic system, which when adjusted for the increase in 10 seconds per vehicle due to the additional signal and higher bicycle volumes, and therefore more frequent bicycle signals, the net result is a 5 second saving in travel times. Further travel time savings are anticipated as a result of the improved conditions of the roadway surface but as a conservative measure were not factored into the benefit-cost analysis.
During the four primary years of staging and construction between 2021 and 2024 all vehicle trips are anticipated to experience an average delay of 20 seconds. There are plans for mitigation of construction
Vehicle Miles Traveled Vehicle Hours TraveledYear Passenger Car Freight Total Passenger Car Freight Total2024 1,949,127 3,054,834 5,003,961 68,691 107,658 176,3492025 2,003,898 3,089,048 5,092,946 70,701 108,988 179,6892026 2,060,207 3,123,645 5,183,853 72,771 110,333 183,1042027 2,118,099 3,158,630 5,276,729 74,900 111,696 186,5962028 2,177,618 3,194,007 5,371,625 77,092 113,075 190,1672029 2,238,809 3,229,780 5,468,589 79,349 114,471 193,8202030 2,301,720 3,265,953 5,567,673 81,671 115,884 197,5552031 2,366,398 3,302,532 5,668,930 84,061 117,315 201,3762032 2,432,894 3,339,520 5,772,414 86,521 118,764 205,2852033 2,501,258 3,376,923 5,878,181 89,053 120,230 209,2832034 2,571,543 3,414,744 5,986,288 91,660 121,715 213,3742035 2,643,804 3,452,989 6,096,793 94,342 123,217 217,5602036 2,718,095 3,491,663 6,209,757 97,103 124,739 221,8422037 2,794,473 3,530,770 6,325,243 99,945 126,279 226,2242038 2,872,998 3,570,314 6,443,312 102,870 127,838 230,7082039 2,953,729 3,610,302 6,564,031 105,881 129,417 235,2972040 3,036,729 3,650,737 6,687,466 108,980 131,015 239,9942041 3,122,061 3,691,625 6,813,686 112,169 132,632 244,8012042 3,209,791 3,732,972 6,942,762 115,452 134,270 249,7222043 3,299,986 3,774,781 7,074,767 118,831 135,928 254,7582044 3,392,715 3,817,058 7,209,774 122,308 137,606 259,9142045 3,488,051 3,859,809 7,347,860 125,888 139,305 265,1932046 3,586,065 3,903,039 7,489,104 129,572 141,025 270,5972047 3,686,833 3,946,753 7,633,587 133,364 142,766 276,1312048 3,790,433 3,990,957 7,781,390 137,267 144,529 281,7972049 3,896,945 4,035,656 7,932,600 141,285 146,314 287,5982050 4,006,449 4,080,855 8,087,304 145,420 148,120 293,5402051 4,119,030 4,126,561 8,245,590 149,676 149,949 299,6252052 4,234,775 4,172,778 8,407,553 154,056 151,801 305,8572053 4,353,772 4,219,513 8,573,285 158,565 153,675 312,240

APPENDIX A
13
impacts through maintaining traffic in both directions during all periods of work, and reserving major directional closures for low traffic periods, in coordination with the Port of Seattle and their tenants.
Bicycle trips were calculated primarily based on existing data on facility use and anticipated growth in use as the result of the improvement informed by other similar investments in critical corridors in Seattle. A key reason for this growth in bicycle ridership through the BUILD Project is the fact that East Marginal Way S currently serves as a critical bicycle connection between significant regional destinations and fills a gap in the regional trail system, including the following:
— Between Downtown Seattle and West Seattle – East Marginal Way S carried just under 320,000 bicycle trips in 2019 connecting Downtown to West Seattle without protected bike facilities8. The combined impact from COVID-19 and closure of the West Seattle Bridge is anticipated to increase baseline bike volumes by 29 percent, a conservative approach from the approximate 50 percent adjustment currently experienced based on bicycle volumes compared to other modes.
— Between bicycle trails and facilities in the region that are currently being developed as part of the City of Seattle Bicycle Master Plan and active transportation investments outlined in the Move Seattle Plan and the Levy to Move Seattle. A major investment in Downtown Seattle will be the Portside Trail that will run along Alaskan Way as part of the City’s redevelopment of the central waterfront following the tunnel replacement of the SR 99 Viaduct. The East Marginal Way S protected bicycle lanes will largely serve as an extension of the facility from S Atlantic St to the West Seattle Bridge. The Portside Trail, anticipated to be completed in 2024, will produce a 10 percent increase in bicycle trips. The completion of the East Marginal Way S protected bicycle lanes through the BUILD Project is anticipated to increase bicycle volumes by 58 percent in the near term. The 58 percent is conservative when compared to the doubling of bicycle volumes on Westlake Ave as a result of investments in protected bicycle lanes and the over 300 percent increase in volumes on Second Ave as a result of investments and extension of the Second Ave protected bicycle lanes9.
— Between the extensive Seattle and regional bike network – At the northern limit of the BUILD Project corridor, the protected bike path will connect directly to the Portside Trail and to Downtown Seattle through the expanding Center City bike network. At the southern limit of the BUILD Project corridor, the protected bike facility will connect to a trail under the West Seattle Bridge and continue south to West Seattle and communities south of Seattle. The Project unlocks connections to the regional bike network within a 5.6-mile10 and 10-mile diameter. In particular, the BUILD Project will create new access for communities in neighboring cities, such as Tukwila, Renton, SeaTac, Burien, and Normandy Park to the south, and Mercer Island and Bellevue across the regional trail along I-90 to the east.
8 Seattle bike counter for SW Spokane St. Bike counter (W. Seattle Bridge) as a proxy for E. Marginal Way bike trips. https://www.seattle.gov/transportation/projects-and-programs/programs/bike-program/bike-counters/spokane-bike-counters 9 Westlake Protected Bicycle Lane Program, 2016. https://www.seattle.gov/transportation/projects-and-programs/programs/bicycle-program/protected-bicycle-lanes/westlake-protected-bicycle-lane Dongho Chang, Seattle Department of Transportation, 2020. https://twitter.com/dongho_chang/status/1118625428892078080?lang=en 10 The average bicycle commute trip length for people who bike from home to work in Downtown Seattle is 5.6 miles, as measured in the 2019 Seattle Center City Commute Mode Split Survey

With 16 percent of Seattle households currently not possessing a motor vehicle for their personal use, the BUILD Project will provide a safer and more attractive option for riding a bike to work along the East Marginal Way S corridor. In this way, it will provide a healthy and affordable economic lifeline to the City’s carfree residents. Providing bicycle infrastructure to all ages and abilities in parts of the City with lower car ownership will provide better transportation choice for all residents.
The increase in commuter trips is anticipated to be mostly trips diverted from transit, 85 percent, or as drivers and passengers in vehicles, 15 percent. Overall increases in trips are monetized in the BCA for purposes of health and accessibility benefits but decreases in emissions, noise, and vehicle and roadway maintenance are not quantified in the benefit cost ratio, a conservative approach. Mode shift impacts were excluded as detailed trip analysis evaluation was not conducted for non-motorized trips as part of the benefit cost analysis.
The resulting values for bicycle trips and bicycle miles traveled for the no-build and build scenarios are provided in Table 2.
Table 2: Annual Extrapolation of Bicycle Trips
Source: WSP based on bicycle counts and extrapolation, 2020
Bicycle Trips Bicycle MilesYear No-Build Build Variance No-Build Build Variance2024 462,771 802,403 339,632 601,602 1,043,124 441,5222025 472,446 835,089 362,643 614,180 1,085,616 471,4362026 482,121 867,775 385,654 626,757 1,128,107 501,3502027 491,796 900,460 408,665 639,334 1,170,598 531,2642028 501,470 933,146 431,675 651,912 1,213,089 561,1782029 511,145 965,831 454,686 664,489 1,255,581 591,0922030 520,820 998,517 477,697 677,066 1,298,072 621,0062031 530,495 1,031,202 500,707 689,644 1,340,563 650,9192032 540,170 1,063,888 523,718 702,221 1,383,054 680,8332033 549,845 1,096,573 546,729 714,798 1,425,545 710,7472034 559,520 1,129,259 569,739 727,376 1,468,037 740,6612035 569,194 1,161,945 592,750 739,953 1,510,528 770,5752036 578,869 1,194,630 615,761 752,530 1,553,019 800,4892037 588,544 1,227,316 638,771 765,107 1,595,510 830,4032038 598,219 1,260,001 661,782 777,685 1,638,002 860,3172039 607,894 1,292,687 684,793 790,262 1,680,493 890,2312040 617,569 1,325,372 707,803 802,839 1,722,984 920,1452041 627,244 1,358,058 730,814 815,417 1,765,475 950,0582042 636,919 1,390,743 753,825 827,994 1,807,966 979,9722043 646,593 1,423,429 776,836 840,571 1,850,458 1,009,8862044 656,268 1,456,114 799,846 853,149 1,892,949 1,039,8002045 665,943 1,488,800 822,857 865,726 1,935,440 1,069,7142046 675,618 1,521,486 845,868 878,303 1,977,931 1,099,6282047 685,293 1,554,171 868,878 890,881 2,020,422 1,129,5422048 694,968 1,586,857 891,889 903,458 2,062,914 1,159,4562049 704,643 1,619,542 914,900 916,035 2,105,405 1,189,3702050 714,317 1,652,228 937,910 928,613 2,147,896 1,219,2832051 723,992 1,684,913 960,921 941,190 2,190,387 1,249,1972052 733,667 1,717,599 983,932 953,767 2,232,879 1,279,1112053 743,342 1,750,284 1,006,942 966,345 2,275,370 1,309,025

APPENDIX A
15
VEHICLE ADJUSTMENTS
Underlying daily values have been extrapolated for each of the forecast years in the benefit analysis, annualization factors are applied to calculate total annual values and vehicle class are established to determine the correct value of time to apply to travel time changes as directed in DOT guidance.
Upon calculating daily vehicle miles travelled (VMT) and passenger hours travelled (PHT) values by mode annual expansion factors were applied to derive annual values. For VMT an expansion factor of 365 days was applied as the underlying average daily values account for both weekday and weekend days. For PHT a similar expansion factor of 365 days was applied with no adjustment made for passenger vehicle occupancy since this data, specific to the East Marginal Way Corridor, is not available. Travel time savings resulting from the improvement is on the conservative side since it precludes the possibility of multiple vehicle occupants.
Vehicle shares between passenger cars and trucks is based on modeled results for the facility and includes incremental adjustments for announced Port of Seattle improvements along the facility. Passenger vehicles currently make up approximately 64 percent of all vehicle trips on East Marginal Way S, with the share anticipated to decline to 55 percent with projected higher growth in freight trips anticipated through the forecast horizon. The share of freight trips includes both Port of Seattle and non-Port movements with the former representing approximately 40 percent of freight trips today and 39 percent by 2035. The slight decline in Port of Seattle trips as a share of total freight trips is the result of increased volumes of delivery trucks using East Marginal Way S as a primary connection between downtown Seattle and the warehouses and distribution centers in South Seattle.
Cruise ship operations are anticipated to commence on Terminal 46 prior to the completion of the East Marginal Way Corridor Improvement Project in 2024 and generate approximately 2,150 passenger vehicle movements and 200 freight vehicle movements per sailing.
BICYCLE ADJUSTMENTS
Daily no-build baseline bicycle trips are calculated based on reported count data and adjustments to account for the near-term impact of COVID-19 and the West Seattle Bridge closure which resulted in an upward revision of 30 percent. Furthermore, projected growth in bicycle trips is applied using historical compound average growth rates. The increase in bicycle trips as a result of installation of protected bicycle lanes is based on similar experiences on comparable facilities in Seattle. Bicycle trip data is further adjusted to estimate trips by purpose for commute and recreational purposes. Trips were divided
Exhibit 2: Observed Vehicle Share 2015
Source: Transpo Group, 2020
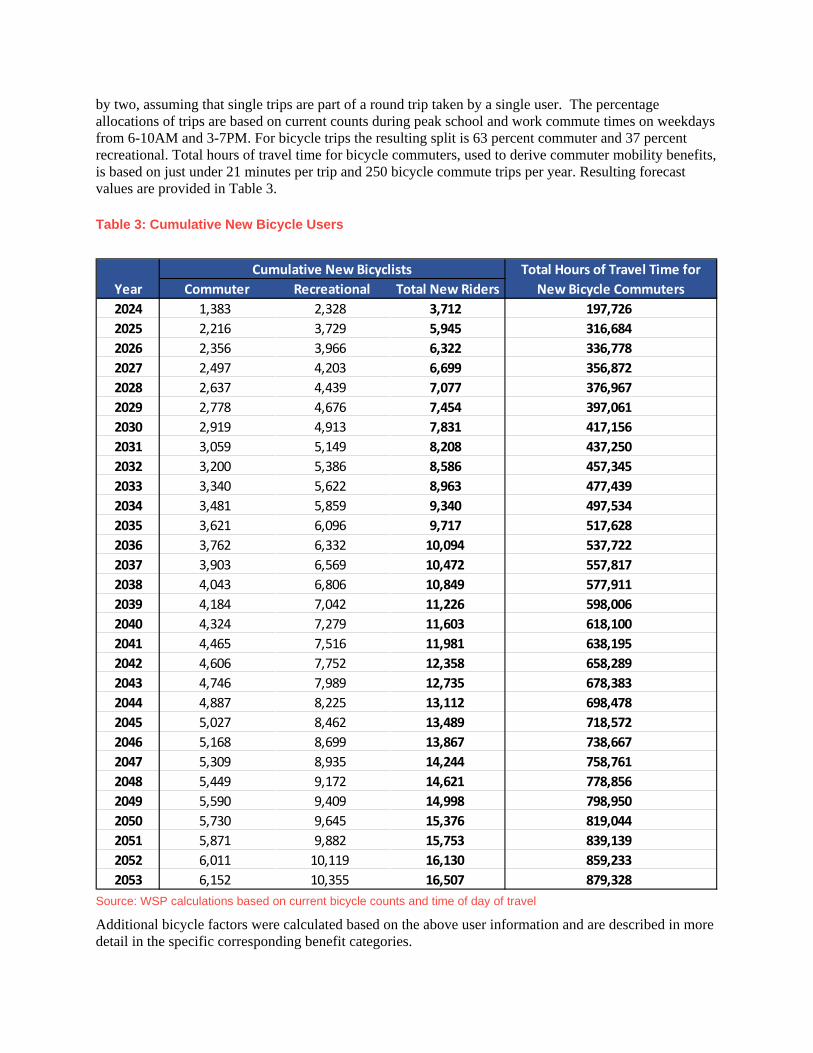
by two, assuming that single trips are part of a round trip taken by a single user. The percentage allocations of trips are based on current counts during peak school and work commute times on weekdays from 6-10AM and 3-7PM. For bicycle trips the resulting split is 63 percent commuter and 37 percent recreational. Total hours of travel time for bicycle commuters, used to derive commuter mobility benefits, is based on just under 21 minutes per trip and 250 bicycle commute trips per year. Resulting forecast values are provided in Table 3.
Table 3: Cumulative New Bicycle Users
Source: WSP calculations based on current bicycle counts and time of day of travel
Additional bicycle factors were calculated based on the above user information and are described in more detail in the specific corresponding benefit categories.
Cumulative New BicyclistsYear Commuter Recreational Total New Riders2024 1,383 2,328 3,712 197,7262025 2,216 3,729 5,945 316,6842026 2,356 3,966 6,322 336,7782027 2,497 4,203 6,699 356,8722028 2,637 4,439 7,077 376,9672029 2,778 4,676 7,454 397,0612030 2,919 4,913 7,831 417,1562031 3,059 5,149 8,208 437,2502032 3,200 5,386 8,586 457,3452033 3,340 5,622 8,963 477,4392034 3,481 5,859 9,340 497,5342035 3,621 6,096 9,717 517,6282036 3,762 6,332 10,094 537,7222037 3,903 6,569 10,472 557,8172038 4,043 6,806 10,849 577,9112039 4,184 7,042 11,226 598,0062040 4,324 7,279 11,603 618,1002041 4,465 7,516 11,981 638,1952042 4,606 7,752 12,358 658,2892043 4,746 7,989 12,735 678,3832044 4,887 8,225 13,112 698,4782045 5,027 8,462 13,489 718,5722046 5,168 8,699 13,867 738,6672047 5,309 8,935 14,244 758,7612048 5,449 9,172 14,621 778,8562049 5,590 9,409 14,998 798,9502050 5,730 9,645 15,376 819,0442051 5,871 9,882 15,753 839,1392052 6,011 10,119 16,130 859,2332053 6,152 10,355 16,507 879,328
Total Hours of Travel Time for New Bicycle Commuters

APPENDIX A
17
ANALYSIS TOOL The benefit cost analysis was supported using a Microsoft Excel-based benefit cost analysis tool with methodology consistent with the most recent guidelines developed by USDOT. The tool determined benefits according to quantifiable benefits and in addition to the base build case, are adjusted to develop a high and low scenario for evaluating a range of expected benefit-cost ratios.
OVERVIEW OF BENEFITS AND COSTS The following identifies and groups the benefits that are included in the BCA for the East Marginal Way Corridor Improvement Project. Most of these benefits occur as a result of reducing vehicle operating costs, improving safety for all users, and attracting new bicycle commuters and recreational users. The costs considered are typical for most projects: design, construction, and operations and maintenance (O&M). Table 4 provides an overview of these costs and benefits, which are further discussed in the following sections.
Table 4: Project Benefits and Costs
East Marginal Way S Corridor Improvement Project
Construction Costs
Operations and Maintenance
Repair and Rehabilitation
Residual Values
COSTS BENEFITS
MonetizedBenefit or Cost
Non-MonetizedBenefit
Facility
Categories
Travel Time Savings
Users
Fuel Savings
Reduced Vehicle O&M
Reduced Incidents
Reduced Noise
Key:
Real Estate Value
Reduced Miles Traveled
ReliabilityDesign and Engineering
Reduced Emissions

PROJECT COSTS In the benefit-cost analysis, the term “cost” refers to the additional resource costs or expenditures required to implement the investments associated with the East Marginal Way Corridor Improvement Project.
The BCA uses project costs that have been estimated for the East Marginal Way Corridor Improvement Project on an annual basis. Capital costs were initially expressed in real 2019 dollars which were deflated to 2018 dollars based on guidance provided by USDOT, using a factor of 0.98494. Residual value of the capital investments and the supporting variance in routine operations and maintenance costs are included in the benefits for purposes of the benefit-cost ratio calculation11.
CAPITAL COSTS
Initial project investment costs include engineering and design, construction, other capital investments, and contingency factors. These costs include expenditures prior to 2020 through 2024. Further construction closeout costs are assumed going into 2025. The facility is expected to be operational in 2024 with an anticipated opening date of May 1, 2024.
Table 5: Project Schedule and Costs, 2018 Dollars
Source: WSP, 2020
RESIDUAL VALUE
The remaining Capital Value of this project consists primarily of Heavy Haul road construction costs which are expected to retain their value through ongoing operations and maintenance on the facility. The total undiscounted residual value of the capital investments is estimated at $15.80 million assuming a 50-year asset life and straight-line depreciation, with a further 20-years of anticipated asset life remaining at the end of the 30-year benefit period ending in 2053.
OPERATIONS AND MAINTENANCE COSTS
The annual costs of operating and maintaining assets on East Marginal Way S are included in the analysis. Operations and maintenance activities apply to the road surface, curbs and sidewalks, protected bicycle lanes, and ITS infrastructure in the project scope. Incremental costs associated with the protected bicycle lanes and ITS infrastructure are anticipated to be more than offset by decreasing maintenance costs attributed to the currently deteriorating roadway. In addition to historic maintenance expenditures,
11 U.S. Department of Transportation. Benefit-Cost Analysis Guidance for Discretionary Grant Programs. January 2020. https://www.transportation.gov/sites/dot.gov/files/2020-01/benefit-cost-analysis-guidance-2020_0.pdf
Project Estimate 2018 $Calendar Years Prior Years 2020 2021 2022 2023 2024 2025 TotalPlanning 1,009,564$ 1,009,564$ Design 310,256$ 2,543,608$ 863,793$ 308,779$ 4,026,435$ Construction 1,557,683$ 10,845,176$ 15,586,678$ 7,984,417$ 1,685,233$ 37,659,187$
Total 1,319,820$ 2,543,608$ 2,421,475$ 11,153,955$ 15,586,678$ 7,984,417$ 1,685,233$ 42,695,186$
Stag
es
APPENDIX A
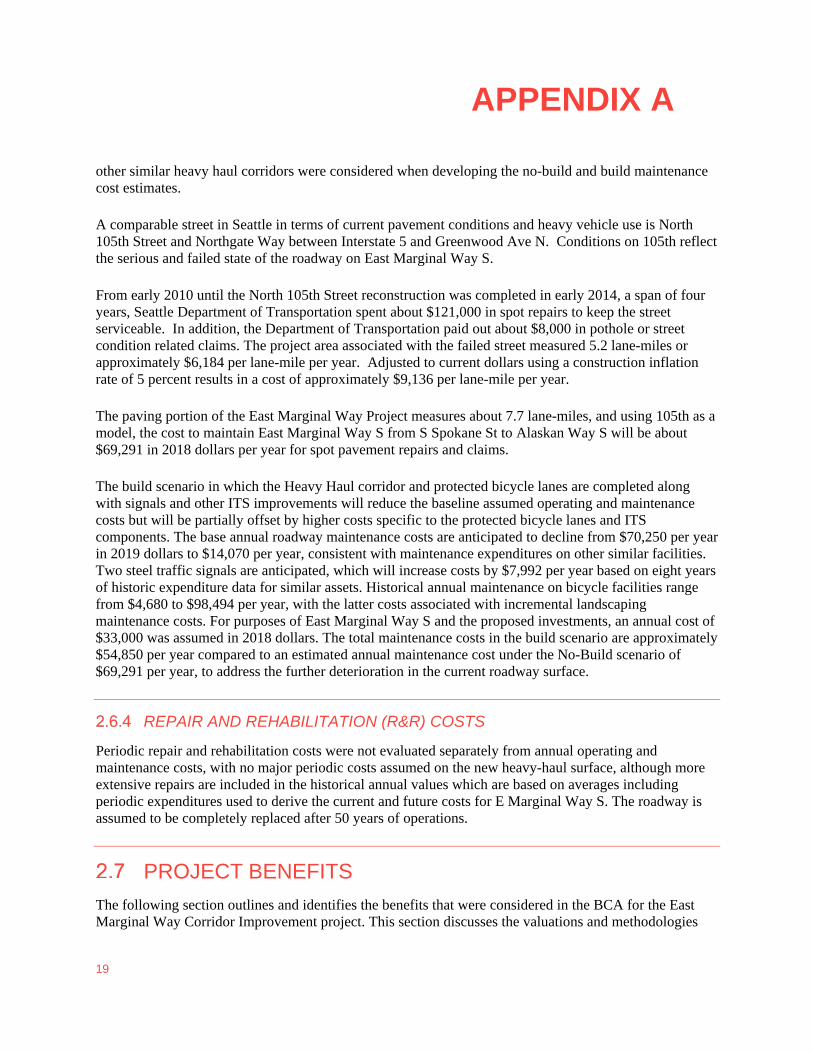
19
other similar heavy haul corridors were considered when developing the no-build and build maintenance cost estimates.
A comparable street in Seattle in terms of current pavement conditions and heavy vehicle use is North 105th Street and Northgate Way between Interstate 5 and Greenwood Ave N. Conditions on 105th reflect the serious and failed state of the roadway on East Marginal Way S.
From early 2010 until the North 105th Street reconstruction was completed in early 2014, a span of four years, Seattle Department of Transportation spent about $121,000 in spot repairs to keep the street serviceable. In addition, the Department of Transportation paid out about $8,000 in pothole or street condition related claims. The project area associated with the failed street measured 5.2 lane-miles or approximately $6,184 per lane-mile per year. Adjusted to current dollars using a construction inflation rate of 5 percent results in a cost of approximately $9,136 per lane-mile per year.
The paving portion of the East Marginal Way Project measures about 7.7 lane-miles, and using 105th as a model, the cost to maintain East Marginal Way S from S Spokane St to Alaskan Way S will be about $69,291 in 2018 dollars per year for spot pavement repairs and claims.
The build scenario in which the Heavy Haul corridor and protected bicycle lanes are completed along with signals and other ITS improvements will reduce the baseline assumed operating and maintenance costs but will be partially offset by higher costs specific to the protected bicycle lanes and ITS components. The base annual roadway maintenance costs are anticipated to decline from $70,250 per year in 2019 dollars to $14,070 per year, consistent with maintenance expenditures on other similar facilities. Two steel traffic signals are anticipated, which will increase costs by $7,992 per year based on eight years of historic expenditure data for similar assets. Historical annual maintenance on bicycle facilities range from $4,680 to $98,494 per year, with the latter costs associated with incremental landscaping maintenance costs. For purposes of East Marginal Way S and the proposed investments, an annual cost of $33,000 was assumed in 2018 dollars. The total maintenance costs in the build scenario are approximately $54,850 per year compared to an estimated annual maintenance cost under the No-Build scenario of $69,291 per year, to address the further deterioration in the current roadway surface.
REPAIR AND REHABILITATION (R&R) COSTS
Periodic repair and rehabilitation costs were not evaluated separately from annual operating and maintenance costs, with no major periodic costs assumed on the new heavy-haul surface, although more extensive repairs are included in the historical annual values which are based on averages including periodic expenditures used to derive the current and future costs for E Marginal Way S. The roadway is assumed to be completely replaced after 50 years of operations.
PROJECT BENEFITS The following section outlines and identifies the benefits that were considered in the BCA for the East Marginal Way Corridor Improvement project. This section discusses the valuations and methodologies

for each benefit category that is monetized, and a summary of the model outputs for valuations as used in the analysis.
TRAVEL TIME SAVINGS
Travel time savings includes in-vehicle travel time savings for auto drivers and passengers as well as truck drivers. For the purposes of this analysis, travel time savings for bicyclists were excluded from this analysis as limited information is available on current diversion routes from the existing facility, but increases were assumed for bicyclists due to the installation of a new signal at S Horton St. Travel time is considered a cost to users, and its value depends on the disutility that travelers attribute to time spent traveling. A reduction in travel time translates into more time available for work, leisure, or other activities.
VALUE OF TIME ASSUMPTIONS
Travel time savings must be converted from hours to dollars in order for benefits to be aggregated and compared against costs. This is performed by assuming that travel time is valued as a percentage of the average wage rate, with different percentages assigned to different trip purposes (Table 6), as recommended by U.S. DOT12.
Table 6: U.S. DOT Recommended Values of Time, 2020; (percentage split between personal and business travel)
Category Travel by Share
Local Travel Personal 88.2% Business 11.8%
Source: Office of the Secretary of Transportation, 2020.
Values of time used for 2018 are as follows:
Table 7: U.S. DOT Recommended Values of Time, 2018 $s
Category Values of time (2018 U.S $ per person-hour)
Surface (except High-Speed Rail) Personal $15.20 Business $27.10 All Purposes $16.60
Source: Office of the Secretary of Transportation, 2020
12 U.S. Department of Transportation. Benefit-Cost Analysis Guidance for Discretionary Grant Programs. January 2020. https://www.transportation.gov/sites/dot.gov/files/2020-01/benefit-cost-analysis-guidance-2020_0.pdf

APPENDIX A
21
Because the exact division between personal and business travel is not known for trips potentially impacted by this project, the values of time for “all purposes” are used; these represent a weighted average of the personal and business values of time according to national proportions of personal and business as calculated by the U.S. DOT13.
OPERATING COST SAVINGS
Vehicles have operating costs that include maintenance and repair, and replacement of tires which are affected by the quality of the roads that they are driven on. The wear and tear costs per VMT factors of these costs in terms of wear and tear on their vehicles are estimated using the Washington State Department of Transportation (WSDOT) Highway Development and Management System (HDM-4) user cost model14. The Seattle Department of Transportation (SDOT)‘s basic benefit-cost Paving Prioritization Model assumes the base automobile user cost at $0.28/mile in 2016 $’s increasing by 10 cents to $0.38/mile at pavement failure. For trucks, a user cost at $2.58/mile in 2016 $’s increasing by $2.10 to $4.68/mile at pavement failure is assumed. For purposes of the benefit cost analysis the modeled values were divided in half as a conservative approach to avoid overstating the benefits from the new road surface, and no escalation was assumed to bring the values to 2018 $’s. A further sensitivity test maintains the full modeled values. Values are shown below in Table 8 below.
Table 8: Incremental Operating Cost Savings Assumptions and Sources
Cost Category Passenger Vehicle (2018 $ / VMT)
Freight Vehicle (2018 $ / VMT)
Maintenance / Repair – Modeled $0.10 $2.10 Maintenance / Repair – Adjusted for BCA $0.05 $1.05
Source: Seattle Department of Transportation, 2020; WSP, 2020
The per VMT costs are multiplied by the total projected annual VMT by category. The VMT associated to the East Marginal Way S Corridor are based on the reductions in vehicle costs attributed to the current pavement conditions.
SAFETY
COLLISION COST SAVINGS
The BCA assumes reduced collisions will occur with the completion of the project compared to the “no build” scenario. Table 9 contains a summary of ten years of police reported crash statistics for the project area that will be improved because of the proposed project. Of the crashes, there were three that included a fatality. The total crashes from the project area amounted to 105 over the ten-year period from 2010 to 2020 year to date, or just over 10 per year. It was assumed that with the improvements crashes will
13 Ibid. 14Washington State Department of Transportation HDM-4 Model, 2004, https://www.wsdot.wa.gov/research/reports/fullreports/588.1.pdf
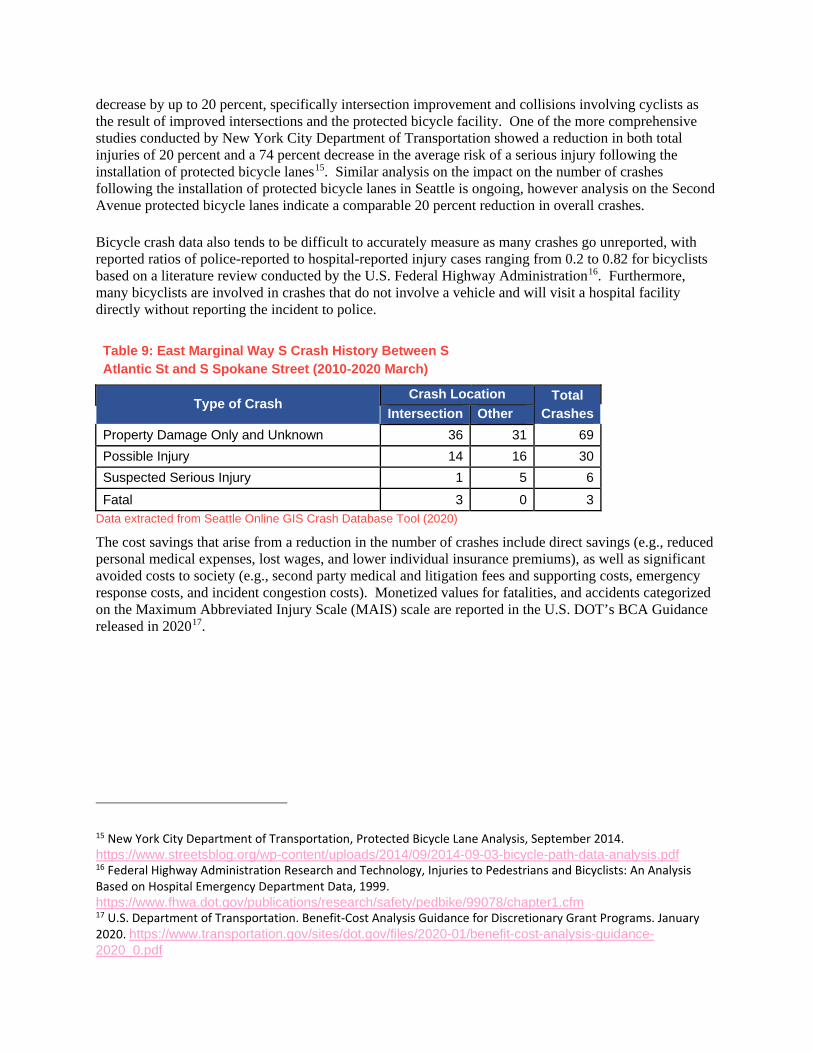
decrease by up to 20 percent, specifically intersection improvement and collisions involving cyclists as the result of improved intersections and the protected bicycle facility. One of the more comprehensive studies conducted by New York City Department of Transportation showed a reduction in both total injuries of 20 percent and a 74 percent decrease in the average risk of a serious injury following the installation of protected bicycle lanes15. Similar analysis on the impact on the number of crashes following the installation of protected bicycle lanes in Seattle is ongoing, however analysis on the Second Avenue protected bicycle lanes indicate a comparable 20 percent reduction in overall crashes.
Bicycle crash data also tends to be difficult to accurately measure as many crashes go unreported, with reported ratios of police-reported to hospital-reported injury cases ranging from 0.2 to 0.82 for bicyclists based on a literature review conducted by the U.S. Federal Highway Administration16. Furthermore, many bicyclists are involved in crashes that do not involve a vehicle and will visit a hospital facility directly without reporting the incident to police.
Table 9: East Marginal Way S Crash History Between S Atlantic St and S Spokane Street (2010-2020 March)
Type of Crash Crash Location Total
Crashes Intersection Other Property Damage Only and Unknown 36 31 69 Possible Injury 14 16 30 Suspected Serious Injury 1 5 6 Fatal 3 0 3
Data extracted from Seattle Online GIS Crash Database Tool (2020)
The cost savings that arise from a reduction in the number of crashes include direct savings (e.g., reduced personal medical expenses, lost wages, and lower individual insurance premiums), as well as significant avoided costs to society (e.g., second party medical and litigation fees and supporting costs, emergency response costs, and incident congestion costs). Monetized values for fatalities, and accidents categorized on the Maximum Abbreviated Injury Scale (MAIS) scale are reported in the U.S. DOT’s BCA Guidance released in 202017.
15 New York City Department of Transportation, Protected Bicycle Lane Analysis, September 2014. https://www.streetsblog.org/wp-content/uploads/2014/09/2014-09-03-bicycle-path-data-analysis.pdf 16 Federal Highway Administration Research and Technology, Injuries to Pedestrians and Bicyclists: An Analysis Based on Hospital Emergency Department Data, 1999. https://www.fhwa.dot.gov/publications/research/safety/pedbike/99078/chapter1.cfm 17 U.S. Department of Transportation. Benefit-Cost Analysis Guidance for Discretionary Grant Programs. January 2020. https://www.transportation.gov/sites/dot.gov/files/2020-01/benefit-cost-analysis-guidance-2020_0.pdf

APPENDIX A
23
Table 10: Monetized Injury and Damage Values
Accident Type Severity Unit Value (2018 $) Fatality Not Survivable $9,600,000 AIS 5 Critical $5,692,800 AIS 4 Severe $2,553,600 AIS 3 Serious $1,008,000 AIS 2 Moderate $451,200 AIS 1 Minor $28,800 Property Damage Only No Injury $3,200
Source: U.S. DOT, 2020 update; WSP, 2020
EMISSIONS Emissions reductions for East Marginal Way will be derived from mode shift from vehicles to bicycle trips. Of the incremental bike commute trips associated to the completion of the East Marginal Way separated bike facility, 85 percent are assumed to shift from transit and the remaining 15 percent from passenger car vehicles. An occupancy factor of 1.9 passengers per vehicle18 was assumed to convert bike trips to vehicle trip equivalents, a more conservative assumption as it assumed a reduced impact from fewer vehicles.
Per-mile emissions rates for automobiles were derived from the EPA Moves 2014B Model as recommended through the provided guidance. Per mile emissions factors differ depending on vehicle, fuel efficiency, average speed, and driving conditions. This BCA used emissions factors for vehicles based on averages of vehicle model years. It is important to note that a unique set of emissions factors exists at each speed. Thus, the emissions data set consists of emissions factors for each emissions type, by year, and by speed. For purposes of our analysis we assumed a constant 27 miles per hour over the life of the project benefits based on travel times with the new roadway improvements and SCOOT system.
18 Based on FHWA national guidance of 1.7 as the average of all vehicles as provided in April 2018 - https://www.fhwa.dot.gov/tpm/guidance/avo_factors.pdf with adjustment for higher assumed vehicle occupancy in Seattle.

Table 11: Auto Emissions Rates (grams per vehicle-mile traveled)
Emissions Type 2025 2030 2040 2050 NOX 0.0474 0.0251 0.0115 0.0105 PM 2.5 0.0030 0.0025 0.0019 0.0019 PM 10 0.0034 0.0028 0.0022 0.0021 SOX 0.0021 0.0018 0.0015 0.0015 VOC 0.0084 0.0053 0.0031 0.0029 CO2 309.9380 262.7470 230.1360 228.0820
Source: EPA MOVES 2014B; WSP, 2020
VALUE OF EMISSIONS COSTS
In order to monetize the emissions, the values of PM10, NOx, SOx, VOC, and CO2 emissions were derived from U.S. DOT BCA guidance as of January 2020. Resulting values are shown in Table 20.
Table 12: Emissions Costs (2018 $ / short ton)
Emissions Type Emissions Costs
NOX $8,600 PM $387,300 SOX $50,100 VOC $2,100 CO2 $1
Source: US DOT Guidance 2020, WSP, 2020
LIVABILITY
PHYSICAL HEALTH BENEFITS
Health benefits apply to new cyclists who would otherwise not be able to use a facility under existing conditions. These cyclists realize benefits by increased daily physical activity, which has been shown to improve the health of users and reduce future medical costs. The NCHRP Guidelines for Analysis of Investment in Bicycle Facilities19 identified ten studies which estimated the overall health benefit of increased physical activity. These benefits ranged from $19 to $1,175 per new cyclist per year, with a median value of $128 (all values in 2006 $), with detailed review available in appendix E of that document. These values were adjusted to 2018 dollars with resulting values of $155.58. The NCHRP Guidelines state that this benefit is ascribed per daily new user; since our cyclist volumes represent one-way trips, we divided the volume by two in order to estimate the number of total users. This is slightly conservative since not all bicyclists use the same route for the return trip.
19 Ibid, p. 33.

APPENDIX A
25
The benefit is thus defined:
𝐻𝐻𝐻𝐻𝐻𝐻𝐻𝐻𝐻𝐻ℎ 𝐵𝐵𝐻𝐻𝐵𝐵𝐻𝐻𝐵𝐵𝐵𝐵𝐻𝐻 =𝑏𝑏𝑛𝑛2∙ 𝐻𝐻
Where: 𝑏𝑏𝑛𝑛 = volume of daily new bicycle trips, divided by two to convert to individuals from trips 𝐻𝐻 = distribution of value of per-capita health benefit, 2018$
Health benefits have also been studied for pedestrians. However, our analysis has assumed that since there a low relative number of induced pedestrian trips as a result of the project improvements we do not ascribe any health benefit to pedestrians. This is considered a conservative approach as there will likely be pedestrians using the protected bike facility for recreational and potential commuting purposes.
COMMUTER MOBILITY BENEFITS Commute users, are non-recreational riders, experience a benefit because research has shown that bicyclists prefer using certain facilities over others, with dedicated bicycle infrastructure showing the greatest monetized value of benefit.
The NCHRP Guidelines for Analysis of Investment in Bicycle Facilities reviewed available research and found that bicycle commuters are willing to spend 20.38 extra minutes per trip20 to travel on an off-street bicycle trail for reasons including higher level of safety, more pleasant and lower stress experience, and lack of auto impacts such as road spray and exhaust fumes. These benefits can be directly applied to new commute trip bicyclists according to the following formula (modified from NCHRP Report 552):
𝐶𝐶𝐶𝐶𝐶𝐶𝐶𝐶𝐶𝐶𝐻𝐻𝐻𝐻 𝑀𝑀𝐶𝐶𝑏𝑏𝐵𝐵𝐻𝐻𝐵𝐵𝐻𝐻𝑀𝑀𝑏𝑏𝑏𝑏𝑏𝑏𝑏𝑏𝑏𝑏𝑏𝑏𝑏𝑏𝑏𝑏𝑏𝑏𝑏𝑏 = 20.38
60∙ 𝑏𝑏𝑛𝑛,𝑏𝑏 ∙ 𝑊𝑊� ∙ 5 ∙ 𝑉𝑉𝑉𝑉𝑉𝑉
Where: 20.38 60⁄ = additional value of off-road bicycle facility in minutes, converted to hours 𝑏𝑏𝑛𝑛,𝑏𝑏 = volume of daily new commute bicyclists 𝑊𝑊� = weighted average of workweeks per year 5 = number of work days per week 𝑉𝑉𝑉𝑉𝑉𝑉 = distribution of value of time, 2018$ / hr
NCHRP Report 552 Guidelines assumed 50 commute weeks per year. The value of time applied for this benefit is the same as that previously documented and used for travel time savings; that is, the values of time for local travel across all trip purposes.
20 NCHRP Report 552 (2006). Guidelines for Analysis of Investments in Bicycle Facilities, Transportation Research Board, Washington, D.C. (http://onlinepubs.trb.org/onlinepubs/nchrp/nchrp_rpt_552.pdf)

RECREATION BENEFITS The NCHRP Guidelines for Analysis of Investment in Bicycle Facilities also identified benefits for recreational users of bicycle facilities separate from the health benefits identified earlier. These benefits result from the time spent performing recreational activity, since this represents a revealed preference in how recreational cyclists choose to spend their time. This time is assumed to be one hour per bicyclist including preparation and clean-up time21. The value of time for this benefit is assumed to be lower than the value of time used for commuters or the population at large. The NCHRP Guidelines indicate a value of $10 per hour in 2006 dollars, which becomes $12.17 per hour in 2018 dollars. The benefit is computed as follows:
𝑅𝑅𝐻𝐻𝑅𝑅𝑅𝑅𝐻𝐻𝐻𝐻𝐻𝐻𝐵𝐵𝐶𝐶𝐵𝐵 𝐵𝐵𝐻𝐻𝐵𝐵𝐻𝐻𝐵𝐵𝐵𝐵𝐻𝐻 =𝑏𝑏𝑛𝑛,𝑟𝑟
2∙ 365 ∙ 𝑉𝑉𝑉𝑉𝑉𝑉𝑟𝑟
Where: 𝑏𝑏𝑛𝑛,𝑟𝑟 = volume of daily new recreational bicyclists, divided by two to convert to trips 365 = number of recreation days per year, per NCHRP Report 552 𝑉𝑉𝑉𝑉𝑉𝑉𝑟𝑟 = distribution of recreational value of time, 2018$ / hr
This benefit is only computed for bicyclists. While a similar argument may be made for recreational pedestrians, the amount of time pedestrians spend in recreational activity is unknown, so it is not monetized. It should be noted that the demand forecasting process produced trips on an average day.
21 Ibid, p. 39.

APPENDIX A
27
SUMMARY OF RESULTS
EVALUATION MEASURES The benefit-cost analysis converts potential gains (benefits) and losses (costs) from the Project into monetary units and compares them. The following common benefit-cost evaluation measures are included in this BCA:
— Net Present Value (NPV): NPV compares the net benefits (benefits minus costs) after being discounted to present values using the real discount rate assumption. The NPV provides a perspective on the overall dollar magnitude of cash flows over time in today’s dollar terms.
— Benefit Cost Ratio (BCR): The evaluation also estimates the benefit-cost ratio; the present value of incremental benefits is divided by the present value of incremental costs to yield the benefit-cost ratio. The BCR expresses the relation of discounted benefits to discounted costs as a measure of the extent to which a project’s benefits either exceed or fall short of the costs.
BCA RESULTS
RESULTS IN BRIEF
The primary benefit cost analysis assumes a 7.0 percent discount rate as prescribed by the U.S. DOT, with an alternative 3.0 percent discount rate used for comparison purposes. Baseline 2018 $ input and unit assumptions are forecasted in constant dollars and discounted to 2019 values for a horizon of 30 years following substantial construction completion in 2024. An alternative case was also evaluated with a horizon of 20 years.
For the base case analysis using a 7 percent discount rate, the proposed East Marginal Way Corridor Improvement Project investments yield a net present value of $93.3 million, and a benefit-cost ratio of 3.78.
For the alternative 3 percent discount rate approach, the proposed East Marginal Way Corridor Improvement Project yields a net present value of $221.1 million, and a benefit-cost ratio of 6.76.
Table 13: Benefit Cost Analysis Summary Results
Scenario Net Present Value (2018 $ millions discounted to 2019) Benefit Cost Ratio
Base Case - 7 percent discount rate $93,287,236 3.78 Alternative - 3 percent discount rate $221,093,652 6.76
Source: WSP, 2020

BENEFITS BY CATEGORY Over the entire analysis period, the East Marginal Way Corridor Improvement Project exhibits primary increases in reduced vehicle maintenance costs, and safety and mobility benefits.
Table 12 below outlines the changes in some of the impact categories. Some categories increased, while others decreased. Overall, the benefits are concentrated in categories including property value, reduced vehicle miles traveled, and reduced accidents.
Table 14: Project Benefit Impacts, Cumulative 2024-53
Category Unit Quantity Direction Person-Hours Traveled PHT 122,906 ▼ Vehicle Miles Traveled (vehicle maintenance) VMT 194,173,804 n/a Fatalities # 2 ▼ Injury Accidents # 24 ▼ Property Damage Only (PDO) # 35 ▼ Emissions Tons 552 ▼
Annual health benefits new cyclists 10,976 (avg. new bicyclists per year
▲
Commuter Mobility Benefits - Bicyclists hours
584,663 (avg. new bicyclists hours per year)
▲
Recreational Benefits – Bicyclists new cyclists
4,090 (avg. new recreational bicyclists per year)
▲
Source: WSP, 2020
Over the 30-year analysis period, there are $126.8 million in benefits in 7% discounted 2019 dollars or $259.5 million in benefits in 3% discounted 2019 dollars, inclusive of residual value and incremental operating and maintenance costs. In present value dollars, of the primary benefits indicated in Table 12 above, reductions related to reduced vehicle maintenance costs constitute approximately $99.0 million or 20 percent of total benefits in undiscounted dollars; mobility benefits of $343.9 million or 71 percent; and safety benefits of $24.9 million or 5 percent.
SENSITIVITY TESTING To test the robustness of the estimated NPV, and B/C ratio, the economic analysis applies sensitivity analysis simulations using the ranges of valuations discussed throughout the benefit analysis section.
In addition to the base case scenario results analysis conducted for the 7 and 3 percent discount scenarios, sensitivity tests were conducted for a 20 year benefit period, lower and higher induced bicycle ridership

APPENDIX A
29
of 20 and 40 percent respectively, and higher vehicle operating and maintenance cost reductions using the direct modeled cost results that were reduced by 50 percent in the base build case analysis.
The results are provided in Table 13 and indicate that even in the low scenarios the East Marginal Way Corridor Improvement project is anticipated to provide a high net present value and positive benefit cost ratio.
Table 15: Benefit Cost Analysis Summary Results for Sensitivity Tests
The impact of sensitivity tests for bicycle ridership didn’t result in a substantial change to the benefit cost ratio with a similar variance of plus and minus 13 percent over the base 7 percent discount rate. The more significant impact is associated to using the higher value of vehicle maintenance cost reduction as extracted from the WSDOT HDM-4 model which increased the benefit cost ratio to 3.66 in the 20-year analysis evaluation period and 4.59 in the 30-year evaluation period, or a net present value of $89.1 million and $120.4 million respectively. It is anticipated that the East Marginal Way Corridor Improvement Project will result in a final benefit-cost ratio between 2.63and 4.59 using a 7 percent discount rate.
Base Case Sensitivity Tests
20 3.02 4.65 3.41 2.63 3.66
30 3.78 6.76 4.28 3.28 4.59
Analysis Length(years)
10 percent Higher Bike Ridership
Increase
Higher Value of Vehicle Cost
Reduction7 Percent Discount
Rate3 Percent Discount
Rate
10 percent Lower Bike Ridership
Increase