executive summary · web viewin uruguay, patents are predominantly used by non-residents from the...
TRANSCRIPT

E
CDIP/13/INF/5ORIGINAL: ENGLISHDATE: MAY 5, 2014
Committee on Development and Intellectual Property (CDIP)
Thirteenth SessionGeneva, May 19 to 23, 2014
STUDY ON THE IMPACT OF INTELLECTUAL PROPERTY ON THE PHARMACEUTICAL INDUSTRY OF URUGUAY
prepared by the Secretariat
1. The Annex to this document contains a Study on the Impact of Intellectual Property on the Pharmaceutical Industry of Uruguay prepared under the Project on Intellectual Property and Socio-Economic Development (CDIP/5/7 Rev.).
2. The CDIP is invited to take note of the information contained in the Annex to this document.
[Annex follows]

CDIP/13/INF/5ANNEX
EXECUTIVE SUMMARY
The Committee on Development and Intellectual Property (CDIP) has mandated the World Intellectual Property Organization (WIPO) to conduct a project on Intellectual Property and Economic and Social Development (CDIP/5/7 Rev.). This project consists of a series of country studies that will contribute to a better understanding of the effects of intellectual property (IP) protection in developing economies, both on specific measures of economic performance and on the economic development process more broadly. The Uruguayan government requested the WIPO’s Secretariat to participate in this project as one of the country studies. This study is part of this series of country studies and focuses on the role of IP in the Uruguayan pharmaceutical sector.
IP broadly defined, and patents in particular, are used intensively in the pharmaceutical industry (Cohen, Nelson, & Walsh, 2000; Silberston & Taylor, 1973). This is also the case in developing countries (López, 2009). This is partially due to pharmaceutical R&D costs – including medical trials – which are high compared to the costs of imitating pharmaceutical compounds. However, by giving exclusion rights to the applicant, patent protection is intended in its design to alter the market structure. This is a relevant public health matter, as it implies that patients in need of certain medicines may not be able to afford the higher price of patent protected pharmaceuticals (Chaudhuri, Goldberg, & Jia, 2006). On the other hand, if patent protection secures R&D investments, the resulting medicines may reach the market earlier (Kyle & McGahan, 2011). Unfortunately, these are expected to be market-driven medicines, which means that patent protection may provide less incentives for R&D on those diseases affecting specifically poorer regions of the world (WHO-WIPO-WTO, 2013). In addition to patents, trademarks play a role in this industry, as they enable activities in branding that can serve as an alternative appropriation mechanism for R&D investments (Grabowski & Vernon, 1992).
As many other developing countries, Uruguay did not grant patent protection for pharmaceutical products before subscribing to the Trade Related Intellectual Property Rights (TRIPS) agreement. After little less than a decade, there are still concerns on how this policy change has affected the market conditions for medicines in Uruguay. It is worth noting that the changes in the IP legal framework were not the only ones likely to affect this industry. Within the last decade, Uruguay has reshaped substantially its public health system, integrating medical care institutions, health maintenance organizations and public insurance. Despite all of these changes, there are only a small number of empirical studies on the Uruguayan pharmaceutical market (e.g. CIU, 2012; COMISEC, 2006; P. Correa & Trujillo, 2005; Oddone & Failde, 2006; Uruguay XXI, 2011, among others) and considerably fewer addressing specifically the link between the IP regime and pharmaceutical market structure (e.g. COMISEC, 2006; Oddone & Failde, 2006).
CDIP/13/INF/5Annex, page 3
Scope and Methods
This study intends to complement the existing empirical evidence for Uruguay, as well as to provide a methodology and insights of interest for other countries. It engages in substantial methodological and data construction efforts to build a series of unique datasets about IP use and market conditions of the pharmaceutical industry in Uruguay. While most of the underlying data remains specific to the Uruguayan context, the methodology can be transposed to other countries with relatively little effort, which represents an additional output of this study. Despite the richness of these new data and methodologies developed, this study cannot answer all relevant questions on how the IP system affects pharmaceutical market outcomes. On the contrary, this study can be taken as a first step to trigger an empirically based discussion on how much we actually know about the impact of IP on the pharmaceutical industry in developing countries. Therefore, while we hope that this study makes an important contribution in producing new empirical evidence for the purposes of policy-making, we need to remain humble and accept that not all the questions can yet be answered.
The scope of the study is organized along two main areas, which refer to the relation of the current IP regime in Uruguay with (i) the use of the IP system and (ii) the pharmaceutical market conditions.
In order to capture patterns and trends of IP use in Uruguay, this study makes use of IP bibliographic data, particularly those from patent and trademark publications. The most relevant source for unit record IP data is the Uruguayan IP office (Dirección Nacional de la Propiedad Industrial, under the Ministerio de Industria, Energía y Minería, henceforward DNPI), who kindly granted access to their data. As such, we make use of unit records for 9,160 patent applications filed between 1995 and 2012 and 235,956 trademark applications filed between 1985 and 2012. All these were published in the Boletin de la Propiedad Industrial of DNPI. We also used additional data from the WIPO Statistics database (IPSTATS) and the EPO Worldwide Patent Statistical Database (PATSTAT).
The methodology development and data construction to analyze the pharmaceutical market conditions required substantially more effort. In particular, we make use of Farmanuario (FA), which is the most comprehensive source for medicines supplied in Uruguay. The main challenge faced when measuring the impact of IP on the pharmaceutical market structure and prices was to establish a direct link between patents and medicines. Experience has shown that establishing such a link is anything but simple, as shown in the thorough patent landscape reports on Atazanavir and Ritonavir (see WIPO, 2011a, 2011b, respectively). Indeed, fully “landscaping” patents for all the medicines sold in the Uruguayan market was out of reach for the scope of this study. As a practical alternative, this study made use of the historical data from the United States Food and Drugs Administration (FDA) publication known as the Orange Book (OB). This publication links products and their active ingredients with patents granted in the United States. We link the latter with the above mentioned Uruguayan national collection from DNPI, making use of patent family information derived from PATSTAT. Additionally, we assess the existence of a direct link between an OB product and the 3,073 products in FA with an active ingredient protected by a patent manually. Given all this, the final data panel contains 307,472 records covering 7,978 different products and 839 active ingredients over an 84 months period. These figures on products and active ingredients are in the same range as those reported by IMS Health (in Oddone & Failde, 2006, p. 14).
Another source relevant for this study’s analysis is the public procurement data compiled by the Centralized Procurement Unit (UCA) of the Uruguayan Ministry of Economy and Finance (MEF). The underlying data contain 4,856 observations, corresponding to 2,313 different items – referring to different active ingredient, dosage and route – which appear in five different calls for tenders launched in the period 2007-2012. These calls total more than 200 million US dollars of

CDIP/13/INF/5Annex, page 4
granted bids (Annex Table A - 5Table A - 5). As we did for the data from FA, the active ingredients from UCA-MEF were matched to those in the OB and its patent data information. There are 3,631 (75%) observations which have an active ingredient available in the OB.
Intensive use of the Uruguayan IP system after the IPR reform
The first part of the empirical analysis relates to the impact of the IP policy changes on the Uruguayan IP system. The TRIPS-induced changes have had a dramatic effect on patent use by the pharmaceutical industry in Uruguay. Indeed, pharmaceutical patent filings by foreign entities today account for the great majority of all patent filings. However, the pharmaceutical patenting shift has only had a seemingly minor effect on pharmaceutical market structure. Just the TRIPS adjustment of allowing patent protection for pharmaceutical compounds has completely shifted the use of the domestic IP system. Where we expected to see how much IP has affected the pharmaceutical industry, we found that this sector has reshaped the use of IP in Uruguay.
Figure E - 1: Pharmaceutical patent applications by resident and non-residents
Source: DNPI (2012), Note: Fractional counting is used for multiple applicants.

CDIP/13/INF/5Annex, page 5
In Uruguay, patents are predominantly used by non-residents from the pharmaceutical industry. Uruguayan residents filed little more than 4% of all pharmaceutical patent applications in the period 1995-2012 (Figure E - 1). The share of resident filings has decreased from 11.8% in 1995 to 2.1% in 2010. A considerable amount of the pharmaceutical filing growth took place in the period 1995-1999, when the TRIPS agreement was already in place but only in the form of the “mailbox” system.1 Of the 9,160 patent applications filed between 1995 and 2012, 6,661 (73%) relate to technical fields associated with the pharmaceutical industry. Applications in the pharmaceutical sector increased rapidly between 1995 and 2000 and outgrew other applications after 1997. In the year 2000, the Uruguayan IP office received more than twice the amount of pharmaceutical-related patent applications than for all other industries. Today, the Uruguayan DNPI receives more than three times more filings in the pharmaceutical sector than in all other sectors (Figure E - 2). Resident filings of pharmaceutical patents are scarce, as they hardly pass the amount of five applications per year.
Figure E - 2: Pharmaceutical patent applications by filing year
Source: DNPI (2012)
Figure E - 3: Country of residence of patent applicants
1 Refer to TRIPS, article 70.8.

CDIP/13/INF/5Annex, page 6
Source: DNPI (2012), Notes: Fractional counting is used for multiple applicants. US=United States, DE=Germany, FR=France, SE=Sweden, CH=Switzerland, GB=United Kingdom,
UY=Uruguay, ES=Spain, BE=Belgium, JP=Japan, and, NL=the Netherlands.
Pharmaceutical patent filings are not only mostly filed by non-residents, they are also more concentrated across origins (Figure E - 3). Applicants from the United States, Germany, France, Sweden, Switzerland and the United Kingdom accounted for 74% of all applications and 84% of pharmaceutical ones. The top 10 applicants in terms of patent filings in Uruguay are also the top applicants of pharmaceutical filings, with virtually no difference in their order. All of them are large international pharmaceutical companies and they account for two thirds of the pharmaceutical patent applications in Uruguay.
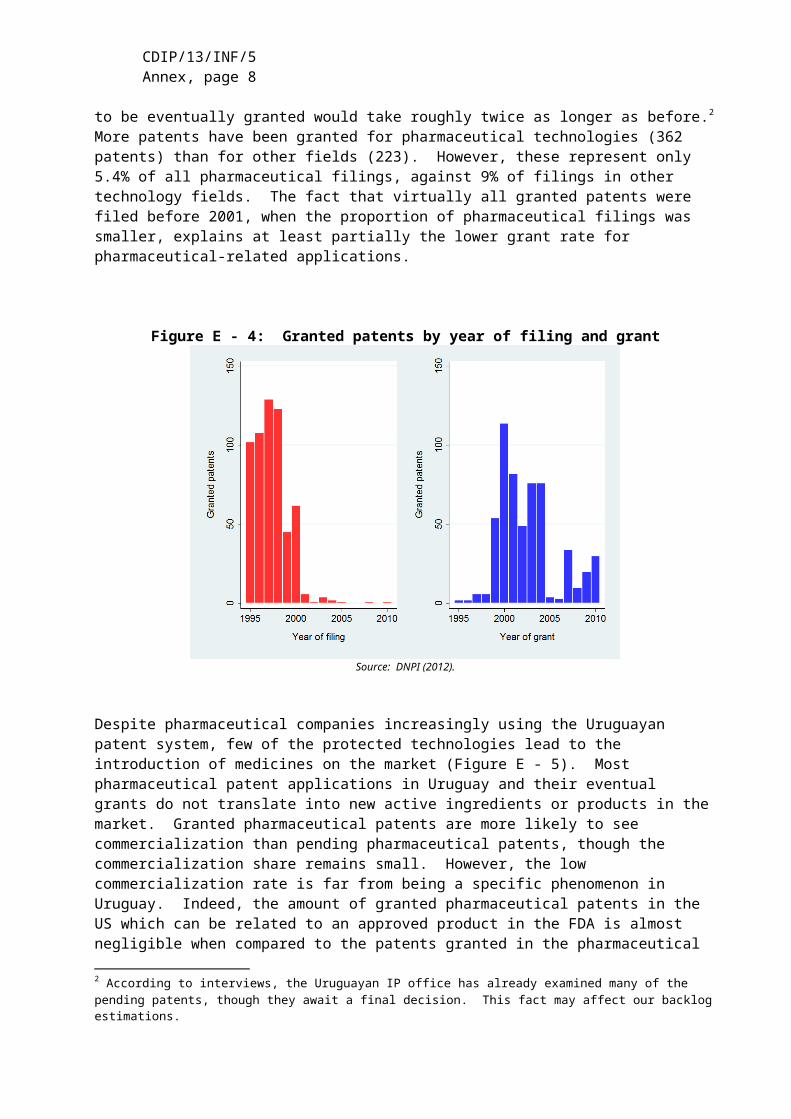
A relevant challenge for the Uruguayan IP system concerns patent pendency – the delay between the filing of a patent application and the patent office’s final decision on the application. At the time of data extraction, only 585 patents were registered as granted. This accounts for only 6.4% of all applications filed in the period 1995-2012. The average time between a patent filing and grant is about 5.5 years for the same period. This is a similar pendency time as observed in other IP offices around the world (WIPO, 2013, p. 85). There is an indication, however, that pendency has increased in more recent years. At the time of data extraction, virtually no patent filed after 2000 was registered as granted in our data (Figure E - 4). Even if many were refused or withdrawn, this still implies that those to be eventually granted would take roughly twice as longer as before.2 More patents have been granted for pharmaceutical technologies (362 patents) than for other fields (223). However, these represent only 5.4% of all pharmaceutical filings, against 9% of filings in other technology fields. The fact that virtually all granted patents were filed before 2001, when the proportion of pharmaceutical filings was smaller, explains at least partially the lower grant rate for pharmaceutical-related applications.
Figure E - 4: Granted patents by year of filing and grant
Source: DNPI (2012).
2 According to interviews, the Uruguayan IP office has already examined many of the pending patents, though they await a final decision. This fact may affect our backlog estimations.

CDIP/13/INF/5Annex, page 7
Despite pharmaceutical companies increasingly using the Uruguayan patent system, few of the protected technologies lead to the introduction of medicines on the market (Figure E - 5). Most pharmaceutical patent applications in Uruguay and their eventual grants do not translate into new active ingredients or products in the market. Granted pharmaceutical patents are more likely to see commercialization than pending pharmaceutical patents, though the commercialization share remains small. However, the low commercialization rate is far from being a specific phenomenon in Uruguay. Indeed, the amount of granted pharmaceutical patents in the US which can be related to an approved product in the FDA is almost negligible when compared to the patents granted in the pharmaceutical field. This reflects the high uncertainty of the pharmaceutical innovation process, with companies discarding many initially promising inventions before market introduction.
Figure E - 5: Pharmaceutical patents successfully introduced to the Uruguayan market
Source: Orange Book (2012) & OB historical patent data, DNPI (2012), PATSTAT (2012) and Farmanuario (2012)
As already pointed out, pharmaceutical companies do not only use patents intensively. Between 1995 and 2012, there were 33,729 trademark applications related to pharmaceutical goods (Nice class 5) in Uruguay, which represent 20.4% all filings. Pharmaceutical goods account for more trademark filings than any other product or services class (Figure E - 6). They are followed by hygiene and cosmetics related products (Nice class 3), although with not much more than half of the pharmaceutical-related filings. As a comparison, applicants in other countries also use Nice class 5 frequently, but globally it only ranks fifth and totals little less of 5% of all trademark applications (WIPO, 2013).

CDIP/13/INF/5Annex, page 8
Figure E - 6: Trademark filings by Nice classes (1995-2012)
Source: DNPI(2012). Notes: Grouping of Nice classes following Edital® (see WIPO, 2013). New applications include renewals when it is filed for the first time in that particular class.
Figure E - 7: Renewals and non-registrations by filing year
Source: DNPI (2012). Notes: Percentages are based on Single class equivalent applications (SCE). Only first filings since 1985 are considered.
Pharmaceutical companies file for more trademarks than other companies and those trademarks have a longer average life (Figure E - 7). Approximately between 80 to 90 percent of filings – either pharmaceutical or not – are registered. However, the average life-span of pharmaceutical trademarks is substantially longer than for other trademarks. For instance, a
CDIP/13/INF/5Annex, page 9
pharmaceutical trademark registration filed in 1985 remained active for more than 21 years on average, while those from other industries only lasted for 16 years.
Similar to patents, non-residents file and register the majority of trademarks in Uruguay (Figure E - 8). This is the case for both pharmaceutical and other companies. During the period 1995-2012, foreigners applied for about 70% of pharmaceutical trademarks and 60% of non-pharmaceutical ones. However, domestic pharmaceutical filings are growing faster than foreign ones.
Figure E - 8: Percentage of trademarks by origin
Source: DNPI (2012). Notes: Percentages are based on single class equivalent applications and fractional counting is used when multiple applicants.

CDIP/13/INF/5Annex, page 10
IP and pharmaceutical market conditions
The second part of the empirical analysis addresses the link between IP use and market conditions. Benefiting from the unique unit record data on medicines sold in the domestic market and their patent protection status, this study provides novel empirical evidence on market entry, concentration and prices.
Given that there are about 3.3 million inhabitants in Uruguay, the demand for medicines is small compared to other economies, including neighboring ones such as Argentina and Brazil (with 40 and 200 million, respectively). With health expenditures standing at about 8% of GDP and 618 US dollar per capita, Uruguay ranks slightly below Argentina, Brazil and Chile (Uruguay XXI, 2011). In 2012, pharmaceutical companies generated 475 million dollars in sales in Uruguay. While this market has been growing steadily for the past decade – at about 5% annually – it has been doing so more slowly than the Uruguayan economy. In 2005, the gross value added of the local production of pharmaceuticals represented 0.85% of GDP, while the shares of the meat and milk related industries, for example, were substantially higher, standing at 5.5% and 2.3%, respectively (Oddone & Failde, 2006).
Figure E - 9: Average price per unit
Source: CEFA (2013).
The distribution of medicines in Uruguay occurs through three main channels. These are (i) private drugstores and pharmacies; (ii) pharmacies under health maintenance organizations (HMOs); and, (iii) pharmacies of public hospitals (see Lalanne, 2004). The kinds of medicines purchased through these channels differ. Typically, public hospitals purchase proportionally more units for less money. Conversely, private drugstores and pharmacies represent a smaller proportion of the physical units sold and a larger one of the pecuniary sales. Interestingly, public hospitals seem to be shifting to a more expensive basket of medicines over time, as the average price paid per unit has exceeded the one being paid by HMOs since 2011 (Figure E - 9). On the supply side, there are a little more than 100 companies supplying the domestic market, with one third having 20 or more employees (Uruguay XXI, 2011).

CDIP/13/INF/5Annex, page 11
These larger companies account for roughly 90% of the employment in the industry and they consist of fully domestically-owned firms, those which have regional ownership – mostly from Argentina – and those which are subsidiaries of international companies, with each of these three groups accounting for a similar share The former two groups produce locally, but this does not exclude the sale of products fully manufactured abroad (CIU, 2012; Oddone & Failde, 2006). There is substantial use of imported inputs in the national production of medicines (Uruguay XXI, 2011). As a whole, the pharmaceutical industry does not seem to show strong signs of market concentration.
According to the final dataset, during the period 2004-2010, the average product sold in Uruguay cost 46 US dollars to the final consumer and about 30 US dollars to the retailer (see Table E - 1). On average, there are less than 5 different companies supplying a given product, which appears in 14 different varieties – i.e. different dosages, delivering routes and quantities. However, in around 12% of the cases, there is only one company supplying the active ingredient contained in the product.
Concerning IP protection, two out of three products in our dataset contain an active ingredient protected with at least one patent granted in the US. Totaling about 58.5 US dollars, the average price for these products is roughly 12 dollars higher than the overall average. Additionally, the market structure for these products does not appear to be markedly different, with numbers of varieties and competitors being close to the overall average. Patent protection in Uruguay – either sought or granted – affects a considerably lower proportion of products in the market. About 6.5% of them have an active ingredient for which patent protection has been sought in Uruguay and in roughly half of those cases (3.4%) was the patent granted. Where a patent was pending or granted, prices are substantially higher than the overall one, averaging 110 and 113 US dollars, respectively. However, the number of competitors and varieties is not substantially different.
The data assembled can shed some light on the situation within different categories of patent protection. In particular, we distinguish if patent protected active ingredients and products are associated with patents in the US only or if their protection extends to Uruguay through subsequent filings, which can be granted or not. On average, two out of three products in our dataset contain an active ingredient protected with a patent in the US. Out of these, only 15.2% correspond to the original patent protected products and 41.4% compete against these. The remaining 43.4% products also contain the patent protected active ingredient in the US but do not face competition from the original patent protected product in Uruguay (Table E - 1). Original protected products represent a larger proportion (about 25%) of those products containing active ingredients with patent protection also sought in Uruguay. However, this increase in share is not at the expense of competition, as the share of competing products also increases (52-60%). There is no unambiguous link between patent protection in Uruguay and market concentration.

CDIP/13/INF/5Annex, page 12
Table E - 1: Descriptive statistics of selected variables in final panel
Granted US Patent
Filed in Uruguay
Granted in Uruguay
Probable Expiration
observations 202,793 19,838 10,550 130,992
Variables Mean Std.Dev. Min Max Mean Mean Mean Mean
MarketPrice (current USD) 46.11 196.4 0.270 9036 58.49 109.7 112.6 56.89
Retailer markup 0.569 0.063 0.009 2.012 0.566 0.561 0.561 0.562Varieties 13.68 11.81 1.000 76.00 14.20 12.33 15.46 14.25
Competitors 4.713 2.763 1.000 14.00 4.881 4.188 4.897 4.973Monopoly 0.117 0.321 0.000 1.000 0.103 0.151 0.108 0.104
Patent protection of AIPatent granted in US 0.660 0.474 0.000 1.00 1.000 1.000 1.000 1.000
Patent filed in Uruguay 0.065 0.246 0.000 1.00 0.098 1.000 1.000 0.094Patent granted in Uruguay 0.034 0.182 0.000 1.00 0.052 0.532 1.000 0.053
First filing expired 0.426 0.494 0.000 1.000 0.646 0.624 0.663 1.000
IP & CommercializationProtected product (original ) 0.100 0.301 0.000 1.000 0.152 0.257 0.245 0.171
Competes against original 0.273 0.445 0.000 1.000 0.414 0.524 0.598 0.478Original not in market 0.286 0.452 0.000 1.000 0.434 0.219 0.157 0.351
Full sample307,472
AI patent protected
Sources: Farmanuario (2012), Orange Book (2012), DNPI(2012) and PATSTAT(2013). Notes: Only active ingredients (AIs) found in Orange Book (2012). Companies grouped whenever corporate information was available. Period 2004-2010.
Patent expiration is estimated.
A non-negligible amount of the patent protected active ingredients is likely not to be in force anymore (Figure E - 10). For about two thirds of the patent protected products (43% of all products) the earliest filing has occurred 20 or more years ago3. It can be argued that, after 20 years of the first filing for an active compound, patents would not be in force any longer.4 Moreover, some of these are likely to have expired even before due to not maintaining the patents until the end. On the other hand, other related filings – e.g. secondary use, methods, etc. – could still be in force and, in some cases, may be part of an “ever-greening” strategy (C. M. Correa, 2011). In any case, most variables are not significantly different for market segments with likely expired patent protection (Table E - 1).
Concerning the market structure, more than 40% of the active ingredients have only one supplying company. Moreover, the trend seems to be one of slightly increasing concentration. The figures for active ingredients supplied by only one company have remained relatively stable from 2004 to 2010, having seen a small increase in absolute terms and a small decrease in relative ones (Figure E - 11). However, those supplied by only two or three companies have increased in both absolute and relative terms at the expense of those supplied by four or more companies. Therefore, in 2010, three quarters of active ingredients were supplied by three or less companies.
3 We refer here to the earliest filing within the same patent family as in PATSTAT.4 This may not be the case for some patents filed in the US before the legal reforms extending the US patent term, as implemented through the Uruguay Round Agreements Act.

CDIP/13/INF/5Annex, page 13
Figure E - 10: Patent ‘age’ of protected active ingredients
Sources: Farmanuario (2012), Orange Book (2012), DNPI(2012) and PATSTAT(2013). Notes: Only patent protected active ingredients found in Orange Book (2012). Earliest filing within patent family considered.
Figure E - 11: Market concentration by Active ingredient
Source: Farmanuario (2012). Notes: Only active ingredients found in Orange Book (2012). Companies grouped whenever corporate information was available.
As expected, prices of medicines correlate negatively with product variety and competition and positively with presence of only one supplier. We observe a positive correlation between price

CDIP/13/INF/5Annex, page 14
and patent protection, regardless of where the patent was filed and if it was granted or not. However, products containing active ingredients with expired patent protection also show higher prices. Moreover, the link between market competition and patent protection is less clear, sometimes even showing a positive correlation. These are interpreted as symptom of market heterogeneity. This heterogeneity appears between groups of medicines of similar therapeutic properties, as well as within these groups.
Table E - 2: IP use & Market conditions across therapeutic classes
Price Competitors MonopolyGranted US
PatentFiled in
UruguayGranted in Uruguay Expired
Antivirals 330.90 3.2 15% 98% 33% 26% 59%Oncology 330.05 3.5 18% 77% 3% 0% 44%
Immunology 233.09 2.5 21% 81% 57% 0% 72%Endocrinology 81.12 3.4 14% 48% 5% 5% 17%
Gynecology 73.15 2.3 42% 82% 18% 4% 59%Antimycotics 64.20 4.2 29% 84% 0% 0% 72%
Haematology 59.15 3.1 18% 29% 9% 0% 24%Anesthesiology 51.64 4.1 16% 69% 1% 0% 40%
Neurology 34.40 4.1 11% 57% 6% 6% 40%Diabetes 29.51 4.4 21% 89% 9% 6% 53%
Ophthalmology 29.17 4.2 21% 77% 2% 0% 49%Pneumology 26.42 3.9 12% 41% 11% 5% 31%
Antibiotics 25.98 4.9 7% 54% 11% 0% 20%Rheumatology 22.28 4.3 17% 46% 18% 0% 40%
Dermatology 18.90 5.8 14% 49% 0% 0% 34%Psychiatry 18.90 4.9 8% 73% 14% 10% 46%
Gastroenterology 18.16 6.1 9% 67% 2% 0% 48%Nutrition 16.25 5.6 8% 41% 0% 0% 21%
Analgesics 15.55 6.1 6% 74% 0% 0% 60%Cardiovascular 15.09 5.3 6% 79% 7% 7% 53%
Antiparasitics 15.01 4.0 27% 29% 0% 0% 20%Urology 14.79 4.4 9% 89% 0% 0% 46%
Otorhinolaryngology 13.36 3.5 10% 80% 0% 0% 36%Inflammatory 13.12 5.5 8% 73% 0% 0% 48%
Allergic 8.15 5.0 6% 90% 0% 0% 68%Antiseptics 7.29 4.3 1% 2% 0% 0% 1%
Total 46.11 4.7 12% 66% 6% 3% 43%
Average AI protectedTherapeutic class
(level 1)
Sources: Farmanuario (2012), Orange Book (2012), DNPI(2012) and PATSTAT(2013). Notes: Prices in current US dollars. Therapeutic class aggregation is from Farmanuario. Only active ingredients found in Orange Book (2012).
Companies grouped whenever corporate information was available.

CDIP/13/INF/5Annex, page 15
As expected, there is a correspondence between the market structure and prices. The average price for a given active ingredient is about 123 US dollars. Active ingredients supplied by only one company see an average price substantially above this mean, around 230 dollars. Already when supplied by two or more companies, the average price is considerably below the overall mean. The picture is less evident for patent protection, where the breakdown by the number of companies does not reveal any clear differences. Similarly, the relation between patent protection and prices is not evident. Price variability within protected active ingredients as well as within those products competing with protected products can be substantial. For instance, in the first level of aggregation, the three most expensive therapeutic classes are: antivirals (average price of 331 USD), oncology (330 USD) and immunology (233 USD). More than three quarters of the products contained in them have active ingredients protected by an US patent. However, mainly antivirals and immunology have sought patent protection in Uruguay and only the former has seen some of the patents applied for granted. In the same vein, many therapeutic classes with a similar share of products containing protected active ingredients see substantially lower prices. For instance, products in the ophthalmology therapeutic class (29 USD) exhibit a similar average protection pattern than those in the oncology one, but their average prices differ ten times (see Table E - 2).
These results also extend to the public procurement UCA-MEF data (Table E - 3). In particular, there is no direct link between the bid having only one tender or not being granted and the active ingredient being protected with patents. The frequencies of winning bids as well as the allocated amounts to patent protected products stand at around 56% for those protected by patents in the US, 6% for those also filed in Uruguay and 3% for those which were granted in Uruguay. These shares are similar to the distribution we observed for the whole Uruguayan market (Table E - 1).
Table E - 3: IP use & Market prices across therapeutic classes (UCA-MEF)
Freq. Price per unit Price bid Amount bid Granted
Not granted
Only one tender
Granted US Patent
Filed in Uruguay
Granted in Uruguay
Antivirals 24 11.95 357.35 1'090'665 79% 13% 21% 100% 8% 8%Oncology 287 37.25 155.83 9'901'682 82% 17% 25% 74% 6% 2%Immunology 55 27.60 116.93 1'633'509 73% 11% 13% 96% 49% 0%Gynecology 130 52.59 54.90 4'599'653 78% 18% 36% 81% 9% 3%Endocrinology 144 40.83 44.29 4'669'233 74% 22% 25% 42% 3% 3%Rheumatology 73 12.71 29.45 1'148'149 77% 16% 29% 64% 23% 0%Nutrition 49 9.20 28.57 5'678'279 76% 24% 51% 51% 0% 0%Anesthesiology 98 13.58 24.09 5'968'319 78% 21% 27% 60% 4% 0%Haematology 118 3.23 18.88 2'613'424 78% 21% 19% 34% 4% 0%Ophthalmology 133 5.71 17.91 4'268'658 78% 20% 34% 68% 2% 0%Diabetes 77 10.07 16.93 5'310'259 96% 4% 30% 79% 10% 5%Neurology 204 1.55 13.85 8'142'447 82% 12% 25% 57% 7% 7%Antibiotics 290 4.15 12.51 20'421'912 90% 7% 26% 42% 10% 0%Antiparasitics 46 1.95 12.50 2'546'031 78% 20% 35% 24% 0% 0%Analgesics 113 1.47 12.12 3'328'989 74% 14% 27% 65% 0% 0%Pneumology 113 10.86 11.90 4'949'698 79% 11% 24% 60% 17% 9%Dermatology 108 4.13 10.89 3'209'714 76% 16% 29% 51% 0% 0%Gastroenterology 208 1.53 8.35 5'496'433 78% 14% 21% 63% 0% 0%Otorhinolaryngology 32 5.76 7.41 968'655 69% 13% 19% 69% 0% 0%Antiseptics 85 5.93 5.92 1'105'356 27% 64% 9% 52% 0% 0%Inflammatory 88 0.44 5.15 3'717'016 81% 13% 22% 64% 0% 0%Psychiatry 286 0.89 4.87 12'706'261 77% 12% 19% 48% 10% 6%Cardiovascular 370 2.28 4.66 11'088'028 78% 17% 22% 62% 6% 6%Antimycotics 17 2.36 3.93 147'742 59% 41% 12% 53% 0% 0%Urology 51 1.23 2.89 682'635 84% 16% 33% 65% 0% 0%Allergic 71 1.01 2.47 2'528'532 82% 11% 31% 70% 0% 0% Total 3631 11.21 30.17 149'527'513 79% 16% 24% 56% 6% 2%
Therapeutic class (level 1)
AI protected (%)Bid (%)Average (in USD)
Sources: UCA-MEF(2013), Farmanuario (2012), Orange Book (2012), DNPI(2012) and PATSTAT(2013). Notes: Prices in current US dollars. Therapeutic class aggregation is from Farmanuario. Only active ingredients found in Orange Book (2012).

CDIP/13/INF/5Annex, page 16
Patent protected active ingredients, as well as the products containing them, are more likely to be newer in the market. Interestingly, they are also more likely to stay in it longer. However, this does not necessarily suggest that IP favors speed-to-market, as several of these active ingredients are likely to have seen their patents expire and most of them have never sought protection in Uruguay. In that sense, the share of active ingredients and products without patent protection is slightly decreasing over time (Figure E - 12). Therefore, one can argue that, in the period 2005-2010, the amount of unprotected active ingredients and products actually increased. When considering only the patenting activity in Uruguay, the share of unprotected active ingredients and products is even larger.
Figure E - 12: Patent protection & expiration
Source: Farmanuario (2012). Notes: Only active ingredients found in Orange Book (2012).
We now turn to a multivariate analysis, where we make comparisons between products within the same therapeutic class. This implies comparing the market structure (or price) with the average market structure (or price) within the chosen level of therapeutic similarity.

CDIP/13/INF/5Annex, page 17
As expected, results from the multivariate analysis suggest a negative correlation between the proportion of patent protected products and competition, and a positive correlation with the likelihood of observing a single supplier. However, particularly for the likelihood of observing one single supplier, estimated elasticities often fail to be statistically significant. Moreover, there is no apparent stronger effect of patenting domestically – either pending or granted – when compared to just patenting abroad. In other words, estimations indicate that, on average, the entry of products protected just by patents in the US shows a similar effect as the entry of products also protected by patents in Uruguay. Moreover, patent protected active ingredients commercialized in Uruguay see higher competition when compared to therapeutically similar unprotected active ingredients (summarized in Table E - 4). This result holds regardless of where patent protection was sought. Furthermore, entry of the original patent protected product correlates with more intense competition (Table E - 4). These results appear to be at odds with theory, although they are fairly robust to any level of therapeutic similarity chosen. They implicitly suggest that the mechanism determining how patent protection affects competition might have less to do with the exclusionary use of patents than what one might expect.
Table E - 4: Effects of IP on market structure (summary)
Competition TC1 TC1 TC2 TC2 TC3 TC3 TC1 TC1 TC2 TC2 TC3 TC3Patent in US 16.5 34.3 22.4 37.9 29.8 43.0 19.9 36.6 45.1 65.8 32.4 53.2
+ Filing in Uruguay -0.1 15.6 2.6 18.5 13.1 27.3 23.3 38.5 25.1 40.4 11.5 30.1+ Patent in Uruguay 19.9 42.1 25.5 41.0 37.2 50.7 30.9 51.3 23.4 42.9 4.6 20.1
(controls for AI price) no yes no yes no yes no yes no yes no yes
Monopoly TC1 TC1 TC2 TC2 TC3 TC3 TC1 TC1 TC2 TC2 TC3 TC3Patent in US -8.7 -17.5 -10.8 -18.7 -12.7 -18.9 -7.4 -15.5 -21.4 -30.1 -16.5 -25.7
+ Filing in Uruguay -6.9 -15.9 -9.9 -19.4 -15.4 -22.9 -21.5 -28.7 -24.3 -31.8 -15.8 -25.6+ Patent in Uruguay -2.2 -12.7 -5.8 -13.5 -9.3 -15.3 -5.5 -14.5 -4.9 -14.6 15.0 6.3
(controls for AI price) no yes no yes no yes no yes no yes no yes
Original vs. Unprotected rivals Original entry
Original vs. Unprotected rivals Original entry
Moving on to price effects in the multivariate setting, the proportion of patent protected products in a given active ingredient correlates with higher prices (summarized in Table E - 5). For instance, a market segment containing only patented products will, on average, be 123% more expensive than one without any patented product. However, there is no major difference between patenting only abroad and doing it also domestically. Indeed, we frequently find a statistically significant effect only for US patenting activity, especially if the patent is still pending in Uruguay. A puzzling result is that pending filings in Uruguay virtually always correlate with a lower price spread between original and competing products than those just patented abroad. At the same time, those products also protected by a granted patent in Uruguay seem to have an equivalent – sometimes even higher – price spread with competitors. Moreover, the entry of original products seems to increase the prices of competitors as well, regardless of the patent status of products. While seemingly counterintuitive, these results are in line with those found for the competition variables. Again, they can be interpreted as patent protection being more informative of the novelty and economic relevance of certain markets segments than any negative effect they may have on competition.
Table E - 5: Effects of IP on market prices (Summary)
Price(logs) TC1 TC1 TC2 TC2 TC3 TC3 TC4 TC4 TC1 TC1 TC2 TC2 TC3 TC3Patent in US 192.9 138.8 145.0 117.2 118.6 104.0 92.1 91.6 16.2 29.5 19.9 30.5 13.0 19.2
+ Filing in Uruguay 201.7 129.5 101.9 71.6 82.3 65.1 63.4 63.0 13.2 34.4 43.1 55.5 33.9 43.3+ Patent in Uruguay 189.8 126.0 197.9 146.8 200.6 165.0 153.0 151.2 8.4 20.4 6.2 12.8 -1.4 6.7
(controls for AI competition) no yes no yes no yes no yes no yes no yes no yes
Original vs. Unprotected rivals Original entry

CDIP/13/INF/5Annex, page 18
Main conclusions
This study finds that the introduction of pharmaceutical patent protection in Uruguay has only had a seemingly minor effect on pharmaceutical market conditions. However, its effect on IP use has been substantial. As shown in the empirical analysis, since 1995 the DNPI has not only faced a substantial increase in patent filings, but also a different demand in terms of competences.
Pharmaceutical companies are not only intense users of the patent system, they also appear as the sector most frequently filing for trademark protection. Similar to patents, foreign applicants rely to a greater extent on trademark protection than domestic applicants, including in the pharmaceutical sector. However, local and regional pharmaceutical companies have increased their trademark use over time.
In respect to the market for pharmaceutical products, the analysis estimates that there is a small portion of medicines sold in Uruguay for which companies have sought patent protection (<7%). Among these, about half can be linked to a granted patent in Uruguay so far. These – either pending or granted – patents relate to medicines which are more expensive on average. However, these price differences are less apparent when we limit comparisons to medicines with similar therapeutic properties. This result suggests important differences in the underlying value of different market segments, which might also explain why companies seek patent protection. In other words, the same results may equally suggest that patent protection allows companies to charge higher prices, or that more expensive market segments may trigger (ex ante) patenting activity to appropriate rents. The multivariate regression results on patenting activity outside of Uruguay seem to give support to this latter hypothesis.
Moreover, the link between patent protection and market concentration is less straightforward than expected. Already a descriptive mapping of the pharmaceutical market by segments shows that many segments are served by only one or a few companies, regardless of the patent status of products. It seems that other factors – e.g. scale – play a bigger role in determining pharmaceutical market structure than patent rights. Again, results from the multivariate analysis not only point in the same direction, but they also suggest that in many cases the link between patent protection and concentration is more complex than theory would suggest.

CDIP/13/INF/5Annex, page 19
The Impact of Intellectual Property on the Pharmaceutical Industry of Uruguay
1. Introduction
The Committee on Development and Intellectual Property (CDIP) has mandated the WIPO Secretariat to conduct a project on Intellectual Property and Economic and Social Development (CDIP project DA_35_37_01). This project consists of a series of country studies that will contribute to a better understanding of the effects of intellectual property (IP) protection in developing economies, both on specific measures of economic performance and on the economic development process more broadly. The Uruguayan government requested the WIPO’s Secretariat to participate in this project as one of the country studies. This Study is part of this country study and focus on the role of IP in the Uruguayan pharmaceutical sector.
IP broadly defined, and patents in particular, are used intensively in the pharmaceutical industry (Cohen et al., 2000; Silberston & Taylor, 1973). This is also the case in developing countries (López, 2009). This is partially due to pharmaceutical R&D costs – including medical trials – which are high compared to the costs of imitating pharmaceutical compounds. However, by giving exclusion rights to the applicant, patent protection is intended in its design to alter the market structure. This is a relevant public health matter, as it implies that patients in need of certain medicines may not be able to afford the higher price of patent protected pharmaceuticals (Chaudhuri et al., 2006). On the other hand, if patent protection secures R&D investments, the resulting medicines may reach the market earlier (Kyle & McGahan, 2011). Unfortunately, these are expected to be market-driven medicines, which means that patent protection may provide less incentives for R&D on those diseases affecting specifically poorer regions of the world (WHO-WIPO-WTO, 2013). In addition to patents, trademarks play a role in this industry, as they enable activities in branding that can serve as an alternative appropriation mechanism for R&D investments (Grabowski & Vernon, 1992).
As many other developing countries, Uruguay did not grant patent protection for pharmaceutical products before subscribing to the Trade Related Intellectual Property Rights (TRIPS) agreement. After little less than decade, there are still concerns on how this policy change has affected the market conditions for medicines in Uruguay. It is worth noting that the changes in the IP legal framework were not the only ones likely to affect the pharmaceutical industry. Within the last decade, Uruguay has reshaped substantially its public health system, integrating medical care institutions, health maintenance organizations and public insurance. Despite all of these changes, there are only a small number of empirical studies on the Uruguayan pharmaceutical market (e.g. CIU, 2012; COMISEC, 2006; P. Correa & Trujillo, 2005; Oddone & Failde, 2006; Uruguay XXI, 2011, among others) and considerably fewer addressing specifically the link between the IP regime and pharmaceutical market structure (e.g. COMISEC, 2006; Oddone & Failde, 2006).
This Study intends to complement the existing empirical evidence for Uruguay, as well as providing a methodology and insights of interest for other countries. It engages in substantial methodological and data construction efforts to build a series of unique datasets about IP use and market conditions of the pharmaceutical industry in Uruguay. While most of the underlying data remains specific to the Uruguayan context, the methodology can be transposed to other countries with relatively little effort, which represents an additional output of this study. Despite the richness of these new data and methodologies developed, this Study cannot answer all relevant questions on how the IP system affects pharmaceutical market outcomes. On the contrary, this Study can be taken as a first step to trigger an empirically based discussion on

CDIP/13/INF/5Annex, page 20
how much we actually know about the impact of IP on the pharmaceutical industry in developing countries. The empirical analysis is carried out aiming at two main questions: The first one relates to the impact of the IP policy changes on the use of the IP system in Uruguay. While seemingly unrelated to the pharmaceutical industry, this would promptly turn to be the most observable empirical finding for it. Just the policy change of allowing patent protection for pharmaceutical compounds has completely shifted the characterization of the use of the domestic IP system, particularly the use of patent protection. Where it was expected to see how much IP has affected the pharmaceutical industry, it was actually found that this sector has changed the use of IP in Uruguay.
The second question addresses the link between IP use and market conditions. Benefiting from a unique unit record data on medicines sold in the domestic market and their patent protection status, this Study provides novel empirical evidence on market entry, concentration and prices, among others. As such, we set new empirical grounds for the debate on the role of IP in pharmaceutical industry, particularly in the context of small developing economies, such as Uruguay.
The Study is organized as follows. The following section addresses briefly the current state of the literature, as well as focusing on the existing sources relating to the specific Uruguayan context. In section 3, the scope of the study is detailed, which is delineated by the existing data sources and the methodological efforts to build new ones. Sections 4 and 5 present the main empirical results about the impact of the IP policy changes on the IP system and market conditions, respectively. Finally, the last section concludes with a summary of the empirical results putting them in context of their IP related implications.
2. Review & motivation
The role of IP on the pharmaceutical industry is of undeniable growing interest all around the world5. There is now wide consensus on the fact that IP – particularly patents – are used in the pharmaceutical sector with a higher intensity than other industries (Cockburn, 2009; Cohen et al., 2000; Levin et al., 1987; López, 2009; Mansfield, 1986; Silberston & Taylor, 1973).
Part of the explanation of such evidence relates to R&D cost being high while imitation and production ones being considerably lower in relative terms to other sectors. Arguably, if imitation costs are low, the R&D outputs from the pharmaceutical sector share characteristics of the public goods which reduces incentives for private companies to invest in R&D (Arrow, 1962). As such, patent protection is a policy response aiming to incentivize the private investments in R&D. There are many other instruments which can be (and are) used to stimulate such private investment in R&D, among others there are subsidies, prizes or tax exemptions (Gallini & Scotchmer, 2002; Scotchmer, 2004; Guellec & de La Potterie, 2007).
One particular trait of patent protection as opposed to other policy instruments is that it is a market-based promotion of private R&D. As such, society finances only the R&D costs for those successful products that are marketed; and, within these, only in relation to the amount they are being consumed (Guellec & de La Potterie, 2007; WIPO, 2011c, Chapter 2). In the context of the pharmaceutical industry, this means that only consumers of a patent protected medicine pay a higher price. It also means that the expectation of a higher price – and eventual profit – will finance indirectly the R&D expenditures related to the development of new medicines.
5 A good example of this trend is the tripartite report produced on the topic by the World Health Organization, the World Intellectual Property Organization and World Trade Organization (2013).

CDIP/13/INF/5Annex, page 21
Therefore, by policy design, patent protection implies an impact on the market structure and, consequently, on prices. This is not an irrelevant aspect in the particular case of pharmaceuticals, as it could mean that consumers in need of certain medicines cannot afford the higher price of the patent protected ones. In economic terms, this means a welfare loss represented by the portion of the demand being able to pay the competition price but not the monopoly one (Chaudhuri et al., 2006; Lanjouw, 1998). The amount of additional price paid will be related to the existence of competing medicines with equivalent therapeutic properties, as a patent may prevent competitors to use the same the molecular compound (active ingredient) but cannot exclude the use of competing molecules (Fink, 2001).
It is a documented fact that pharmaceutical firms operate in relatively concentrated markets (Malerba & Orsenigo, 2002; Demirel & Mazzucato, 2007). It is also documented that this sector “…stands out for its high accounting rate of profit…” (WHO-WIPO-WTO, 2013). However, this cannot be attributed necessarily to the existence of IP protection. For instance, there is evidence that Indian pharmaceutical markets were already oligopolies before the change of the IP regime (Watal, 2000, p. 735). Moreover, the pharmaceutical industry has been frequently found to be R&D intensive – both in terms of investments and employment – which can at least partially explain the best performance. This is the case for those operating in developed economies (Scherer, 2001), as well as in developing ones, including Uruguay (COMISEC, 2006; P. Correa & Trujillo, 2005; Uruguay XXI, 2011). There is certainly heterogeneity in these rates within the pharmaceutical sector, which could also explain price differences among medicines.
What effect on medicine prices can be expected after an IP regime change such as the implementation of TRIPs? This has been a topic of interest for many theoretical and empirical studies, particularly because many developing countries started granting protection to pharmaceutical compounds for the first time. Using India as an example, Lanjouw (1998) envisaged that for large portions of the developing world’s population this will not have any direct effect as they cannot afford the competition price nevertheless. However, he also claimed that multinational companies (MNCs) will optimize their prices globally, i.e. without taking into account any Indian specificity, which will most certainly increase prices. Other studies for the same country suggest that this will vary considerably depending on the existence of competing substitutes with similar therapeutic properties (Fink, 2000, 2001). Using a more empirical approach, Dutta (2010) estimated an average price increase of 42%, although she also found that most of it translates into consumer welfare loss with little benefit for the foreign patent holder. However, Russo and McPake (2010) have found that local markets in Mozambique are responsible for up to two-thirds of final prices of medicines in private pharmacies, which is partially explained by lack of government control and collusion among suppliers.
It is also relevant to keep in mind that, also by policy design, medicines are expected to reach the market earlier if R&D investments are secured by patent protection. This implies a welfare gain relating to the speed-to-market. According to recent evidence, this seems to work better for developed economies than developing ones (Berndt, Blalock, & Cockburn, 2011; Kyle & McGahan, 2011). Indeed, Goldberg (2010) argues that patent protection is more likely to affect access to medicines than prices in poor countries. The existence (or lack) of other policy instruments, such as data exclusivity protection, might be part of the explanation (Fink, 2011).
An additional alleged advantage relates to knowledge transfer gains under patent protection. First, the publication of the patent document itself implies a certain dissemination of technical knowledge. Second, technical and R&D cooperation is more likely to occur when the source of the knowledge perceives a lessen risk of imitation. Some of the existing studies suggest that this is not the case. For instance, Lanjouw (1998, p. 31) finds from his interviews that there is little additional benefit to be gained from pharmaceutical patents being published also in India. In a similar vein and also for India, Abrol (2004a, 2004b) has found very little evidence on

CDIP/13/INF/5Annex, page 22
technological transfer since the TRIPs adoption. Part of this has been attributed to the lack of proper innovation framework, as well as a deficient coordination between national and foreign stakeholders (Abrol, Prajapati, & Singh, 2011).
From the society standpoint, a notable disadvantage of patent protection as mechanism of promoting private R&D is that it will arguably introduce a bias in favor of potentially market-successful medicines. As it is well known, many of the global health challenges refer to diseases affecting population from poorer regions of the world, which translates in a demand for medicines with lower purchasing power (WHO-WIPO-WTO, 2013; Velásquez, 2013). It has been argued that in those cases – commonly referred as “neglected diseases” – IP may not be the best solution for providing private pharmaceutical companies with R&D incentives (Kyle & McGahan, 2011; Velásquez & Seuba, 2011). An additional concern relates to the quality of patent filings and the risk of evergreening behavior by certain applicants. This has been argued to be the case in the pharmaceutical industry, where companies have the strategy of patenting “minor changes to or derivatives of existing products (e.g. formulations, dosage forms, polymorphs, salts, etc.) in order to indirectly extend the life of the original patent over an active ingredient” (C. M. Correa, 2011, p. 14).
However, patent protection is not the only IP instrument with a say in the pharmaceutical sector. Indeed, the economic literature has found a non-negligible link between established brands and the price of medicines (Caves, Whinston, Hurwitz, Pakes, & Temin, 1991; Ching, 2010; Grabowski & Vernon, 1992). It has been shown that branded medicines maintain (or even increase) their prices after the expiration of their patent rights and entry of generic competition. This is partially explained by the strategy of keeping the branded medicine for the wealthiest segment of the demand. This practice is known as harvesting, as they benefit from previous branding investments through advertising and which are secured by trademark protection. This market segmentation is not only a trait of developed economies. Russo and McPake (2010) found evidence in Mozambique’s local markets of a low and high-cost segments. They also found that noticeable brands seem more appealing than generic ones inducing consumers to purchase less affordable drugs.
Moreover, it has been argued that there are other policy instruments which can be used as cost-containing provisions for the effects of patent protection (Velásquez, 2013; WHO-WIPO-WTO, 2013). For instance, it has been suggested that prices can be affected by price controls, although it might affect entry (Kyle, 2007) and hard to enforce in practice (Russo & McPake, 2010). If the production is done locally, an alternative is to allow for parallel imports (Ganslandt & Maskus, 2004). Conversely, governments in developing countries could attempt to (or threaten to) grant compulsory licenses under special circumstances (C. M. Correa, 2011; Velásquez, 2013). Lastly, and more on an international dimension, there is always the possibility to design incentives for differential pricing (Danzon & Towse, 2003; Lanjouw, 2005).
Uruguay’s experience Let’s now turn to the Uruguayan specific context. As in many other developing countries, Uruguay has started reshaping the existing IP legal framework when subscribing to the new round of the General Agreement on Tariffs and Trade (GATT) in the mid-nineties, particularly its chapter on Trade Related Intellectual Property Rights (TRIPS). Before this policy shift, Uruguay did not grant patent protection for pharmaceutical products. While the ratification of the GATT by Law 16.671 in December 13th, 1994 did not change this immediately, it did stipulate a mailbox provision (art. 70.8). This provision allowed the filing of patent applications based on chemical substances and products since January 1st, 1995, although without any further action until a new legislation is set up, which in accordance with TRIPS it had to happen before January 1st, 2000. Consequently, a new patent law (17.164) was passed in September 2nd,

CDIP/13/INF/5Annex, page 23
1999 allowing, among other things, patent applications based on chemical substances and products.
For the above discussed elements, these policy changes can be expected to affect the market conditions in Uruguay. Despite all this, there are not that many studies addressing specifically the link between the IP regime and pharmaceutical industry in Uruguay. There are some notable exceptions, although most of them have addressed such link as part of a broader analysis.
A probable explanation relates to these being not the only changes in the regulatory landscape which are likely to affect the pharmaceutical industry. While it is true that there were substantial adjustments to the IP regime in the late nineties, there was barely any change since then. The most noteworthy policy change has been Law 18.172 – published in September 7th, 2007 – which includes R&D and product development exceptions, following TRIPS art. 30. More importantly, during the same period, there has been a substantial amount of policy changes concerning the pharmaceutical industry from a non-IP related angle. These cover a large spectrum of elements within the Uruguay’s health system, encompassing production and commercializing of medicines, public health insurance, health maintenance organizations (HMOs), centralized public procurements and bioequivalence testing. A good example of the broad scope of these changes is law 17.930, published in December 23rd, 2005. This law, among many other things, defines and creates a National Integrated Health System, which embodies the medical care institutions, the HMOs and public insurance. It also creates a centralized public procurement unit for the purchase of medicines (UCAMAE)6. A summary of the major regulations – i.e. laws and decrees – are depicted in Table 1 and classified by their main topics7.
Table 1: List of relevant legislations for the Pharmaceutical industry
IP Provision of medicines Health System
Affecting patents & other IP1. Law 10.089 (1941-12-23)2. Law 14.549* (1976-07-29): creates
utility models3. Law 14.910* (1979-08-23): ratifies
WIPO & Paris (Stockholm) treaties4. Law 16.671 (1994-12-13):
ratifies GATT 19945. Law 17.164 (1999-09-20):
TRIPs compliant law6. Decree 304/007 (2007-08-22): creates
Inter-agency IP Group7. Law 18.172 (2007-09-07): includes
R&D & product dev. exceptions.
Affecting only trademarks8. Law 9.956 (1940-10-04)9. Law 17.011 (1998-10-07):
TRIPs compliant10. Law 17.052 (1999-01-08):
MERCOSUR compliant
Production & distribution1. Law 11.015 (1948-01-02)2. Law 11.641 (1951-04-18)3. Law 15.443* (1983-08-12): Reform4. Decree 521/984 (1984-11-22)5. Decree 252/987 (1987-05-25)6. Decree 388/994 (1994-08-31)7. Decree 324/999 (1999-10-18):
MERCOSUR compatible8. Decree 191/001 (2001-06-04): on
production in MERCOSUR9. Decree 269/007 (2007-01-12): on
importers needing local laboratories
Affecting only pharmacies10. Law 14.746* (1977-12-27)11. Law 15.703* (1985-04-16): Reform12. Decree 801/986 (1986-12-04)13. Decree S510 (2013-11-18):
Limits private concentration
HMOs & Medical care institutions1. Law 10.384* (1943-02-13)2. Law 14.164* (1974-03-14): Reform3. Law 14.407* (1975-06-31): creates
public insurance institution (ASSE)4. Law 15.181* (1981-09-02): Reform5. Law 17.548 (2002-08-27)
Public procurement6. Decree 90/000 (2000-03-13)7. Decree 428/002 (2002-11-12)
Related Bioequivalence8. Decree 318/002 (2002-08-26):
INN in prescriptions9. Decree 265/006 (2006-08-15):
Therapeutic formulary10. Decree 12/007 (2007-01-22):
Bioequivalence11. Decree 261/009 (2009-06-08 ):
Bio-availability & equivalence studies12. Decree 97/011 (2011-03-16):
testing in MERCOSUR
Law 17.930 (2005-12-23): National Integrated Health System
6 Since January 2008, UCAMAE merged with other public procurement agencies into one centralized public procurement body (UCA).7 A time sorted list is provided with more detailed information in the Annex section, Table A - 1.

CDIP/13/INF/5Annex, page 24
Notes: List not exhaustive; Approval date when publication date not found; (*) Decree-Law (Law 15.738); GATT = General Agreement on Tariffs and Trade; HMO = Health Maintenance Organization;
INN = International Nonproprietary Name; MSP = Public Health Ministry
The exact implications of IP related policies and those from non-IP ones are not easy to assess. Nevertheless, results from some of the existing studies suggest that the expected negative effects are at best not clear-cut. For instance, different reports suggest that the Uruguayan pharmaceutical production decreased substantially during the nineties, while bouncing back during the 2000s when the new IP regime was already in place (Oddone & Failde, 2006; Uruguay XXI, 2011; CIU, 2012). This increase during the 2000s has also been observed in other economic indicators for the sector, such as exports, employment, wages and productivity (CIU, 2012; Uruguay XXI, 2011). Moreover, the fall during the nineties has been attributed to the trade liberalization from the MERCOSUR process (CENES, FUNCEX, & CINVE, 2000; Oddone & Failde, 2006; Uruguay XXI, 2011). During this period, several MNCs closed their production facilities and started selling only imported medicines.
Interestingly, during this trade liberalization process, the share of imported inputs in the cost structure has been reduced by more than half, although substantially compensated by an increase in the gross operating surplus (Oddone & Failde, 2006; CENES et al., 2000). Indeed, there is evidence of an average increase of prices during the 2000s, although they remain still below the ones from other countries in the region (Uruguay XXI, 2011).
In one of the few studies directly addressing the impact of IP policy changes, Oddone and Failde (2006) produced a simulation exercise assessing the effects of the new patent law – as well as of an eventual TLC with the United states – on the pharmaceutical industry. While their results suggest a fall of about 7% in production and 6% in sales measured in current US dollars, it is worth noting that this happens over a period of more than 20 years. As a reference, due to the currency crisis, pharmaceutical sales in Uruguay have dropped 42% only from 2001 to 2002 (see Figure 26, p.58)8. Similarly, during the above mentioned MERCOSUR adjustment process in the nineties, the pharmaceutical production has dropped more than 40% with respect to 1982’s production (CENES et al., 2000; Oddone & Failde, 2006). However, other sources argued that such agreement would be detrimental to the national pharmaceutical sector as well as for the public health system (see COMISEC, 2006).
3. Scope of the study and data construction
The current state of the literature depicted in the previous section, as well as the relevant policy questions applicable to the Uruguayan context, are the landmarks that delimit the scope of the current Study. Unfortunately, while it intends to shed some light on the main open questions, it is not possible to answer all of them due to many confluent reasons. One of the most relevant amongst these has been the data constraints faced.
This section illustrates which of these questions can be tackled with existing data sources, including the significant efforts on data construction that were carried to build new ones. It also points to those relevant issues identified in the previous section that this study cannot intend to answer with the current state of the data sources. While this study has signified a huge leap forward in terms of producing new empirical evidence for the purposes of policy-making related to IP and pharmaceutical industry, we need to remain humble and accept that not all the questions can yet be answered. Nevertheless, any unanswered matter should be taken as research agenda for future work, as well as triggers for discussion of how much we actually know about the impact of IP in the pharmaceutical industry in general.
8 This is also measured in US current dollars, in PPP terms the drop was about 17%.

CDIP/13/INF/5Annex, page 25
The scope of the study is organized along two main areas, which refer to the relation of the current IP regime in Uruguay with (i) the use of the IP system and (ii) the pharmaceutical market conditions. The methods and data employed to assess these are explored as follows.
Measuring the impact on the use of the national IP system
This Study measures the impact of the IPR changes through the analysis of IP bibliographic data, particularly those from patents and trademarks publications. The most relevant source for unit record on IP data is the Uruguayan IP office (Dirección Nacional de la Propiedad Industrial, under the Ministerio de Industria, Energía y Minería, henceforward DNPI), who kindly gave us access to their data. We make use of unit records for 9,160 patent applications field between 1995 and 2012 and those of 235,956 trademark applications filed between 1985 and 2012. Eventually, all these were published in the Boletin de la Propiedad Industrial from DNPI.
It is worth noting that the figures for 2011 and 2012 might suffer from truncation due to the typical time-to-publication delay – particularly for patents, which is about 18 months – and other administrative and procedural lags. Therefore, when considered appropriated, we report just until 2010. Concerning the trademark records, we focus mostly on the 165,568 filings from 1995 onwards.
In order to characterize the sector and Uruguay’s aggregate IP figures with respect to other countries and regions in the world, we also make use of complementary data from the WIPO Statistics database (IPSTATS). Additionally, we source information from patent families from EPO Worldwide Patent Statistical Database (PATSTAT), although this is more relevant for the other sections while less used in the analysis of Uruguayan IP system.
The distinction of IP related to the pharmaceutical industry is not a straight forward task. Concerning patents, this study relies on WIPO’s IPC-Technology concordance table which links the symbols of the International Patent Classification (IPC) with 35 fields of technology9. We group the following fields of WIPO’s classification into what is referred to hereafter as Pharmaceutical related technologies or simply pharmaceutical filings: pharmaceuticals (field 16), organic fine chemistry (14) and biotechnology (15). When a random sample of patent filings was screened manually, we observed that most of them are clearly pharmaceutical related technologies, although some of them with a veterinary application. This is not surprising given the importance of the agricultural sector in the Uruguayan economy. In any case, these represent three out of the top five technological fields in terms of patent filings in Uruguay (see Figure 4, in p.35).
This approach has the explicit limitation of relying on the categorization of patent documents only with IPC symbols. This does not allow us, for instance, to distinguish between first use and secondary patents (see C. M. Correa, 2011). An alternative is to analyze the patent document’s full-text or at least claims in order to determine the pharmaceutical related technologies. Unfortunately, the former was not available in digital form and the latter only for small sample of the patent documents (and in Spanish only). Until a better coverage of any of these fields is available, the IPC remains the most reliable possibility.
Concerning trademarks, we consider as pharmaceutical related trademarks those under the Nice Class 5. This class is defined as goods related with Pharmaceutical and veterinary preparations; sanitary preparations for medical purposes; dietetic food and substances adapted for medical or veterinary use, food for babies; dietary supplements for humans and animals;
9 IPC technology concordance table can be found here http://www.wipo.int/ipstats/en/statistics/technology_concordance.html. For more information on the IPC please refer to http://www.wipo.int/classifications/ipc/en/.

CDIP/13/INF/5Annex, page 26
plasters, materials for dressings; material for stopping teeth, dental wax; disinfectants; preparations for destroying vermin; fungicides, herbicides. 10
It is worth remarking that a given trademark application may refer to different uses, which are reflected by requesting trademark protection in more than one Nice class. For this reason, it is often useful to compute trademarks filings per Nice class (see e.g. Figure 18, right panel). In other words, the 235,956 trademark applications filed in Uruguay during 1985-2012 are equivalent to 450,370 “single class” applications (and those 165,568 applications since 1995 to 272,169). We will refer to them as single-class equivalent (SCE) applications during the analysis.
One interesting aspect to analyze of the IPR changes related to TRIPs concerns the Mailbox provision (TRIPS, art. 70.8). Unfortunately, the original patent data do not contain any direct indication of such those applications filed under such regime. As a practical solution, this Study will refer as potential mailbox filings those patent applications having the following characteristics:
Categorized as a pharmaceutical related technology (following the above mentioned criteria)
Filed during the period January 1st, 1995 to December 31st, 1999. Not published before January 1st, 2000. Not published within 20 months of the first filing
The latter is the less intuitive one and it intends to capture the border cases. We define as border case those applications filed at the very end of the mailbox provision period – i.e. after July 1998 – which may or not be related to it. We identify 561 applications as potentially filed under the mentioned mailbox provision. This figure is lower than those reported by Oddone and Failde (2006, p. 45, Table A2), although they include agricultural patents as well.
In the case of multiple applicants in patents or trademarks filings we employ the fractional counting. For instance, a patent filed by two different companies will count as half application for each, if they are three as a third for each, and so on. This method only affects the statistical reporting related to applicants, e.g. companies IP portfolios or country of origin.
Measuring the impact on the pharmaceutical market conditions
Establishing the limits of the pharmaceutical market are challenging in many aspects. First, medicines are sold for many different therapeutic properties and, second, through many different channels. The first aspect raises the question about where exactly delimit each medicine’s precise market boundaries. While it is reasonably clear that dermatological medicines do not compete with analgesic ones, the no competition within these is less evident. For instance, in many illnesses (or symptoms), Acetaminophen based medicines compete with Ibuprofen ones, although for many others these are not substitutes at all. The second aspect provides a measurement challenge, as capturing the sales from suppliers in the public system may differ considerably from those sold directly to private consumers.
To the best of our knowledge, the most comprehensive source for medicines supplied in Uruguay is Farmanuario (FA), which is a Uruguayan private publisher. Their flagship publication – both in paper and online formats – is also called Farmanuario and compiles all pharmaceutical products and their prices at monthly basis by sourcing the information from the pharmaceutical companies themselves. According to interviewees from pharmaceutical
10 Please refer to http://www.wipo.int/classifications/nice/en/classifications.html for more details on the Nice Classification (NCL) of goods and services for the purposes of the registration of marks.

CDIP/13/INF/5Annex, page 27
companies this source is reliable as companies have all interest in keeping their products updated in it. On the other hand, they also alerted us to the fact that prices reported there are just suggested listed wholesale prices and recommended retail ones. This means that they are often subject to discounts and rebates in both ends.
The raw data received from FA contains 340,621 records for the period January 2004 to December 2010. Given that data is not always reported for each single product every month, but also that there were several redundant records, the resulting monthly panel contains 498,781 records. These refer to 13,941 products over 84 periods containing 1,408 different active ingredients, although most of them are not observed during the whole period. It is worth remarking that as many of these are not necessarily medicines – e.g. cosmetic, dental or hygiene products – we do not consider them in the analysis. With this respect, a basic methodological challenge faced when building the panel was the identification of each product. For instance, the data includes several brands for the same active ingredient supplied by the same company. In many cases, these different brands refer to different dosages of the same compound, different forms and delivering routes – i.e. pills, syrup, IV, etc. – or just packaging. Another related problem was that certain records appear with two different suppliers but with the exact same trade name, dosage and price. When manually checked, these were virtually always related to mergers and acquisitions (M&As) or to licensing agreements. To avoid biasing the estimation of the market structure in the case of M&As, we consider only the newer company. In the case of licenses, we consider the licensor if present in the market and licensee if not. The few remaining cases were attributed to the supplier selling the product for the longer period.
Moreover, the main challenge faced when measuring the impact of IP on the pharmaceutical market structure and prices was to establish a direct link between patents and medicines. . Experience has shown that establishing such a link is anything but simple, as shown in the thorough patent landscape reports on Atazanavir and Ritonavir (see WIPO, 2011a, 2011b, respectively). Indeed, fully landscaping patents for all the medicines sold in the Uruguayan market was out of reach for the scope of this report.
As a practical alternative, we made use of the historical data from the United States Food and Drugs Administration (FDA) publication known as the Orange Book (OB). This publication links products and their active ingredients with patents granted in the United States. In order to account for all possibilities and to reduce the errors to a minimum, we establish a first link between the active ingredients in the OB and those from FA. This was a relatively time consuming exercise, mainly because their classifications are not fully compliant, as OB follows USAN and FA uses a kind of INN. Additionally, they are often spelling differences rooting to each original language – e.g. Eritromicina Etilsuccinato in Spanish and Erythromycin Ethylsuccinate in English. Nevertheless, a match was found for 871 out of 1’408 active ingredients in FA, which is roughly 60%11.
The quality of the underlying sample is adequate, as those unmatched fall mostly in one of the following cases:
The field used from FA (farmaco) does not always refer to an actual active ingredient, for many records they stand for a broader category without a clear common active ingredient (e.g. Cremas para pies or Adhesivos para protesis);
11 Actually, 959 out of 1629 active ingredients from the raw FA data were matched. But many of these – matched and unmatched – have no information on prices or they are not really medicines (e.g. tooth paste or soaps).

CDIP/13/INF/5Annex, page 28
some active ingredients in FA were found in both INN and USAN but not found in the OB (e.g. Zuclopenthixol, Ademetionine or Vincamine)12; and,
some active ingredients in FA would match what the FDA considers as Biologics License Applications (BLAs), which are not included in the OB and there is no equivalent patent-product listing known at the time of completion of this report.
About 60% of the matched 871 active ingredients had at least one patent registered in the OB – which means granted in the US – and refer to roughly three quarters of all products in the FA sample. It is important to keep in mind that OB connects one or more patents with one or more products and these to one or more active ingredients. Hence patents may be shared across different products and (potentially) across active ingredients. Unfortunately, in the case of products with several active ingredients, it is not always possible to identify which one is actually protected by a patent.
Another relevant aspect concerns which are the patents included in the OB. According to the OB’s text: “[…]The patents that FDA regards as covered by the statutory provisions for submission of patent information are: patents that claim the active ingredient(s); drug product patents which include formulation/composition patents; use patents for a particular approved indication or method of using the product; and certain other patents as detailed on FDA Form 3542 […]”. According to experts involved in the above mentioned patent landscape reports, patents reported in the OB are closer to first filings, particularly in the sense of those related to the active ingredients. However, it is also worth mentioning that OB records only granted patents and not ongoing patent applications. The second step was to establish a link between the OB US patent data and Uruguayan national collection from DNPI. This could be done relatively easily using the priority information already in the DNPI patent applications. Nevertheless, there is always the possibility of both the patents in the OB and DNPI being subsequent filings of a patent filed elsewhere – e.g. EPO or JPO. In order not to miss the link between OB and DNPI patents due to such possibility or any other more complex patent family structure, we made use of the INPADOC patent family information from the above mentioned EPO’s PATSTAT. All patents in the OB were matched with PATSTAT, as well as 94% of all pharmaceutical patent applications (90% of all patents) in the Uruguayan national collection from DNPI. The 401 unmatched patent applications (886 for the whole sample) appear to have wrong priority information. These were manually checked, but we failed to establish an unambiguous link with PATSTAT records. As a result, about 60 active ingredients had a subsequent filing in Uruguay, which represent about 12% of active ingredients having a patent in the US. These cover 536 products and 19,838 observations in the FA sample.
In a third step, we assessed manually the existence of a link between an OB product and the 3,073 products in FA with an active ingredient protected by a US patent. In other terms, within the 532 patent protected active ingredients, we distinguish if a certain product commercialized in Uruguay is the same one than the one protected in the OB. About half of these active ingredients (53%) have a product commercialized in Uruguay which matches the protected product in the OB. There are in total 798 patent protected products competing in Uruguay with other unprotected 2,275 ones sharing the same active ingredients. Out of these, 123 products are also linked to a patent filed in Uruguay, which compete against 271 unprotected ones.
For the reason that FA has no information on the quantities sold, these distinctions are going to prove useful when trying to establish the relation between patents and market prices. Indeed, the main challenge is the causality direction of an eventual effect. We expect that prices are higher for patented protected products because suppliers exert their exclusion rights and,
12 As checked in FDASIS (fdasis.nlm.nih.gov).
CDIP/13/INF/5Annex, page 29
hence, benefit from a monopolistic position. However, at least partially, we can also attribute this differential to the higher medical properties of a certain medicine. In other terms, firms are more likely to patent those drugs for which they expect a higher pay-off in the future. As such, patent protection may also signal the ex-ante assessment of the product’s quality. In order to minimize this risk, we measure price differences within clusters of similar therapeutic properties, based on the therapeutic hierarchical groupings established in the FA original data.13
Additionally, in this same step, we also flagged the products commercialized under the same brand or by the same company as the ones appearing in the OB. We also take into account those cases where there was an explicit license or commercialization agreement announced in the media, corporate or other specialized websites. Finally, we consider as a probable licensing when a company commercializes a medicine in Uruguay with the same brand as the one registered by another company in the OB, even when we did not find any public record of such agreement. Unfortunately, we cannot completely rule out the possibility of missing some licensing agreements between international and local producers.
As a robustness of the strategy of matching patents with products in FA through the links between OB, PATSTAT and DNPI records, we tested it against different sources of similar data. A reasonable concern about this strategy refers to the risk of products commercialized in Uruguay being protected by patents excluding filings in the US. As most pharmaceutical patents filed at DNPI are subsequent filings (see Figure 8 in p.39), the risk of products being protected only in Uruguay is negligible. Moreover, the possibility of any indirect link between a patent filing in Uruguay and those at the USPTO has been already contemplated when using the patent families from PATSTAT14. Nevertheless, we cannot rule out a priori the possibility that a pharmaceutical product was patented outside the US and later in Uruguay. To assess the risk of this potential bias, we made use of the online version of The Merck Index (MI) which links active ingredients – chemical compounds – to patents applications in several jurisdictions, e.g. EPO, JPO or UKIPO (see O’Neil et al., 2013). Using the MI as a benchmark, we found that virtually all active ingredients listed in both MI and FA have at least one filing in the USPTO15. Additionally, we checked the resulting matched data against the above mentioned Patent Landscape Reports on Atazanavir and Ritonavir, as well as the Medicines Patent Pool HIV database. In all these cases, we do not seem to miss a link between medicines commercialized in Uruguay and patent protection both nationally and abroad.
Given all this, the final sample has 7,978 products (out of 14,068 in the raw FA), which we define as each unique instance of different brand name, presentation and supplier16. These represent 839 (out of 1,408) unique active ingredients. These figures are in the same range of those reported by IMS Health (in Oddone & Failde, 2006, p. 14). For the analysis, we keep only those records in FA with one of the 839 active ingredients found in the OB, which results in an unbalanced panel containing 307,472 records referring to 7,978 different products over 84 months (38.2 months in average). This final panel dataset is very rich to analyze the dynamics of the domestic pharmaceutical market, although there are also some limitations which are worth noting. The main limitation relates to the fact that there are very few medicines with patents filed or granted during the panel’s period. In concrete terms, there are only five products relating to a patent filed in Uruguay and nine to one granted there during this period17.
13 For a discussion on the challenges faced when comparing prices of medicines refer to Danzon and Kim (1998).14 Of course, this depends on PATSTAT national collections coverage, which is very good for the main IP offices, but sometimes incomplete for developing countries.15 Interestingly, most of the few which have not a filing in the US according to the MI seem to actually have it according to PATSTAT. The less than fifty cases without any established link to the US seem to be very old patents, mostly filed in European countries during the first half of the 20 th century. 16 Unfortunately, this means that a product being merely rebranded will be considered as two different products.17 See Annex Table A - 2 for a list of the latter.

CDIP/13/INF/5Annex, page 30
At the time of filing or grant, the active ingredients contained in these products are also found in just other 21 and 13 competing products, respectively.
We characterize this limitation in a more systematic way by analyzing the between and within variability. As shown in Annex Table A - 4, these differ substantially depending on the observed variable. Moreover, the selected therapeutic grouping criteria – from highest level of therapeutic class (TC1) to the product itself – change these statistics considerably. For instance, the average medicine sold in Uruguay costs about 46 US dollars, but the standard deviation is 196 dollars. This latter statistic accounts for both the variability within products over time ($27) and between products ($226) averaging the whole period. In this particular case, but also for most variables in the panel, this means that most of the variable’s variation is explained by product heterogeneity and less by changes over time. The interpretations of the within and between statistics vary slightly according to the different grouping criteria of therapeutic similarity that we apply. For instance, at the active ingredient level, the even higher between standard deviation ($464) represents the heterogeneity when comparing the average price of each active ingredient, which averages the prices for all products containing it over time. Conversely, the within standard deviation ($91) captures now the variability of these products inside each active ingredient, as well as their variability over time18. Therefore, the within variability is expected to increase with a higher aggregation of therapeutic classes, as it implies relaxing the similarity constraint.
As mentioned above, a particular challenge for this analysis is that most variables relating to patent protection have very little variability over time, especially those relating to protection in Uruguay. For this purpose, most of the variables used in this study are computed as time invariant at the product and active ingredient levels. As it can be seen in Annex Table A - 4, by construct, these show zero within variability at the product and active ingredient levels, respectively. The only variable computed as time-variant is the share of protected products within each active ingredient by type of protection. Therefore, their within variation at the active ingredient level captures the variation over time, which is relatively little. Given the discussed little within variation in the patent protection variables, this is mostly explained by the entry and exit of products within each active ingredient. Moreover, the within variation at the product level has no actual meaning and, hence, omitted from Annex Table A - 4.
Another source relevant for our analysis is the public procurement data compiled by the Centralized Procurement Unit (UCA) of the Uruguayan Ministry of Economy and Finance (MEF). The underlying data contain 4,856 observations, corresponding to 2,313 different items – referring to different active ingredient, dosage and route – which appear in five different calls for tenders launched in the period 2007-2012. These calls total more than 200 million US dollars of granted bids (Annex Table A - 5). Virtually all observations and expenses belong to two specific calls, #1007-07 and #30-2009, which refer to a broad scope of medicines and other related items. Given that calls can be launched more than once, a medicine from a given call may be assigned more than once over time, hence appearing several times in our data. Moreover, records are sometimes not unique because items can be partially attributed to more than one company or removed from one assignee and re-attributed to another one. As observed by the frequencies over time, this data source is not as rich for analyzing the dynamics as the FA one (see Annex Figure A - 1).
Virtually all active ingredients in the UCA-MEF data are found also in FA. There are two notable exceptions, Bevacizumab and Trastuzumab, which correspond to Roche’s products Avastin and Herceptin, respectively. Moreover, these have been filed in the FDA as BLAs, which means they are not included in the OB and, more importantly, there is no information about their patents. As we did for the data from FA, the active ingredients from UCA-MEF were matched to those in the OB and its patent data information. There are 3,631 (75%) observations which
18 However, as already seen, the variability over time is a small part of it.

CDIP/13/INF/5Annex, page 31
have an active ingredient available in the OB. Following exactly the same approach as for FA active ingredients, the patent protection of those UCA-MEF observations matching OB was traced through PATSTAT and DNPI patent data.

CDIP/13/INF/5Annex, page 32
4. Intensive use of the Uruguayan IP system after the IPR reform
A modest use of IP in Uruguay
It is important to keep in mind when analyzing the effects of any IPR that Uruguay does not play a significant role in quantitative terms when compared to the international context. In terms of patent applications, this is a trait shared with other Latin American countries, which as a whole represent less than 3% of the world. With less than one thousand applications per year, Uruguay only accounted for 1.3% of the patent filings in Latin America during the 2000s (Figure 1, panel a). At the same time, between the 1990s and the 2000s, the filings in Latin American countries have grown faster than the world’s average and Uruguay has grown even faster than the regional average.
The filings for trademark protection offer a different picture (Figure 1, panel b). In the 2000s, Latin America received about 4 million trademark applications which account for little less than 14% of the worldwide filings. Uruguay received roughly 120,000 applications in the same period, representing 3% of the filings in the region. While higher than for patents, this is still a small figure as out they account just for 0.43% of the world. Moreover, for this IP form, the relative trend is negative. Not only have Latin America reduced their share of total trademark filings in the world from the 1990s to the 2000s, but Uruguay in particular has lost more than the regional average.
Fundamentally used by non-residents
In total there were 9,160 patent applications filed in Uruguay between 1995 and 2012. The number of patent applications more than tripled during this time period, from 228 in 1995 to 737 in 2010 (Figure 2). A considerable amount of this growth is observed in the period 1995-1999, when the TRIPS agreement was already in place but only under the mailbox provision. Interestingly, when the new patent law was already in place, there was a substantive decrease, particularly between 2000 and 2003. However, this fall is likely to relate more with the currency crisis in Uruguay as well as the international context. In any case, since 2003 the filings have been growing steadily until 2008, when another reverse in the trend is observed although smaller than the previous one.
The fact that there is slowdown relatively coincidental with international crises can be explained by non-resident applicants accounting for virtually all filings (Figure 3). Uruguayan residents filed little more than 4% in the whole period. Even more, the share of resident filings has decreased from 11.8% in 1995 to 2.1% in 2010.

CDIP/13/INF/5Annex, page 33
Figure 1: Uruguay’s IP filings in the international context
(a) Patent applications
(b) Trademark applicationsSource: IPSTATS. Note: LAC = Latin America.

CDIP/13/INF/5Annex, page 34
Figure 2: Patent applications by filing year
Source: DNPI (2012), Note: Fractional counting is used for multiple applicants.
Figure 3: Patent applications by origin
Source: DNPI (2012), Note: Fractional counting is used for multiple applicants.

CDIP/13/INF/5Annex, page 35
Patents are mostly used in pharmaceutical related industries
Of the 9,160 patent applications filed between 1995 and 2012, 6,661 (73%) can be categorized as technologies related to the pharmaceutical industry. As depicted in Figure 4, the two most frequent technological fields are pharmaceuticals (technological field 16) and organic fine chemistry (14). Each of them account solely for substantially more than half of the applications. Each of following four technological fields account for not more than 10% of the patent applications. Moreover, these are arguably within a broadly defined chemical and health related industries. These are basic materials chemistry (19), biotechnology (15), food chemistry (18) and medical technology (13). The first completely unrelated technological field is handling (25), appearing in the 7th position and accounting for 3.4% of all filings.
Henceforward, we refer as pharmaceutical technologies those patent applications which are categorized in the technological fields of pharmaceuticals (16), organic fine chemistry (14) or biotechnology (15). However, just considering the technological field 16 would have brought results which are qualitative equivalent. In any case, our figures are in accordance with those from previous literature (Oddone & Failde, 2006, p. 13).
Figure 4: Top 4 Technological fields
Source: DNPI, Technological fields are based on WIPO’s IPC technology concordance table (see p. 25)Notes: 13=Medical technology; 14=Organic fine chemistry; 15=Biotechnology; 16=Pharmaceuticals;
18=Food chemistry; 19=Basic materials chemistry; 25=Handling; 34=Other consumer goods; and, 35=Civil engineering. Sum of percentages exceeds 100%, as patents may have more than one IPC.
CDIP/13/INF/5Annex, page 36
Figure 5 shows the trend between 1995 and 2010 for pharmaceutical patent applications and other ones. Applications in the pharmaceutical sector increased rapidly between 1995 and 2000 and outgrew other applications after 1997. In the year 2000, the Uruguayan IP office received more than twice the amount of pharmaceutical related patent applications than from all other industries. Both pharmaceutical and non-pharmaceutical applications show a slowdown in the early 2000s, although the decrease is more apparent for the non-pharmaceutical technologies. Moreover, pharmaceutical patent filings have continued growing to reach 569 patent applications in 2010, while the other technologies roughly recovered the level before the crisis by then. Nowadays, the Uruguayan DNPI receives three times more filings in the pharmaceutical sector than in all other sectors (Table 2).
Figure 5: Pharmaceutical patent applications by filing year
Source: DNPI (2012)
The trend on non-residents filing most of the patents in Uruguay is even stronger for pharmaceutical related technologies (Figure 6). Non-residents accounted for 96% of filings in 1995 and virtually all in 2010. Resident filings of pharmaceutical patents are scarce, as they hardly file more than five applications per year (Table 2). Pharmaceutical patent filings are not only mostly filed by non-residents, they are also more concentrated across origins (Figure 7). Applicants from the United States, Germany, France, Sweden, Switzerland and the United Kingdom accounted for 74% of all applications and 84% of the pharmaceutical ones.

CDIP/13/INF/5Annex, page 37
Table 2: Applications by filing year and origin
Year of Filing Resident Non-resident Resident Non-resident
1995 27 201 2 57 26%1996 21 211 5 102 46%1997 30 308 8 161 50%1998 20 343 5 220 62%1999 24 432 1 298 66%2000 35 546 5 423 74%2001 34 537 3 413 73%2002 21 458 3 395 83%2003 23 489 4 416 82%2004 27 497 5 396 77%2005 19 567 3 456 78%2006 21 688 4 540 77%2007 23 703 5 563 78%2008 25 679 3 547 78%2009 17 727 4 573 78%2010 16 722 3 567 77%2011 11 597 1 439 72%2012 2 61 0 35 56%Total 395 8,765 62 6,599 73%
All Applications Pharmaceutical applications Share of pharmaceutical
applications
Source: DNPI (2012), Note: Fractional counting is used for multiple applicants.
Figure 6: Pharmaceutical patent applications by resident and non-residents
Source: DNPI (2012), Note: Fractional counting is used for multiple applicants.

CDIP/13/INF/5Annex, page 38
Figure 7: Country of residence of Pharmaceutical patent applications
Source: DNPI (2012), Notes: Fractional counting is used for multiple applicants.Notes: US=United States, DE=Germany, FR=France, SE=Sweden, CH=Switzerland, GB=United Kingdom, UY=Uruguay,
ES=Spain, BE=Belgium, JP=Japan, and, NL=The Netherlands.
Given that most of the patent filings are originated abroad, it is not surprising that the vast majority of applications have claimed a priority filing. These 8,463 subsequent filings account for 92% of total patent applications. Only 27 of them claimed priority from a previous patent

CDIP/13/INF/5Annex, page 39
application in Uruguay. Figure 8 displays the share of subsequent filings distinguishing between pharmaceutical from the other patent applications over time. Again, pharmaceutical related technologies are more likely to have a first filing elsewhere. In both cases there is an increasing trend of subsequent filings during the period 1995-2010.
Figure 8: Percentage of subsequent filings
Source: DNPI (2012)

CDIP/13/INF/5Annex, page 40
Figure 9 shows the most frequent first filing offices for subsequent filings in Uruguay. We observe a similar pattern as for the applicant’s countries of origin. Pharmaceutical related technologies are concentrated in fewer patent offices. The top 5 patent offices account for more than 95% of the total priority claims in pharmaceutical filings and 76% of all filings. Accounting for 40% (45% in Pharmaceuticals) the United States Patent and Trademark Office (USPTO) is the most frequent origin for the first filing, followed by the European Patent Office (EPO).
Figure 9: Office of priority filing
Source: DNPI (2012), Notes: Only first priority filing considered. US=USPTO (United States), EP=EPO (Europe), DE=DPMA (Germany), GB=UKIPO (United Kingdom) and FR=INPI (France).

CDIP/13/INF/5Annex, page 41
High concentration of pharmaceutical patent applications
Table 3 lists the top 10 patent applicants in terms of patent filings in Uruguay. The top 10 applicants in terms of patent filings in Uruguay are also the top applicants of pharmaceutical filings, with virtually no difference in their order. All of them are large international pharmaceutical companies. The only exception is the German chemical company BASF – ranking 7th overall and 8th in pharmaceutical filings – which nevertheless has a pharmaceutical business division and supplies many of the large pharmaceutical companies. These ten companies account for two thirds of the pharmaceutical patent applications in Uruguay. They also represent half of all patent filings, although only 8.5% of those technologies not associated with the pharmaceutical industry. This concentration is even more apparent when taking into account that the top 10 applicants without considering pharmaceutical filings concentrate only 20% of the other patent filings. Moreover, three of the top 10 pharmaceutical applicants also rank among the top 10 of the non-pharmaceutical related technologies. These are the already mentioned BASF (ranking 1st), Boehringer Ingelheim (3rd) and Bayer (6th). The first resident applicant – if foreign subsidiaries are excluded – is the pharmaceutical endeavor Farma Center, which filed 14 pharmaceutical patent applications.
Table 3: Top 10 companies with patent applications
All Pharma Other All Pharma OtherPFIZER Pharmaceuticals 1 1 34 902 893 9SANOFI Pharmaceuticals 2 2 39 647 638 7
ASTRAZENECA Pharmaceuticals 3 3 30 611 601 10BAYER Pharmaceuticals 4 4 6 592 545 46
BOEHRINGER INGELHEIM Pharmaceuticals 5 5 3 590 527 63GSK Pharmaceuticals 6 6 >50 309 306 3
BASF Chemicals 7 8 1 307 235 72ROCHE Pharmaceuticals 8 7 >50 306 306 0
NOVARTIS Pharmaceuticals 9 9 47 215 209 6ABBOTT Pharmaceuticals 10 10 >50 143 142 1
Total 4621.7 4402.2 217% 50.5% 66.1% 8.7%
All Pharma Other All Pharma OtherBASF Chemicals 7 8 1 307 235 72
COLGATE Personal Care 14 22 2 95 30 65BOEHRINGER INGELHEIM Pharmaceuticals 5 5 3 590 527 63
WEYERHAEUSER Forest Products 16 44 4 73 11 62KIMBERLY CLARK Personal Care 19 >50 5 54 1 53
BAYER Pharmaceuticals 4 4 6 592 545 46TELEFONICA Telecommunications 23 >50 7 39 0 39
BRASILATA Packaging 26 >50 8 36 0 36NESTLE Food processing 21 >50 9 40 7 33
ANDRITZ Industrial processing 30 >50 10 32 1 31Total 1858.2 1357.2 500
% 20.3% 20.4% 20.0%
Top 10 All & Pharma
Top 10 Other
Applicant
Applicant Rank Patent applications
Industry
Industry
Rank Patent applications
Source: DNPI (2012). Notes: Fractional counting is used for multiple applicants. Figures may not consider all corporate linkages of applicants. Ranks above 50 are not reported.

CDIP/13/INF/5Annex, page 42
Low grant rate and increasing pendency
A relevant challenge for the Uruguayan IP system concerns patent pendency – the delay between the filing of a patent application and the patent office’s final decision on the application. At the time of data extraction, only 585 patents were registered as granted. This accounts for only 6.4% of all applications filed in the period 1995-2012. The average time between a patent filing and grant is about 5.5 years for the same period. This is a similar pendency time as observed in other IP offices around the world (WIPO, 2013, p. 85).
There is an indication, however, that pendency has increased in more recent years. At the time of data extraction, virtually no patent filed after 2000 was registered as granted in our data (Figure 10). The available IP data do not allow us to distinguish withdrawn or refused applications. But, even if many were refused or withdrawn, this still implies that those to be eventually granted would take roughly twice as longer as before. Another way to look at this problem concerns the increase of examination backlog, which refers to the amount of patent applications for which a decision is pending.19 If the grant rate during 1995-2000 is taken as reference, granted patents are approximately around 50 to 100 per year. Maintaining this average for those filings in 2001-2010 means that there is not less than 500-1,000 patents waiting to be granted. Even worse, taking into account that about half of the applications filed in 1995 were eventually granted, this means that around 3,500 patents filed between 1996 and 2012 could be expected to be granted in the following years, many of them for pharmaceutical related technologies. The national plan for the pharmaceutical sector seems to share these concerns as they foresee to strengthen the examination capacity (Gabinete Productivo, 2011, p. 41)
Figure 10: Granted patents by year of filing and grant
Source: DNPI (2012).
19 According to interviews, the Uruguayan IP office has already examined many of the pending patents, though they await a final decision. This fact may affect our backlog estimations.
CDIP/13/INF/5Annex, page 43
Figure 11: Granted patents by technology
Source: DNPI (2012).
As displayed in Figure 11, more patents have been granted for pharmaceutical technologies (362 patents) than for other fields (223). However, these represent only 5.4% of all pharmaceutical filings, against 9% of filings in other technology fields. The fact that virtually all granted patents were filed before 2001, when the proportion of pharmaceutical filings was smaller (see Table 2), explains at least partially the lower grant rate for pharmaceutical-related applications.
Moreover, the fact that most granted patents in the analyzed data have been filed during the mailbox provision period makes any pendency assessment less straightforward. As shown in the first row of Figure 12, the years-to-grant of pharmaceutical patents (panel a) are less concentrated than for other technologies (panel b). In other terms, pharmaceutical patents in Uruguay have stayed longer in the pipeline than other patents. Taking into account the date of the first filing elsewhere – second row in Figure 12, panels c and d – there is roughly the same pattern but shifted one year longer. This is in accordance with the 12 months conceded by the Paris Convention and the fact that Uruguay is not a member of the PCT agreement. It is worth noticing that those applications filed under the mailbox provision were not introduced in the system until January 1st, 2000 – including their publication and examination – which has obvious consequences for the grant date. With the intention to cope with this, a filing date correction is applied to those pharmaceutical granted patents which were potentially filed under such regime in the last row in Figure 12 (panel e). There it is observed that most pharmaceutical patents have been granted in 4.5 years or less, which is a better score than for those patents in other technological fields, regardless which application date is considered.
Given that most patents applications in the sample have not yet been granted, an alternative is to assess the pendency with respect to the publication of the patent filing. In statistical terms, this is a clear advantage, as all filings in our data have been eventually published. In analytical terms, this is less clear-cut. In the one hand, it can be argued that publication is an important trait of the IP system in order to perform its diffusion function. Indeed, local entrepreneurs can make use of this information to their own benefit, either to invent around or downstream. More importantly, as most pharmaceutical patent filings have been filed first elsewhere, local competitors might be aware of these filings when published abroad. For them, knowing exactly where these technologies seek for protection – particularly if in Uruguay – might be of relevance for the product development and associated investments decisions. On the other hand, while

CDIP/13/INF/5Annex, page 44
publication in Uruguay provides confirmation of protection being claimed in this jurisdiction, this is an official proof of yet uncertain rights. In other terms, local competitors of the filed technology cannot ignore the existence of such technology, but they neither can assess its exact scope. This implies an unclear threat to their investment strategies.
Figure 13 shows the time between filing and publication of those patent applications received during the mailbox period. We observe a very similar pattern to the one depicted for granted patents in Figure 12. Pharmaceutical filings have taken longer to get published than other technologies. Nevertheless, this is rather an artifact from the mailbox provision. When corrected for, pharmaceutical filings have been published with a relatively similar pendency than those for other technologies. This is even more apparent when only those filings after 2000 are considered. As shown in Figure 14, most patent applications in Uruguay – either pharmaceutical or not – are being published within the year of filing and within the two years of the first filing.

CDIP/13/INF/5Annex, page 45
Figure 12: Grant pendency
Source: DNPI (2012). Notes: Last row considers January 1st, 2000 as filing date only for filings flagged as potentially under the mailbox provision regime, which does not apply for non-pharmaceutical filings (see p.24).

CDIP/13/INF/5Annex, page 46
Figure 13: Publication pendency during Mailbox provision
Source: DNPI (2012). Notes: Last row considers January 1st, 2000 as filing date only for filings flagged as potentially under the mailbox provision regime, which does not apply for non-pharmaceutical filings (see p.24).

CDIP/13/INF/5Annex, page 47
Figure 14: Publication pendency after Mailbox provision
Source: DNPI (2012).
Few pharmaceutical patents are successfully introduced to the market
Despite pharmaceutical companies increasingly using the Uruguayan patent system, few of the protected technologies lead to the introduction of medicines on the market (Figure 15). Most pharmaceutical patent applications in Uruguay and their eventual grants do not translate into new active ingredients or products in the market. Granted pharmaceutical patents are more likely to see commercialization than pending pharmaceutical patents, though the commercialization share remains small.
The main difference between filings and patents is more apparent in Figure 16, where the shares of those relating to commercialized active ingredients and products are shown. As observed there, the rate of commercialization is higher for granted patents than for applications, although still relatively low. Figure 16 also allows comparing the commercialization of active ingredients and products more clearly. In most cases, whenever a patent – pending or granted – protects an active ingredient which is commercialized in Uruguay, the original protected product or a licensor one is also available in it. This means that while most patents do not relate directly with what is found in the market, when they actually do relate there is the intention to supply the market.

CDIP/13/INF/5Annex, page 48
Figure 15: Pharmaceutical patents successfully introduced to the Uruguayan market
Source: Orange Book (2012) & OB historical patent data, DNPI (2012), PATSTAT (2012) and Farmanuario (2012)
Figure 16: Pharmaceutical patents successfully introduced to the Uruguayan market (Percent)
Source: Orange Book (2012) & OB historical patent data, DNPI (2012), PATSTAT (2012) and Farmanuario (2012)

CDIP/13/INF/5Annex, page 49
However, the low commercialization rate is far from being a specific phenomenon in Uruguay. Indeed, the amount of granted pharmaceutical patents in the US which can be related to an approved product in the FDA is almost negligible when compared to the patents granted in the pharmaceutical broad field (Figure 17).20 The amount of granted patents has roughly quadrupled since the early eighties, while the share of those being commercialized has remained between 0.5 and 1.5%. The only exception to this commercialization rate range happened during the period 1992-1995, probably related to the Uruguay Round Agreements Act and its patent term extension.
When comparing carefully the commercialization rates in the US and Uruguay, we note that those from the latter are relatively higher, regardless if compared with filings or granted patents. This likely explained by a selection bias of foreign applicants, which might cherry-pick patents to be filed in Uruguay from their portfolio. Given the size of the Uruguayan market vis-à-vis the US one, it is likely that the applicant’s threshold to file a patent in Uruguay is higher as the expected returns are lower. Moreover, applicants may opt out to file in Uruguay if the project is not as promising as it was when they filed the first application. Given that those filings in Uruguay are virtually always a subsequent filing, it is quite frequent that patent applications in Uruguay are filed about one year later than the priority one, which in roughly half of the cases was filed in the US.
In any case, this reflects the high uncertainty of the pharmaceutical innovation process, with companies discarding many initially promising inventions before market introduction.
Figure 17: Pharmaceutical patents successfully introduced to the US market
Source: Orange Book (2012) & OB historical patent data. Note: Commercialization rate omitted for period 1992-1995 due to outlier values. Refer to full series in Annex Figure A-2.
20 Here we employ again the broad definition of pharmaceutical patents from section 3. If we restrain to a narrower definition – i.e. only field 16 – results remain qualitative the same although with a slightly higher rate of commercialization.

CDIP/13/INF/5Annex, page 50
On the overall use of trademarks in Uruguay
There were 165,568 trademark applications filed in Uruguay between 1995 and 2012. Out of which, 100,431 (60.7%) are new applications while the remaining refer to renewals of previous filings. As displayed in the left panel of Figure 18, the number of trademark applications observes a relatively increasing trend, passing from 8,881 filings in 1995 to 10,674 in 2010. However, this trend has a turbulent period in the late 1990s and early 2000s when it fluctuated erratically with a downward trend. It is worth noting that these figures include also the trademark renewal applications. New trademark filings seem only now to be recovering from the 2000s downturn, although still below the 6,511 peak in 1998.
The average trademark application during 1995-2012 has been filed for 1.64 different Nice classes. In other words, the 165,568 trademark applications in Uruguay are equivalent to 272,169 “single class” applications. The right panel in Figure 18 provides similar figures and trends using SCE applications.
Figure 18: Main trends of trademark applications
Source: DNPI (2012). Notes: SCE = Single class equivalent applications, which considers each unique application and Nice class pair as a different trademark application.
The Nice classification allows exploring the distinction between product and services trademarks. Following the above discussion on multiple-classes, there are 12,928 (7.8%) trademarks applications which have requested protection in both products and services related classes. We explore the distinction between product and services trademarks inherited from the Nice classification using the SCE. Both product and service related filings suffer a decrease around the late 1990s and early 2000s, although services seem to recover faster (Figure 19). Indeed, as depicted in the right panel of Figure 19, trademarks for services seem to account for an increasing proportion of the total filings.

CDIP/13/INF/5Annex, page 51
Figure 19: Products and services trademark filings
Source: DNPI (2012). Notes: SCE = Single class equivalent applications, which considers each unique application and Nice class pair as a different trademark application.
Trademark applications are also granted with respect to each requested class. Between 1995 and 2012, protection has been granted for 227,286 (83.5%) SCE trademarks in Uruguay. There are still 32,394 (11.7%) pending and the few remaining have been abandoned, withdrawn or refused.
A higher and longer use of trademarks in the Pharmaceutical industry
Pharmaceutical companies do not only use patents intensively. Between 1995 and 2012, there were 33,729 trademark applications related to pharmaceutical goods (Nice class 5) in Uruguay, which represent 20.4% all filings and 12.4% of SCE applications. Pharmaceutical goods account for more trademark filings than any other product or services class (Figure 20). They are followed by hygiene and cosmetics related products (Nice class 3), although with not much more than half of the pharmaceutical-related filings. As a comparison, applicants in other countries also use Nice class 5 frequently, but globally it only ranks fifth and totals little less of 5% of all trademark applications (WIPO, 2013). As shown in Figure 21, there is quite volatility in pharmaceutical trademarks filings over the period 1995-2012, although this is roughly the same pattern as the one observed for the other industries. Moreover, the ratio of one pharmaceutical filing every 8 nice classes filed (12.5%) remains relatively valid in the whole period.

CDIP/13/INF/5Annex, page 52
Figure 20: Trademark filings by Nice classes (1995-2012)
Source: DNPI(2012). Notes: Grouping of Nice classes following Edital® (see WIPO, 2013). New applications include renewals when it is field for the first time in that particular class.
Figure 21: Trend of pharmaceutical related and other trademarks
Source: DNPI (2012). Notes: SCE = Single class equivalent applications, which considers each unique application and Nice class pair as a different trademark application.

CDIP/13/INF/5Annex, page 53
Out of all pharmaceutical filings between 1995 and 2012, roughly half (48.5%) concerned renewals of existing trademarks. This is a substantially higher rate of renewal than for most of the other industries (Figure 20). Moreover, the spread between total and new pharmaceutical filings (Figure 21, left panel) seems to be widening faster than for the other industries (Figure 21, right panel).
In order to remain active, a trademark needs to be renewed every ten years. Figure 22 shows the distribution of trademark filings by industry and application year according to their status of being registered or not and, if so, how many times they were renewed. It is worth noting that some of the filings in the late 2000s are likely to be still under examination, which explains the higher rates for not registered trademarks. Conversely, only filings before 1992 had enough time to be renewed twice and those filed since then and before 2002 enough to be renewed once. Having this in mind, roughly between 80 to 90 percent of filings are registered, although this has improved to about 90% since the late 90s. Moreover, there are not substantial differences in the registration of pharmaceutical related trademarks and the other ones.
Figure 22: Renewals and non-registrations by filing year
Source: DNPI (2012). Notes: Percentages are based on Single class equivalent applications (SCE). Only first filings since 1985 are considered.
There are, however, considerable differences in the renewal rates. Approximately between 45 to 55 percent of pharmaceutical filed every year are renewed at least once and between 25 and 40 percent are done twice (Figure 22, left panel). In the case of other industries, the range of filings renewed at least once is roughly between 25 to 40 percent and between 10 to 20 percent are done twice (Figure 22, right panel). This results in the average life-span of pharmaceutical trademarks being clearly longer than those from other industries. For instance, when considering all registered trademarks filed for the first time in 1985, the average pharmaceutical

CDIP/13/INF/5Annex, page 54
trademark has been maintained active for more than 21 years, while those from other industries only 16 years. In other terms, not only there are more pharmaceutical filings but also their average life-span is substantially longer than for other trademarks.
A sector dominated by foreign brands with increasing domestic competition
During the period 1995-2012, foreigners applied for about 60 percent of all trademark filings across all sectors. Pharmaceutical applications are not different and, if anything, slightly more foreign dominated. Roughly, there is one pharmaceutical filing every seven classes filed by non-residents, while residents do it for one every nine.
Figure 23 display the main trends of trademark applications by origin comparing pharmaceutical with other industries. Interestingly, there is again considerable volatility in these industries and origins, although a relatively consistent pattern among them. Nevertheless, pharmaceutical filings by residents seem to be increasing faster than those by foreign ones. This is more apparent in Figure 24, where the share of pharmaceutical filings by residents is roughly increasing over the period. Moreover, this is happening in the context where the share of resident filings in other industries is slightly decreasing.
Figure 23: Trend of trademarks by origin
Source: DNPI (2012). Notes: SCE = Single class equivalent applications, which considers each unique application and Nice class pair as a different trademark application. Fractional counting is used for multiple applicants.

CDIP/13/INF/5Annex, page 55
Figure 24: Percentage of trademarks by origin
Source: DNPI (2012). Notes: Percentages are based on single class equivalent applications and fractional counting is used when multiple applicants.
Figure 25 shows the top 10 origins for pharmaceutical trademarks for all applications and those related to the pharmaceutical industry for the period 1995-2012. Uruguayan residents filed the most applications in both cases, however slightly less for pharmaceutical filings. The list of foreign origins is roughly the same. However, pharmaceutical filings show an increase of German, Swiss and British origins, which are likely explained by well-known pharmaceutical companies from these regions. Also Chilean and Panamanian origins appear in the pharmaceutical top ten in replacement of Spanish and Japanese filings. The Chilean case is explained mostly by the export activity of some Chilean pharmaceutical companies to Uruguay, joining Argentinean and Brazilian companies’ activity in the local market. The Panamanian case seems mostly related to companies providing IP related legal services, which handle many brands from Uruguayan pharmaceutical producers (e.g. see Table 4 & Table A - 3).
Opposed to the case of patent applicants, many local companies appear as top pharmaceutical trademark applicants. As displayed in Table 4, two local companies appear in the top 10, which are Gramon Bagó and Andromaco. Additionally, the Latin America Trademark Corporation in the tenth position filed several brands on behalf of Roemmers, which with these added would have likely been part of the top10 (see Table A - 3). Nevertheless, five of the top10 pharmaceutical patent applicants are found also in the trademark one. These are the international companies Pfizer, Sanofi, Bayer, GlaxoSmithKline and Novartis. Conversely, the first local patent applicant, Farma Center, is not found among the top10 local trademark filers (see Table 5). Among these, there are the already mentioned Gramon Bago and Andromaco, as well as Urufarma, Celsius, Gador, Dispert, Lazar, Roemmers, Galien and Pharmos. Both foreign and local companies seem to protect both brands relating to their medicines, as well as their marketing and advertising investments, particularly for their over-the-counter products (see Table A - 3).

CDIP/13/INF/5Annex, page 56
Figure 25: Top 10 countries of residence 1995-2012
Source: DNPI (2012). Notes: Percentages are based on Single class equivalent applications (SCE) and Fractional counting for multiple applicants.
Table 4: Top 10 applicants of pharmaceutical trademarks
Pharma All All Pharma Other
BAYER Pharmaceuticals 1 2 3,545 1,761 1,784 50%
PFIZER Pharmaceuticals 2 6 1,908 1,510 398 79%
NOVARTIS Pharmaceuticals 3 7 1,809 1,340 469 74%
GRAMON BAGO Pharmaceuticals 4 15 1,422 1,239 183 87%
GSK Pharmaceuticals 5 5 1,969 1,196 773 61%
SANOFI Pharmaceuticals 6 12 1,493 989 504 66%
JOHNSON & JOHNSON Pharmaceuticals 7 4 2,178 955 1,223 44%
BRISTOL MYERS SQUIBB Pharmaceuticals 8 24 1,060 674 386 64%
ANDROMACO Pharmaceuticals 9 19 1,171 662 510 56%
THE LATIN AMERICA TRADEMARK CORP. Legal Services 10 28 970 650 320 67%
Rank Trademark applicationsIndustry %
Pharma
Source: DNPI (2012). Notes: figures based on Single class equivalent applications (SCE) and Fractional counting for multiple applicants. Figures may not consider all corporate linkages of applicants.
An interesting distinction between foreign and resident top trademark applicants refers to their overall portfolio of trademarks. The broad trend suggests that foreigners file more often beyond the pharmaceutical class than local companies. In some cases, such as Bayer and J&J, this is likely related to the broader scope of the company’s activity. Ignoring these cases, an alternative explanation could relate to an intentional wider scope to protect the brand investments.
In any case, these findings added to those found for patenting activity make apparent that pharmaceutical companies – particularly foreign ones – are intense users of the Uruguayan IP system.

CDIP/13/INF/5Annex, page 57
Table 5: Top 10 applicants residing in Uruguay (pharmaceutical trademarks)
Pharma All All Pharma Other % Pharma
GRAMON BAGO Pharmaceuticals 4 15 1,422 1,239 183 87%
ANDROMACO Pharmaceuticals 9 19 1,171 661 510 56%
URUFARMA SA Pharmaceuticals 11 32 809 624 185 77%
CELSIUS Pharmaceuticals 12 44 606 562 44 93%
GADOR Pharmaceuticals 13 40 689 556 134 81%
DISPERT Pharmaceuticals 15 49 555 482 73 87%
LAZAR SA Pharmaceuticals 16 50 553 474 79 86%
ROEMMERS Pharmaceuticals 18 46 580 429 151 74%
LAB. GALIEN Pharmaceuticals 19 47 566 401 166 71%
PHARMOS SA Pharmaceuticals 20 73 458 376 82 82%
IndustryRank Trademark applications
Source: DNPI (2012). Notes: figures based on Single class equivalent applications (SCE) and Fractional counting for multiple applicants. Figures may not consider all corporate linkages of applicants.
5. IP and the Pharmaceutical market conditions
This section addresses the link between IP use and market conditions. Benefiting from the unique unit record data on medicines sold in the domestic market and their patent protection status, this report provides novel empirical evidence on market entry, concentration and prices. We start with a broad characterization of the pharmaceutical industry from the market perspective.
Uruguayan market of medicines
Given that there are about 3.3 million inhabitants in Uruguay, the demand for medicines is small compared to other economies, including neighboring ones such as Argentina and Brazil (with 40 and 200 million, respectively). However, a GDP per capita of about 16,000 US dollars makes the average Uruguayan resident a relatively wealthy consumer for a developing economy and one of the wealthiest in the region21. Similarly, having health expenditures around 8% of GDP and of 618 US dollar per capita, Uruguay ranks only below Argentina, Brazil and Chile (Uruguay XXI, 2011).
In more specific terms, Correa and Trujillo (2005) estimated the Uruguayan pharmaceutical market back in 2004 to be in the order of 230 million dollars, weighting less of 0.01% of the worldwide sales in this industry. This estimation is in line with those reported by the two associations of pharmaceutical companies (Figure 26).22 According to this latter source, in 2012, pharmaceutical companies generated 475 million dollars in sales in Uruguay.
21 See World Bank’s World Development Indicators, GDP per capita in PPP (current international US dollars) for 2012.22 Most pharmaceutical companies supplying the Uruguayan market are affiliated to the Cámara de Especialidades Farmacéuticas y Afines (CEFA) or the Asociación de Laboratorios Nacionales (ALN).

CDIP/13/INF/5Annex, page 58
Figure 26: Evolution of Pharmaceutical sales
Source: CEFA (2013) and World Bank (2013).
While this market has been growing steadily for the past decade – at about 5% annually – it has been doing so more slowly than the Uruguayan economy. It is worth noting that there was a considerable fall in sales in the early 2000s. This is mostly a consequence of the currency crisis in Uruguay around the same period. Nevertheless, the level observed in 2001 seems to have recovered fully. In any case, this is not only a small market in comparison to neighboring countries but also in terms of other national industries. Indeed, the pharmaceutical sales represent less than 1.5% of the GDP and the trend is negative (Figure 26). These figures are in accordance with those by Oddone & Failde (2006), who found that the gross value added of local production of pharmaceuticals represented 0.85% of GDP in 2005. They contrast this figure with the contribution of other industries, such as the meat (5.5%) and milk (2.3%) related industries. A similar pattern is found for the industry’s employment, which accounted for 0.35% of the jobs in the private sector during 2005.
Figure 27: Distribution of Sales
(a) Sales

CDIP/13/INF/5Annex, page 59
(b) UnitsSource: CEFA (2013).
The distribution of medicines in Uruguay occurs through three main channels. These are (i) private drugstores and pharmacies; (ii) pharmacies under health maintenance organizations (HMOs)23; and, (iii) pharmacies of public hospitals (see Lalanne, 2004). The last two channels have their own respective centralized purchasing structures, which are likely to grant them advantageous conditions when negotiating prices. This is particularly the case for public hospitals’ purchases, which are made through the government’s Centralized Procurement Unit (UCA). According to Lalanne (2004), 55% of the sales are done within the overall public health system, where 19% correspond to public hospitals and 36% to private health insurance entities. The remaining 45% includes drugstores and other private distribution channels. Pharmaceutical companies report equivalent figures, which are displayed in Figure 27 (panel a).
The kinds of medicines purchased through these channels differ (Figure 27, panel b). Typically, public hospitals purchase proportionally more units for less money. Conversely, private drugstores and pharmacies represent a smaller proportion of the physical units sold and a larger one of the pecuniary sales. Interestingly, public hospitals seem to be shifting to a more expensive basket of medicines over time, as the average price paid per unit has exceeded the one being paid by HMOs since 2011 (Figure 28). In 2012, the average price for a medicine in Uruguay was a little less than four dollars. However, medicines sold through pharmacies from public hospitals ($3.52) or from HMOs ($3.32) were cheaper on average, while those sold through private drugstores and pharmacies were more expensive ($4.96). This does not necessary reflect a price difference for the same basket of pharmaceutical products, as the medicines sold through each channel might be considerably different.
23 These are known as Mutualistas.

CDIP/13/INF/5Annex, page 60
Figure 28: Average price per unit
Source: CEFA (2013).
On the supply side, there are a little more than 100 companies supplying the domestic market, with one third having 20 or more employees (Uruguay XXI, 2011). These larger companies account for roughly 90% of the employment in the industry and they consist of fully domestically-owned firms, those which have regional ownership – mostly from Argentina – and those which are subsidiaries of international companies, with each of these three groups accounting for a similar share The former two groups produce locally, but this does not exclude the sale of products fully manufactured abroad (CIU, 2012; Oddone & Failde, 2006). Moreover, there is substantial use of imported inputs in the national production of medicines (Uruguay XXI, 2011).
Figure 29: Market concentration

CDIP/13/INF/5Annex, page 61
Source: CEFA (2013).
CDIP/13/INF/5Annex, page 62
As a whole, the pharmaceutical industry does not seem to show strong signs of market concentration. Figure 29 displays aggregate sales distribution for the top 25 companies by distribution channels. While it is true that the first five companies on each channel account for not less than one third of the sales (roughly between 30 to 40%), it is also true that not less than an fifth of each channel is left for those companies outside the top 25 (20-25%).
According to ALN, in 2009, 9% of the commercialized units were under patent protection, but these represent 35% of the sales (in Gabinete Productivo, 2011, p. 7). Given that there is no information available on quantities sold, this cannot be fully assessed with the current data. However, the market structure and prices can be characterized in substantially further detail, which is done as follows.
An in-depth description of the market structure and prices
We now turn to the unit-record data produced from the combination of unit record data from Farmanuario, UCA-MEF, FDA’s Orange Book, DNPI and EPO’s PATSTAT, as carefully described in section 3. From now onwards medicines will be considered to compete within market segments, which are defined by their active ingredients and therapeutic similarity24. Also each different presentation – i.e. different dosages, packaging, etc. – is considered as a different product, even if supplied by the same company. However, the number of incumbent companies per active ingredient is computed without taking into account the different available products25.
According to the final dataset, during the period 2004-2010, the average product sold in Uruguay cost 46 US dollars to the final consumer and about 30 US dollars to the retailer (see Table 6). On average, there are less than 5 different companies supplying a given product, which appears in 14 different varieties – i.e. different dosages, delivering routes and quantities. However, in around 12% of the cases, there is only one company supplying the active ingredient contained in the product.
Concerning IP protection, two out of three products in our dataset contain an active ingredient protected with at least one patent granted in the US. Totaling about 58.5 US dollars, the average price for these products is roughly 12 dollars higher than the overall average. Additionally, the market structure for these products does not appear to be markedly different, with numbers of varieties and competitors being close to the overall average. The relative difference between retailer and wholesale prices is approximately the same. Similarly, market structure does not strikes as significantly different, where products and competitors are very close to the overall average. Even more, the proportion of observations in market segments with only one supplying company is slightly lower.
Patent protection in Uruguay – either sought or granted – affects a considerably lower proportion of products in the market. About 6.5% of them have an active ingredient for which patent protection has been sought in Uruguay and in roughly half of those cases (3.4%) was the patent granted. Where a patent was pending or granted, prices are substantially higher than the overall one, averaging 110 and 113 US dollars, respectively. However, the number of competitors and varieties is not substantially different. The only exception is that market segments protected by a patent filed in Uruguay – although not necessarily granted – have
24 In concrete terms, we define as a market segment all products with the same active ingredient and same therapeutic application. In some cases, we will relax this to include products with different active ingredients but similar therapeutic application. We use the therapeutic similarity provided in the FA data.25 Refer to Danzon and Kim (1998) for a discussion on the challenge of using medicines unit record data.

CDIP/13/INF/5Annex, page 63
signs of less competition. However, in the case of granted patents in Uruguay, these figures are similar to the whole panel averages.
Table 6: Descriptive statistics of selected variables in final panel
Sources: Farmanuario (2012), Orange Book (2012), DNPI(2012) and PATSTAT(2013). Notes: Only active ingredients found in Orange Book (2012). Companies grouped whenever corporate information was available. Period 2004-2010.
A non-negligible amount of the patent protected active ingredients is likely not to be in force anymore (Figure 30). For about two thirds of the patent protected products (43% of all products) the earliest filing has occurred 20 or more years ago26. It can be argued that, after 20 years of the first filing for an active compound, patents would not be in force any longer.27 Moreover, some of these are likely to have expired even before due to not maintaining the patents until the end. On the other hand, other related filings – e.g. secondary use, methods, etc. – could still be in force and, in some cases, may be part of an “ever-greening” strategy (C. M. Correa, 2011). For practical reasons, this will be considered as an indication of probable expiration28. In any case, most variables are not significantly different for market segments with likely expired patent protection (Table 6).
This panel can also bring to light the situation within these different categories of protection. For instance, from the 202,793 observations (66% of total) in a US patent protected market segment, only 15.2% correspond to the original protected products, 41.4% compete to these and 43.4% are in a segment without the original product29. The share of observations in a segment without the original product drops to 22% and 16% for those protected in Uruguay by a patent filing or granted, respectively. There is a certain increase in concentration in favor of
26 We refer here to the earliest filing within the same patent family as in PATSTAT.27 This may not be the case for some patents filed in the US before the legal reforms extending the US patent term, as implemented through the Uruguay Round Agreements Act.28 20 years after the earliest patent family filing is established as the threshold for expiration. There are straightforward limitations of such measure, however and unfortunately, there is no precise information on patent status available for the entire panel.29 This Study considers as much as possible the corporate M&As, licensing and other commercialization agreements (refer to section 3).

CDIP/13/INF/5Annex, page 64
those products protected by patent filings in Uruguay. However, and similar to the monopoly variable, this is not apparent for those products protected by granted patents in Uruguay, where competing products increase in relative terms. Similarly, no distinctive pattern is observed for those observations in protected segments where the IP is likely to have expired. Overall, it seems that patent protection increases the likelihood of observing the original product in the local market, but the expiration does not affect their presence on it (Table 6).
Figure 30: Patent ‘age’ of protected active ingredients
Sources: Farmanuario (2012), Orange Book (2012), DNPI(2012) and PATSTAT(2013). Notes: Only patent protected active ingredients found in Orange Book (2012). Earliest filing within patent family considered.
Table 7: Correlation of selected variables in final panelVariables 1 2 3 4 5 6 7 8 9 10 11
1 Price (current USD, logs) 1.000
2 Products -0.263 1.000
3 Competitors (logs) -0.311 0.731 1.000
4 Monopoly 0.213 -0.354 -0.717 1.000
5 Protected AI (patent granted US) 0.138 0.061 0.097 -0.060 1.000
6 Protected AI (patent filed Uruguay) 0.140 -0.030 -0.050 0.028 0.189 1.000
7 Protected AI (patent granted Uruguay) 0.110 0.028 0.013 -0.005 0.135 0.718 1.000
8 AI patent protection expired 0.108 0.042 0.072 -0.033 0.619 0.105 0.090 1.000
9 Protected product 0.358 -0.126 -0.181 0.157 0.240 0.137 0.091 0.202 1.000
10 Competing product 0.007 0.151 0.224 -0.171 0.440 0.148 0.138 0.397 -0.203 1.000
11 No protected product -0.099 -0.002 0.001 0.002 0.455 -0.040 -0.054 0.123 -0.212 -0.388 1.000
Sources: Farmanuario (2012), Orange Book (2012), DNPI(2012) and PATSTAT(2013). Notes: Only active ingredients found in Orange Book (2012). Companies grouped whenever corporate information was available.
Table 7 displays the Pearson correlation matrix of a selection of variables. As expected, prices of medicines are negatively correlated with product variety and competition, while positively correlated with monopoly. Concerning IP, we observe a positive correlation of price and IP protection at the active ingredient level, regardless where and if granted or not. However, products containing active ingredients with expired patent protection are also correlated with

CDIP/13/INF/5Annex, page 65
higher prices. The link between competition and IP is even less apparent. Products containing active ingredients which are protected with US patents correlate positively with more competitors and negatively with monopoly. In the case of patent protection sought in Uruguay, there is the opposite and more expected pattern. However, IP appears again positively correlated with higher competition when the active ingredient has been granted patent protection in Uruguay.
Reverse causality may explain these odd results. This is the case if patent protection works as an indicator of more profitable medicines. If a given market segment is more profitable – ignoring for a moment if they are protected or not – more companies are willing to enter it. The positive correlation between protection expiration and prices gives some support to this explanation. In any case, the unexpected correlations certainly indicate some uncontrolled heterogeneity in these pairwise statistics, which will be investigated further below.
Figure 31: Market concentration by Active ingredient
Source: Farmanuario (2012). Notes: Only active ingredients found in Orange Book (2012). Companies grouped whenever corporate information was available.
On the market segment heterogeneity
As already documented for the Uruguayan market (CENES et al., 2000; COMISEC, 2006; Oddone & Failde, 2006), our panel shows that there is substantial heterogeneity across and within medicines of the same therapeutic group, both in terms of price, competition and IP protection. Furthermore, the heterogeneity of these three economic indicators does not seem to correlate as much in practice, as expected in theory.
Concerning the market structure, more than 40% of the active ingredients have only one supplying company. Moreover, the trend seems to be one of slightly increasing concentration. The figures for active ingredients supplied by only one company have remained relatively stable

CDIP/13/INF/5Annex, page 66
from 2004 to 2010, having seen a small increase in absolute terms and a small decrease in relative ones (Figure 31). However, those supplied by only two or three companies have increased in both absolute and relative terms at the expense of those supplied by four or more companies. Therefore, in 2010, three quarters of active ingredients were supplied by three or less companies.
To account for any bias issued from 839 active ingredients being too fine grained as market segment, Figure 32 shows the concentration for three different levels of aggregation according to the original FA data: TC Level 1 (28 classes), TC Level 2 (158 classes) and TC Level 3 (332 classes). Results remain qualitatively the same: therapeutic groupings at any level are supplied by three or less companies in more than half of the cases and by only one company in roughly a third of the cases. This also indicates a certain specialization pattern across companies, as for 30% of the first level of therapeutic classes there is only one supplying company.
Figure 32: Market concentration by Therapeutic class
Source: Farmanuario (2012). Notes: Therapeutic class aggregation is from Farmanuario. Only active ingredients found in Orange Book (2012). Companies grouped whenever corporate information was available.
As expected, there is a correspondence between the market structure and prices. The average price for a given active ingredient is about 123 US dollars (Table 8). Active ingredients supplied by only one company see an average price substantially above this mean, around 230 dollars. Already when supplied by two or more companies, the average price is considerably below the overall mean. The picture is less evident for patent protection, where the breakdown by the number of companies does not reveal any clear differences. The main pattern is roughly that 55-70% of the active ingredients are protected by patents in the US, while only 6-9% relate to a patent filed in Uruguay and 2-4% to a granted one. Roughly, one every two patent protected active ingredients has the original protected product available in the Uruguayan market. This proportion is considerably higher for those products also protected either by filed and granted patents in Uruguay, although the absolute numbers are relatively low as they account just for 5% and 3% of all active ingredients, respectively.

CDIP/13/INF/5Annex, page 67
Table 8: Market structure, prices & IP
in the US in the US
granted filed granted granted filed granted
1 282 230.7 61.0% 6.4% 2.5% 34.0% 4.6% 2.5%
2 155 88.2 55.5% 8.4% 3.9% 25.8% 4.5% 1.9%
3 97 89.1 61.9% 8.2% 2.1% 29.9% 6.2% 2.1%
4 80 61.4 62.5% 6.3% 3.8% 37.5% 6.3% 3.8%
5 62 48.3 61.3% 6.5% 3.2% 30.6% 3.2% 1.6%
>5 163 50.0 69.9% 6.7% 3.7% 41.7% 5.5% 3.7%Total 839 123.3 62.0% 7.0% 3.1% 33.6% 5.0% 2.6%
Companies AI Freq.
Price(USD)
…& protected product in marketAI has patent
in Uruguay in Uruguay
Sources: Farmanuario (2012), Orange Book (2012), DNPI(2012) and PATSTAT(2013). Notes: Only active ingredients found in Orange Book (2012). Companies grouped whenever corporate information was available. Computed for active ingredients.
Table 9: IP use & Market prices across therapeutic classes
Price Competitors MonopolyGranted US
PatentFiled in
UruguayGranted in Uruguay Expired
Antivirals 330.90 3.2 15% 98% 33% 26% 59%Oncology 330.05 3.5 18% 77% 3% 0% 44%
Immunology 233.09 2.5 21% 81% 57% 0% 72%Endocrinology 81.12 3.4 14% 48% 5% 5% 17%
Gynecology 73.15 2.3 42% 82% 18% 4% 59%Antimycotics 64.20 4.2 29% 84% 0% 0% 72%
Haematology 59.15 3.1 18% 29% 9% 0% 24%Anesthesiology 51.64 4.1 16% 69% 1% 0% 40%
Neurology 34.40 4.1 11% 57% 6% 6% 40%Diabetes 29.51 4.4 21% 89% 9% 6% 53%
Ophthalmology 29.17 4.2 21% 77% 2% 0% 49%Pneumology 26.42 3.9 12% 41% 11% 5% 31%
Antibiotics 25.98 4.9 7% 54% 11% 0% 20%Rheumatology 22.28 4.3 17% 46% 18% 0% 40%
Dermatology 18.90 5.8 14% 49% 0% 0% 34%Psychiatry 18.90 4.9 8% 73% 14% 10% 46%
Gastroenterology 18.16 6.1 9% 67% 2% 0% 48%Nutrition 16.25 5.6 8% 41% 0% 0% 21%
Analgesics 15.55 6.1 6% 74% 0% 0% 60%Cardiovascular 15.09 5.3 6% 79% 7% 7% 53%
Antiparasitics 15.01 4.0 27% 29% 0% 0% 20%Urology 14.79 4.4 9% 89% 0% 0% 46%
Otorhinolaryngology 13.36 3.5 10% 80% 0% 0% 36%Inflammatory 13.12 5.5 8% 73% 0% 0% 48%
Allergic 8.15 5.0 6% 90% 0% 0% 68%Antiseptics 7.29 4.3 1% 2% 0% 0% 1%
Total 46.11 4.7 12% 66% 6% 3% 43%
Average AI protectedTherapeutic class
(level 1)
Sources: Farmanuario (2012), Orange Book (2012), DNPI(2012) and PATSTAT(2013). Notes: Prices in current US dollars. Therapeutic class aggregation is from Farmanuario. Only active ingredients found in Orange Book (2012).
Companies grouped whenever corporate information was available.
We observe a positive correlation between price and patent protection, regardless of where the patent was filed and if it was granted or not. However, products containing active ingredients with expired patent protection also show higher prices. Moreover, the link between market competition and patent protection is less clear, sometimes even showing a positive correlation.

CDIP/13/INF/5Annex, page 68
These are interpreted as symptom of market heterogeneity. This heterogeneity appears between groups of medicines of similar therapeutic properties, as well as within these groups.
Similarly, the relation between patent protection and prices is not evident. Price variability within protected active ingredients as well as within those products competing with protected products can be substantial. Moreover, similar to Oddone & Failde (2006), there is significant variability across therapeutic classes (Table 9). For instance, in the first level of aggregation, the three most expensive therapeutic classes are: antivirals (average price of 331 USD), oncology (330 USD) and immunology (233 USD). More than three quarters of the products contained in them have active ingredients protected by an US patent. However, mainly antivirals and immunology have sought patent protection in Uruguay and only the former has seen some of the patents applied for granted. In the same vein, many therapeutic classes with a similar share of products containing protected active ingredients see substantially lower prices. For instance, products in the ophthalmology therapeutic class (29 USD) exhibit a similar average protection pattern than those in the oncology one, but their average prices differ ten times. Similarly patent protection expiration and market competition do not show a clear-cut relation with average market prices.
Table 10: IP use & Market prices across therapeutic classes (UCA-MEF)
Freq. Price per unit Price bid Amount bid Granted
Not granted
Only one tender
Granted US Patent
Filed in Uruguay
Granted in Uruguay
Antivirals 24 11.95 357.35 1'090'665 79% 13% 21% 100% 8% 8%Oncology 287 37.25 155.83 9'901'682 82% 17% 25% 74% 6% 2%Immunology 55 27.60 116.93 1'633'509 73% 11% 13% 96% 49% 0%Gynecology 130 52.59 54.90 4'599'653 78% 18% 36% 81% 9% 3%Endocrinology 144 40.83 44.29 4'669'233 74% 22% 25% 42% 3% 3%Rheumatology 73 12.71 29.45 1'148'149 77% 16% 29% 64% 23% 0%Nutrition 49 9.20 28.57 5'678'279 76% 24% 51% 51% 0% 0%Anesthesiology 98 13.58 24.09 5'968'319 78% 21% 27% 60% 4% 0%Haematology 118 3.23 18.88 2'613'424 78% 21% 19% 34% 4% 0%Ophthalmology 133 5.71 17.91 4'268'658 78% 20% 34% 68% 2% 0%Diabetes 77 10.07 16.93 5'310'259 96% 4% 30% 79% 10% 5%Neurology 204 1.55 13.85 8'142'447 82% 12% 25% 57% 7% 7%Antibiotics 290 4.15 12.51 20'421'912 90% 7% 26% 42% 10% 0%Antiparasitics 46 1.95 12.50 2'546'031 78% 20% 35% 24% 0% 0%Analgesics 113 1.47 12.12 3'328'989 74% 14% 27% 65% 0% 0%Pneumology 113 10.86 11.90 4'949'698 79% 11% 24% 60% 17% 9%Dermatology 108 4.13 10.89 3'209'714 76% 16% 29% 51% 0% 0%Gastroenterology 208 1.53 8.35 5'496'433 78% 14% 21% 63% 0% 0%Otorhinolaryngology 32 5.76 7.41 968'655 69% 13% 19% 69% 0% 0%Antiseptics 85 5.93 5.92 1'105'356 27% 64% 9% 52% 0% 0%Inflammatory 88 0.44 5.15 3'717'016 81% 13% 22% 64% 0% 0%Psychiatry 286 0.89 4.87 12'706'261 77% 12% 19% 48% 10% 6%Cardiovascular 370 2.28 4.66 11'088'028 78% 17% 22% 62% 6% 6%Antimycotics 17 2.36 3.93 147'742 59% 41% 12% 53% 0% 0%Urology 51 1.23 2.89 682'635 84% 16% 33% 65% 0% 0%Allergic 71 1.01 2.47 2'528'532 82% 11% 31% 70% 0% 0% Total 3631 11.21 30.17 149'527'513 79% 16% 24% 56% 6% 2%
Therapeutic class (level 1)
AI protected (%)Bid (%)Average (in USD)
Sources: UCA-MEF(2013), Farmanuario (2012), Orange Book (2012), DNPI(2012) and PATSTAT(2013). Notes: Prices in current US dollars. Therapeutic class aggregation is from Farmanuario. Only active ingredients found in Orange Book (2012).

CDIP/13/INF/5Annex, page 69
These results also extend to the public procurement UCA-MEF data (Table 10). In particular, there is no direct link between the bid having only one tender or not being granted and the active ingredient being protected with patents. The frequencies of winning bids as well as the allocated amounts to patent protected products stand at around 56% for those protected by patents in the US, 6% for those also filed in Uruguay and 3% for those which were granted in Uruguay. These shares are similar to the distribution we observed for the whole Uruguayan market (Table 6).
Figure 33: Market Entry and Exit of products
Source: Farmanuario (2012). Notes: Only active ingredients found in Orange Book (2012). Entry=first observation in panel. Exit=last observation in panel.
On the market dynamics
Patent protected active ingredients, as well as the products containing them, are more likely to be newer in the market. Interestingly, they are also more likely to stay in it longer. As displayed in Figure 33, about 30% of the products are observed for the first time in the panel during the first three months (i.e. before April 2004) and about 52% during the first year (2004). Conversely, about 54% of the products appear for the last time during 2010. Therefore, 2004 and 2010 could be considered as safety margins when measuring entry and exit, respectively. As such, it can be fairly assumed that 48% of the products in the sample entered the local market during 2005-2010 and 46% left it during 2004-200930. Keeping in mind the limitations of such approach, this suggests a quite dynamic market, where the average product life cycle is about 12 years. Moreover, the entry and exit dynamics for products competing in patent protected segments seem rather similar to the general ones (Figure 33, right panels). If
30 It is worth recalling that, as explained in section 3, “products” cannot be univocally determined.

CDIP/13/INF/5Annex, page 70
anything, it seems that there are slightly more entries (51% in 2005-2010) and fewer exits (43% in 2004-2009) for those with patent protected ingredients.
While more skewed, there is a qualitatively similar picture when analyzing entry and exit of active ingredients. As shown in Figure 34, about 80% of the active ingredients are observed for the first time during 2004 and 85% for the last time during 2010. Using the same criteria than before, this means that about 20% new active ingredients appear during the period 2005-2010. Similarly, about 15% active ingredients become discontinued without any product containing them during 2004-2009. Even if not outstandingly apparent in Figure 34 (right panels), those active ingredients protected by patents are relatively more likely to enter and less to exit. Indeed, about 25% of patent protected active ingredients have entered the market during 2005-2010, while only 12% have exited it during 2004-2009.
Figure 34: Market Entry and Exit of Active Ingredients
Source: Farmanuario (2012). Notes: Only active ingredients found in Orange Book (2012). Entry=first observation in panel. Exit=last observation in panel.
However, this does not necessarily suggest that IP favors speed-to-market, as several of these active ingredients are likely to have seen their patents expire and most of them have never sought protection in Uruguay. In that sense, the share of active ingredients and products without patent protection is slightly decreasing over time (Figure 35, left panel). US patents protected about 58% of the active ingredients sold in Uruguay in the early 2005, while 64% in the late 2010. However, about one third of the patent protected active ingredients are likely to have their rights expired in January 2005 and about half of them in December 2010. Therefore, one can argue that, in the period 2005-2010, the amount of unprotected active ingredients and products actually increased, from 73% to 84%. When considering only the patenting activity in Uruguay, the share of unprotected active ingredients and products is even larger.
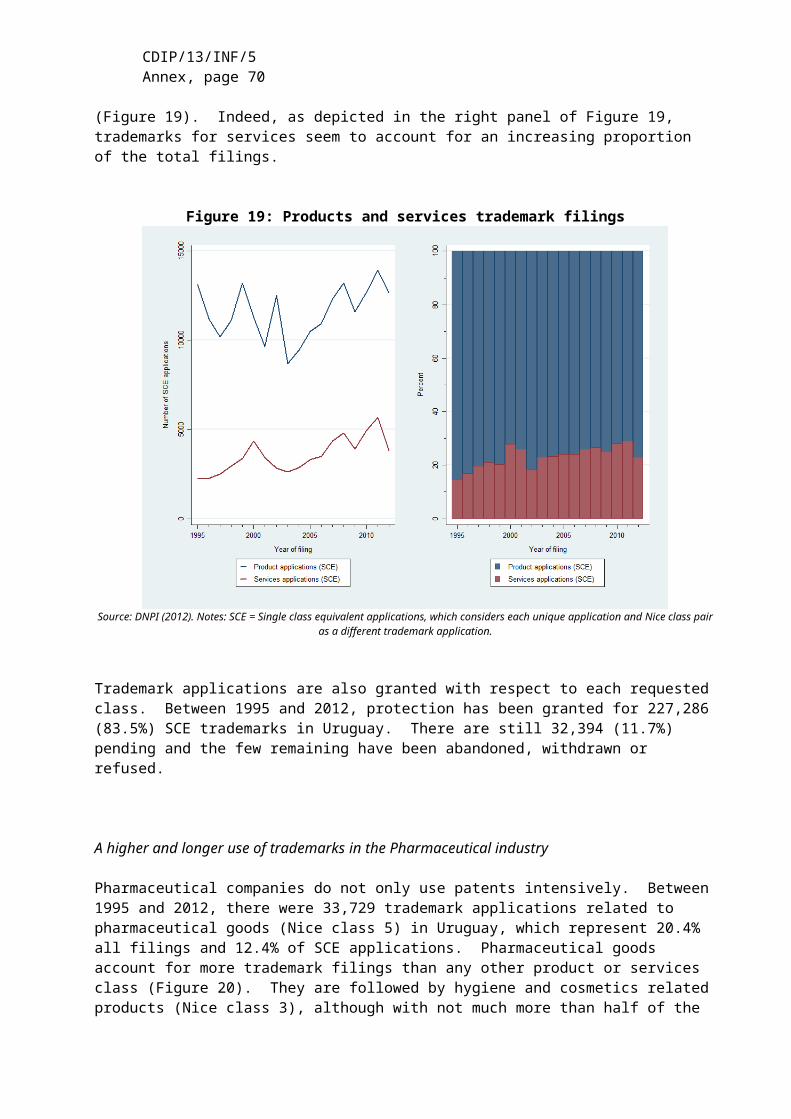
CDIP/13/INF/5Annex, page 71
Once more, there is a relatively similar pattern for products and active ingredients (Figure 35, right panel). Even if small, the comparison suggests that there are more products in patent protected segments. Yet, this is compensated by a higher proportion of products in segments with expired patent protection, which makes the overall proportion of unprotected products equivalent to the one of active ingredients. The fact that there is a larger proportion of products in patent protected segments seems counterintuitive, as patent holders are expected to use their exclusion rights. However, this is likely to be explained by the fact that many of these have not actually sought protection in Uruguay. Again, this indicates that patent protection only abroad may correlate with higher prices – and implicitly value – of a given market segment. This would explain that products are not only more likely to enter markets where protection has expired but also because these are probable just more profitable ones
Figure 35: Patent protection & expiration of Active Ingredients
Source: Farmanuario (2012). Notes: Only active ingredients found in Orange Book (2012).
There is at least some empirical support for this argument. First, there is no clear-cut correlation between the timing of the expiration of patent protection and the introduction of new products in those market segments (Figure 36). Part of these is to be attributed to the limitations of the measure for patent expiration. However, and second, there are price differences between market segments but substantially less within them. As in previous findings (Uruguay XXI, 2011), average prices in US dollars have grown approximately 50% during the panel’s covered period, but this is also the case for patent protected products and those competing in the same patent protected market segment.

CDIP/13/INF/5Annex, page 72
Figure 36: Protection expiration & entry
Source: Farmanuario (2012). Notes: Only active ingredients found in Orange Book (2012).

CDIP/13/INF/5Annex, page 73
Multivariate analysis on the link between IP and market conditions
Given the mixed evidence from the descriptive analysis and dynamics of the relation between patent protection with market structure and prices, we now turn to a multivariate analysis. Indeed, several descriptive results and certainly some unexpected correlations found in the previous sections suggest the existence of significant uncontrolled heterogeneity affecting prices, market structure and IP protection. This clearly advocates for a multivariate analysis, which we conduct as follows.
We intend to tackle two different methodological challenges. First, given its exclusion rights, we expect IP protection to affect the market structure for a given protected medicine, reducing the amount of suppliers. This, in turn, should increase the final price as we move away from competition conditions. This means that IP protection should affect both the market structure and prices, although the latter only through the former. We attempt to account for this endogenous structure by including the market structure as predictor of price and vice versa. 31 The second challenge concerns the valuation of each market segment. As seen in the previous analysis, there is considerable heterogeneity on prices across market segments. It is expected that more profitable therapeutic properties – e.g. HIV or oncological treatments – provide higher incentives for new entry, as well as incentives to incumbents to protect their position. As discussed above, the heterogeneity across medicines of different therapeutic classes is substantial. For that reason, we frame the analysis as comparisons within therapeutic classes using fixed-effects analysis. This implies comparing the market structure or price with the average one within the chosen level of therapeutic similarity. In other terms, for each product we observe if the price (or market competition) is higher or lower than the average of all therapeutically similar products. As apparent on each of the following estimation results, the fixed-effects – i.e. the group’s average – explain a substantial portion of the variability. Labelled as Rho, it ranges between 40 to 96% of all the variables of interest. Conversely, the amount of the variability explained by the models remain quite modest, suggesting that there are other factors to be accounted for.
For the purposes of analyzing market concentration two different variables reflecting the market segment structure are computed. The first one is the amount of companies competing in the same market segment – defined as the same active ingredient – and the second one is simply a dichotomous variable distinguishing if a particular market segment has only one supplying company or not. For the sake of simplicity, these are labeled as competition and monopoly, respectively. It is worth remarking that, by construction, these two variables have no variation at the product level. Therefore the unit of analysis reflects the market structure for 332 active ingredients over time, totaling 55,111 observations. These are compared in relation to the levels 1 to 3 of Farmanuario’s therapeutic classification32.
Table 11 and Table 12 display the results on the average impact of patent protection in the likelihood of having only one supplying firm, as well as the elasticity of the amount of competitors supplying medicines with a given active ingredient. Both have estimations with and without the average price as a control variable, although this change shows little impact on the qualitative results. Without putting too much focus on the controls, it is worth noting that one percent devaluation of the Uruguayan peso with respect to the US dollar increases the likelihood of finding one single supplier by 0.15-0.25% and decreases the average amount of
31 It is worth mentioning that both variables show significant autocorrelation, which makes any more sophisticated attempt to tackle endogeneity particularly more complicated. 32 Full estimation results for each therapeutic class level are displayed in annex tables; including the baseline models without any patent protection variables (see pp.88-90).

CDIP/13/INF/5Annex, page 74
suppliers by 0.3-0.5%. Similarly, higher prices are observed to correlate positively with the likelihood of observing a monopoly and negatively with the amount of competition.
In Table 11, we measure patent protection as the proportion of patent-protected products within the same therapeutic class, distinguishing by the jurisdiction and status of the patents. As expected, results from the multivariate analysis suggest a negative correlation between the proportion of patent protected products and competition, and a positive correlation with the likelihood of observing a single supplier. However, particularly for the likelihood of observing one single supplier, estimated elasticities often fail to be statistically significant. Moreover, there is no apparent stronger effect of patenting domestically – either pending or granted – when compared to just patenting abroad. In other words, estimations indicate that, on average, the entry of products protected just by patents in the US shows a similar effect as the entry of products also protected by patents in Uruguay. They implicitly suggest that the mechanism determining how patent protection affects competition might have less to do with the exclusionary use of patents than what one might expect.
Table 11: Effects of IP on market structure
Variables (1) (2) (3) (4)ex.rate UYU/USD (logs) 0.141*** 0.223*** -0.301*** -0.424***
(0.034) (0.037) (0.036) (0.046)time 0.053 0.032 -0.156*** -0.124***
(0.034) (0.036) (0.037) (0.039)Price (AI, logs) 0.089*** -0.133***
(0.022) (0.026)Patent protected products (patent US only,% ) 0.098 0.016 -0.163** -0.040
(0.063) (0.065) (0.081) (0.084)Patent protected products (pending UY,%) 0.239 0.198 -0.228 -0.167
(0.397) (0.399) (0.429) (0.439)Patent protected products (patent UY,%) 0.518 0.468 -0.786** -0.711**
(0.338) (0.340) (0.339) (0.341)Constant -0.346 -0.753*** 2.574*** 3.182***
(0.271) (0.275) (0.280) (0.306)FEs TC3 TC3 TC3 TC3Observations 55,111 55,111 55,111 55,111Groups 332 332 332 332F 4.8 7.1 15.8 15.8R2 0.002 0.020 0.003 0.025rho 0.447 0.442 0.480 0.475
Monopoly (AI, dummy) Competition (AI, logs)
Notes: *** p<0.01, ** p<0.05, * p<0.1. Coefficients recomputed to reflect elasticities and semi-elasticities in percents

CDIP/13/INF/5Annex, page 75
Table 12: Effects of IP on market structure
Variables (1) (2) (3) (4)ex.rate UYU/USD (logs) 0.145*** 0.253*** -0.307*** -0.477***
(0.034) (0.039) (0.037) (0.050)time 0.057* 0.029 -0.162*** -0.118***
(0.034) (0.036) (0.036) (0.039)Price (AI, logs) 0.119*** -0.187***
(0.024) (0.030)AI with original Product (patent US) -10.221* -19.628*** 15.359* 37.270***
(6.550) (6.594) (7.977) (8.531)AI with original Product (filing UY) 4.055 4.670 -12.821 -13.624
(20.072) (18.958) (21.036) (19.150)AI with original Product (patent UY) 9.052 9.275 9.722 9.370
(23.259) (21.951) (30.186) (28.100)Competing AI (patent US) 1.972 -2.886 -11.116* -4.029
(5.609) (5.664) (6.450) (6.807)Competing AI (filing UY) 6.864 8.928 0.005 -2.956
(13.252) (11.939) (12.190) (10.779)Competing AI (patent UY) 2.603 1.248 -9.489 -7.579
(14.954) (14.445) (17.413) (17.473)AI without original (patent US) 5.848 3.971 -12.862** -10.377
(5.625) (5.856) (6.620) (7.107)AI without original (filing UY) 3.326 4.498 3.502 1.683
(10.485) (10.209) (10.079) (9.948)AI without original (patent UY) -19.846** -20.524** 16.933 18.503
(11.444) (11.327) (14.010) (14.421)Constant -0.351 -0.853*** 2.609*** 3.398***
(0.268) (0.276) (0.279) (0.310)FEs TC3 TC3 TC3 TC3Observations 55,111 55,111 55,111 55,111Groups 332 332 332 332F 4.27 6.95 7.97 9.63R2 0.011 0.040 0.025 0.065rho 0.474 0.452 0.511 0.488Notes: *** p<0.01, ** p<0.05, * p<0.1. Coefficients recomputed to reflect elasticities and semi-elasticities in percents
Monopoly (AI, dummy) Competition (AI, logs)
Table 13: Effects of IP on market structure (summary)
Competition TC1 TC1 TC2 TC2 TC3 TC3 TC1 TC1 TC2 TC2 TC3 TC3Patent in US 16.5 34.3 22.4 37.9 29.8 43.0 19.9 36.6 45.1 65.8 32.4 53.2
+ Filing in Uruguay -0.1 15.6 2.6 18.5 13.1 27.3 23.3 38.5 25.1 40.4 11.5 30.1+ Patent in Uruguay 19.9 42.1 25.5 41.0 37.2 50.7 30.9 51.3 23.4 42.9 4.6 20.1
(controls for AI price) no yes no yes no yes no yes no yes no yes
Monopoly TC1 TC1 TC2 TC2 TC3 TC3 TC1 TC1 TC2 TC2 TC3 TC3Patent in US -8.7 -17.5 -10.8 -18.7 -12.7 -18.9 -7.4 -15.5 -21.4 -30.1 -16.5 -25.7
+ Filing in Uruguay -6.9 -15.9 -9.9 -19.4 -15.4 -22.9 -21.5 -28.7 -24.3 -31.8 -15.8 -25.6+ Patent in Uruguay -2.2 -12.7 -5.8 -13.5 -9.3 -15.3 -5.5 -14.5 -4.9 -14.6 15.0 6.3
(controls for AI price) no yes no yes no yes no yes no yes no yes
Original vs. Unprotected rivals Original entry
Original vs. Unprotected rivals Original entry

CDIP/13/INF/5Annex, page 76
We assess the impact of patent protection differently in Table 12. There we introduce in the estimation a series of dummies to make the explicit distinction between active ingredients with and without the original patent protected product available in the domestic market. Additionally, another set of dummies flags those unprotected active ingredients which compete in the same therapeutic class with a protected one. The underlying reference group contains those non-patent protected active ingredients in the same therapeutic class. Therefore, the estimated coefficients can be interpreted as percentages above (or below) this underlying reference33. For instance, the resulting estimation shows that those active ingredients protected by a patent in the US and having the original product commercialized in the domestic market have, in average, 15-40% more supplying companies and they are 10-19% less likely to be a monopoly than those non-protected in the same therapeutic class. Conversely, when the original patent protected product is not commercialized in Uruguay, they are 10-13% less supplying companies and 4-6% more likely to be a monopoly than for non-protected active ingredients.
Table 13 summarizes the coefficients in Table 12 by aggregating them in two more directly linked categories. Firstly, we compare the semi-elasticities of the originally patent protected active ingredient which are commercialized in Uruguay in relation to their unprotected rivals. We observe that original patent protected active ingredients have higher competition when compared to therapeutically similar unprotected ones. For instance, patent protected market segments are 9-23% less likely to be a monopoly and they have 13-51% more supplying companies than their unprotected rivals, when compared at the third level of therapeutic classes. This result holds regardless of where patent protection was sought. Secondly, we intend to capture the effect of the entry of the originally protected active ingredient by comparing the market structure of patent protected segments with and without the original product being commercialized in Uruguay. On average, the entry of the original patent protected product is correlated with an increase in competition and the decrease in the likelihood of monopoly. These results appear to be at odds with theory, although they are fairly robust to any level of therapeutic similarity chosen.
Table 14 and Table 15 show a similar analysis for market prices controlling for the average within similar therapeutic classes.34 Given that prices are available at the product level, estimation results allow us for an additional fourth level of therapeutic similarity, which is roughly the active ingredient. We estimate market prices using natural logarithms, which allow the analysis of elasticities and semi-elasticities.35 All estimations have controls for exchange rate fluctuations and linear time trends. Additionally, in order to account for the endogenous effect of market concentration, we perform all estimations with and without the amount of supplying companies as a control, although results remain qualitative the same.
As shown in Table 14, the proportion of patent protected products in a given active ingredient correlates with higher prices. For instance, a percent point increase of protected products correlates with 0.6-1.2% increase of prices. In other terms, a market segment containing only patented products will be in average 66 to 123% more expensive than one without any patented product being commercialized in Uruguay. However, in general, we do not observe any major difference between patenting only abroad and doing it also domestically. Indeed, most of the times we find only statistically significant effects for the US patenting activity, especially if the patenting is still pending in Uruguay.
33 Tables in this section have been reconditioned to express elasticities and semi-elasticities in percent points. In particular, semi-elasticities of dummy variables follow the correction in Halvorsen and Palmquist (1980). 34 Idem 32. 35 Idem 33.

CDIP/13/INF/5Annex, page 77
Table 14: Effects of IP on market prices
Variables (1) (2) (3) (4)-0.796*** -0.848*** -0.801*** -0.813***(0.021) (0.024) (0.021) (0.021)
0.253*** 0.224*** 0.189*** 0.183***(0.032) (0.034) (0.028) (0.029)
0.196*** 0.196*** 0.202*** 0.202***(0.071) (0.071) (0.078) (0.078)
-0.179*** -0.043**(0.031) (0.017)
1.230*** 1.142*** 0.666*** 0.651***(0.121) (0.118) (0.057) (0.056)
1.386*** 1.201*** 0.426 0.425(0.268) (0.257) (0.331) (0.313)
1.356*** 1.224*** 1.157*** 1.114***(0.206) (0.195) (0.205) (0.209)
3.458*** 4.035*** 3.891*** 4.020***(0.208) (0.242) (0.187) (0.198)
FEs TC3 TC3 TC4 TC4Observations 307,472 307,472 307,472 307,472Groups 332 332 839 839F 403.1 325.6 422.4 357.5R2 0.124 0.137 0.082 0.083rho 0.728 0.724 0.820 0.819
Method: Linear Regression DV=Price (Product, logs)
Notes: *** p<0.01, ** p<0.05, * p<0.1. Coefficients recomputed to reflect elasticities and semi-elasticities in percents
ex.rate UYU/USD (logs)
time
unit
Competition (AI, logs)
Patent protected products(patent US only,%)Patent protected products(pending UY,%)Patent protected products(patent UY,%)Constant
Similar to Table 12, in Table 15 we seek to assess the effect of patent protection with a series of dummies distinguishing the original patent protected products – which are commercialized in Uruguay – from those competing with them in the same market segment. Again, we make use of another set of dummies to flag those products which are in market segments protected by patents but do not face the competition of the original protected products. The underlying reference group contains those products in unprotected market segments up to the third level of therapeutic class. The results using fixed-effects at the active ingredient level – i.e. TC4 – have a qualitatively different interpretation. In this case, by design, we focus on the differences between original and competing products within protected market segments, having as reference those products which are unprotected or not competing with the original product. Therefore, these results reflect the impact on prices of the presence – including entry – of the patent protected original product within the market segment, while the other fixed-effects – i.e. TC1 to TC3 – reflect also the impact on competing therapeutically similar molecules, but not necessarily equivalent.

CDIP/13/INF/5Annex, page 78
Table 15: Effects of IP on market prices (cont.)
Variables (1) (2) (3) (4)-0.785*** -0.842*** -0.802*** -0.813***(0.021) (0.025) (0.020) (0.021)
0.254*** 0.224*** 0.187*** 0.183***(0.033) (0.036) (0.028) (0.029)
0.195*** 0.196*** 0.202*** 0.202***(0.071) (0.072) (0.078) (0.078)
-0.220*** -0.042**(0.032) (0.017)
142.937*** 150.921*** 86.955*** 88.917***(10.087) (9.848) (4.035) (4.021)16.006 5.031 -19.819 -19.326
(19.600) (18.141) (19.596) (18.932)5.006 15.025 83.423*** 80.309***
(25.549) (23.498) (23.577) (22.966)11.124 23.009** -2.698 -1.378(9.219) (9.415) (1.941) (2.054)39.142 29.786 -5.716 -5.197
(27.561) (25.550) (8.941) (8.452)-36.341* -28.337 18.475 17.010(27.690) (25.669) (12.840) (12.566)-1.636 3.221(8.672) (8.502)17.393 7.932
(20.901) (18.632)-13.548 -3.725(21.230) (17.176)3.428*** 4.040*** 3.916*** 4.029***(0.223) (0.252) (0.187) (0.197)
FEs TC3 TC3 TC4 TC4Observations 307,472 307,472 307,472 307,472Groups 332 332 839 839F 232.3 206.4 349.0 310.2R2 0.153 0.171 0.132 0.132rho 0.748 0.738 0.829 0.827
unit
ex.rate UYU/USD (logs)time
Method: Linear Regression DV=Price (Product, logs)
Competition (AI, logs)Original Product(patent US)Original Product(filing UY)Original Product(patent UY)Competing Product (patent US)Competing Product (filing UY)
Notes: *** p<0.01, ** p<0.05, * p<0.1. Coefficients recomputed to reflect elasticities and semi-elasticities in percents
Competing Product(patent UY)AI without original(patent US)AI without original(filing UY)AI without original(patent UY)Constant

CDIP/13/INF/5Annex, page 79
We first focus on the results using fixed-effects at third level of therapeutically similar products (TC3). When compared to the reference unprotected product in an also unprotected market segment, there is very limited impact of patent protection besides the one observed for original products protected in the US. These products are roughly 142-151% more expensive than therapeutically similar products in unprotected market segments. However, unprotected products competing in US patent protected market segments are also more expensive than these – about 11-23% higher – although not always statistically significant. This means that the actual spread between the original products and their competitors is slightly lower, being about 104-119% higher on average36.
Table 16 summarizes this spread for each patent protection and fixed-effects applied to ease its readability. We observe a similar pattern when applying fixed-effects at all levels. In all cases products protected in the US are more expensive than their therapeutically similar competitors, ranging from 193% at TC1 to 92% at TC4. A puzzling result in this table is that pending filings in Uruguay are virtually always correlated with a lower spread between original and competing products than those just patented abroad. On the other hand, those products also protected by a patent in Uruguay seem to have an equivalent – sometimes even higher – spread with competitors.
Table 16 also shows the spread between unprotected products facing the competition of the original product and those without it. As in Table 13, we intend to proxy for the effect of entry of the original patented product on market segment prices of the incumbents. We observe that virtually always the entry of original products increases the prices of competitors as well. These are particularly high in the case of protected products for which a patent has been filed in Uruguay, where the spread ranges from 13% to 55% higher prices. While seemingly counterintuitive, these results are in line with those found for the competition variables in Table 13. Together they might be more indicative of the novelty and economic relevance of certain markets segments.
Table 16: Effects of IP on market prices (Summary)
Price(logs) TC1 TC1 TC2 TC2 TC3 TC3 TC4 TC4 TC1 TC1 TC2 TC2 TC3 TC3Patent in US 192.9 138.8 145.0 117.2 118.6 104.0 92.1 91.6 16.2 29.5 19.9 30.5 13.0 19.2
+ Filing in Uruguay 201.7 129.5 101.9 71.6 82.3 65.1 63.4 63.0 13.2 34.4 43.1 55.5 33.9 43.3+ Patent in Uruguay 189.8 126.0 197.9 146.8 200.6 165.0 153.0 151.2 8.4 20.4 6.2 12.8 -1.4 6.7
(controls for AI competition) no yes no yes no yes no yes no yes no yes no yes
Original vs. Unprotected rivals Original entry
36 Idem 33.

CDIP/13/INF/5Annex, page 80
6. Concluding remarks
This study finds that the introduction of pharmaceutical patent protection in Uruguay has only had a seemingly minor effect on pharmaceutical market conditions. However, its effect on IP use has been substantial.
As shown in the empirical analysis, since 1995 the DNPI has not only faced a substantial increase in patent filings, but also a different demand in terms of competences. In the one hand, these new demands relate to the technological field of the subject matter, which has shifted radically towards pharmaceutical related technologies. In the other hand, also the characteristics of applicants have changed, increasing the proportion of foreign and larger companies. In any case, these changes shape the overall patenting process – particularly the search and examination procedures – affecting negatively the patent pendency.
Pharmaceutical companies are not only intense users of the patent system, they also appear as the sector most frequently filing for trademark protection. Similar to patents, foreign applicants rely to a greater extent on trademark protection than domestic applicants, including in the pharmaceutical sector. However, local and regional pharmaceutical companies have increased their trademark use over time. Such increase is likely not to be related with the IPR changes, as these affected mostly the patent legal framework and just marginally the trademark one. Nevertheless, they might be symptomatic of a change in the Uruguayan pharmaceutical industry – notably the local and regional companies – which might be increasing the sophistication of their IP use. The validity and extent of such statement is yet to be confirmed; but, if true, it would be interesting to assess how much of such increase of trademark use by local pharmaceutical companies could spill-over to other forms of IP, such as patents.
In respect to the market for pharmaceutical products, the analysis estimates that there is a small portion of medicines sold in Uruguay for which companies have sought patent protection (<7%). Among these, about half can be linked to a granted patent in Uruguay so far. These – either pending or granted – patents relate to medicines which are more expensive on average. However, these price differences are less apparent when we limit comparisons to medicines with similar therapeutic properties. This result suggests important differences in the underlying value of different market segments, which might also explain why companies seek patent protection. In other words, the same results may equally suggest that patent protection allows companies to charge higher prices, or that more expensive market segments may trigger (ex ante) patenting activity to appropriate rents. The multivariate regression results on patenting activity outside of Uruguay seem to give support to this latter hypothesis. Unfortunately, we do not have information on quantities sold for the whole market.
Moreover, the link between patent protection and market concentration is less straightforward than expected. Already a descriptive mapping of the pharmaceutical market by segments shows that many segments are served by only one or a few companies, regardless of the patent status of products. It seems that other factors – e.g. scale – play a bigger role in determining pharmaceutical market structure than patent rights. Again, results from the multivariate analysis not only point in the same direction, but they also suggest that in many cases the link between patent protection and concentration is more complex than theory would suggest. In particular, it seems that exclusions rights are not the dominating effect, although the little frequency of granted patents in Uruguay in our sample may be also part of the explanation.

CDIP/13/INF/5Annex, page 81
7. References
Abrol, D. (2004a). Knowledge Diffusion under the Emerging Post TRIPS Indian Pharmaceutical Scenario. Presented at the DRUID Summer Conference, Elsinore, Denmark.
Abrol, D. (2004b). Post-TRIPs Technological Behaviour of the Pharmaceutical Industry in India. Science Technology & Society, 9(2), 243–271. doi:10.1177/097172180400900203
Abrol, D., Prajapati, P., & Singh, N. (2011). Globalization of the Indian pharmaceutical industry: implications for innovation. International Journal of Institutions and Economics, 3(2), 327–365.
Arrow, K. (1962). Economic Welfare and the Allocation of Resources for Invention. In The Rate and Direction of Inventive Activity: Economic and Social Factors (pp. 609–626). NBER.
Berndt, E. R., Blalock, N., & Cockburn, I. M. (2011). Diffusion of New Drugs in the Post-TRIPS Era. International Journal of the Economics of Business, 18(2), 203–224. doi:10.1080/13571516.2011.584426
Caves, R. E., Whinston, M. D., Hurwitz, M. A., Pakes, A., & Temin, P. (1991). Patent Expiration, Entry, and Competition in the U.S. Pharmaceutical Industry. Brookings Papers on Economic Activity. Microeconomics, 1991, 1–66. doi:10.2307/2534790
CENES, FUNCEX, & CINVE. (2000). Impacto sectorial del proceso de integración subregional en el MERCOSUR: sector calzado y sector farmacéutico. Buenos Aires, Argentina: BID-INTAL.
Chaudhuri, S., Goldberg, P. K., & Jia, P. (2006). Estimating the Effects of Global Patent Protection in Pharmaceuticals: A Case Study of Quinolones in India. The American Economic Review, 96(5), 1477–1514.
Ching, A. T. (2010). Consumer learning and heterogeneity: Dynamics of demand for prescription drugs after patent expiration. International Journal of Industrial Organization, 28(6), 619–638. doi:10.1016/j.ijindorg.2010.02.004
CIU. (2012). DIMENSIÓN Y COMPORTAMIENTO RECIENTE DE LA INDUSTRIA QUÍMICA NACIONAL. Cámara de Industrias del Uruguay, Dirección de Investigación y Análisis.
Cockburn, I. M. (2009). Intellectual property rights and pharmaceuticals: challenges and opportunities for economic research. In The Economics of Intellectual Property. (pp. 150–179). Geneva, Switzerland: WIPO. Retrieved from http://www.wipo.int/ip-development/en/economics/
Cohen, W. M., Nelson, R. R., & Walsh, J. P. (2000). Protecting Their Intellectual Assets: Appropriability Conditions and Why US Manufacturing Firms Patent (or Not) (Working Paper No. 7552). National Bureau of Economic Research.
COMISEC. (2006). Negociaciones sobre Propiedad Intelectual: Algunos impactos en sectores productivos e innovación. Comisión Sectorial para el Mercosur, Oficina de Planeamiento y Presupuesto.
Correa, C. M. (2011). Pharmaceutical Innovation, Incremental Patenting and Compulsory Licensing. South Center Research Papers, (41), 37.
Correa, P., & Trujillo, J. M. (2005). Informe sobre el Sector Farmacéutico en el Uruguay. DINAPYME-ONUDI.
Danzon, P. M., & Kim, J. D. (1998). International Price Comparisons for Pharmaceuticals: Measurement and Policy Issues. PharmacoEconomics, 14(Supplement 1), 115–128. doi:10.2165/00019053-199814001-00014
Danzon, P. M., & Towse, A. (2003). Differential Pricing for Pharmaceuticals: Reconciling Access, R&D and Patents. International Journal of Health Care Finance and Economics, 3(3), 183–205. doi:10.1023/A:1025384819575
Demirel, P., & Mazzucato, M. (2007). Firm Growth Dynamics Under Different Knowledge Regimes: The Pharmaceutical Industry.
Dutta, A. (2010). From Free Entry to Patent Protection: Welfare Implications for the Indian Pharmaceutical Industry. Review of Economics and Statistics, 93(1), 160–178. doi:10.1162/REST_a_00056
Fink, C. (2000). How Stronger Patent Protection in India Might Affect the Behavior of Transnational Pharmaceutical Industries (No. No. 2352). Washington, DC: World Bank.

CDIP/13/INF/5Annex, page 82
Fink, C. (2001). Patent Protection, Transnational Corporations, and Market Structure: A Simulation Study of the Indian Pharmaceutical Industry. Journal of Industry, Competition and Trade, 1(1), 101–121. doi:10.1023/A:1011533029416
Fink, C. (2011). Intellectual Property Rights. In Preferential Trade Agreement Policies for Development: A Handbook (pp. 387–406). Washington D.C.: World Bank.
Gabinete Productivo. (2011). Plan Sectorial Farmacéutico.Gallini, N., & Scotchmer, S. (2002). Intellectual Property: when is it the best incentive system? In
Innovation Policy and the Economy, Volume 2 (pp. 51–78). MIT Press.Ganslandt, M., & Maskus, K. E. (2004). Parallel imports and the pricing of pharmaceutical products:
evidence from the European Union. Journal of Health Economics, 23(5), 1035–1057. doi:10.1016/j.jhealeco.2004.03.005
Goldberg, P. K. (2010). Alfred Marshall Lecture Intellectual Property Rights Protection in Developing Countries: The Case of Pharmaceuticals. Journal of the European Economic Association, 8(2-3), 326–353. doi:10.1111/j.1542-4774.2010.tb00506.x
Grabowski, H. G., & Vernon, J. M. (1992). Brand Loyalty, Entry, and Price Competition in Pharmaceuticals after the 1984 Drug Act. Journal of Law and Economics, 35(2), 331–350.
Guellec, D., & de La Potterie, B. V. P. (2007). The economics of the European patent system.Halvorsen, R., & Palmquist, R. (1980). The Interpretation of Dummy Variables in Semilogarithmic
Equations. The American Economic Review, 70(3), 474–475. doi:10.2307/1805237Kyle, M. K. (2007). Pharmaceutical Price Controls and Entry Strategies. Review of Economics and
Statistics, 89(1), 88–99. doi:10.1162/rest.89.1.88Kyle, M. K., & McGahan, A. M. (2011). Investments in Pharmaceuticals Before and After TRIPS. Review
of Economics and Statistics, 94(4), 1157–1172. doi:10.1162/REST_a_00214Lalanne, A. (2004). Introducción al medicamento en el sistema de salud. In Escenarios posibles de
desarrollo del sector farmacéutico de producción nacional.Lanjouw, J. O. (1998). The Introduction of Pharmaceutical Product Patents in India: “Heartless
Exploitation of the Poor and Suffering”? National Bureau of Economic Research Working Paper Series, No. 6366. Retrieved from http://www.nber.org/papers/w6366
Lanjouw, J. O. (2005). Patents, Price Controls, and Access to New Drugs: How Policy Affects Global Market Entry (Working Paper No. 11321). National Bureau of Economic Research. Retrieved from http://www.nber.org/papers/w11321
Levin, R. C., Klevorick, A. K., Nelson, R. R., Winter, S. G., Gilbert, R., & Griliches, Z. (1987). Appropriating the Returns from Industrial Research and Development. Brookings Papers on Economic Activity, 1987(3), 783–831. doi:10.2307/2534454
López, A. (2009). Innovation and appropriability: empirical evidence and research agenda. In The Economics of Intellectual Property. (pp. 1–40). Geneva, Switzerland: WIPO.
Malerba, F., & Orsenigo, L. (2002). Innovation and market structure in the dynamics of the pharmaceutical industry and biotechnology: towards a history‐friendly model. Industrial and Corporate Change, 11(4), 667–703. doi:10.1093/icc/11.4.667
Mansfield, E. (1986). Patents and Innovation: An Empirical Study. Management Science, 32(2), 173–181.O’Neil, M. J., Heckelman, P. E., Dobbelaar, P. H., Roman, K. J., Kenny, C. M., Karaffa, L. S., & Royal
Society of Chemistry (Great Britain). (2013). The Merck index: an encyclopedia of chemicals, drugs, and biologicals. Cambridge, UK: Royal Society of Chemistry.
Oddone, G., & Failde, A. (2006). Impacto de un TLC con Estados Unidos en la industria farmacéutica en Uruguay: Estudio comparativo. Montevideo: Centro de Investigaciones Económicas (CINVE).
Russo, G., & McPake, B. (2010). Medicine prices in urban Mozambique: a public health and economic study of pharmaceutical markets and price determinants in low-income settings. Health Policy and Planning, 25(1), 70–84.
Scherer, F. M. (2001). The Link Between Gross Profitability And Pharmaceutical R&D Spending. Health Affairs, 20(5), 216–220. doi:10.1377/hlthaff.20.5.216
Scotchmer, S. (2004). Innovation and incentives. The MIT Press.Silberston, Z., & Taylor, C. T. (1973). The economic impact of the patent system: a study of the British
experience. Cambridge University Press.Uruguay XXI. (2011). La industria Farmacéutica en Uruguay.

CDIP/13/INF/5Annex, page 83
Velásquez, G. (2013). Access to Medicines and Intellectual Property: The Contribution of the World Health Organization. South Center Research Papers, (47), 43.
Velásquez, G., & Seuba, X. (2011). Rethinking Global Health: A Binding Convention for R&D for Pharmaceutical Products. South Center Research Papers, (42), 29.
Watal, J. (2000). Pharmaceutical Patents, Prices and Welfare Losses: Policy Options for India Under the WTO TRIPS Agreement. The World Economy, 23(5), 733–752. doi:10.1111/1467-9701.00299
WHO-WIPO-WTO. (2013). Promoting Access to Medical Technologies and Innovation: Intersections between public health, intellectual property and trade. Geneva, Switzerland.
WIPO. (2011a). Patent Landscape Report on Atazanavir. Geneva, Switzerland: World Intellectual Property Organization.
WIPO. (2011b). Patent Landscape Report on Ritonavir. Geneva, Switzerland: World Intellectual Property Organization.
WIPO. (2011c). World Intellectual Property Report 2011- The Changing Face of Innovation (WIPO Economics & Statistics Series). World Intellectual Property Organization - Economics and Statistics Division. Retrieved from http://ideas.repec.org/b/wip/report/2011944.html
WIPO. (2013). World Intellectual Property Indicators, 2013 edition. Geneva, Switzerland: World Intellectual Property Organization, Economics & Statistics Series.

CDIP/13/INF/5Annex, page 84
8. Acknowledgements
This Study would not have been achieved without the valuable and kind contribution, comments and suggestions of the following people: Alberto Gestal (DNPI), José Villamil (DNPI), Blanca Muñoz (DNPI), Rosario Moreira (DNPI), Lucía Nuñez (DNPI), Susana Novaro (MSP), Solange Nogues (MEF), Gustavo Baldassari (MEF), Raquel Ramilo (MSP), Stella Viglielm (MSP), Marcos Giusti (Mega Pharma), Gustavo Zerbino Stajano (CEFA), Ernesto Varela (CEFA), Martín Arregui (CEFA), Daniel Garat Beisso (CEFA), Enrique Giordano (CEFA), Alfredo Antía (ALN), Carlos Scherschener (ALN), Julio César Galmarini (ALN), Álvaro Martínez Juszczyk (ALN), Matthew Luby (LANDON IP), Aditi Nanda, (LANDON IP), Carlos Casacuberta (UdelaR), Nestor Gandelman (UdelaR), Bhaven Sampat (Columbia Univ.), Bronwyn Hall (Berkeley), Benjamin Mitra-Khan (IP-Australia), Jacques Mairesse (UNU-MERIT), Reinhilde Veugeulers (KU Leuven), Dominique Foray (EPFL), Stefano Baruffaldi (EPFL), Viviana Muñoz (EPFL/South Center) and Ernest Miguelez (U. Bordeaux). The usual disclaimer applies.
Additionally, we acknowledge the participants of the WIPO’s Expert meeting (December 2013) and MEIDE Conference (2012 & MEIDE) for the valuable comments to parts of this research.

CDIP/13/INF/5Annex, page 85
9. Annex Tables
Table A - 1: Timeline of relevant legislations for the Pharmaceutical industriesPublished Legislation Modifies/Refers Description
1940-10-04 Law 9.956 Reforms trademark law
1941-12-23 Law 10.089 Reforms patent law
1943-02-13 Law 10.384* Regulates HMOs & Private medical care providers
1948-01-02 Law 11.015 Reforms provision of medicines
1951-04-18 Law 11.641 Law 11.015 Addends provision of medicines
1974-03-14 Law 14.164* Law 10.384 Reforms private medical care providers
1975-06-31 Law 14.407* Creates public insurance institution (ASSE)
1976-07-29 Law 14.549* Creates utility model
1977-12-27 Law 14.746* Regulates Pharmacies
1979-08-23 Law 14.910* Ratifies international IP conventions of Stockholm and WIPO
1981-09-02 Law 15.181* Laws 10.384, 14.164 Reforms HMOs & Medical care institutions
1983-08-12 Law 15.443* Laws 11.015, 11.641 Reforms provision of medicines
1984-11-22 Decree 521/984 Law 15.443 Regulates provision of medicines
1985-04-16 Law 15.703* Laws 14.746, 15.443 Reforms pharmacies law
1986-12-04 Decree 801/986 Law 15.703 Regulates new pharmacies law
1987-05-25 Decree 252/987 Law 15.443, Decree 521/984 Regulates provision of medicines law
1994-08-31 Decree 388/994 Decrees 521/984, 252/987 Regulates provision of medicines law
1994-12-13 Law 16.671 Ratifies GATT-1994: Mailbox provision (1/1/1995-1/1/2000)
1998-10-07 Law 17.011 Laws 9.956, 10.089 Reforms trademark law
1999-01-08 Law 17.052 Harmonizes trademark law in MERCOSUR
1999-09-20 Law 17.164 Laws 10.089, 14.549 Reforms patent utility model laws (includes industrial designs)
1999-10-18 Decree 324/999 Decrees 521/984, 388/994 Regulates provision of medicines law (MERCOSUR compatible)
2000-03-13 Decree 90/000 Centralized public procurement unit for medicines
2001-06-04 Decree 191/001 On pharmaceuticals production (MERCOSUR best practices)
2002-08-26 Decree 318/002 Law 15.443 Prescription using International Nonproprietary Name
2002-08-27 Law 17.548 Law 15.181 Addends HMOs regulation
2002-11-12 Decree 428/002 Decree 90/000 Centralized public procurement unit for medicines
2005-12-23 Law 17.930 Laws15.181, 15.443, 15.703 Creates the centralized public procurement unit for medicines & the National Integrated Health System
2006-08-15 Decree 265/006 Laws15.181, 15.443, 15.703, 17.930 Creates a therapeutic formulary
2007-01-12 Decree 269/007 Law 15.443,Decrees 521/984, 191/001 Import of medicines and local laboratories
2007-01-22 Decree 12/007 Laws15.181, 15.443, 15.703, 17.930 Bioequivalence
2007-08-22 Decree 304/007 Laws 17.164, 17.011 Creates an Inter-institutional IP Group (GIPI)
2007-09-07 Law 18.172 Laws 17.164, 17.011,17.930 Modifies new IP laws (incl. R&D and product development exceptions) & Public procurement unit
2008-09-04 MSP Ord. 561/008 Law 15.443, Decree 521/984 Forces expiration of registered medicines not in the market
2009-06-08 Decree 261/009 Law 15.443, Decrees 12/007, 379/008 Regulates Bioavailability & bioequivalence studies
2011-03-16 Decree 97/011 Law 15.443, Decree 12/007 Allows bioequivalence testing in MERCOSUR institutions
2013-11-18 Decree S510 Law 15.703, Decree 801/986 Limits ownership concentration of private pharmaciesNotes: List not exhaustive; Approval date when publication date not found; only references to similar legislations reported; (*) Decree-Law (Law
15.738); GATT = General Agreement on Tariffs and Trade; HMO = Health Maintenance Organization; MSP = Public Health Ministry
Table A - 2: List of medicines protected by granted patents in UruguayCompany Trade name Active Ingredient OB approval US patent UY patent UY patent

CDIP/13/INF/5Annex, page 86
date grant date filing date grant dateBayer Nexavar Sorafenib 20dec2005 26jun2007 25feb2000 01sep2010
Boehringer Ingelheim Berodual Fenoterol-Ipratropium 29dec1986 01aug1972 25may2000 01sep2010
Boehringer Ingelheim Atrovent Ipratropium 29dec1986 01aug1972 25may2000 01sep2010
Boehringer Ingelheim Micardis Telmisartan 10nov1998 07jan1997 17jan2000 18nov2009
GlaxoSmithKline Ziagenavir Abacavir 17dec1998 23jul1991 15may1998 31jan2003
GlaxoSmithKline 3TC Lamivudine 26sep1997 09feb1988 30oct1997 08aug2007
GlaxoSmithKline Kivexa Lamivudine/Abacavir 02aug2004 23jul1991 15may1998 31jan2003
GlaxoSmithKline Trizivir Lamivudine/Abacavir/Zidovudina 14nov2000 09feb1988 15may1998 31jan2003
GlaxoSmithKline Combivir Lamivudine/Zidovudina 26sep1997 09feb1988 30oct1997 08aug2007
GlaxoSmithKline Lamictal Lamotrigina 27dec1994 22jul1986 18sep1995 13mar2000
GlaxoSmithKline Altargo Retapamulina 12apr2007 13jun2006 07may1996 06aug2007
GlaxoSmithKline Avandia Rosiglitazone 25may1999 26mar1991 13jan2000 07dec2000
GlaxoSmithKline Avandamet Rosiglitazone-Metformina 10oct2002 26mar1991 13jan2000 07dec2000
Novartis Trileptal Oxcarbazepina 14jan2000 02may2006 13feb1998 05dec2003
Pfizer Caduet Amlodipina-Atorvastatina 30jan2004 25feb1986 30apr1998 29aug2003
Pfizer Lipitor Atorvastatin 17dec1996 21jul1987 30apr1998 29aug2003
Roche Xenical Orlistat 23apr1999 01jul1986 04feb1998 13nov2002
Servimedic* Effexor Venlafaxine 28dec1993 13aug1985 10jul1997 23jul2003Sources: Farmanuario (2012), Orange Book (2012), DNPI (2012) and PATSTAT (2013). Notes: (*) Commercializes a Pfizer drug.
Only active ingredients found in Orange Book (2012).Broad definition of patent family used (INPADOC).
Table A - 3: Examples of registered trademarks for top 5 companies
Company Example of trademarks
BAYER “ASPIRINA”, “BEROCCA”, “si es Bayer es bueno”
PFIZER “CALTRATE”, “ZOLOFT”, “Nunca es demasiado tarde para Caltrate”
NOVARTIS “APRESOLINA”, “NOVOSAL”, “VIONATE”
GRAMON GABO “BAGOHEPAT”, “NASTIZOL”, “...Y todo bien!!”
GSK “CALBAX”, , “IBUMIDOL”, “TUMS alivia la acidez y hace bien a la salud”
SANOFI-AVENTIS “DEMEROL”, “NOVALGINA”, “La salud es lo esencial”
JOHNSON & JOHNSON “INVEGA”, “CLEAN & CLEAR”, “Mas control mas tiempo”
BRISTOL MYERS SQUIBB “ACTIDERM”, “REYATAZ”, “TAXOL”
ANDROMACO “DERMAGLOS”, “HIPOGLOS”, “SOBREROL”
THE LATIN AMERICA TRADEMARK CORP.
“VIMAX ROEMMERS”, “EDAGAN”, “¡quiérase! prefiera calidad Roemmers”
Source: DNPI (2012).

CDIP/13/INF/5Annex, page 87
Table A - 4: Within and Between Variability of final panelCompetitors Monopoly PriceAI, count AI, 0/1 Prod, USD AI, 0/1 AI, % Prod, 0/1 AI, 0/1 AI, % Prod, 0/1 AI, 0/1 AI, % Prod, 0/1
mean 4.713 0.117 46.11 0.660 10.05 0.100 0.065 1.584 0.016 0.034 0.744 0.0074SD 2.763 0.321 196.4 0.474 21.07 0.301 0.246 9.691 0.125 0.182 6.391 0.086
Between SD by FEProduct 2.766 0.313 226.7 0.478 21.29 0.300 0.250 9.755 0.123 0.183 6.207 0.084
AI 1.928 0.452 464.6 0.486 33.18 0.332 0.256 14.528 0.145 0.173 9.921 0.099TC3 1.904 0.398 568.9 0.433 29.49 0.295 0.210 13.054 0.131 0.144 8.974 0.090TC2 1.947 0.374 758.9 0.379 28.02 0.280 0.169 9.587 0.096 0.123 8.814 0.088TC1 1.202 0.183 88.02 0.234 7.643 0.076 0.125 4.985 0.050 0.054 2.053 0.021
Within SD by FEProduct 0.851 0.144 27.70 0.000 - 0.000 0.000 - 0.000 0.000 - 0.000
AI 0.945 0.164 91.45 0.000 6.866 0.225 0.000 2.862 0.084 0.000 2.356 0.062TC3 1.908 0.260 121.3 0.278 15.37 0.264 0.172 7.227 0.107 0.130 5.152 0.077TC2 2.184 0.289 135.9 0.361 17.91 0.279 0.212 8.724 0.118 0.160 5.696 0.081TC1 2.590 0.313 180.1 0.439 20.19 0.295 0.235 9.266 0.122 0.176 6.202 0.085
Statistic Patent in US Patent in UruguayFiling Uruguay
Sources: Farmanuario (2012), Orange Book (2012), DNPI(2012) and PATSTAT(2013). Notes: Prices in current US dollars. Therapeutic class aggregation is from Farmanuario. Only active ingredients found in Orange Book (2012).
Companies grouped whenever corporate information was available.
Table A - 5: Summary of public procurement data relating to medicines in UruguayAmount
Call number Obs. per unit per Item (USD)Medicines 1007-07 2,441 15.06 32.67 127,329,063
Antiretroviral medicines 1008-07 2 0.36 64.37 7,935Exceptional medicines 1017-08 161 67.78 242.45 4,344,716
Medicines (complement) 1027-08 7 0.05 3.27 56,779Medicines 30-2009 2,250 16.56 16.53 70,536,654
4,861 17.74 34.03 202,275,146
Average Price (USD)
TotalSource: Centralized Procurement Unit (http://uca.mef.gub.uy), Ministry of Economy and Finance, Uruguay.
Notes: values converted to current US dollars using rate of the date of grant.

CDIP/13/INF/5Annex, page 88
Table A - 6: Full results on the effects of IP on market structureVariables (1) (2) (3) (4) (5) (6) (7) (8) (9) (10) (11) (12) (13) (14) (15) (16) (17) (18)
ex.rate UYU/USD (logs) -0.284*** -0.411*** -0.285*** -0.456*** -0.271*** -0.387*** -0.296*** -0.414*** -0.303*** -0.474*** -0.286*** -0.399*** -0.304*** -0.426*** -0.307*** -0.477*** -0.301*** -0.424***(0.030) (0.036) (0.031) (0.036) (0.031) (0.036) (0.035) (0.048) (0.035) (0.050) (0.035) (0.047) (0.036) (0.046) (0.037) (0.050) (0.036) (0.046)
time -0.002*** -0.001* -0.002*** -0.001* -0.002*** -0.001* -0.002*** -0.001** -0.002*** -0.001** -0.002*** -0.001** -0.002*** -0.001*** -0.002*** -0.001*** -0.002*** -0.001***(0.001) (0.001) (0.001) (0.001) (0.001) (0.001) (0.000) (0.001) (0.000) (0.001) (0.000) (0.001) (0.000) (0.000) (0.000) (0.000) (0.000) (0.000)
Price (AI, logs) -0.143*** -0.190*** -0.123*** -0.135*** -0.195*** -0.123*** -0.135*** -0.187*** -0.133***(0.023) (0.024) (0.023) (0.026) (0.029) (0.027) (0.026) (0.030) (0.026)
AI with original Product (patent US) 0.199** 0.336*** 0.261** 0.416*** 0.143* 0.317***(0.095) (0.083) (0.117) (0.104) (0.077) (0.082)
AI with original Product (filing UY) -0.050 -0.054 -0.245 -0.253** -0.137 -0.146(0.153) (0.102) (0.152) (0.122) (0.191) (0.175)
AI with original Product (patent UY) 0.099 0.144 0.151 0.181 0.093 0.090(0.194) (0.182) (0.221) (0.196) (0.264) (0.248)
Competing AI (patent US) 0.046 0.041 0.059 0.095 -0.118* -0.041(0.092) (0.086) (0.116) (0.109) (0.063) (0.066)
Competing AI (filing UY) 0.104 0.096 -0.068 -0.102 0.000 -0.030(0.095) (0.095) (0.096) (0.084) (0.115) (0.102)
Competing AI (patent UY) -0.084 -0.062 -0.051 0.006 -0.100 -0.079(0.090) (0.080) (0.109) (0.092) (0.161) (0.161)
AI without original (patent US) 0.017 0.024 -0.111 -0.090 -0.138** -0.110(0.096) (0.081) (0.101) (0.097) (0.064) (0.069)
AI without original (filing UY) -0.078 -0.069 -0.097 -0.087 0.034 0.017(0.147) (0.125) (0.192) (0.178) (0.096) (0.095)
AI without original (patent UY) 0.039 0.056 0.164 0.163 0.156 0.170(0.097) (0.071) (0.187) (0.188) (0.131) (0.135)
Patent protected products (patent US only,%) -0.005*** -0.003* -0.004*** -0.001 -0.002** -0.000(0.001) (0.001) (0.001) (0.001) (0.001) (0.001)
Patent protected products (pending UY,%) -0.004** -0.002 -0.006*** -0.004** -0.002 -0.002(0.002) (0.002) (0.002) (0.002) (0.004) (0.004)
Patent protected products (patent UY,%) -0.004*** -0.001 -0.007*** -0.005* -0.008** -0.007**(0.002) (0.002) (0.002) (0.003) (0.003) (0.003)
Constant 2.612*** 3.114*** 2.615*** 3.280*** 2.488*** 2.981*** 2.636*** 3.162*** 2.687*** 3.414*** 2.574*** 3.084*** 2.556*** 3.172*** 2.609*** 3.398*** 2.574*** 3.182***(0.362) (0.361) (0.414) (0.406) (0.365) (0.372) (0.303) (0.313) (0.321) (0.331) (0.308) (0.315) (0.278) (0.306) (0.279) (0.310) (0.280) (0.306)
FEs TC1 TC1 TC1 TC1 TC1 TC1 TC2 TC2 TC2 TC2 TC2 TC2 TC3 TC3 TC3 TC3 TC3 TC3Observations 55,111 55,111 55,111 55,111 55,111 55,111 55,111 55,111 55,111 55,111 55,111 55,111 55,111 55,111 55,111 55,111 55,111 55,111Groups 28 28 28 28 28 28 158 158 158 158 158 158 332 332 332 332 332 332F 44.1 46.4 14.8 28.8 26.2 24.5 38.4 30.3 9.6 12.8 22.0 21.4 35.3 29.0 7.97 9.63 15.8 15.8R2 0.001 0.046 0.018 0.088 0.023 0.051 0.001 0.031 0.029 0.083 0.012 0.034 0.001 0.024 0.025 0.065 0.003 0.025rho 0.098 0.079 0.118 0.108 0.087 0.075 0.378 0.335 0.412 0.363 0.352 0.335 0.493 0.473 0.511 0.488 0.480 0.475note: *** p<0.01, ** p<0.05, * p<0.1
Method: Linear Regression DV=Competition (AI, logs)

CDIP/13/INF/5Annex, page 89
Table A - 7: Full results on the effects of IP on market structure (cont.)Variables (1) (2) (3) (4) (5) (6) (7) (8) (9) (10) (11) (12) (13) (14) (15) (16) (17) (18)
ex.rate UYU/USD (logs) 0.136*** 0.216*** 0.136*** 0.242*** 0.126*** 0.196*** 0.141*** 0.221*** 0.147*** 0.259*** 0.134*** 0.209*** 0.142*** 0.224*** 0.145*** 0.253*** 0.141*** 0.223***(0.030) (0.029) (0.030) (0.029) (0.033) (0.032) (0.032) (0.036) (0.032) (0.036) (0.033) (0.035) (0.034) (0.037) (0.034) (0.039) (0.034) (0.037)
time 0.001 0.000 0.001 0.000 0.001 0.000 0.001 0.000 0.001* 0.000 0.001 0.000 0.001 0.000 0.001* 0.000 0.001 0.000(0.001) (0.001) (0.001) (0.001) (0.001) (0.001) (0.000) (0.000) (0.000) (0.000) (0.000) (0.000) (0.000) (0.000) (0.000) (0.000) (0.000) (0.000)
Price (AI, logs) 0.090*** 0.118*** 0.074*** 0.091*** 0.128*** 0.082*** 0.090*** 0.119*** 0.089***(0.017) (0.019) (0.018) (0.019) (0.020) (0.019) (0.022) (0.024) (0.022)
AI with original Product (patent US) -0.094* -0.179*** -0.145** -0.247*** -0.108* -0.218***(0.052) (0.048) (0.074) (0.062) (0.063) (0.064)
AI with original Product (filing UY) -0.055 -0.052 0.090 0.096 0.040 0.046(0.116) (0.087) (0.129) (0.111) (0.183) (0.174)
AI with original Product (patent UY) 0.030 0.002 -0.009 -0.029 0.087 0.089(0.134) (0.123) (0.150) (0.137) (0.209) (0.198)
Competing AI (patent US) -0.007 -0.004 -0.037 -0.060 0.020 -0.029(0.051) (0.047) (0.072) (0.065) (0.055) (0.055)
Competing AI (filing UY) -0.074 -0.068 0.081 0.103* 0.066 0.086(0.059) (0.053) (0.067) (0.058) (0.124) (0.113)
Competing AI (patent UY) -0.017 -0.030 -0.050 -0.088 0.026 0.012(0.066) (0.049) (0.075) (0.062) (0.139) (0.135)
AI without original (patent US) -0.020 -0.024 0.068 0.055 0.057 0.039(0.056) (0.049) (0.061) (0.058) (0.055) (0.057)
AI without original (filing UY) 0.085 0.080 0.119 0.113 0.033 0.044(0.073) (0.059) (0.091) (0.081) (0.100) (0.097)
AI without original (patent UY) -0.129** -0.140** -0.202* -0.201* -0.221** -0.230**(0.051) (0.062) (0.104) (0.108) (0.108) (0.107)
Patent protected products (patent US only,%) 0.004*** 0.002** 0.003** 0.001 0.001 0.000(0.001) (0.001) (0.001) (0.001) (0.001) (0.001)
Patent protected products (pending UY,%) 0.003 0.001 0.004*** 0.003** 0.002 0.002(0.002) (0.002) (0.001) (0.001) (0.004) (0.004)
Patent protected products (patent UY,%) 0.002 0.000 0.003 0.001 0.005 0.005(0.001) (0.002) (0.002) (0.002) (0.003) (0.003)
Constant -0.429 -0.746** -0.438 -0.851** -0.341 -0.639* -0.411 -0.766** -0.460 -0.937*** -0.363 -0.702** -0.333 -0.745*** -0.351 -0.853*** -0.346 -0.753***(0.359) (0.360) (0.379) (0.378) (0.365) (0.374) (0.300) (0.303) (0.303) (0.303) (0.303) (0.299) (0.269) (0.275) (0.268) (0.276) (0.271) (0.275)
FEs TC1 TC1 TC1 TC1 TC1 TC1 TC2 TC2 TC2 TC2 TC2 TC2 TC3 TC3 TC3 TC3 TC3 TC3Observations 55,111 55,111 55,111 55,111 55,111 55,111 55,111 55,111 55,111 55,111 55,111 55,111 55,111 55,111 55,111 55,111 55,111 55,111Groups 28 28 28 28 28 28 158 158 158 158 158 158 332 332 332 332 332 332F 11.0 26.6 27.4 45.9 9.9 15.8 9.5 14.2 4.4 12.8 5.8 8.7 9.4 13.0 4.27 6.95 4.8 7.1R2 0.000 0.036 0.013 0.067 0.022 0.043 0.000 0.026 0.019 0.064 0.011 0.029 0.001 0.019 0.011 0.040 0.002 0.020rho 0.114 0.105 0.130 0.128 0.105 0.100 0.352 0.311 0.382 0.339 0.319 0.305 0.460 0.440 0.474 0.452 0.447 0.442note: *** p<0.01, ** p<0.05, * p<0.1
Method: Linear Probability Model DV=Monopoly (AI , dummy)

CDIP/13/INF/5Annex, page 90
Table A - 8: Full results on the effects of IP on market prices(1) (2) (3) (4) (5) (6) (7) (8) (9) (10) (11) (12) (13) (14) (15) (16) (17) (18) (19) (20) (21) (22) (23) (24)
-0.773*** -0.890*** -0.770*** -0.865*** -0.786*** -0.868*** -0.797*** -0.887*** -0.785*** -0.862*** -0.805*** -0.870*** -0.796*** -0.867*** -0.785*** -0.842*** -0.796*** -0.848*** -0.794*** -0.814*** -0.802*** -0.813*** -0.801*** -0.813***(0.048) (0.050) (0.044) (0.051) (0.041) (0.048) (0.027) (0.031) (0.026) (0.031) (0.024) (0.029) (0.022) (0.024) (0.021) (0.025) (0.021) (0.024) (0.021) (0.022) (0.020) (0.021) (0.021) (0.021)0.003*** 0.003*** 0.003*** 0.003*** 0.003*** 0.003*** 0.003*** 0.002*** 0.003*** 0.002*** 0.003*** 0.002*** 0.002*** 0.002*** 0.003*** 0.002*** 0.003*** 0.002*** 0.002*** 0.002*** 0.002*** 0.002*** 0.002*** 0.002***(0.000) (0.001) (0.000) (0.001) (0.000) (0.001) (0.000) (0.000) (0.000) (0.000) (0.000) (0.000) (0.000) (0.000) (0.000) (0.000) (0.000) (0.000) (0.000) (0.000) (0.000) (0.000) (0.000) (0.000)0.002*** 0.002*** 0.002*** 0.002*** 0.002*** 0.002*** 0.002*** 0.002*** 0.002*** 0.002*** 0.002*** 0.002*** 0.002*** 0.002*** 0.002*** 0.002*** 0.002*** 0.002*** 0.002*** 0.002*** 0.002*** 0.002*** 0.002*** 0.002***(0.001) (0.001) (0.001) (0.001) (0.001) (0.001) (0.001) (0.001) (0.001) (0.001) (0.001) (0.001) (0.001) (0.001) (0.001) (0.001) (0.001) (0.001) (0.001) (0.001) (0.001) (0.001) (0.001) (0.001)
-0.389*** -0.357*** -0.276*** -0.298*** -0.283*** -0.215*** -0.245*** -0.220*** -0.179*** -0.068*** -0.042** -0.043**(0.066) (0.065) (0.049) (0.043) (0.038) (0.035) (0.036) (0.032) (0.031) (0.018) (0.017) (0.017)
1.257*** 1.203*** 1.080*** 1.091*** 0.888*** 0.920*** 0.626*** 0.636***(0.158) (0.143) (0.109) (0.105) (0.096) (0.094) (0.040) (0.039)-0.052 -0.166 -0.018 -0.152 0.148 0.049 -0.221 -0.215(0.263) (0.224) (0.183) (0.166) (0.179) (0.167) (0.179) (0.173)0.353 0.436** 0.254 0.333* 0.049 0.140 0.607*** 0.590***
(0.237) (0.210) (0.211) (0.193) (0.228) (0.211) (0.212) (0.207)0.182* 0.332*** 0.184** 0.315*** 0.105 0.207** -0.027 -0.014(0.098) (0.111) (0.090) (0.091) (0.088) (0.090) (0.019) (0.020)-0.081 -0.127 0.176 0.084 0.330 0.261 -0.059 -0.053(0.173) (0.149) (0.182) (0.177) (0.243) (0.228) (0.086) (0.081)0.393* 0.452** -0.135 -0.031 -0.452* -0.333 0.170 0.157(0.204) (0.178) (0.224) (0.201) (0.244) (0.228) (0.121) (0.118)0.032 0.074 0.003 0.049 -0.016 0.032
(0.078) (0.070) (0.088) (0.086) (0.083) (0.082)-0.055 -0.164 -0.001 -0.092 0.160 0.076(0.198) (0.173) (0.226) (0.207) (0.190) (0.171)0.437** 0.562*** 0.163 0.290 -0.146 -0.038(0.173) (0.148) (0.202) (0.182) (0.193) (0.159)
0.018*** 0.016*** 0.015*** 0.014*** 0.012*** 0.011*** 0.007*** 0.007***(0.002) (0.002) (0.002) (0.002) (0.001) (0.001) (0.001) (0.001)0.017*** 0.015*** 0.014*** 0.012*** 0.014*** 0.012*** 0.004 0.004(0.002) (0.002) (0.002) (0.002) (0.003) (0.003) (0.003) (0.003)0.021*** 0.019*** 0.017*** 0.015*** 0.014*** 0.012*** 0.012*** 0.011***(0.003) (0.004) (0.002) (0.002) (0.002) (0.002) (0.002) (0.002)
2.970*** 4.220*** 2.879*** 3.919*** 2.998*** 3.883*** 3.374*** 4.348*** 3.181*** 4.023*** 3.305*** 4.011*** 3.661*** 4.426*** 3.428*** 4.040*** 3.458*** 4.035*** 4.029*** 4.229*** 3.916*** 4.029*** 3.891*** 4.020***(0.348) (0.380) (0.344) (0.478) (0.326) (0.441) (0.232) (0.286) (0.248) (0.291) (0.216) (0.266) (0.214) (0.256) (0.223) (0.252) (0.208) (0.242) (0.192) (0.206) (0.187) (0.197) (0.187) (0.198)
FEs TC1 TC1 TC1 TC1 TC1 TC1 TC2 TC2 TC2 TC2 TC2 TC2 TC3 TC3 TC3 TC3 TC3 TC3 TC4 TC4 TC4 TC4 TC4 TC4Observations 307,472 307,472 307,472 307,472 307,472 307,472 307,472 307,472 307,472 307,472 307,472 307,472 307,472 307,472 307,472 307,472 307,472 307,472 307,472 307,472 307,472 307,472 307,472 307,472Groups 28 28 28 28 28 28 158 158 158 158 158 158 332 332 332 332 332 332 839 839 839 839 839 839F 194.1 112.0 195.4 219.6 232.6 135.3 434.7 284.0 204.6 168.4 349.8 259.9 647.7 484.0 232.3 206.4 403.1 325.6 726.6 538.8 349.0 310.2 422.4 357.5R2 0.042 0.107 0.180 0.230 0.182 0.213 0.047 0.086 0.166 0.199 0.153 0.172 0.059 0.084 0.153 0.171 0.124 0.137 0.076 0.077 0.132 0.132 0.082 0.083rho 0.505 0.485 0.508 0.488 0.499 0.486 0.724 0.704 0.692 0.670 0.666 0.652 0.771 0.762 0.748 0.738 0.728 0.724 0.839 0.836 0.829 0.827 0.820 0.819note: *** p<0.01, ** p<0.05, * p<0.1
Method: Linear Regression DV=Price (Product, logs)
Competition (AI, logs)
Original Product(patent US)Original Product(filing UY)Original Product(patent UY)
Patent protected products (pending UY,%)Patent protected products (patent UY,%)Constant
ex.rate UYU/USD (logs)
time
unit
Competing Product (filing UY)Competing Product(patent UY)AI without original(patent US)AI without original(filing UY)AI without original(patent UY)Patent protected products (patent US only,%)
Competing Product (patent US)

10. Annex Figures
Figure A - 1:Time frequencies of centralized public procurements
Source: UCA-MEF (2013)
Figure A - 2: Pharmaceutical patents successfully introduced to the US market(Complete series)
Source: Orange Book (2012) & OB historical patent data.
[End of Annex and of document]