exercise 1 answers
TRANSCRIPT

1
ECO 4554-01 Economics of State and Local Government
Microeconomic Analysis of the Public Sector
Exercise 1 Answers
Instructions Your answers must be clearly written and legible. What you submit must be a finished product, not a draft or “scratch work”. Do your calculations and scratch work elsewhere and then copy it to your final product. If your exercise is messy or hard to follow, it will not be evaluated and you will not receive credit. Show your arithmetic. To Submit: If you complete the exercise off-line, scan the completed exercise into your computer. Your scanning software may require you to indicate that this is a single, multi-page document. From the Exercise button on the Course Menu, click on Exercise 1. Then click Choose File, find the file on your computer, and attach it. Finally, click Submit. Once you have submitted an exercise, Blackboard will not allow you to change it or delete it. Exercise 1 Quiz: When you have completed the exercise, take Exercise 1 Quiz on the course website under Course Documents. If you do not submit a completed exercise, you may not receive credit for the quiz. Formatting Quiz Answers: Dollars: No decimals unless non-zero and at least one digit to the left of the decimal even if zero. If non-zero decimals (that is, cents), you must include two digits to the right of the decimal. Include dollar sign and commas to separate thousands. Quantities: No decimals unless non-zero and at least one digit to the left of the decimal even if zero. Include commas to separate thousands. If decimals, two digits to the right of the decimal. Elasticities: Do not round intermediate calculations. No decimals unless non-zero and at least one digit to the left of the decimal even if zero. If decimals, round to two digits to the right of the decimal. Percentages, shares, and tax rates: Express as percentage, not as decimal. No decimals unless non-zero and at least one digit to the left of the decimal even if zero. If decimals, two digits to the right of the decimal. Include percent sign.
Introduction
The objectives of this exercise are to
• reinforce your understanding of the concepts of consumer surplus, producer surplus, and social surplus and your understanding of elasticities
• learn how to calculate the dollar value of consumer surplus, producer surplus, social surplus, and elasticities
• demonstrate that social surplus attains its maximum value when marginal benefit equals marginal cost.
• learn how to use elasticities to estimate the effects of changes in prices, incomes, and other variables
• become familiar with the range of estimates of price and income elasticities of public services.
Before beginning this exercise, read Fisher, Chapters 2 and 4, review the lecture notes and PowerPoint slides for Topic 1, and study the Microeconomist’s Toolkit in the Additional Reading Assignment for Topic 1.

ECO 4554-01: Economics of State and Local Government Microeconomic Analysis of the Public Sector
Exercise 1 Answers
2
Consumer and Producer Surplus Problems
1. Figure 1 shows the market for jeans. The equilibrium quantity is 15 pairs of jeans and the
equilibrium price is $30 per pair. If there are no increasing returns to scale, no externalities, and no public or collective consumption goods, the equilibrium quantity is also the efficient quantity.
a. First identify the area that represents consumer surplus and the area that represents producer
surplus. Answer: Consumer surplus in blue, producer surplus in purple
b. Calculate the dollar value of the aggregate or total consumer surplus, the dollar value of the
aggregate or total producer surplus, and the dollar value of the aggregate or total social surplus at the equilibrium price and quantity. Show your calculations.
Answers: Consumer surplus=0.5*15*$15=$112.50 Producer surplus=0.5*15*$30=$225 Social surplus=$112.50+$225=$337.50
2. Suppose the price is still $30, but the quantity is only 10 pairs of jeans.
a. Identify the area that represents consumer surplus and the area that represents producer surplus. [Note that because jeans are now underproduced, these areas are trapezoids, not triangles.]

ECO 4554-01: Economics of State and Local Government Microeconomic Analysis of the Public Sector
Exercise 1 Answers
3
Answer: See diagram at end. b. Calculate the dollar value of the aggregate or total consumer surplus, the dollar value of the
aggregate or total producer surplus, and the dollar value of the aggregate or total social surplus at the equilibrium price and quantity.
Answers: Consumer surplus=$100 Producer surplus=$200 Social surplus=$300 c. How much consumer surplus is lost because of underproduction? How much producer
surplus is lost? Answers: Loss in CS=$12.50 Loss in PS=$25 Loss in SS=$37.50 d. The sum of the loss in consumer and the loss in producer surplus is the deadweight loss from
underproduction. On the diagram, identify the areas corresponding to the loss in consumer surplus, the loss in producer surplus, and the deadweight loss. [Note: The areas representing the loss in consumer and producer surplus and the deadweight loss are all triangles.]
Answers: Loss in CS=Green area Loss in PS=Yellow area DWL=Green area plus yellow area e. How much is the deadweight loss from inefficiency? Answer: $37.50
3. Suppose the price is still $30, but the quantity is 20 pairs of jeans.
a. Identify the area that represents consumer surplus and the area that represents producer surplus. [Note that you now have two triangles corresponding to consumer surplus and two corresponding to producer surplus. The triangles to the left of the equilibrium are positive (why?). The triangles to the right of the equilibrium are negative (why?).]
Answer: See diagram at end.
ECO 4554-01: Economics of State and Local Government Microeconomic Analysis of the Public Sector
Exercise 1 Answers
4
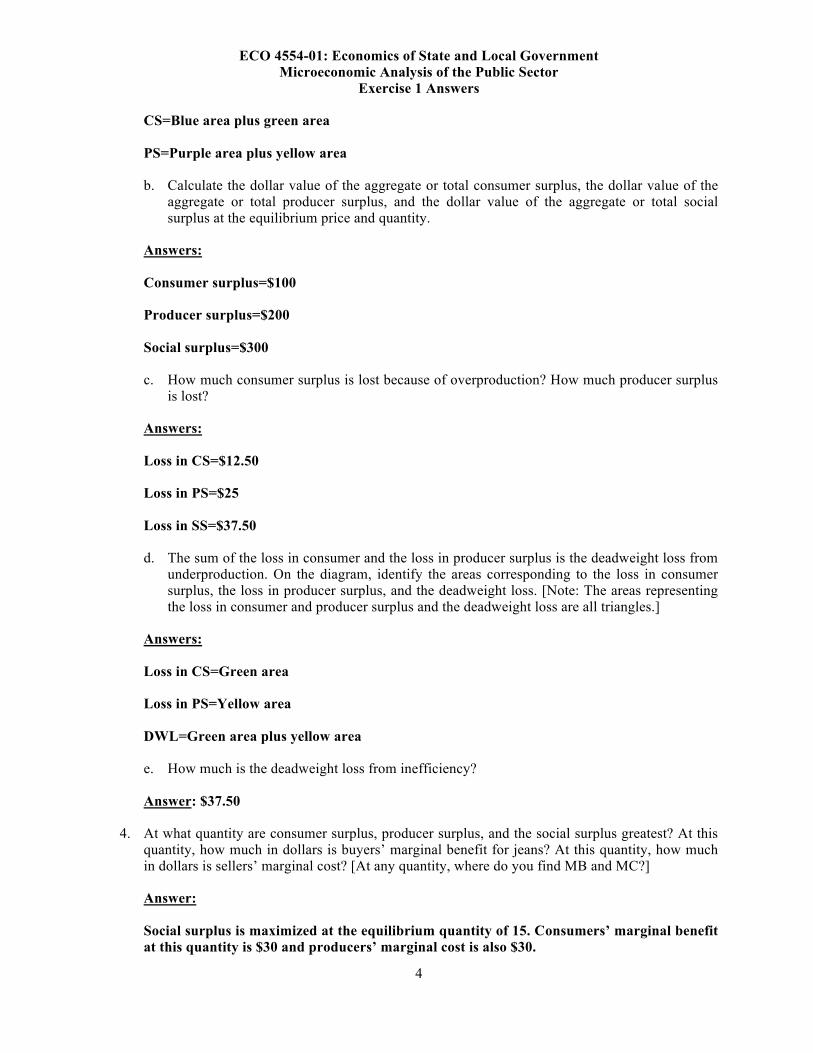
CS=Blue area plus green area PS=Purple area plus yellow area b. Calculate the dollar value of the aggregate or total consumer surplus, the dollar value of the
aggregate or total producer surplus, and the dollar value of the aggregate or total social surplus at the equilibrium price and quantity.
Answers: Consumer surplus=$100 Producer surplus=$200 Social surplus=$300 c. How much consumer surplus is lost because of overproduction? How much producer surplus
is lost? Answers: Loss in CS=$12.50 Loss in PS=$25 Loss in SS=$37.50 d. The sum of the loss in consumer and the loss in producer surplus is the deadweight loss from
underproduction. On the diagram, identify the areas corresponding to the loss in consumer surplus, the loss in producer surplus, and the deadweight loss. [Note: The areas representing the loss in consumer and producer surplus and the deadweight loss are all triangles.]
Answers: Loss in CS=Green area Loss in PS=Yellow area DWL=Green area plus yellow area e. How much is the deadweight loss from inefficiency? Answer: $37.50
4. At what quantity are consumer surplus, producer surplus, and the social surplus greatest? At this
quantity, how much in dollars is buyers’ marginal benefit for jeans? At this quantity, how much in dollars is sellers’ marginal cost? [At any quantity, where do you find MB and MC?]
Answer: Social surplus is maximized at the equilibrium quantity of 15. Consumers’ marginal benefit at this quantity is $30 and producers’ marginal cost is also $30.
ECO 4554-01: Economics of State and Local Government Microeconomic Analysis of the Public Sector
Exercise 1 Answers
5
5. We say that at the efficient quantity, the social surplus is maximized. We also say that the efficient quantity is where marginal social benefit equals marginal social cost (or if there are no externalities, where marginal benefit equals marginal cost). We also say that a quantity is efficient if there is no other quantity that would make one person better off without making someone else worse off. Are these statements consistent with one another or is there a conflict between them? Can they all three be true at the same quantity? Must they all three be true at the same quantity? Explain.
Answer: The short answer is that they are consistent; there is no conflict. The social surplus is the area between the MB curve and the MC curve. This area is maximized where the two curves intersect (keeping in mind that for quantities to the right of the intersection, the social surplus is negative). So at the quantity where the surplus is maximized, MB=MC. Furthermore, if the surplus is maximized at that quantity, moving to any other quantity would reduce the surplus. If the surplus is reduced, someone must be worse off. Therefore, there is no other quantity at which one person would be better off without also making someone else worse off. All three of the criteria or characteristics of efficiency are consistent with one another. They are all simultaneously true at the efficient quantity. (1) MB=MC; (2) the social (consumer plus producer) surplus is maximized; (3) there is no other quantity at which at least one person would be better off without someone else being worse off.
Elasticities Problems 6. Suppose that in 1997, the price to the taxpayers of Hueytown for recreational activities was $20
per hour and at that price the taxpayers’ quantity demanded was 1000 hours. By 2007, the price had increased to $25 per hour because of higher costs, and the quantity demanded had decreased to 900 hours.
a. Use the arc elasticity formula to find the price elasticity of demand? b. Is demand elastic, inelastic, or unitary elastic with respect to price? How do you know? c. How does this price elasticity of demand for recreational activities compare with Fisher’s
estimates of the price elasticity of demand for parks and recreation? Answers: a. Price elasticity of demand
= [(900-1000)÷(900+1000)]/[(25-20)÷(20+25)] = (100÷1900)/(5÷45)=-0.053/0.111 = -0.48, or in absolute value, 0.48
b. Inelastic because the absolute value of the coefficient of elasticity is between zero and
one. c. It is well within the range of estimates of 0.20-0.90.

ECO 4554-01: Economics of State and Local Government Microeconomic Analysis of the Public Sector
Exercise 1 Answers
6
7. Suppose the state government subsidizes Hueytown’s recreational activities by paying half of the $25 per hour price. This represents a 50 percent decrease in the price to the taxpayers.
a. When the price decreases by 50 percent, what is the percentage increase in the quantity
demanded? [You know the price elasticity of demand from Problem 6. You know the percentage change in the price. You can therefore use the elasticity formula to find the percentage change in quantity.]
b. Using the percentage change in quantity from Problem 7a and the new quantity in Problem 6
(900 hours), find the new quantity of recreational activities after the decrease in price? Answers: a. Percent increase in quantity demanded=Elasticity*Percent decrease in price
=0.48*0.50=0.24, or a 24% increase in the quantity demanded. b. 900+24%=1.24*900=1116 hours
8. In 1997, Hueytown spent $5,000 per pupil on education. Between 1997 and 2007, the total
income of Hueytown’s taxpayers increased by 20 percent with no change in either population or the price of education. As a result of the increase in their incomes, Hueytown’s taxpayers voted to increase per pupil education expenditures to $5,700 in 2007. [Per pupil expenditure is often used as a measure of the quantity of education.]
a. Use the arc elasticity formula to calculate the income elasticity of demand for education. [Of
course, you do not know the income in 1997 or in 2007. You also do not know the dollar amount of the increase in income. However, you do know the percentage increase in Hueytown’s income so you do not need to calculate that; you can substitute it directly into the formula. You do not know the percentage increase in the quantity, but you do know the original quantity and the new quantity of education so you can calculate the percentage increase in the formula.]
b. Is demand elastic or inelastic with respect to income? How do you know? c. How does the income elasticity of demand for education of Hueytown’s taxpayers compare
with Fisher’s estimates of the income elasticity of demand for education? Answers: a. Income elasticity of demand=[(5700-5000)÷((5700+5000)/2)] / 0.20
=[700÷(10,700/2)} / 0.20=(700÷5350) / 0.20=0.13 / 0.20=0.65. b. Inelastic because the absolute value of the coefficient of elasticity is between 0 and 1. c. It is at the upper end of the range of estimates of 0.40-0.65.
9. Suppose in 2008 the total income of Hueytown’s taxpayers increases by 1 percent.
a. When income increases by 1 percent, what is the percentage increase in the quantity demanded? [You know the income elasticity of demand from Problem 8. You know the percentage change in income. You can therefore use the elasticity formula to find the percentage change in quantity.]

ECO 4554-01: Economics of State and Local Government Microeconomic Analysis of the Public Sector
Exercise 1 Answers
7
b. Using the percentage change in quantity from Problem 9a and the original quantity in
Problem 8 ($5700 per pupil), find the new quantity of education after the increase in income? Answers: a. Percent increase in quantity demanded (expenditure)=Elasticity*Percent increase in
income =0.65*0.01=.0065, or 0.65%.
b. 5,700+0.65%=1.0065*5700=$5,737.05

ECO 4554-01: Economics of State and Local Government Microeconomic Analysis of the Public Sector
Exercise 1 Answers
8

ECO 4554-01: Economics of State and Local Government Microeconomic Analysis of the Public Sector
Exercise 1 Answers
9