exercise physiology - warszawski uniwersytet...
TRANSCRIPT
Exercise Physiology
Seminar & Class #2
Objectives
Exercise Stress Test (EST)(definition, types, indications, contradictions) Describe the performance of the EST Describe common normal and abnormal
responses to exercise testing Interpretation of the EST
Exercise Stress Test
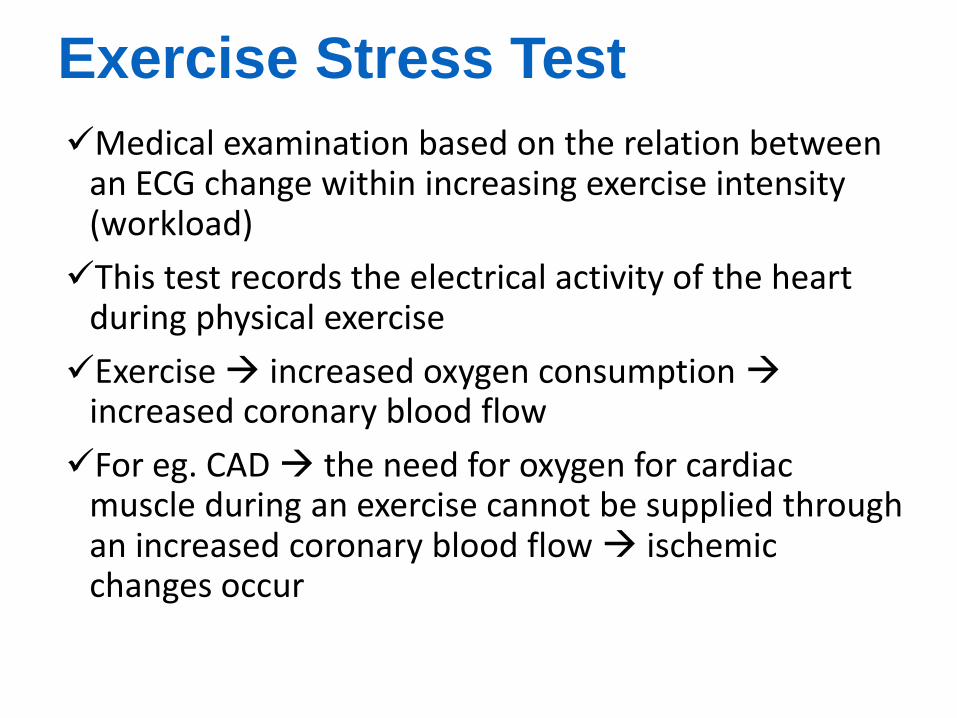
Medical examination based on the relation between an ECG change within increasing exercise intensity (workload)
This test records the electrical activity of the heart during physical exercise
Exercise increased oxygen consumption increased coronary blood flow
For eg. CAD the need for oxygen for cardiac muscle during an exercise cannot be supplied through an increased coronary blood flow ischemic changes occur
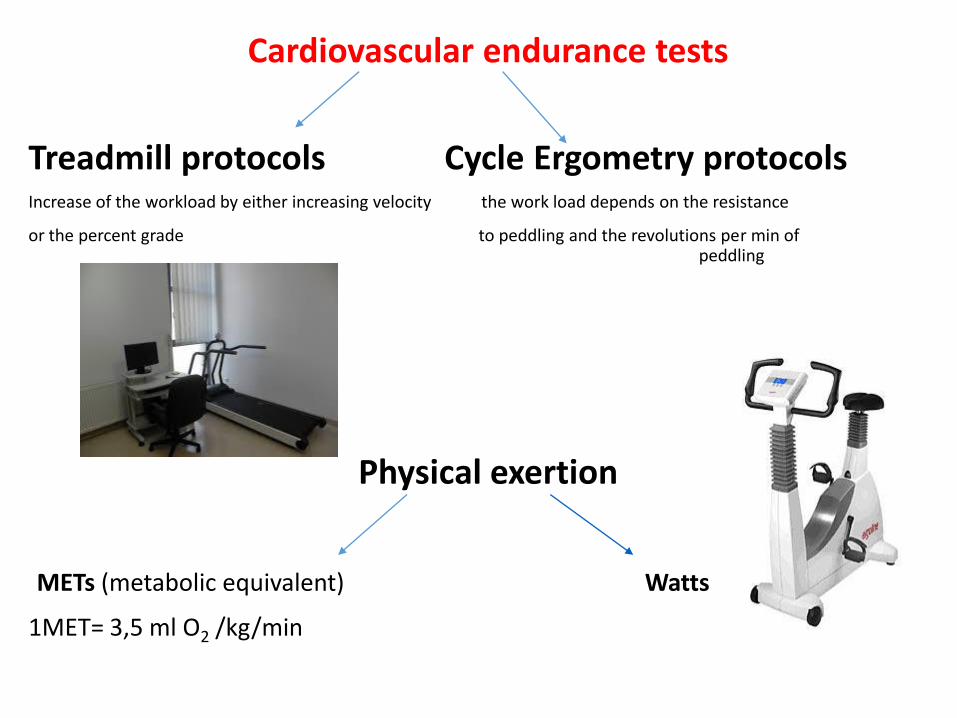
Cardiovascular endurance tests
Treadmill protocols Cycle Ergometry protocols Increase of the workload by either increasing velocity the work load depends on the resistance
or the percent grade to peddling and the revolutions per min of peddling
Physical exertion
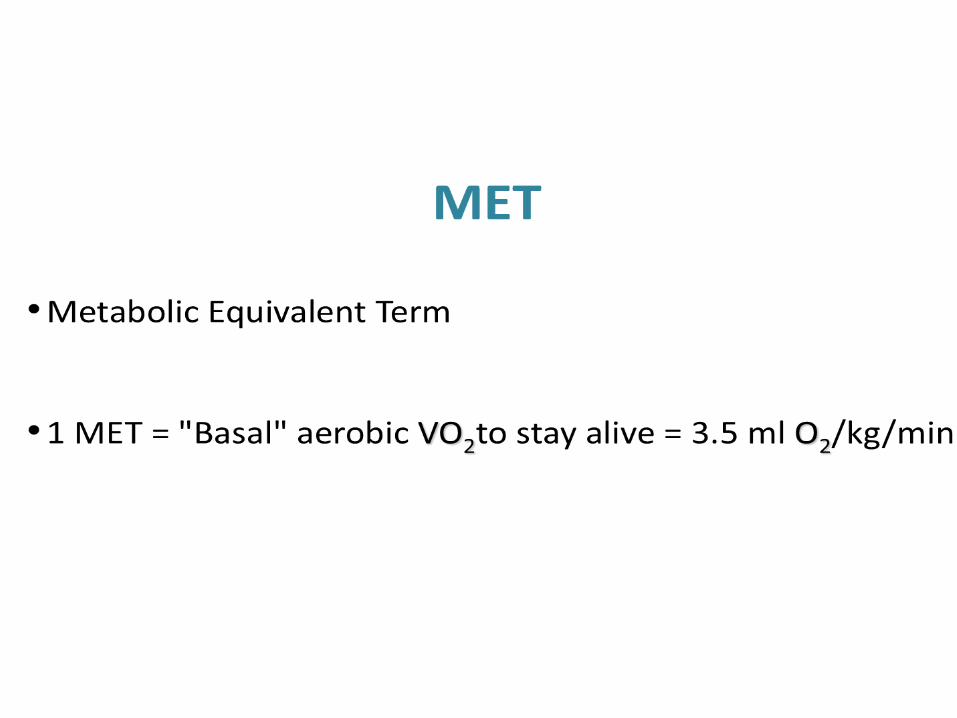
METs (metabolic equivalent) Watts
1MET= 3,5 ml O2 /kg/min
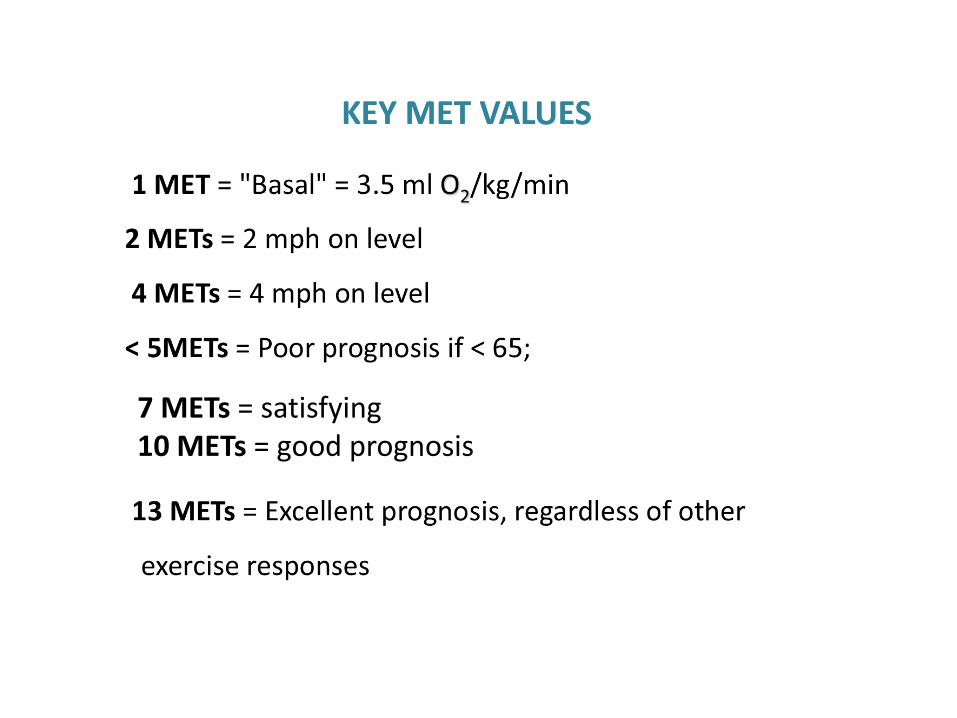
7 METs = satisfying 10 METs = good prognosis
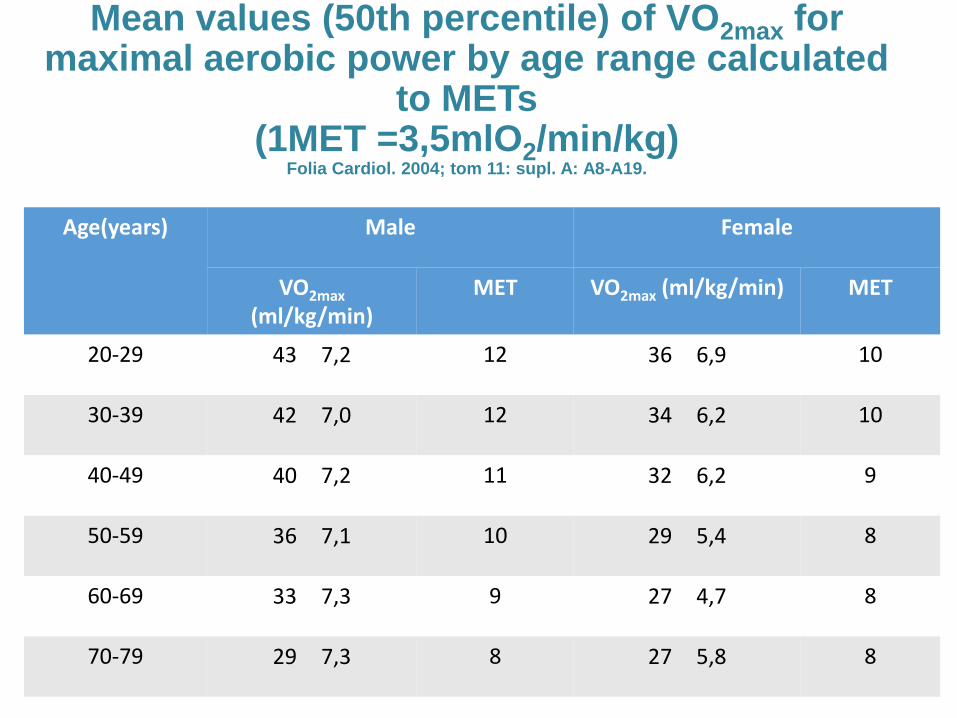
Mean values (50th percentile) of VO2max for maximal aerobic power by age range calculated
to METs (1MET =3,5mlO2/min/kg)
Folia Cardiol. 2004; tom 11: supl. A: A8-A19.
Age(years) Male Female
VO2max (ml/kg/min)
MET VO2max (ml/kg/min) MET
20-29 43 7,2 12 36 6,9 10
30-39 42 7,0 12 34 6,2 10
40-49 40 7,2 11 32 6,2 9
50-59 36 7,1 10 29 5,4 8
60-69 33 7,3 9 27 4,7 8
70-79 29 7,3 8 27 5,8 8
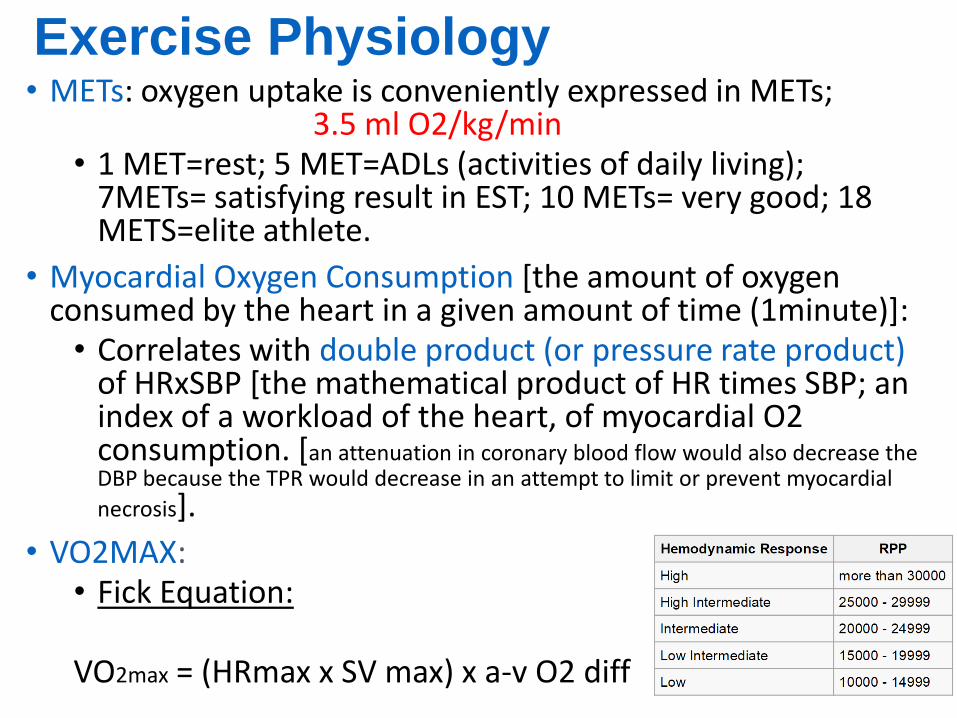
Exercise Physiology • METs: oxygen uptake is conveniently expressed in METs;
3.5 ml O2/kg/min • 1 MET=rest; 5 MET=ADLs (activities of daily living);
7METs= satisfying result in EST; 10 METs= very good; 18 METS=elite athlete.
• Myocardial Oxygen Consumption [the amount of oxygen consumed by the heart in a given amount of time (1minute)]:
• Correlates with double product (or pressure rate product) of HRxSBP [the mathematical product of HR times SBP; an index of a workload of the heart, of myocardial O2 consumption. [an attenuation in coronary blood flow would also decrease the DBP because the TPR would decrease in an attempt to limit or prevent myocardial
necrosis].
• VO2MAX: • Fick Equation:
VO2max = (HRmax x SV max) x a-v O2 diff
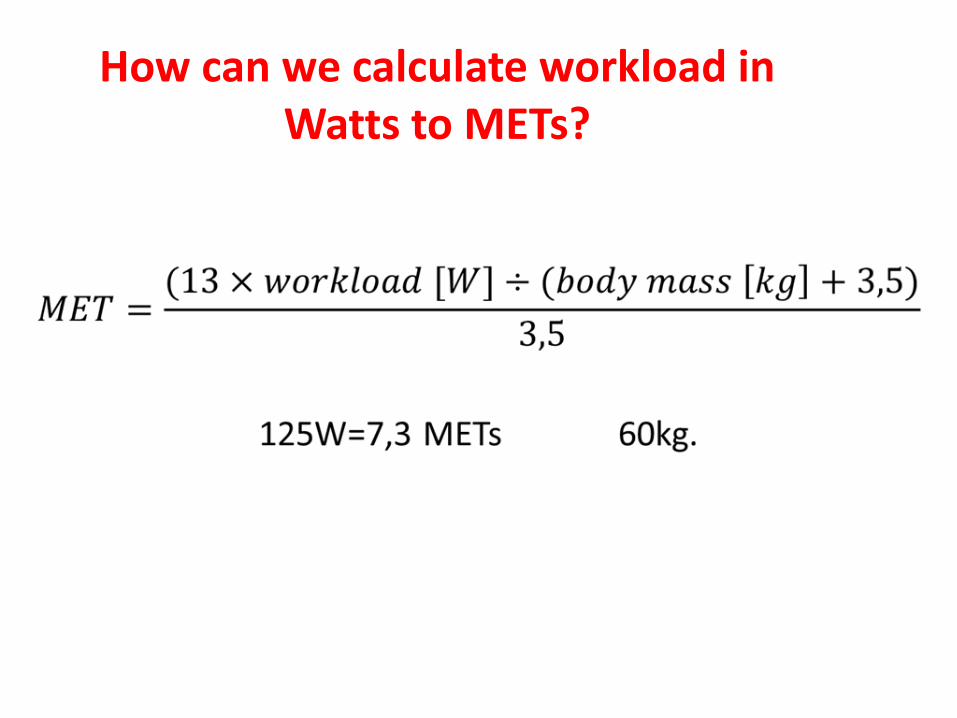
How can we calculate workload in Watts to METs?
• What are the indications for EST?
• How to perform an EST?
• When to terminate an EST?
• How to interprete?
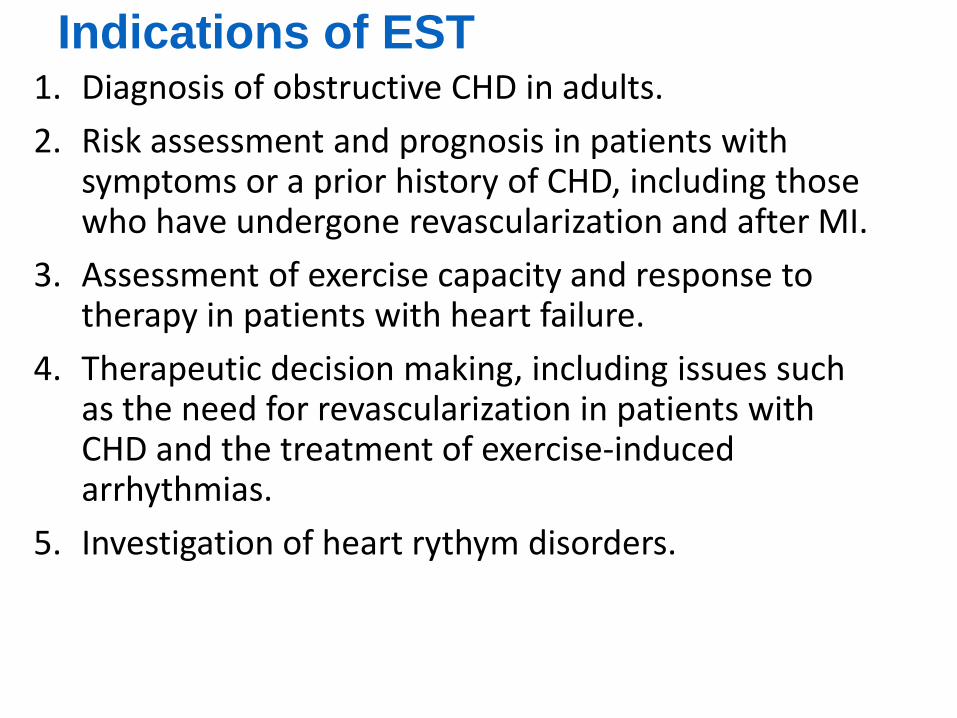
Indications of EST 1. Diagnosis of obstructive CHD in adults.
2. Risk assessment and prognosis in patients with symptoms or a prior history of CHD, including those who have undergone revascularization and after MI.
3. Assessment of exercise capacity and response to therapy in patients with heart failure.
4. Therapeutic decision making, including issues such as the need for revascularization in patients with CHD and the treatment of exercise-induced arrhythmias.
5. Investigation of heart rythym disorders.

Indications to exercise testing 6. To qualificate for a proper model of rehabilitation training,
to assess efectiveness of applied training
Model of rehabilitation Workload at stress testing (in METs or
Watts)
A ≥ 7 MET
≥ 100 W
B ≥ 5 MET
≥ 75 W
C 3–5 MET
50–75 W
D Patients with contradictions to the stress
test
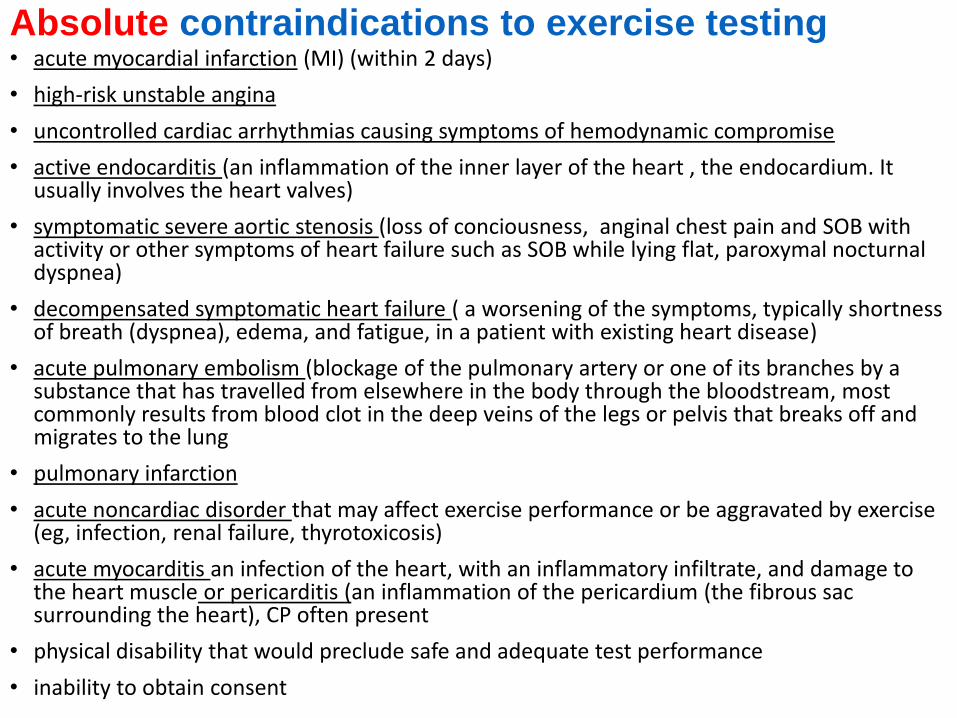
Absolute contraindications to exercise testing • acute myocardial infarction (MI) (within 2 days)
• high-risk unstable angina
• uncontrolled cardiac arrhythmias causing symptoms of hemodynamic compromise
• active endocarditis (an inflammation of the inner layer of the heart , the endocardium. It usually involves the heart valves)
• symptomatic severe aortic stenosis (loss of conciousness, anginal chest pain and SOB with activity or other symptoms of heart failure such as SOB while lying flat, paroxymal nocturnal dyspnea)
• decompensated symptomatic heart failure ( a worsening of the symptoms, typically shortness of breath (dyspnea), edema, and fatigue, in a patient with existing heart disease)
• acute pulmonary embolism (blockage of the pulmonary artery or one of its branches by a substance that has travelled from elsewhere in the body through the bloodstream, most commonly results from blood clot in the deep veins of the legs or pelvis that breaks off and migrates to the lung
• pulmonary infarction
• acute noncardiac disorder that may affect exercise performance or be aggravated by exercise (eg, infection, renal failure, thyrotoxicosis)
• acute myocarditis an infection of the heart, with an inflammatory infiltrate, and damage to the heart muscle or pericarditis (an inflammation of the pericardium (the fibrous sac surrounding the heart), CP often present
• physical disability that would preclude safe and adequate test performance
• inability to obtain consent
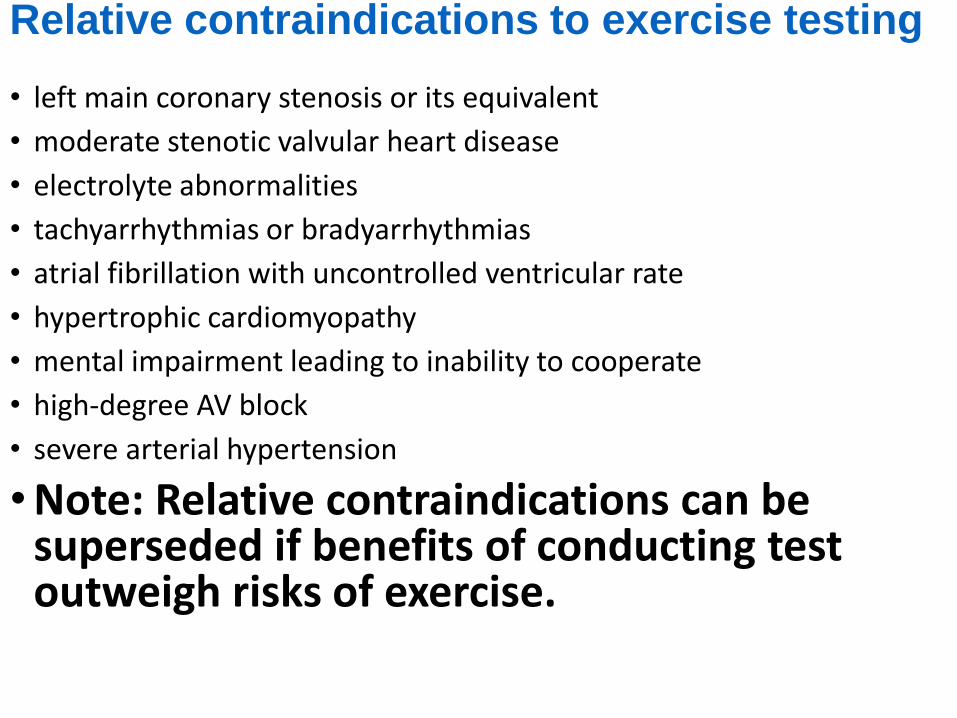
Relative contraindications to exercise testing • left main coronary stenosis or its equivalent
• moderate stenotic valvular heart disease
• electrolyte abnormalities
• tachyarrhythmias or bradyarrhythmias
• atrial fibrillation with uncontrolled ventricular rate
• hypertrophic cardiomyopathy
• mental impairment leading to inability to cooperate
• high-degree AV block
• severe arterial hypertension
• Note: Relative contraindications can be superseded if benefits of conducting test outweigh risks of exercise.
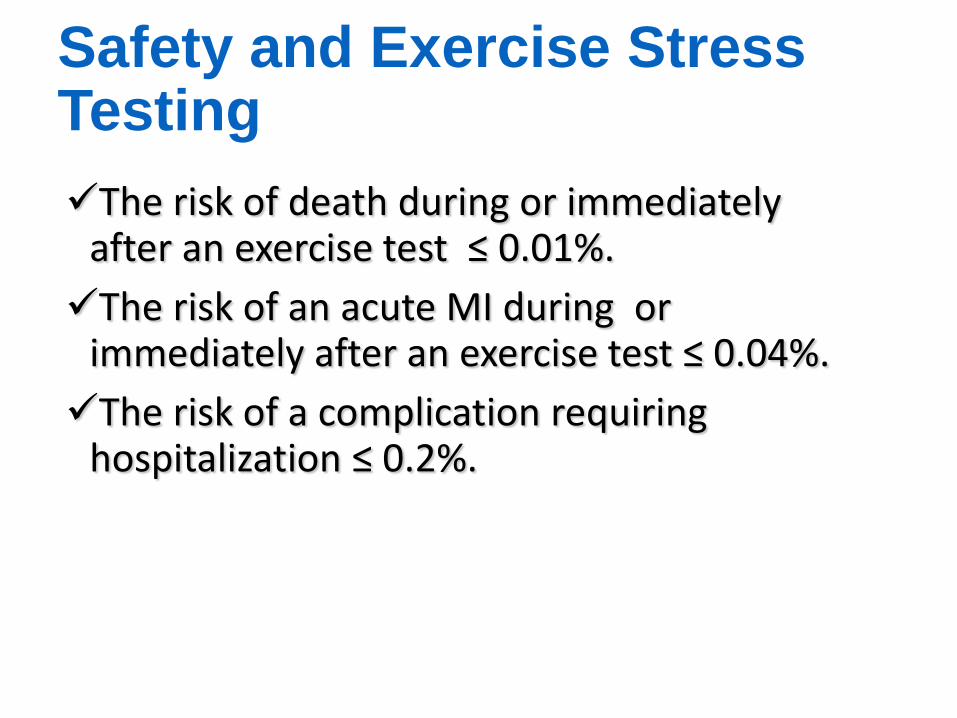
Safety and Exercise Stress Testing
The risk of death during or immediately after an exercise test ≤ 0.01%.
The risk of an acute MI during or immediately after an exercise test ≤ 0.04%.
The risk of a complication requiring hospitalization ≤ 0.2%.

Performance of the Exercise Stress Test
Protocols used in stress tests
Protocols of clinical stress tests include: warming up, increasing sustained effort with increasing workload and its proper timeframe at each stage, resting
i.e. Bruce Protocol, Modified Bruce Protocol, ramp tests -treadmill
Cycle ergometer protocol
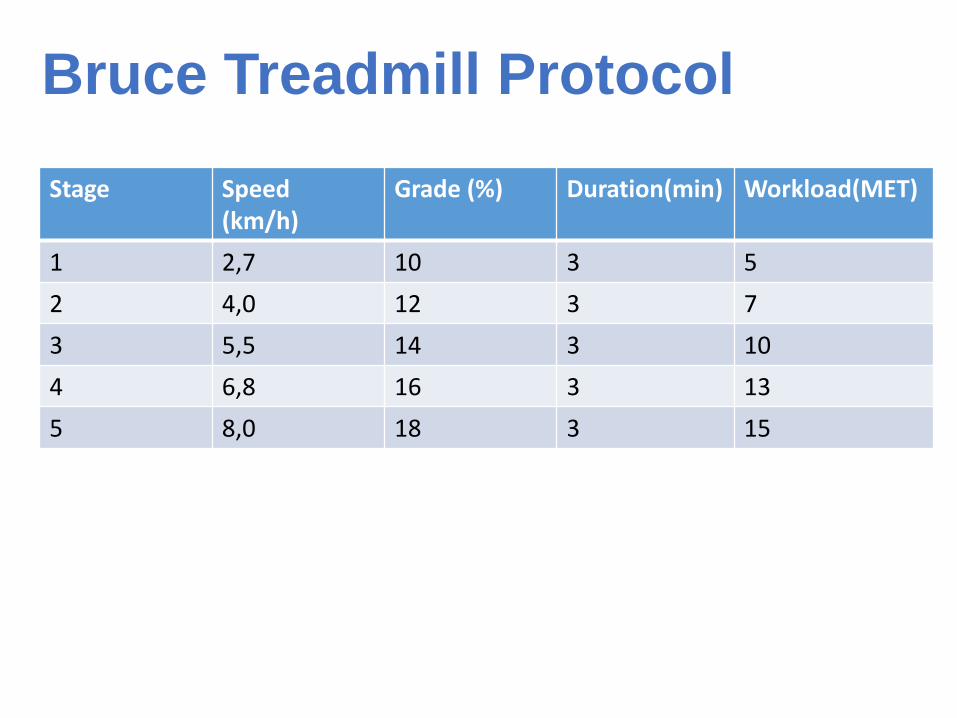
Bruce Treadmill Protocol
Stage Speed (km/h)
Grade (%) Duration(min) Workload(MET)
1 2,7 10 3 5
2 4,0 12 3 7
3 5,5 14 3 10
4 6,8 16 3 13
5 8,0 18 3 15
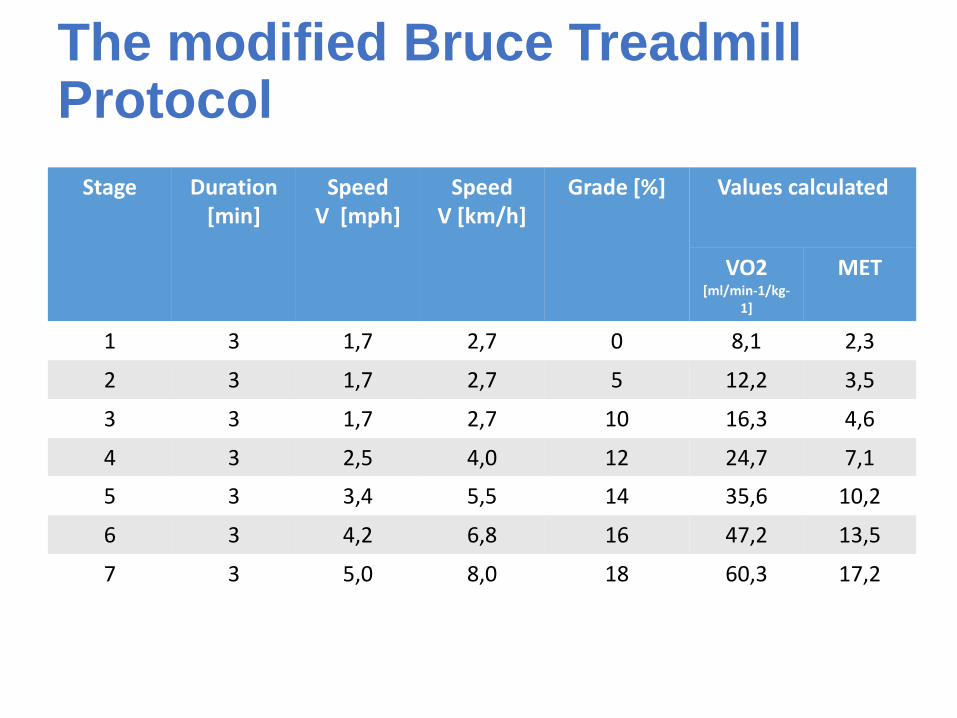
The modified Bruce Treadmill Protocol
Stage Duration [min]
Speed V [mph]
Speed V [km/h]
Grade [%] Values calculated
VO2 [ml/min-1/kg-
1]
MET
1 3 1,7 2,7 0 8,1 2,3
2 3 1,7 2,7 5 12,2 3,5
3 3 1,7 2,7 10 16,3 4,6
4 3 2,5 4,0 12 24,7 7,1
5 3 3,4 5,5 14 35,6 10,2
6 3 4,2 6,8 16 47,2 13,5
7 3 5,0 8,0 18 60,3 17,2
Cycle ergometer protocol
Beginning workload- 50W, among people less active, with a history of cardaic diseases - 25W
Workload increasing 25W/3min

Energy expenditure in METs – exertion, cycle ergometer
Body mass [kg]
METs according to workload in Watts [W]
50 W 75W 100W 125W 150W 175W 200W
50 5,1 6,9 8,6 10,3 12,0 13,7 15,4
60 4,3 5,7 7,1 8,6 10,0 11,4 12,9
70 3,7 4,9 6,1 7,3 8,6 9,8 11,0
80 3,2 4,3 5,4 6,4 7,5 8,6 9,6
90 2,9 3,8 4,8 5,7 6,7 7,6 8,6
100 2,6 3,4 4,3 5,1 6,0 6,9 7,7
Performing the Test
Preparing the Patient
Monitoring the Patient
Terminating the Test
Recovery of the Patient
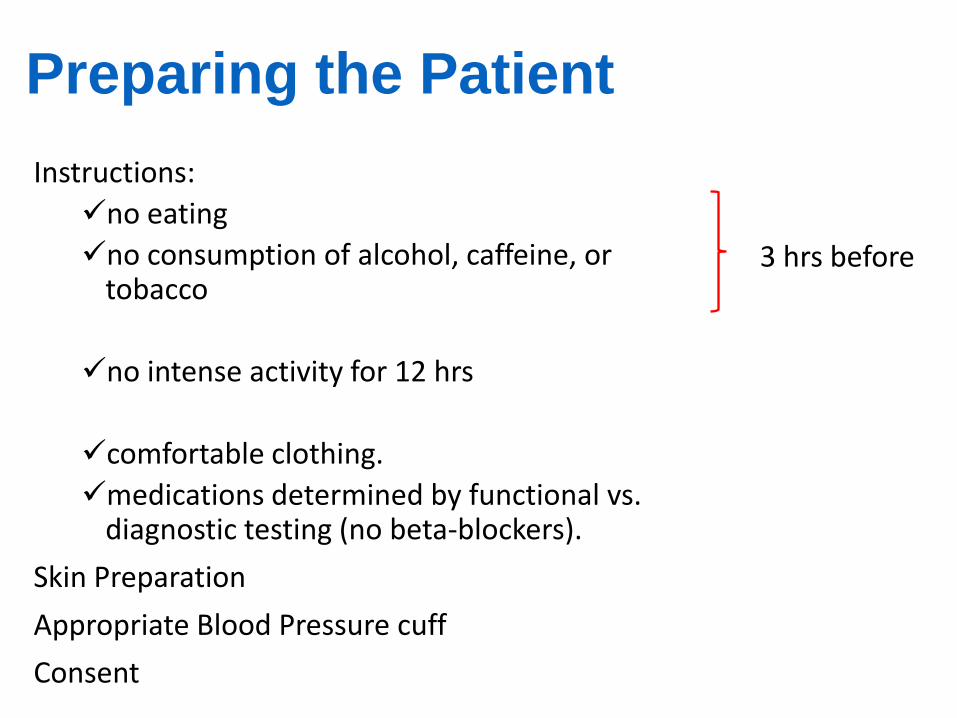
Preparing the Patient
Instructions:
no eating
no consumption of alcohol, caffeine, or tobacco
no intense activity for 12 hrs
comfortable clothing.
medications determined by functional vs. diagnostic testing (no beta-blockers).
Skin Preparation
Appropriate Blood Pressure cuff
Consent
3 hrs before
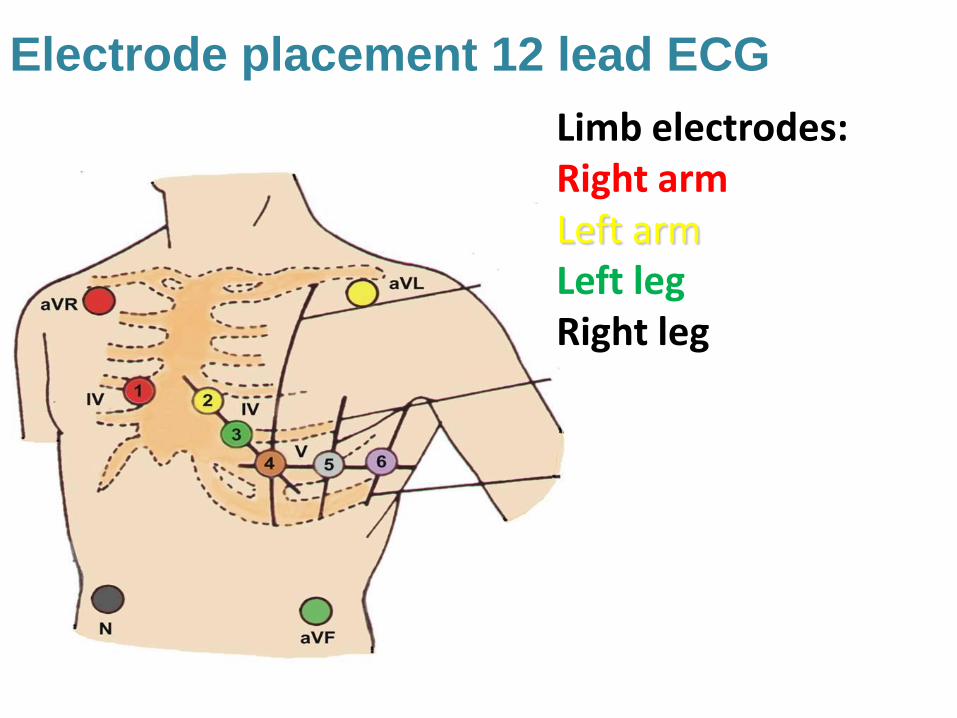
Electrode placement 12 lead ECG
Limb electrodes: Right arm Left arm Left leg Right leg

Electrode placement 12 lead ECG Chest electrodes: V1 – Fourth intercostal space at the right border of the sternum V2 – Fourth intercostal space at the left border of the sternum V3 Midway between locations V2 and V4 V4 – At the mid-clavicular line in the fifth intercostal space V5 – At the anterior axillary line on the same horizontal level as V4 V6 – At the mid-axillary line on the same horizontal level as V4 and V5
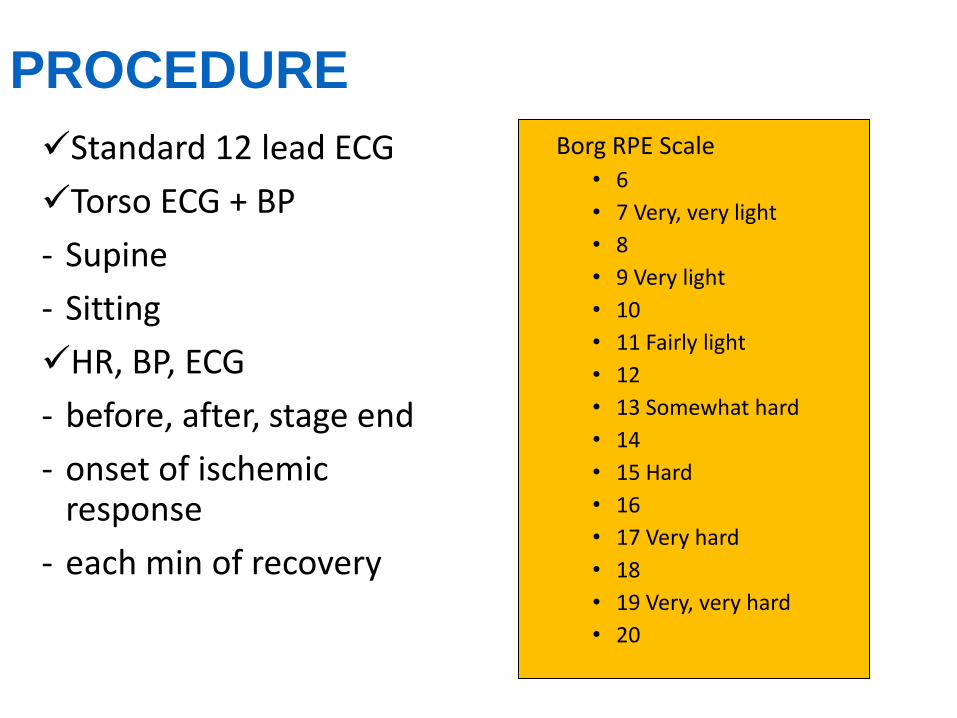
PROCEDURE
Standard 12 lead ECG
Torso ECG + BP
- Supine
- Sitting
HR, BP, ECG
- before, after, stage end
- onset of ischemic response
- each min of recovery
Borg RPE Scale • 6
• 7 Very, very light
• 8
• 9 Very light
• 10
• 11 Fairly light
• 12
• 13 Somewhat hard
• 14
• 15 Hard
• 16
• 17 Very hard
• 18
• 19 Very, very hard
• 20
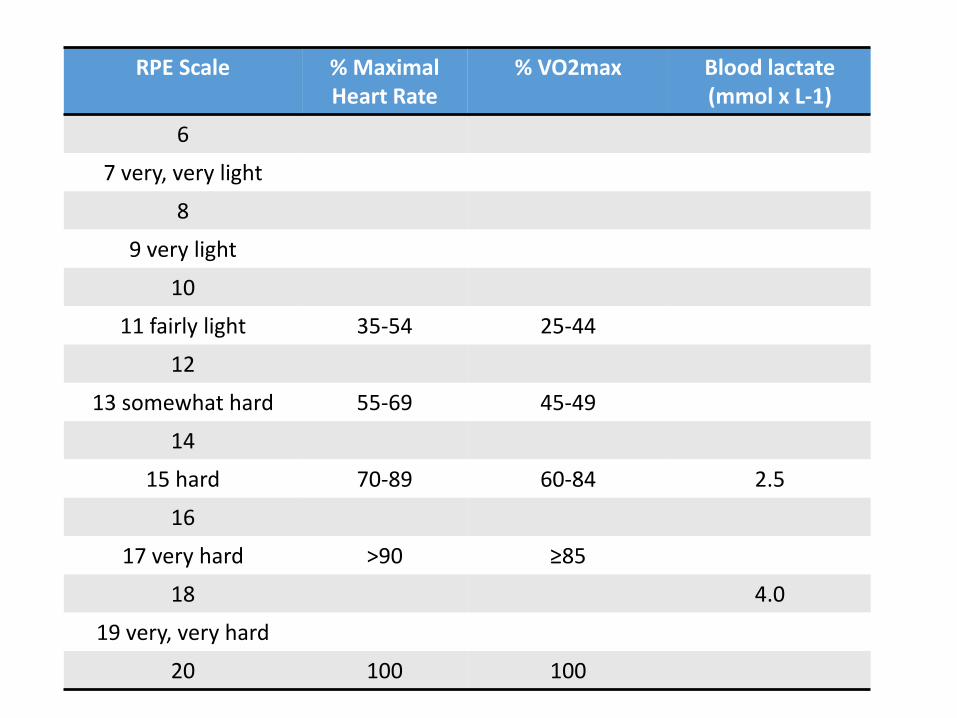
RPE Scale % Maximal Heart Rate
% VO2max Blood lactate (mmol x L-1)
6
7 very, very light
8
9 very light
10
11 fairly light 35-54 25-44
12
13 somewhat hard 55-69 45-49
14
15 hard 70-89 60-84 2.5
16
17 very hard >90 ≥85
18 4.0
19 very, very hard
20 100 100
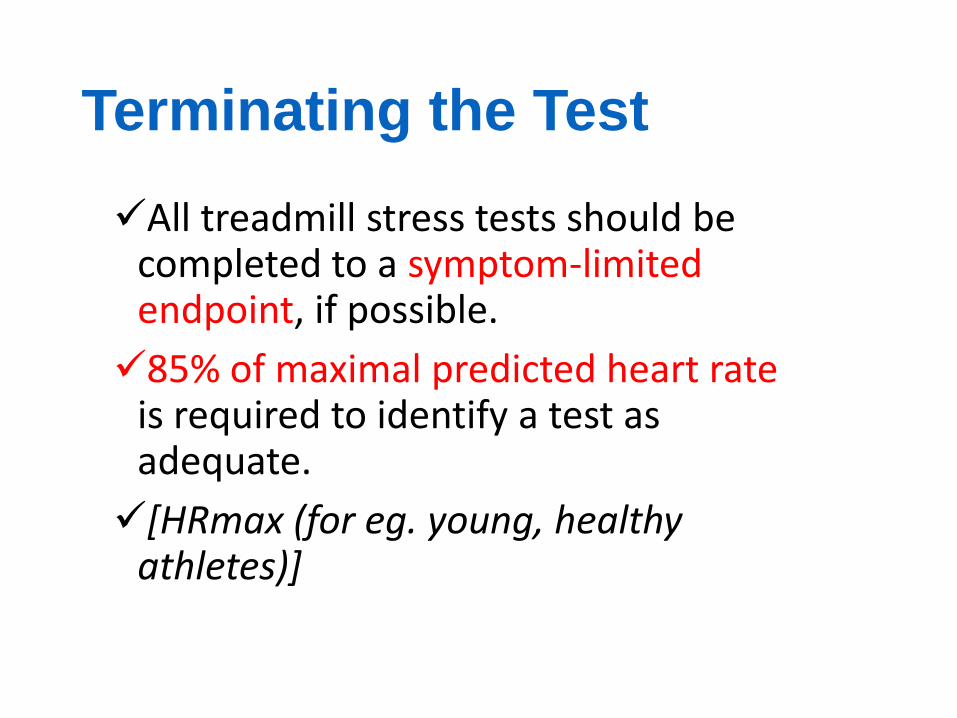
Terminating the Test
All treadmill stress tests should be completed to a symptom-limited endpoint, if possible.
85% of maximal predicted heart rate is required to identify a test as adequate.
[HRmax (for eg. young, healthy athletes)]
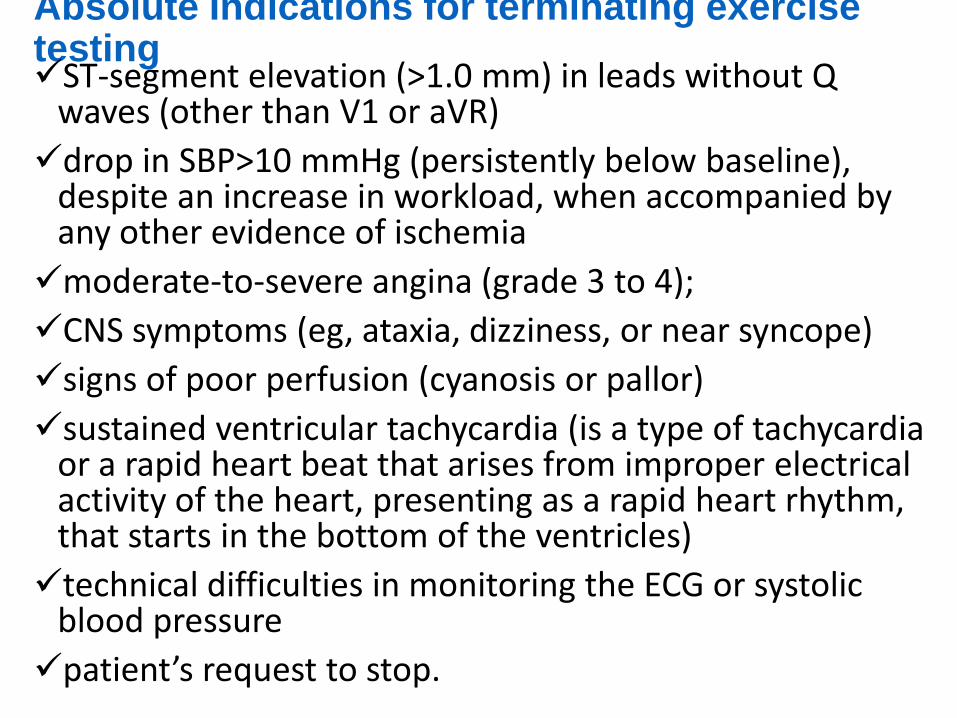
Absolute Indications for terminating exercise testing ST-segment elevation (>1.0 mm) in leads without Q
waves (other than V1 or aVR)
drop in SBP>10 mmHg (persistently below baseline), despite an increase in workload, when accompanied by any other evidence of ischemia
moderate-to-severe angina (grade 3 to 4);
CNS symptoms (eg, ataxia, dizziness, or near syncope)
signs of poor perfusion (cyanosis or pallor)
sustained ventricular tachycardia (is a type of tachycardia or a rapid heart beat that arises from improper electrical activity of the heart, presenting as a rapid heart rhythm, that starts in the bottom of the ventricles)
technical difficulties in monitoring the ECG or systolic blood pressure
patient’s request to stop.
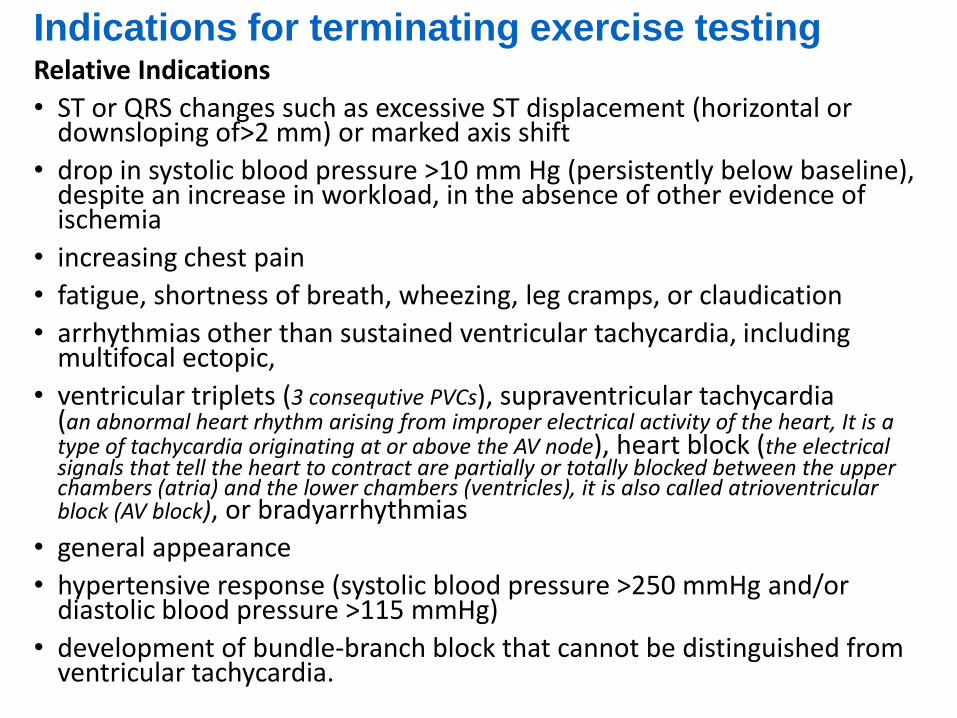
Indications for terminating exercise testing Relative Indications
• ST or QRS changes such as excessive ST displacement (horizontal or downsloping of>2 mm) or marked axis shift
• drop in systolic blood pressure >10 mm Hg (persistently below baseline), despite an increase in workload, in the absence of other evidence of ischemia
• increasing chest pain
• fatigue, shortness of breath, wheezing, leg cramps, or claudication
• arrhythmias other than sustained ventricular tachycardia, including multifocal ectopic,
• ventricular triplets (3 consequtive PVCs), supraventricular tachycardia (an abnormal heart rhythm arising from improper electrical activity of the heart, It is a type of tachycardia originating at or above the AV node), heart block (the electrical signals that tell the heart to contract are partially or totally blocked between the upper chambers (atria) and the lower chambers (ventricles), it is also called atrioventricular block (AV block), or bradyarrhythmias
• general appearance
• hypertensive response (systolic blood pressure >250 mmHg and/or diastolic blood pressure >115 mmHg)
• development of bundle-branch block that cannot be distinguished from ventricular tachycardia.
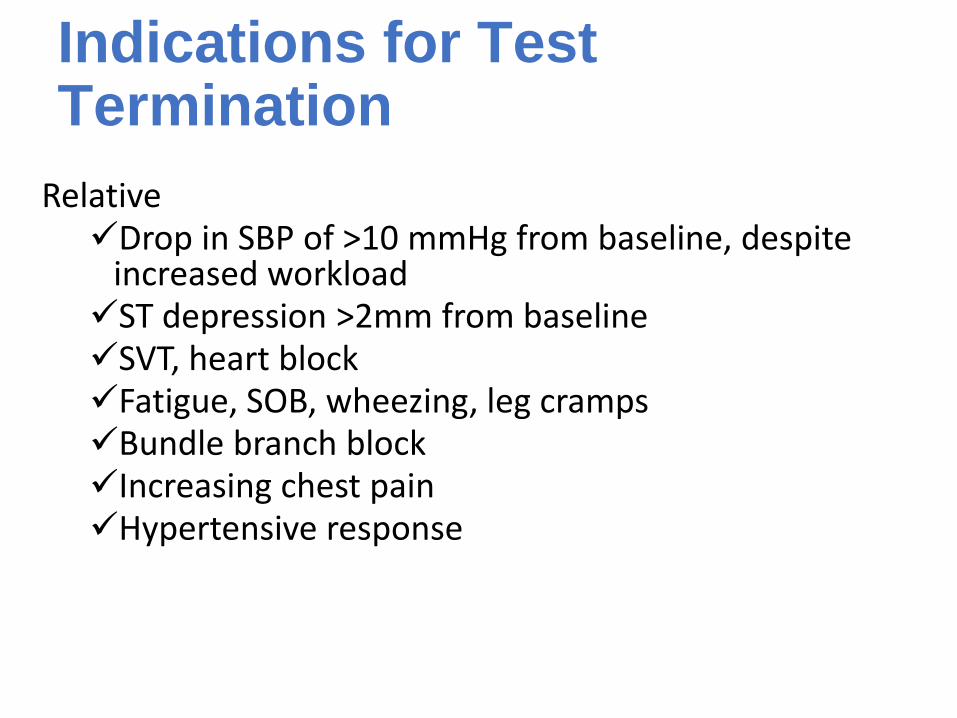
Indications for Test Termination
Relative Drop in SBP of >10 mmHg from baseline, despite
increased workload ST depression >2mm from baseline SVT, heart block Fatigue, SOB, wheezing, leg cramps Bundle branch block Increasing chest pain Hypertensive response
Recovery of the Patient
Have the patient lie down and continuously observe.
Auscultate for abnormal heart and lung sounds.
Monitor until clinically stable and electrocardiogram has returned to normal.
ECG changes in recovery just as ominous as those occurring during exercise.
Recovery of the patient
SBP, HR, ECG – monitor for 6-8min (until normal resting values)
85% of abnormal reactions may occur after 5 min of recovery
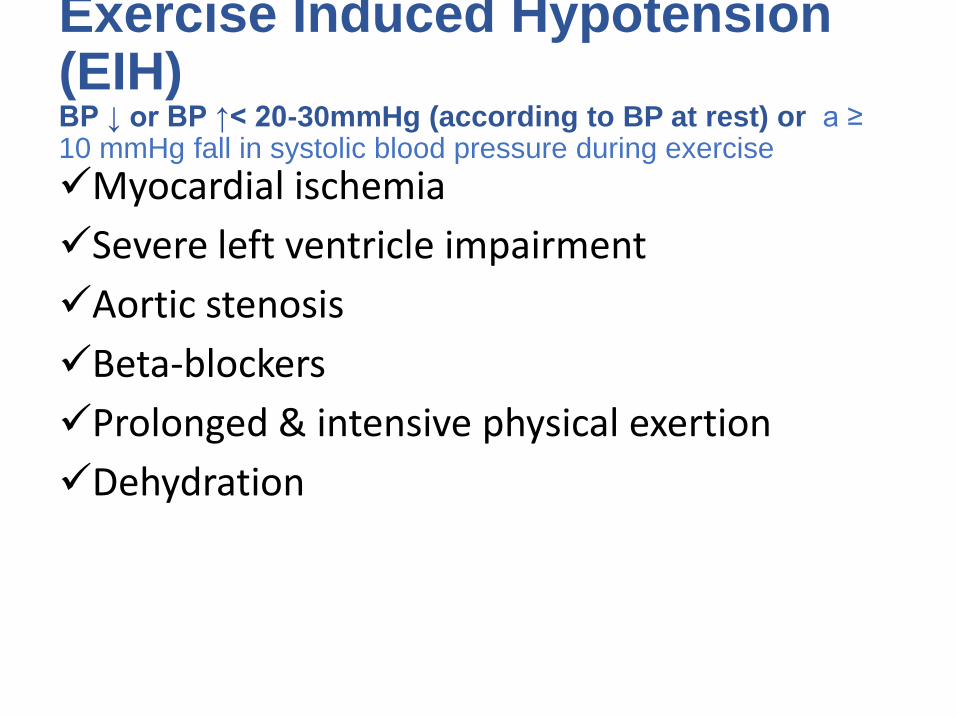
Exercise Induced Hypotension (EIH) BP ↓ or BP ↑< 20-30mmHg (according to BP at rest) or a ≥ 10 mmHg fall in systolic blood pressure during exercise
Myocardial ischemia
Severe left ventricle impairment
Aortic stenosis
Beta-blockers
Prolonged & intensive physical exertion
Dehydration
Common normal & abnormal responses to EST
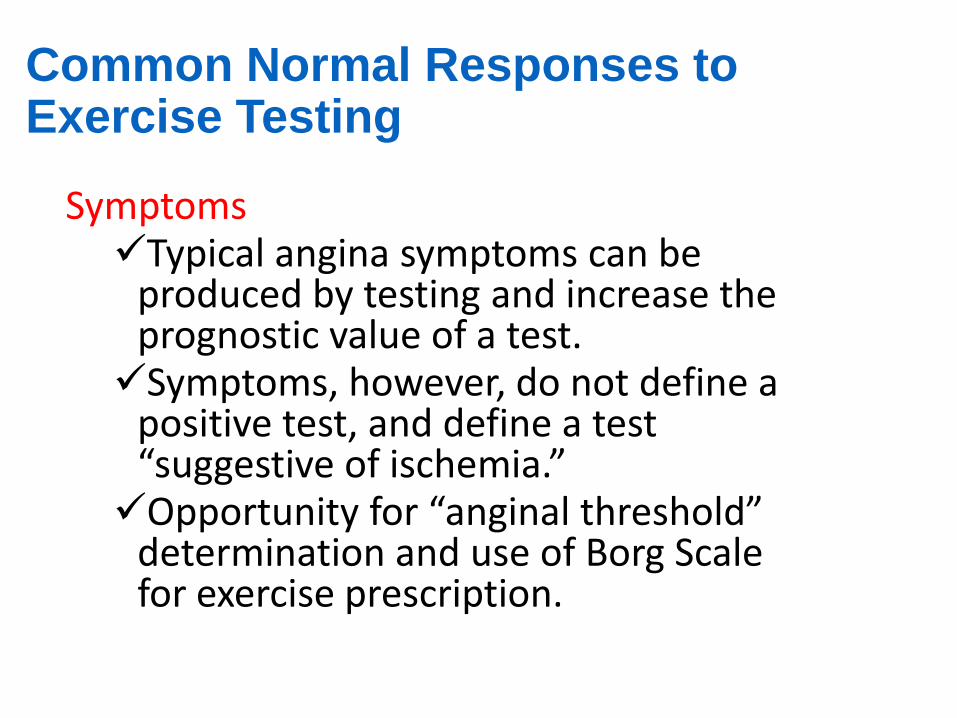
Common Normal Responses to Exercise Testing
Symptoms Typical angina symptoms can be
produced by testing and increase the prognostic value of a test. Symptoms, however, do not define a
positive test, and define a test “suggestive of ischemia.” Opportunity for “anginal threshold”
determination and use of Borg Scale for exercise prescription.
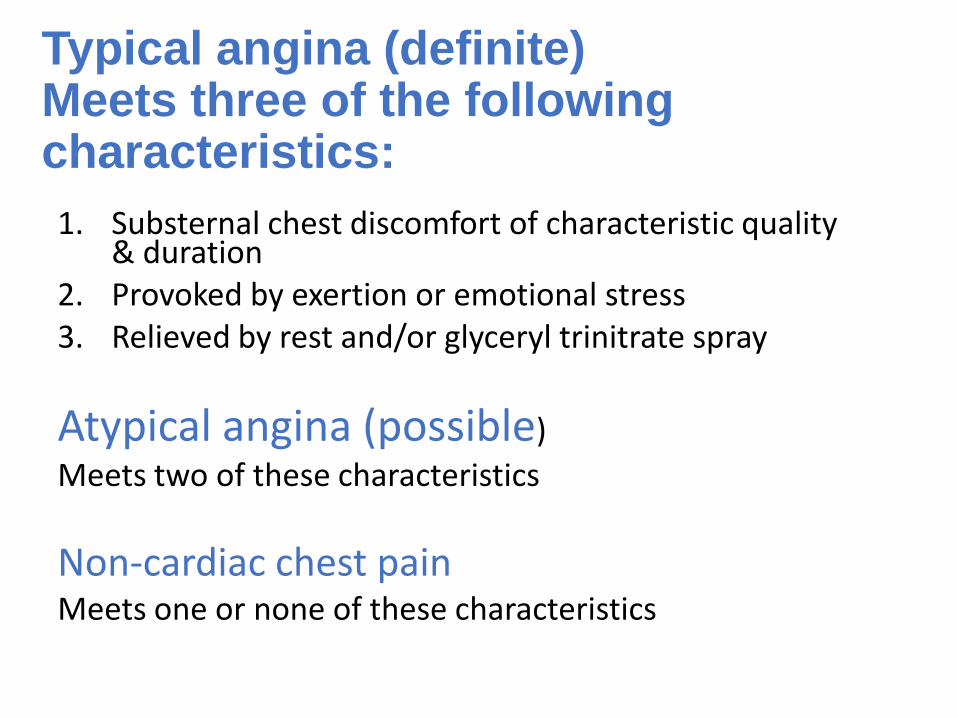
Typical angina (definite) Meets three of the following characteristics:
1. Substernal chest discomfort of characteristic quality & duration
2. Provoked by exertion or emotional stress 3. Relieved by rest and/or glyceryl trinitrate spray
Atypical angina (possible)
Meets two of these characteristics
Non-cardiac chest pain Meets one or none of these characteristics
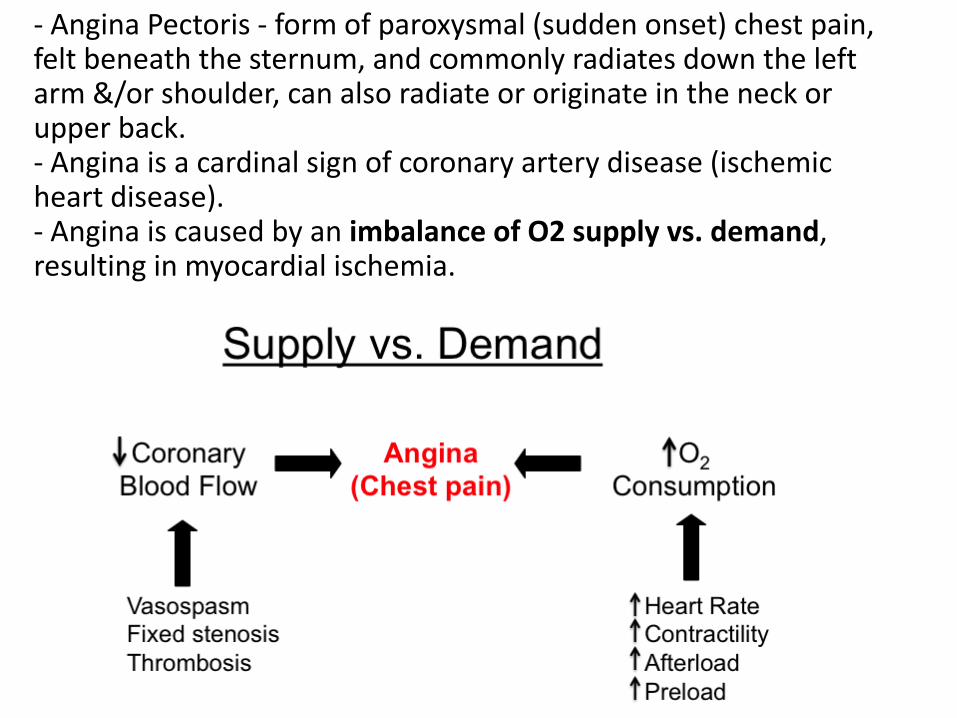
- Angina Pectoris - form of paroxysmal (sudden onset) chest pain, felt beneath the sternum, and commonly radiates down the left arm &/or shoulder, can also radiate or originate in the neck or upper back. - Angina is a cardinal sign of coronary artery disease (ischemic heart disease). - Angina is caused by an imbalance of O2 supply vs. demand, resulting in myocardial ischemia.

• P wave: • Superimposition of P and T; p
wave may increase in inferior leads.
• PR segment: • Shortens and downslopes in the
inferior leads.
• QRS complex: • minimal shortening of interval.
• J junction: • Decreases with exercise; in
subjects with resting J junction elevation, this normalizes to baseline.
• ST segment: • Demonstrates positive upslope
that returns to baseline by 80ms.
Electrocardiographic Responses to Exercise
P wave = atrial depolarisation QRS complex = ventricular depolarisation T wave = repolarisation of the ventricles
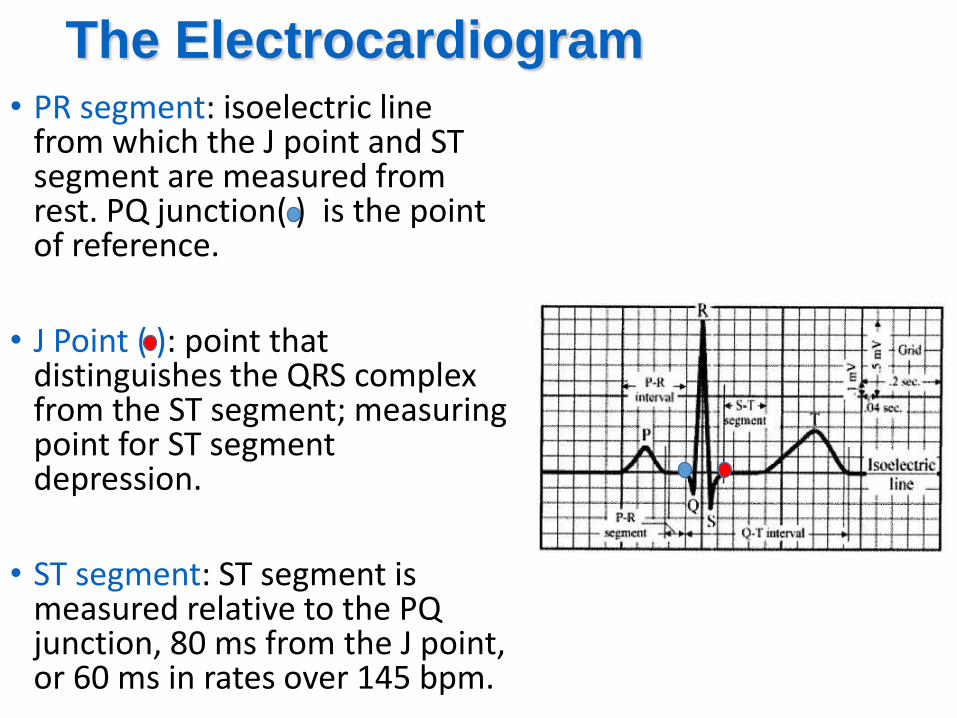
The Electrocardiogram • PR segment: isoelectric line
from which the J point and ST segment are measured from rest. PQ junction( ) is the point of reference.
• J Point ( ): point that distinguishes the QRS complex from the ST segment; measuring point for ST segment depression.
• ST segment: ST segment is measured relative to the PQ junction, 80 ms from the J point, or 60 ms in rates over 145 bpm.
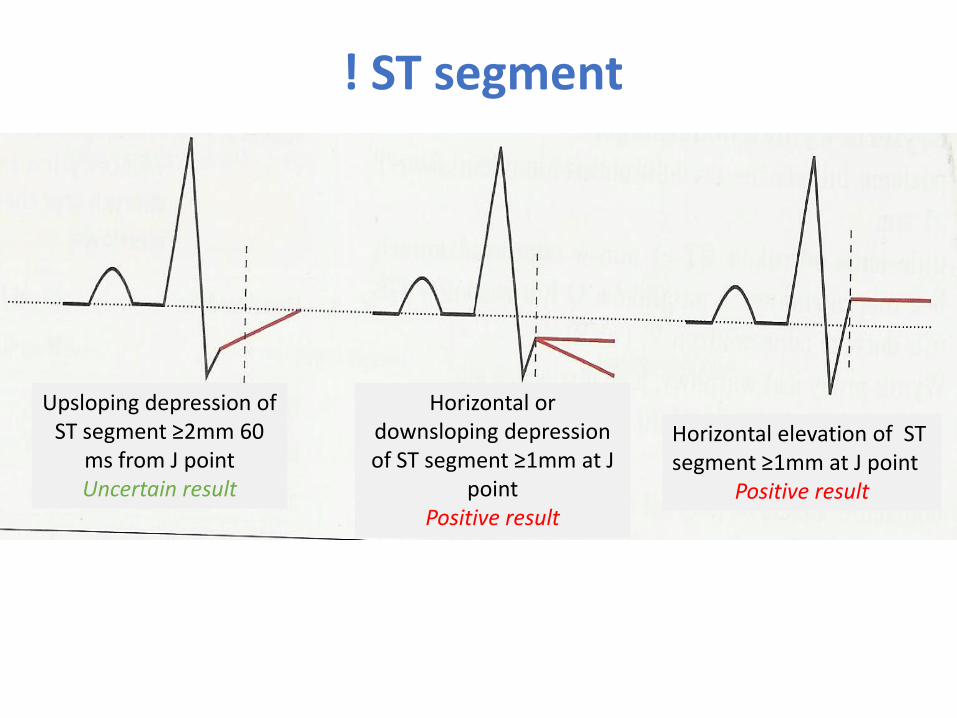
! ST segment
Upsloping depression of ST segment ≥2mm 60
ms from J point Uncertain result
Horizontal or downsloping depression of ST segment ≥1mm at J
point Positive result
Horizontal elevation of ST segment ≥1mm at J point
Positive result
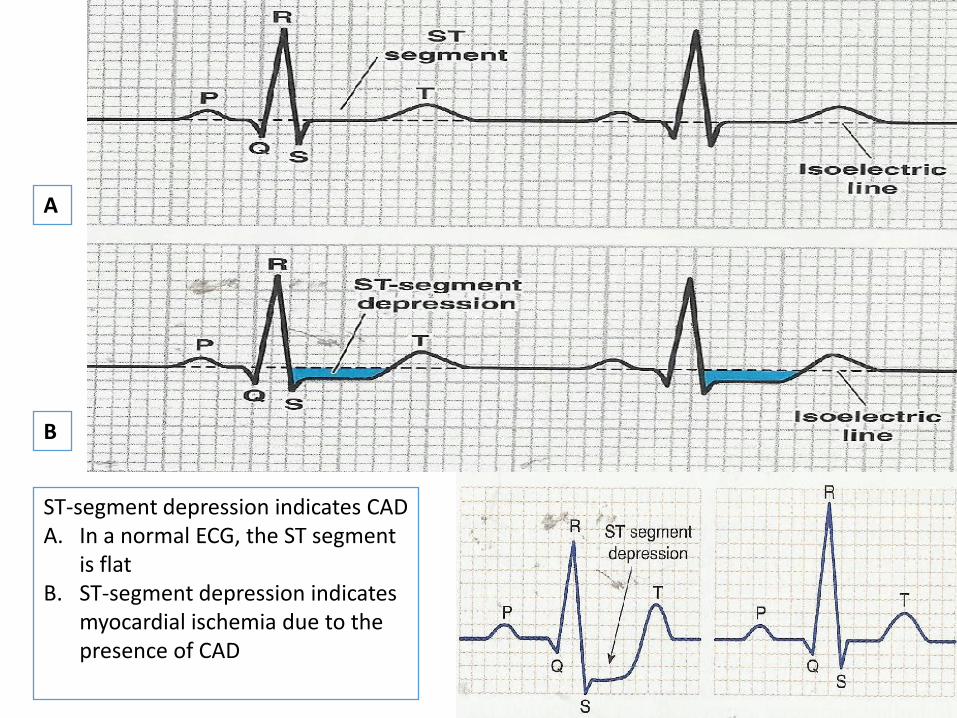
ST-segment depression indicates CAD A. In a normal ECG, the ST segment
is flat B. ST-segment depression indicates
myocardial ischemia due to the presence of CAD
A
B
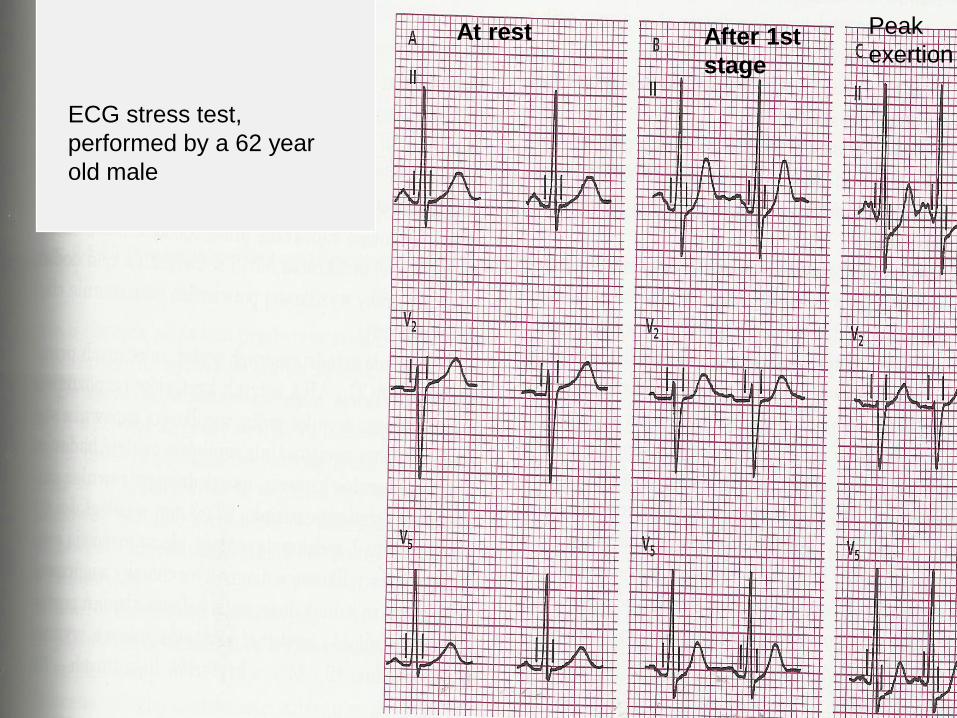
At rest Peak
exertion After 1st
stage
ECG stress test,
performed by a 62 year
old male
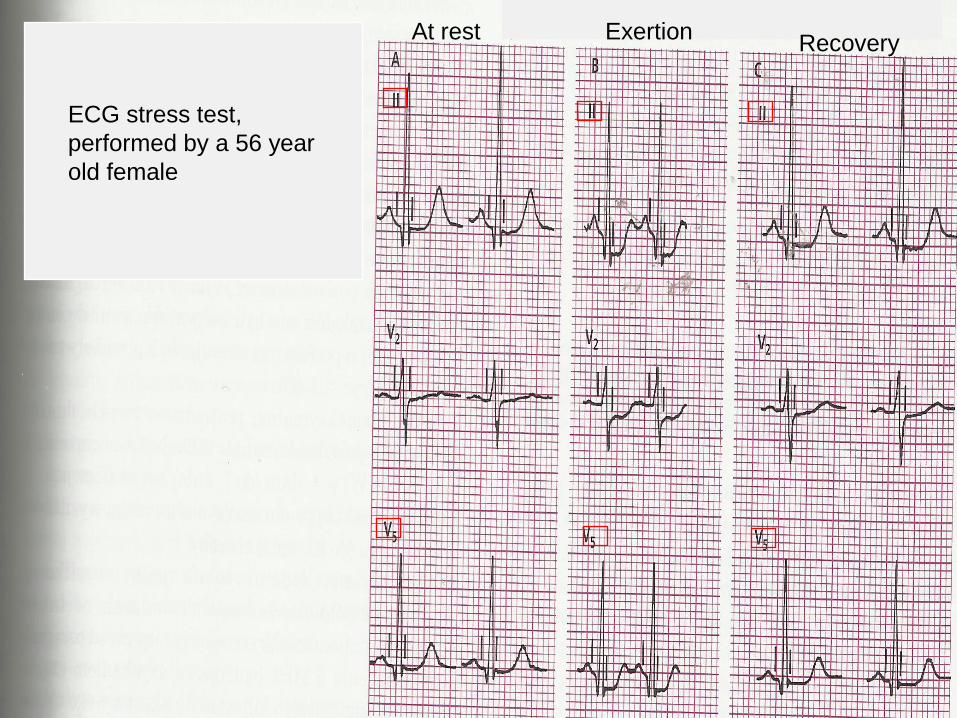
Recovery Exertion At rest
ECG stress test,
performed by a 56 year
old female
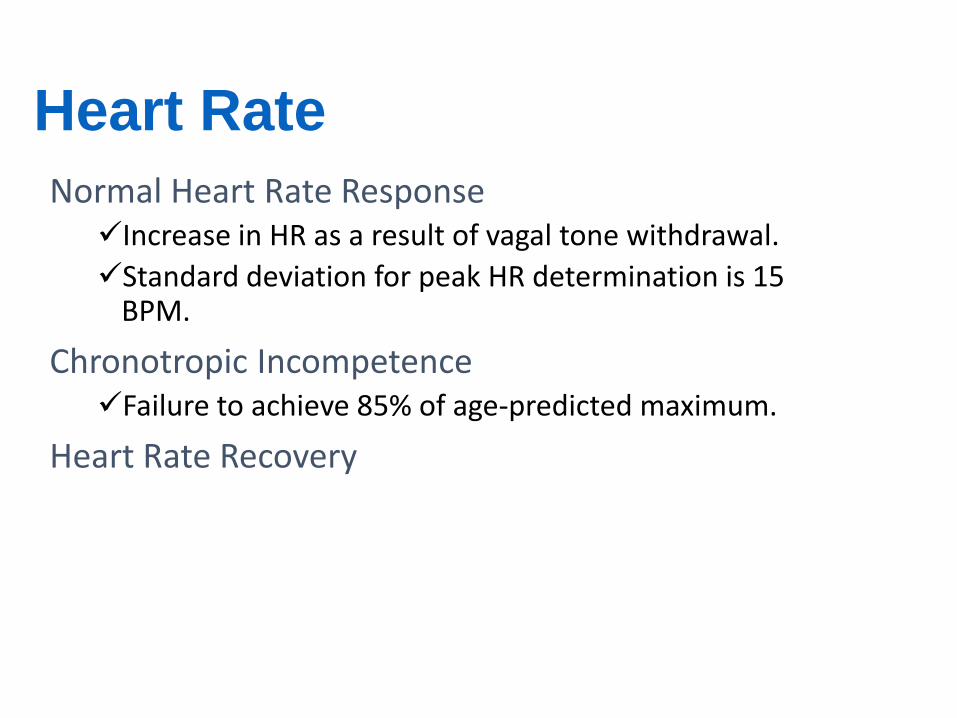
Heart Rate
Normal Heart Rate Response Increase in HR as a result of vagal tone withdrawal.
Standard deviation for peak HR determination is 15 BPM.
Chronotropic Incompetence Failure to achieve 85% of age-predicted maximum.
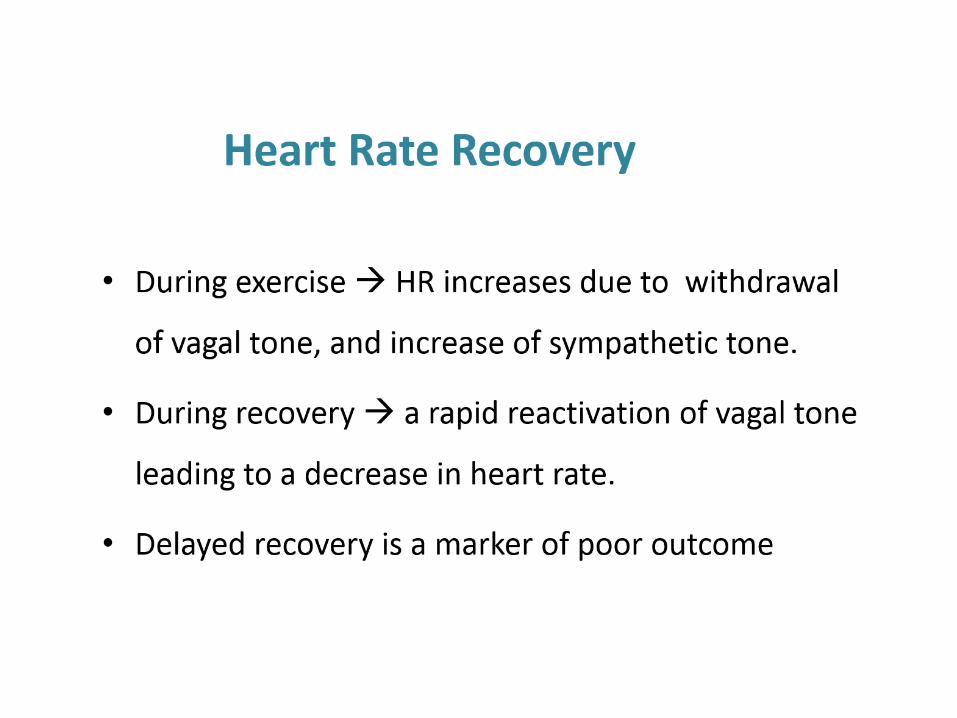
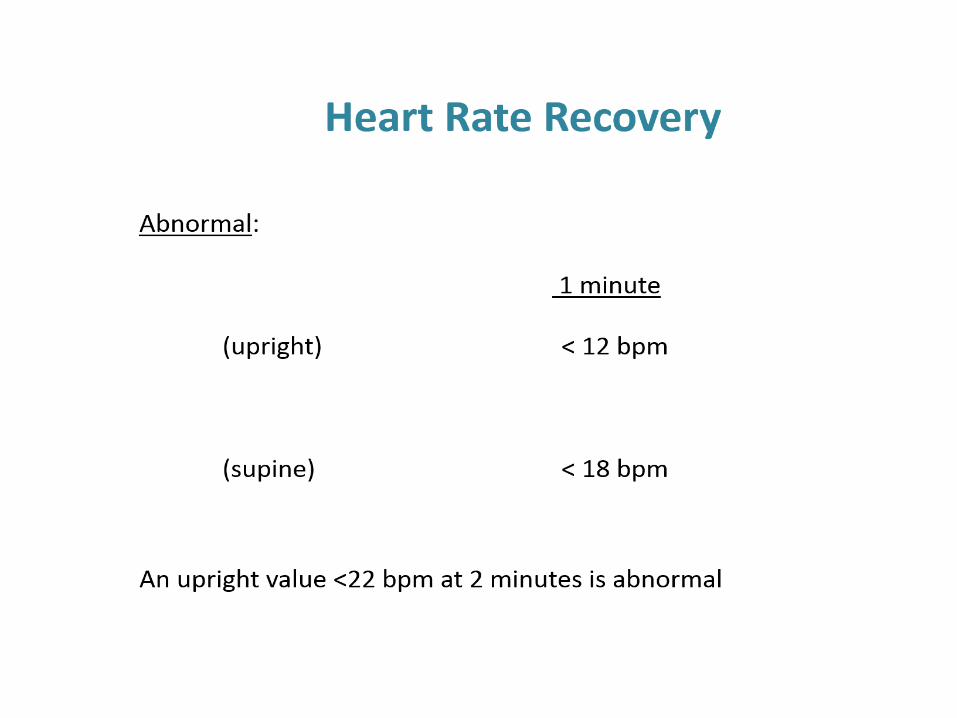
Heart Rate Recovery
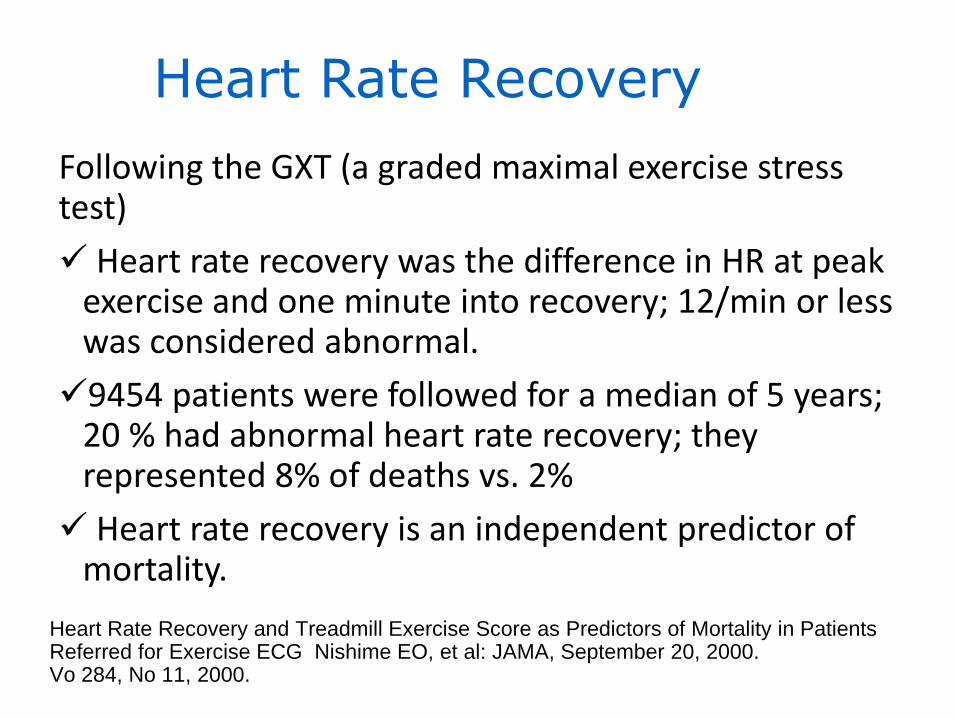
Heart Rate Recovery and Treadmill Exercise Score as Predictors of Mortality in Patients Referred for Exercise ECG Nishime EO, et al: JAMA, September 20, 2000. Vo 284, No 11, 2000.
Following the GXT (a graded maximal exercise stress test)
Heart rate recovery was the difference in HR at peak exercise and one minute into recovery; 12/min or less was considered abnormal.
9454 patients were followed for a median of 5 years; 20 % had abnormal heart rate recovery; they represented 8% of deaths vs. 2%
Heart rate recovery is an independent predictor of mortality.
Heart Rate Recovery
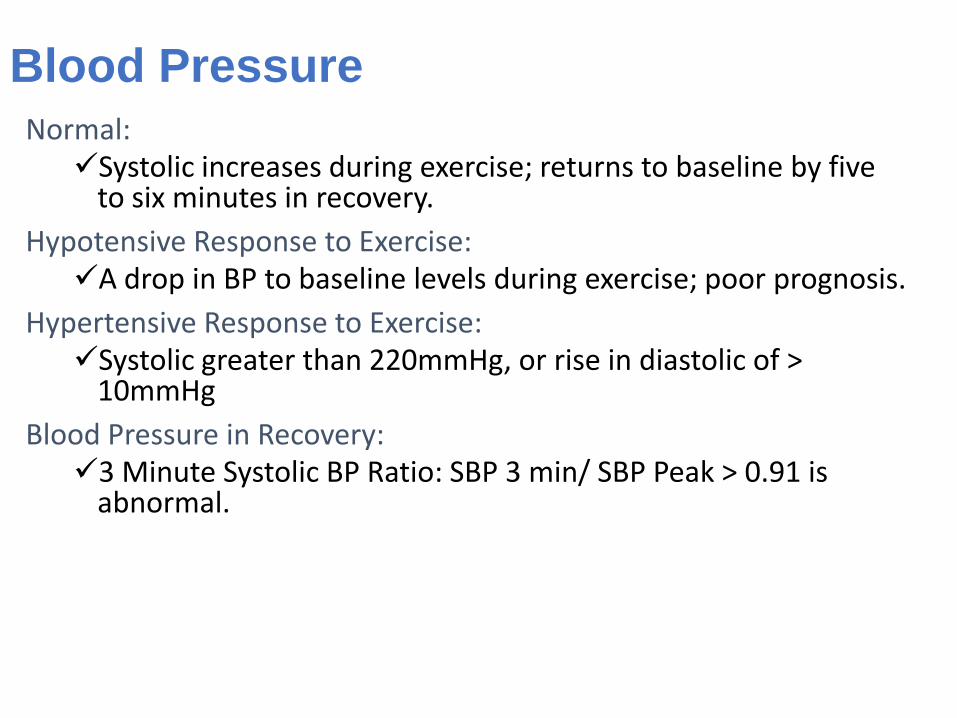
Blood Pressure
Normal: Systolic increases during exercise; returns to baseline by five
to six minutes in recovery.
Hypotensive Response to Exercise: A drop in BP to baseline levels during exercise; poor prognosis.
Hypertensive Response to Exercise: Systolic greater than 220mmHg, or rise in diastolic of >
10mmHg
Blood Pressure in Recovery: 3 Minute Systolic BP Ratio: SBP 3 min/ SBP Peak > 0.91 is
abnormal.

inte
rpre
tati
on
Symptoms
Patient’s general condition
Medical examination
Exercise capacity (METs)
BP
HR
ECG
Tracking ST segment changes identify 3 points:
P-Q junction (isoelectric line),
J point (QRS endpoint & beginning of ST)
60 or 80 ms after J point.
ECG
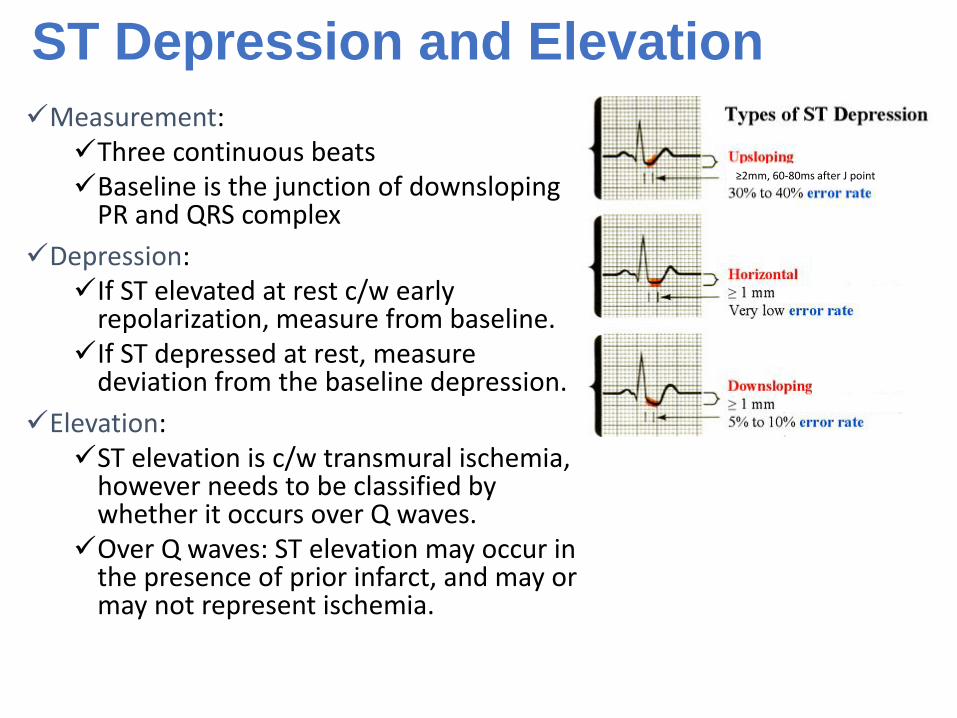
ST Depression and Elevation
Measurement: Three continuous beats Baseline is the junction of downsloping
PR and QRS complex
Depression: If ST elevated at rest c/w early
repolarization, measure from baseline. If ST depressed at rest, measure
deviation from the baseline depression.
Elevation: ST elevation is c/w transmural ischemia,
however needs to be classified by whether it occurs over Q waves. Over Q waves: ST elevation may occur in
the presence of prior infarct, and may or may not represent ischemia.
≥2mm, 60-80ms after J point
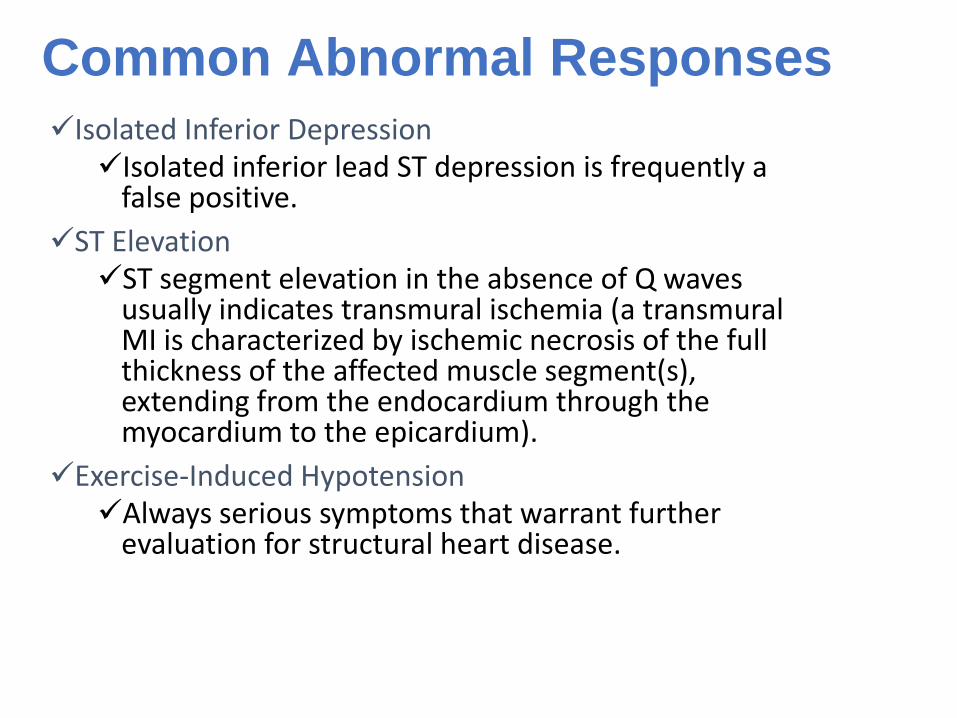
Common Abnormal Responses
Isolated Inferior Depression Isolated inferior lead ST depression is frequently a
false positive.
ST Elevation ST segment elevation in the absence of Q waves
usually indicates transmural ischemia (a transmural MI is characterized by ischemic necrosis of the full thickness of the affected muscle segment(s), extending from the endocardium through the myocardium to the epicardium).
Exercise-Induced Hypotension Always serious symptoms that warrant further
evaluation for structural heart disease.
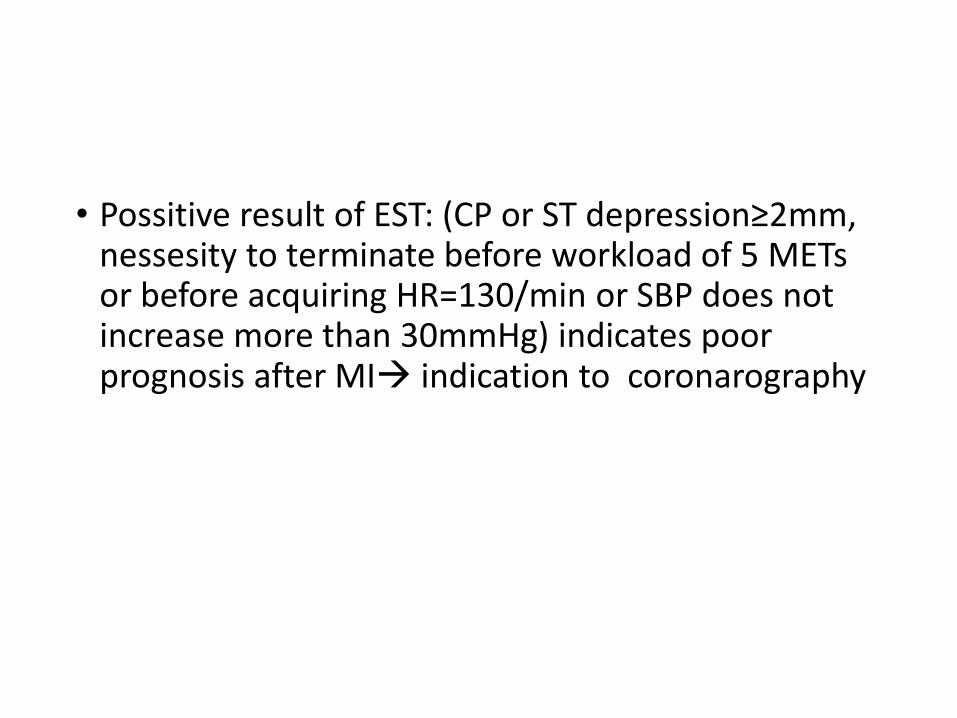
• Possitive result of EST: (CP or ST depression≥2mm, nessesity to terminate before workload of 5 METs or before acquiring HR=130/min or SBP does not increase more than 30mmHg) indicates poor prognosis after MI indication to coronarography
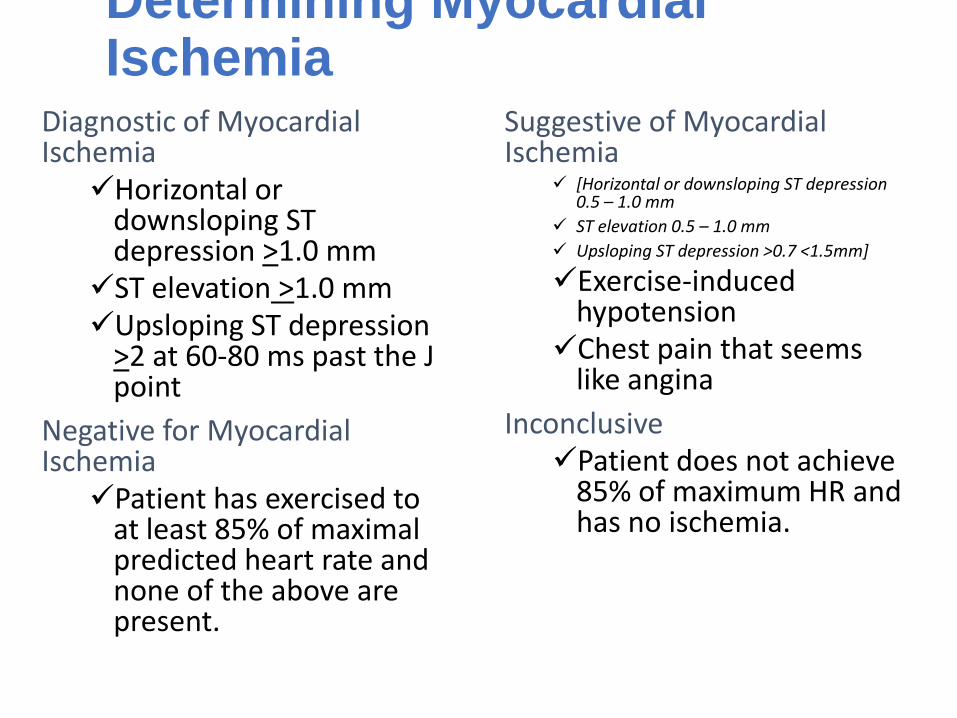
Determining Myocardial Ischemia
Diagnostic of Myocardial Ischemia Horizontal or
downsloping ST depression >1.0 mm ST elevation >1.0 mm Upsloping ST depression
>2 at 60-80 ms past the J point
Negative for Myocardial Ischemia Patient has exercised to
at least 85% of maximal predicted heart rate and none of the above are present.
Suggestive of Myocardial Ischemia
[Horizontal or downsloping ST depression 0.5 – 1.0 mm
ST elevation 0.5 – 1.0 mm
Upsloping ST depression >0.7 <1.5mm]
Exercise-induced hypotension Chest pain that seems
like angina
Inconclusive Patient does not achieve
85% of maximum HR and has no ischemia.

Exercise Test Report Information
Demographic data: name, DOB, gender, weight, height, test date
Indication(s) for test
Patient description: drug usage, resting ecg findings
Exercise test results
Protocol used
Reason(s) for stopping exercise
Hemodynamic data: resting&peak HR,BP, %HRmax, maximum rate of perceived exertion(Borg scale), peak workload, peak METs, total exercise duration(min)
Evidence for myocardial ischemia: time to onset and offset of ischemic ST segment deviation or angina, max depth of ST segment deviation, number of abnormal exercise ECG leads, abnormal systemic blood pressure responses
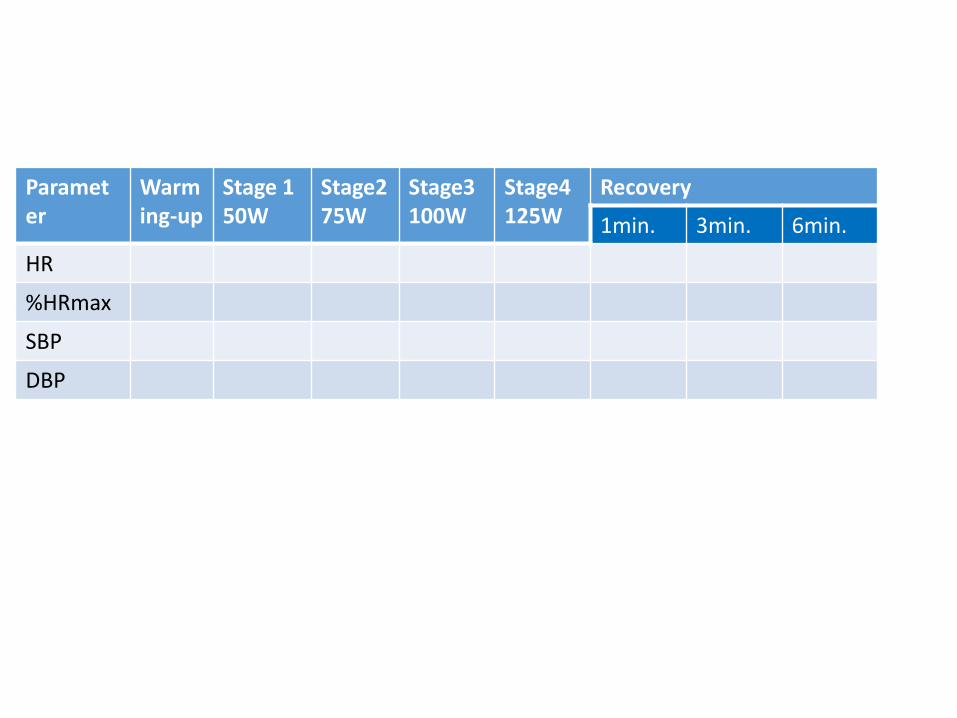
Parameter
Warming-up
Stage 1 50W
Stage2 75W
Stage3 100W
Stage4 125W
Recovery
1min. 3min. 6min.
HR
%HRmax
SBP
DBP

EST results protocol
Protocol Test duration
Workload at termination of
the test HR BP MET
Before Peak exertion Before Peak exertion
%HRmax

2. HAND STRENGHT TESTING USING THE HYDRAULIC PINCH GAUGE.
Muscle strength
• Strength - the maximal amount of force exerted during a single maximal effort.
• Strength - one of the most regularly assessed parameter of fitness health-related and sport-related fitness.
• The expression of muscular strength does not require any movement or distance covered.
• Measurement of strength developed during an isometric contraction is a commonly used method of quantyfying strength.
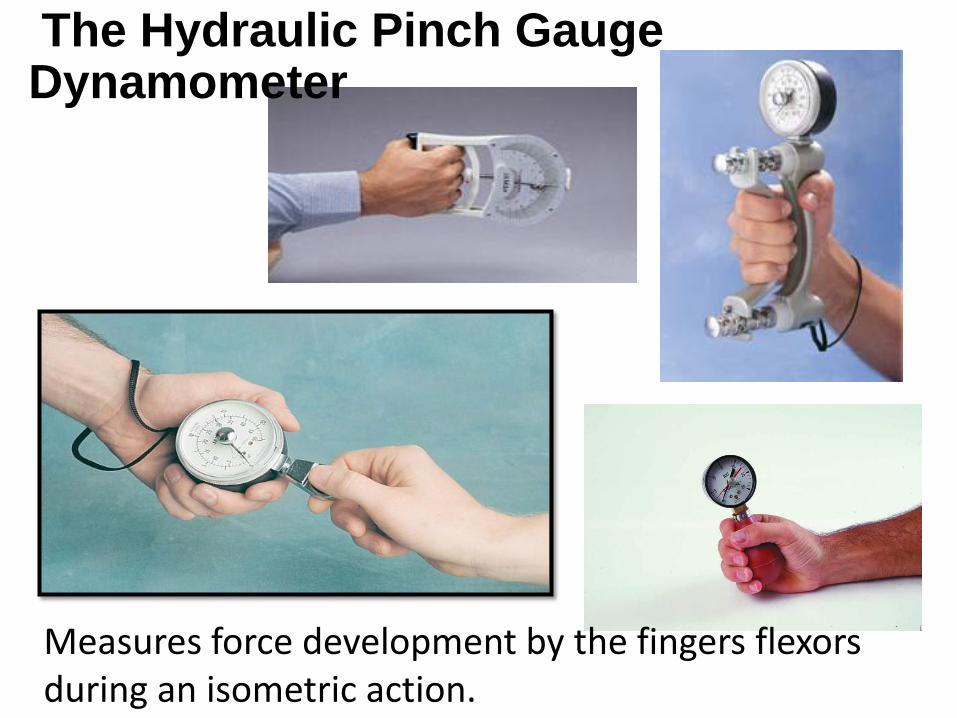
Measures force development by the fingers flexors during an isometric action.
The Hydraulic Pinch Gauge Dynamometer
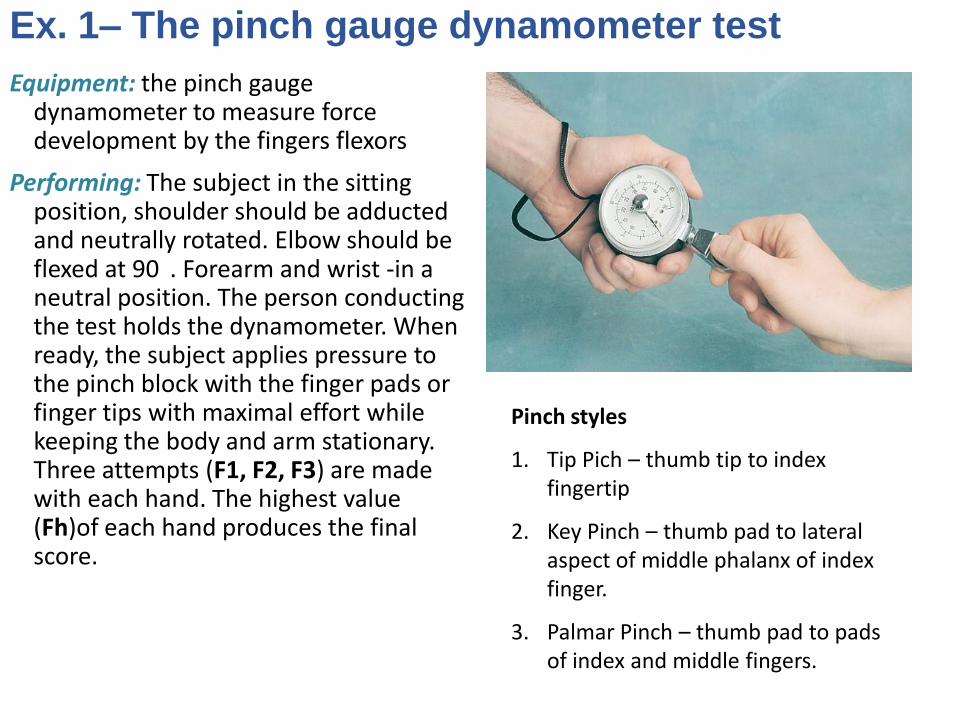
Ex. 1– The pinch gauge dynamometer test
Equipment: the pinch gauge dynamometer to measure force development by the fingers flexors
Performing: The subject in the sitting position, shoulder should be adducted and neutrally rotated. Elbow should be flexed at 90 . Forearm and wrist -in a neutral position. The person conducting the test holds the dynamometer. When ready, the subject applies pressure to the pinch block with the finger pads or finger tips with maximal effort while keeping the body and arm stationary. Three attempts (F1, F2, F3) are made with each hand. The highest value (Fh)of each hand produces the final score.
Pinch styles
1. Tip Pich – thumb tip to index fingertip
2. Key Pinch – thumb pad to lateral aspect of middle phalanx of index finger.
3. Palmar Pinch – thumb pad to pads of index and middle fingers.
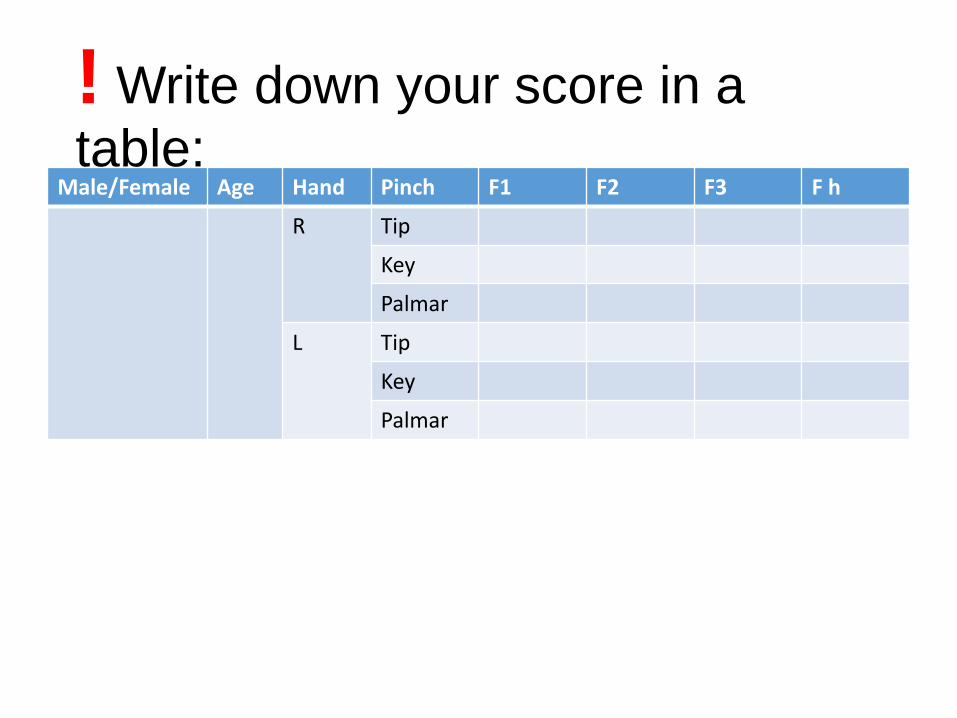
! Write down your score in a
table: Male/Female Age Hand Pinch F1 F2 F3 F h
R Tip
Key
Palmar
L Tip
Key
Palmar

Thank you