exhibit 10.1.7 nexant, inc. sulfur/sulfuric acid market...
TRANSCRIPT

Exhibit 10.1.7
Nexant, Inc. Sulfur/Sulfuric Acid Market Analysis


Final Report Q209_1436.001.11
U.S. Sulfur/Sulfuric Acid Market Analysis Supply/Demand and Pricing
June 2009 Prepared For:
Tenaska Taylorville LLC

Final Report
U.S. Sulfur/Sulfuric Acid Market Analysis
Supply/Demand and Pricing
June 2009
Prepared For:
Tenaska Taylorville LLC
44 South Broadway, White Plains, New York 10601, USA Tel: +1 914 609 0300 Fax: +1 914 609 0399
Copyright © by Nexant Inc. 2009. All rights reserved. This report was prepared by Nexant Inc (“NEXANT”), for the use of Tenaska Taylorville LLC (CLIENT) in support of their own consideration of whether and how to proceed with the subject of this report. Except where specifically stated otherwise in the report, the information contained herein was prepared on the basis of information that is publicly available or was provided by the CLIENT and has not been independently verified or otherwise examined to determine its accuracy, completeness or financial feasibility. Neither NEXANT, CLIENT nor any person acting on behalf of either assumes any liabilities with respect to the use of or for damages resulting from the use of any information contained in this report. NEXANT does not represent or warrant that any assumed conditions will come to pass. This report speaks only as of the date herein and NEXANT has no responsibility to update this report. This report is integral and must be read in its entirety. The report is submitted on the understanding that the CLIENT will maintain the contents confidential except for the CLIENT’s internal use. The report should not be reproduced, distributed or used without first obtaining prior written consent by NEXANT. This report may not be relied upon by others.
This notice must accompany every copy of this report.

U.S. Sulfur/Sulfuric Acid Market Analysis
i
Q209_01436.001.11
Contents Section Page 1 Executive Summary ................................................................................................. 1
1.1 MARKET ANALYSIS.................................................................................. 1
1.1.1 United States ...................................................................................... 1
1.1.2 PADD I .............................................................................................. 2
1.1.3 PADD II ............................................................................................. 9
1.2 TENASKA SULFUR AND SULFURIC ACID PRODUCTION................. 15
1.2.1 Introduction........................................................................................ 15
1.2.2 Molten Sulfur Production .................................................................. 16
1.2.3 Sulfuric Acid Production ................................................................... 17
1.3 INDUSTRY PROFILES................................................................................ 17
1.3.1 Sulfur.................................................................................................. 17
1.3.2 Sulfuric Acid...................................................................................... 19
1.4 PRICING AND TAYLORVILLE NETBACKS ........................................... 22
1.4.1 Sulfur.................................................................................................. 22
1.4.2 Sulfuric Acid...................................................................................... 25
1.5 RELATIVE ATTRACTIVENESS OF SULFUR VERSUS SULFURIC ACID.............................................................................................................. 29
2 Introduction.............................................................................................................. 30
3 U.S. Market Overview ............................................................................................. 31
3.1 INTRODUCTION ......................................................................................... 31
3.2 UNITED STATES SULFUR DEMAND AND SUPPLY............................. 31
3.2.1 Demand .............................................................................................. 31
3.2.2 Supply ................................................................................................ 33
3.2.3 Supply/Demand Balance.................................................................... 34
3.3 UNITED STATES SULFURIC ACID DEMAND AND SUPPLY.............. 35
3.3.1 Demand .............................................................................................. 35
3.3.2 Supply ................................................................................................ 37
3.3.3 Supply/Demand Balance.................................................................... 38
3.4 CONCLUSIONS............................................................................................ 39
3.4.1 Sulfur.................................................................................................. 39

Contents
U.S. Sulfur/Sulfuric Acid Market Analysis
ii
Q209_01436.001.11
3.4.2 Sulfuric Acid...................................................................................... 40
4 PADD 1 Market Overview ...................................................................................... 41
4.1 INTRODUCTION ......................................................................................... 41
4.2 PADD I SULFUR DEMAND AND SUPPLY.............................................. 42
4.2.1 Demand .............................................................................................. 42
4.2.2 Supply ................................................................................................ 42
4.2.3 Supply/Demand Balance.................................................................... 44
4.3 PADD I SULFURIC ACID SUPPLY AND DEMAND ............................... 45
4.3.1 Demand .............................................................................................. 45
4.3.2 Supply ................................................................................................ 45
4.3.3 Supply/Demand Balance.................................................................... 46
4.4 CONCLUSIONS............................................................................................ 48
4.4.1 Sulfur.................................................................................................. 48
4.4.2 Sulfuric Acid...................................................................................... 48
5 PADD 2 Market Overview ...................................................................................... 49
5.1 INTRODUCTION ......................................................................................... 49
5.2 PADD II SULFUR MARKET....................................................................... 49
5.2.1 Demand .............................................................................................. 49
5.2.2 Supply ................................................................................................ 51
5.2.3 Supply/Demand Balance.................................................................... 52
5.3 PADD II SULFURIC ACID SUPPLY AND DEMAND.............................. 53
5.3.1 Demand .............................................................................................. 53
5.3.2 Supply ................................................................................................ 54
5.3.3 Supply/Demand Balance.................................................................... 55
5.4 CONCLUSIONS............................................................................................ 56
5.4.1 Sulfur.................................................................................................. 56
5.4.2 Sulfuric Acid...................................................................................... 56
6 Estimated Tenaska Sulfur and Sulfuric Acid Production ................................... 57
6.1 INTRODUCTION ......................................................................................... 57
6.2 EVALUATION METHODOLOGY ............................................................. 58
6.3 MOLTEN SULFUR PRODUCTION............................................................ 60

Contents
U.S. Sulfur/Sulfuric Acid Market Analysis
iii
Q209_01436.001.11
6.4 SULFURIC ACID PRODUCTION............................................................... 60
7 Industry Profiles for PADDs I and II..................................................................... 61
7.1 INTRODUCTION ......................................................................................... 61
7.2 SULFUR INDUSTRY PROFILE.................................................................. 61
7.2.1 Consumer Profiles.............................................................................. 61
7.2.2 Producer Profiles................................................................................ 64
7.3 SULFURIC ACID INDUSTRY PROFILE................................................... 66
7.3.1 Consumer Profiles.............................................................................. 66
7.3.2 Sulfuric Acid Producer Profiles ......................................................... 93
7.4 RELAVENCE TO TENASKA...................................................................... 94
7.4.1 Sulfur.................................................................................................. 94
7.4.2 Sulfuric Acid...................................................................................... 95
8 Pricing ....................................................................................................................... 100
8.1 INTRODUCTION ......................................................................................... 100
8.2 MOLTEN SULFUR....................................................................................... 100
8.2.1 FOB Pricing ....................................................................................... 101
8.2.2 Freight Costs ...................................................................................... 103
8.2.3 Netback to Taylorville ....................................................................... 107
8.3 SULFURIC ACID ......................................................................................... 108
8.3.1 FOB Pricing ....................................................................................... 109
8.3.2 Freight Costs ...................................................................................... 110
8.3.3 Netback to Taylorville ....................................................................... 111
8.4 CONCLUSIONS............................................................................................ 113
8.4.1 Sulfur.................................................................................................. 113
8.4.2 Sulfuric Acid...................................................................................... 114
9 Relative Attractiveness of Sulfur Versus Sulfuric Acid ....................................... 115

Contents
U.S. Sulfur/Sulfuric Acid Market Analysis
iv
Q209_01436.001.11
Figure Page 1.1 PADD I Map .............................................................................................................. 3
1.2 PADD I Sulfur Demand............................................................................................. 4
1.3 PADD I Sulfur Supply ............................................................................................... 5
1.4 PADD I Sulfur Supply and Demand Balance............................................................ 6
1.5 PADD I Sulfuric Acid Demand ................................................................................. 7
1.6 PADD I Sulfuric Acid Supply ................................................................................... 8
1.7 PADD I Sulfuric Acid Supply and Demand Balance ................................................ 9
1.8 PADD II Map............................................................................................................. 10
1.9 PADD II Sulfur Supply.............................................................................................. 11
1.10 PADD II Sulfur Demand ........................................................................................... 12
1.11 PADD II Sulfur Supply and Demand Balance .......................................................... 13
1.12 PADD II Sulfuric Acid Demand................................................................................ 14
1.13 PADD II Sulfuric Acid Supply .................................................................................. 14
1.14 PADD II Sulfuric Acid Supply and Demand Balance............................................... 15
1.15 Sulfur Consumers in Illinois ...................................................................................... 18
1.16 Potential Key Competitors......................................................................................... 19
1.17 Sulfuric Acid Consumers in Illinois .......................................................................... 22
1.18 United States Sulfur Prices ........................................................................................ 23
1.19 Taylorville Sulfur Netbacks....................................................................................... 24
1.20 Tampa Sulfuric Acid Price Trend .............................................................................. 26
1.21 US Sulfuric Acid Price Forecast ................................................................................ 27
1.22 Taylorville Sulfuric Acid Netback Values................................................................. 28
3.1 Sulfur End Uses ......................................................................................................... 31
3.2 United States Sulfur Demand..................................................................................... 32
3.3 United States Sulfur Supply....................................................................................... 34
3.4 United States Sulfur Supply and Demand Balance.................................................... 35
3.5 United States Sulfuric Acid Demand......................................................................... 36
3.6 United States Sulfuric Acid Supply ........................................................................... 38
3.7 United States Sulfuric Acid Net Exports ................................................................... 39
4.1 PADD I Map .............................................................................................................. 41

Contents
U.S. Sulfur/Sulfuric Acid Market Analysis
v
Q209_01436.001.11
4.2 PADD I Sulfur Demand............................................................................................. 42
4.3 PADD I Sulfur Supply ............................................................................................... 43
4.4 PADD I Sulfur Supply and Demand Balance............................................................ 44
4.5 PADD I Sulfuric Acid Demand ................................................................................. 45
4.6 PADD I Sulfuric Acid Supply ................................................................................... 46
4.7 PADD I Sulfuric Acid Supply and Demand Balance ................................................ 47
5.1 PADD II Map............................................................................................................. 49
5.2 PADD II Sulfur Demand ........................................................................................... 50
5.3 PADD II Sulfur Supply.............................................................................................. 51
5.4 PADD II Sulfur Supply and Demand Balance .......................................................... 52
5.5 PADD II Sulfuric Acid Demand................................................................................ 53
5.6 PADD II Sulfuric Acid Supply .................................................................................. 54
5.7 PADD II Sulfuric Acid Supply and Demand Balance............................................... 55
7.1 Sulfur Consumers in Illinois ...................................................................................... 94
7.2 Potential Key Competitors......................................................................................... 95
7.3 Sulfuric Acid Consumers in Illinois .......................................................................... 98
7.4 Sulfuric Acid Producers in Illinois ............................................................................ 99
8.1 North American Sulfur Price Trend........................................................................... 102
8.2 United States Sulfur Prices ........................................................................................ 103
8.3 Taylorville Sulfur Netbacks....................................................................................... 107
8.4 Tampa Historical Sulfuric Acid Price Setting Mechanism........................................ 109
8.5 US Sulfuric Acid Price Forecast ................................................................................ 110
8.6 Taylorville Sulfuric Acid Netback Values................................................................. 112

Contents
U.S. Sulfur/Sulfuric Acid Market Analysis
vi
Q209_01436.001.11
Table Page 1.1 United States Sulfur Supply and Demand Balance.................................................... 1
1.2 Sulfuric Acid End Uses.............................................................................................. 2
1.3 United States Sulfuric Acid Supply and Demand Balance........................................ 2
1.4 PADD I Sulfur Supply and Demand Balance............................................................ 5
1.5 PADD I Sulfuric Acid Supply and Demand .............................................................. 8
1.6 PADD II Sulfur Supply and Demand ........................................................................ 12
1.7 PADD II Sulfuric Acid Supply and Demand............................................................. 15
1.8 Estimated Molten Sulfur Production ......................................................................... 16
1.9 Estimated Sulfuric Acid Production .......................................................................... 17
1.10 Sulfur Consumers in Illinois ..................................................................................... 18
1.11 Potential Key Competitors......................................................................................... 19
1.12 Chemical Companies in Illinois................................................................................. 20
1.13 Pulp and Paper Mills in Illinois ................................................................................. 21
1.14 Integrated Steel Mills in Illinois ................................................................................ 21
1.15 Ethanol Plants in Illinois............................................................................................ 21
1.16 United States Sulfur Prices ........................................................................................ 23
1.17 Taylorville Sulfur Netbacks Values........................................................................... 25
1.18 United States Sulfuric Acid Price Forecast................................................................ 27
1.19 Taylorville Sulfuric Acid Netback Values................................................................. 28
3.1 United States Sulfur Supply and Demand Balance.................................................... 34
3.2 Sulfuric Acid End Uses.............................................................................................. 35
4.1 PADD I Sulfur Supply and Demand Balance............................................................ 44
4.2 PADD I Sulfuric Acid Supply and Demand .............................................................. 46
5.1 PADD II Sulfur Supply and Demand Balance .......................................................... 52
5.2 PADD II Sulfuric Acid Supply and Demand............................................................. 55
6.1 Coal Characteristics ................................................................................................... 58
6.2 Gasification H&MB Results ...................................................................................... 59
6.3 Estimated Molten Sulfur Production ......................................................................... 60
6.4 Estimated Sulfuric Acid Production .......................................................................... 60
7.1 Sulfuric Acid Producers............................................................................................. 62

Contents
U.S. Sulfur/Sulfuric Acid Market Analysis
vii
Q209_01436.001.11
7.2 Sulfur Dioxide Producers........................................................................................... 63
7.3 Elemental Sulfur Producers ...................................................................................... 65
7.4 PADD I Pulp and Paper Mills................................................................................... 67
7.5 PADD II Pulp and Paper Mills ................................................................................. 71
7.6 Integrated Steel Mills in PADDs I and II.................................................................. 76
7.7 Ethanol Production Capacity in PADDs I and II ...................................................... 77
7.8 PADD I Chemical Companies .................................................................................. 81
7.9 PADD II Chemical Companies................................................................................. 88
7.10 Sulfuric Acid Producers............................................................................................. 93
7.11 Sulfur Consumers in Illinois ..................................................................................... 94
7.12 Potential Key Competitors......................................................................................... 95
7.13 Chemical Companies in Illinois................................................................................. 96
7.14 Pulp and Paper Mills in Illinois ................................................................................. 97
7.15 Integrated Steel Mills in Illinois ................................................................................ 97
7.16 Ethanol Plants in Illinois............................................................................................ 97
7.17 Sulfuric Acid Producers in Illinois ............................................................................ 98
8.1 United States Sulfur Prices ........................................................................................ 103
8.2 Molten Sulfur Rail Rates ........................................................................................... 104
8.3 Molten Sulfur Barge Rates......................................................................................... 105
8.4 Molten Sulfur Truck Rates......................................................................................... 106
8.5 Taylorville Sulfur Netbacks Values........................................................................... 108
8.6 United States Sulfuric Acid Price Forecast................................................................ 110
8.7 Sulfuric Acid Trucking Rates from Taylorville......................................................... 111
8.8 Sulfuric Acid Rail Rates from Taylorville................................................................. 111
8.9 Sulfuric Acid Barge Rates from Taylorville.............................................................. 111
8.10 Taylorville Sulfuric Acid Netback Values................................................................. 113


U.S. Sulfur/Sulfuric Acid Market Analysis
1
Q209_01436.001.11
Section 1 Executive Summary
1.1 MARKET ANALYSIS
1.1.1 United States
1.1.1.1 Sulfur
Sulfur is a large volume chemical with a wide range of markets. The largest market, accounting for 60 percent of domestic sulfur demand, is the production of phosphate fertilizers. The petroleum refining and metal mining industries used approximately 25 and 3 percent, respectively. The remaining 12 percent of United States sulfur demand was used for various industrial products that require sulfur in different stages of their manufacturing process.
Table 1.1 summarizes historical and forecast U.S. sulfur supply and demand. Demand totaled 12.8 million metric tons in 2008, but has declined sharply in 2009. Except for the increase in 2008, demand has been declining since 2000. It is projected to rebound from the current depressed level but decline modestly beyond 2015.
Over 90 percent of domestic U.S. sulfur supply is sulfur recovered during oil refining. The balance is sulfur recovered from natural gas. U.S. sulfur supply is forecast to increase about 0.7 percent per year to 2030. Increased recovery of domestic elemental sulfur production from petroleum refineries is expected to drive growth in future supply, reflecting modest increases in refinery throughput as well as a projected increase in the average sulfur content of crude oil processes in United States refineries.
The U.S. is a net importer of sulfur and is projected to remain in that position over the forecast period.
Table 1.1 United States Sulfur Supply and Demand Balance Thousand Metric Tons
Actual Est. Forecast AAGR, %2000 2005 2006 2007 2008 2009 2010 2015 2020 2025 2030 2000-2008 2008-2015 2015-2030
Supply 10,500 9,500 9,050 9,090 9,200 9,228 9,135 9,675 9,974 10,282 10,600 -1.4% 0.7% 0.6%Demand 12,700 12,400 12,000 11,900 12,800 10,971 10,663 11,940 11,775 11,612 11,451 -1.6% -1.0% -0.3%Net Trade (2,200) (2,900) (2,950) (2,810) (3,600) (1,744) (1,528) (2,265) (1,801) (1,330) (852) 1.1.1.2 Sulfuric Acid
Sulfuric acid is the single most widely used chemical in the world today. It has uses as a reactant, catalyst, and for pH adjustment. Table 1.2 presents the range of end uses for sulfuric acid. Sulfuric acid is a key component in the manufacture of a wide range of products, especially phosphate fertilizers. Agricultural chemicals, mainly fertilizers, consumed about 70 percent of domestic sulfuric acid demand. The petroleum refining and metal mining industries used approximately 10 percent, combined.

Section 1 Executive Summary
U.S. Sulfur/Sulfuric Acid Market Analysis
2
Q209_01436.001.11
Table 1.2 Sulfuric Acid End Uses
End Use %Phosphoric Acid and Fertilizer Production 70Copper Leaching 5Petroleum Alkylation 4Pulp and Paper 3Ammonium Sulfate 2Aluminum Sulfate 1Other 15
The U.S. is the world’s largest sulfur and sulfuric acid producing country. Sulfur supply declined over the 2000 to 2008 period due to the demise of sulfur recovery from Frasche mining. With the exception of 2001 and 2003-2005, sulfuric acid supply in the United States has generally been in the range of 32.5-33 million metric tons. The years 2003-2005 experienced supply in excess of 35 million metric tons, following supply of 31 million metric tons in 2001, caused by the economic downturn following the September 11th terrorist attacks. Future supply is forecast to decline over the forecast period at the same rate as demand with the exception of the additional capacity brought online by the Taylorville Project during 2014.
As presented in Table 1.3, the United States is a significant net importer of sulfuric acid, primarily from Canada, Mexico, and Venezuela, and is expected to remain a net importer in the future. Approximately 10 percent of sulfuric acid used for domestic consumption comes from imports.
Table 1.3 United States Sulfuric Acid Supply and Demand Balance Thousand Metric Tons
Est2000 2005 2008 2009 2010 2015 2020 2025 2030 2000-2008 2008-2015 2015-2030
Capacity 36,400 36,400 36,400 36,400 36,400 37,200 37,200 37,200 37,200Supply 33,063 34,190 32,463 28,457 27,658 31,440 31,165 30,892 30,622 -0.2% -0.5% -0.2%
Demand 36,827 36,532 35,280 30,927 30,059 34,169 33,870 33,573 33,279 -0.5% -0.5% -0.2%Net Trade (3,764) (2,342) (2,818) (2,470) (2,401) (2,729) (2,705) (2,681) (2,658)
Actual Forecast AAGR%
1.1.2 PADD I
The Petroleum Administration for Defense District (PADD) I, the East Coast, is defined in Figure 4.1. PADD I is a significant consumer of both sulfur and sulfuric acid. The area is dominated by the phosphate fertilizer industry with facilities in North Carolina and Florida. PADD I imports most of its sulfur to produce sulfuric acid, which in turn is used to manufacture fertilizers. Elemental sulfur, mainly from petroleum refining, as well as through natural gas processing, is imported into PADD I primarily from PADD III (the U.S. Gulf Coast) and foreign

Section 1 Executive Summary
U.S. Sulfur/Sulfuric Acid Market Analysis
3
Q209_01436.001.11
imports. Sulfuric acid is mainly produced from elemental sulfur in PADD I, through the recovery of off-gasses, along with the recycling of sulfuric acid from refineries.
Figure 1.1 PADD I Map
1.1.2.1 Sulfur
PADD I accounts for about 60 percent of national sulfur demand, and is expected to maintain this market share throughout the study period. Sulfur consumption in PADD I is dominated by the phosphate fertilizer industry in Florida and North Carolina.
Sulfur demand in PADD I is expected to average 0.2 percent growth per year over the 2009 to 2030 period, compared to the 0.1 percent annual growth over the last eight years. Figure 1.2 displays the historical and forecast trends for sulfur demand in PADD I.

Section 1 Executive Summary
U.S. Sulfur/Sulfuric Acid Market Analysis
4
Q209_01436.001.11
Figure 1.2 PADD I Sulfur Demand Thousand Metric Tons
0
1,000
2,000
3,000
4,000
5,000
6,000
7,000
8,000
2000 2005 2006 2007 2008 2009 2010 2015 2020 2025 2030XLS: I:\ M_Drive\ ENERGY\ 2009Proj\ 1436 Tenaska Sulf ur\ Report \ Tables and Figures\ Sulf ur Market s
Sulfur production in PADD I declined over the past decade, but is forecast to grow 0.7 percent annually over the 2009 to 2030 period. Future supply growth will be driven by an increase in the recovery of sulfur from petroleum refineries, in part due to the projected increase in the average sulfur content of crude oil that will be processed in United States refineries.
Historical and forecast trends of sulfur supply in PADD I are presented in Figure 1.3.

Section 1 Executive Summary
U.S. Sulfur/Sulfuric Acid Market Analysis
5
Q209_01436.001.11
Figure 1.3 PADD I Sulfur Supply Thousand Metric Tons
0
50
100
150
200
250
300
350
400
2000 2005 2006 2007 2008 2009 2010 2015 2020 2025 2030Petroleum and Coke Natural Gas
XLS: I:\ M_Drive\ ENERGY\ 2009Proj\ 1436 Tenaska Sulf ur\ Report \ Tables and Figures\ Sulf ur Market s
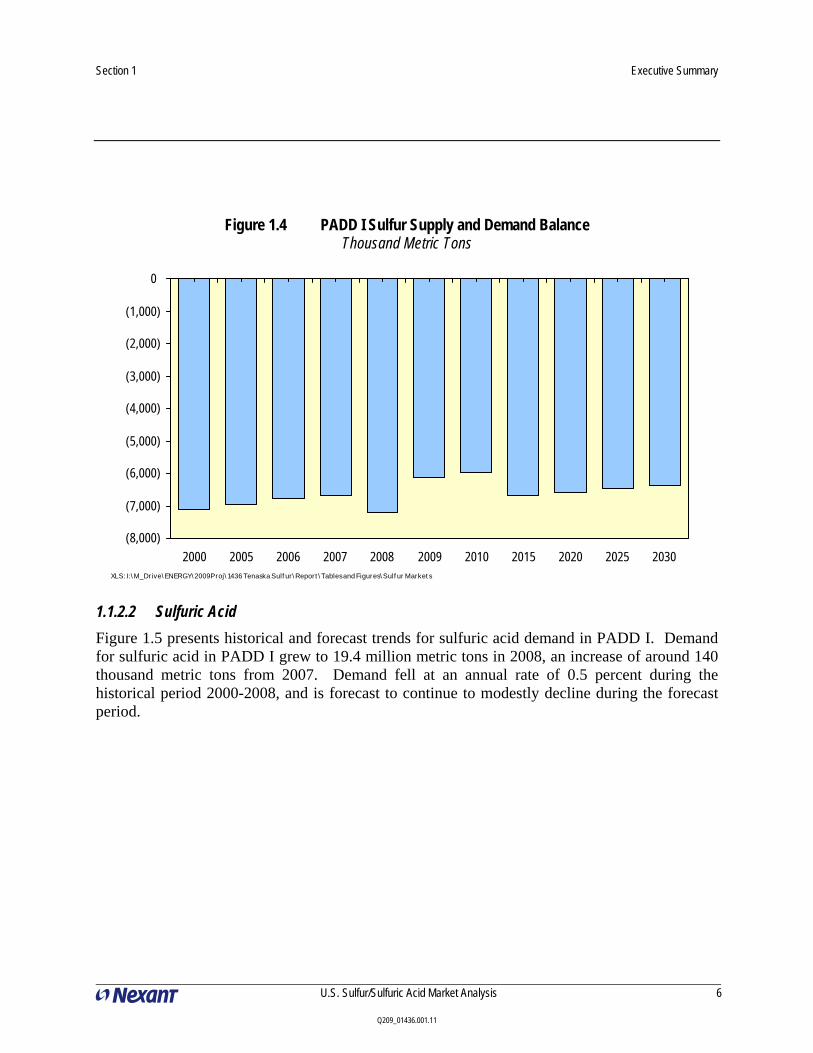
Table 1.4 summarizes historical and forecast sulfur supply and demand. PADD I is a major net importer of sulfur, primarily from PADD III (the Gulf Coast) and foreign imports. The net deficit of sulfur in PADD I was significant over the last eight years, reaching about 7.2 million metric tons in 2008. PADD I is forecast to remain a major net importer of sulfur over the forecast period, as illustrated in Figure 1.4.
Table 1.4 PADD I Sulfur Supply and Demand Balance Thousand Metric Tons
Actual Est. Forecast AAGR, %2000 2005 2006 2007 2008 2009 2010 2015 2020 2025 2030 2000-2008 2008-2015 2015-2030
Petroleum and Coke 307 277 229 270 279 269 267 283 291 300 310Natural Gas 26 24 42 13 13 23 23 24 25 26 26Total 333 301 271 283 292 292 289 307 316 326 336 -1.6% 0.7% 0.6%
7,438 7,262 7,028 6,970 7,497 6,426 6,245 6,993 6,896 6,801 6,707 0.1% -1.0% -0.3%(7,105) (6,961) (6,757) (6,687) (7,205) (6,133) (5,956) (6,687) (6,580) (6,475) (6,371)
Supply
DemandNet Trade
Section 1 Executive Summary
U.S. Sulfur/Sulfuric Acid Market Analysis
6
Q209_01436.001.11
Figure 1.4 PADD I Sulfur Supply and Demand Balance Thousand Metric Tons
(8,000)
(7,000)
(6,000)
(5,000)
(4,000)
(3,000)
(2,000)
(1,000)
0
2000 2005 2006 2007 2008 2009 2010 2015 2020 2025 2030XLS: I:\ M_Drive\ ENERGY\ 2009Proj\ 1436 Tenaska Sulf ur\ Report \ Tables and Figures\ Sulf ur Market s
1.1.2.2 Sulfuric Acid
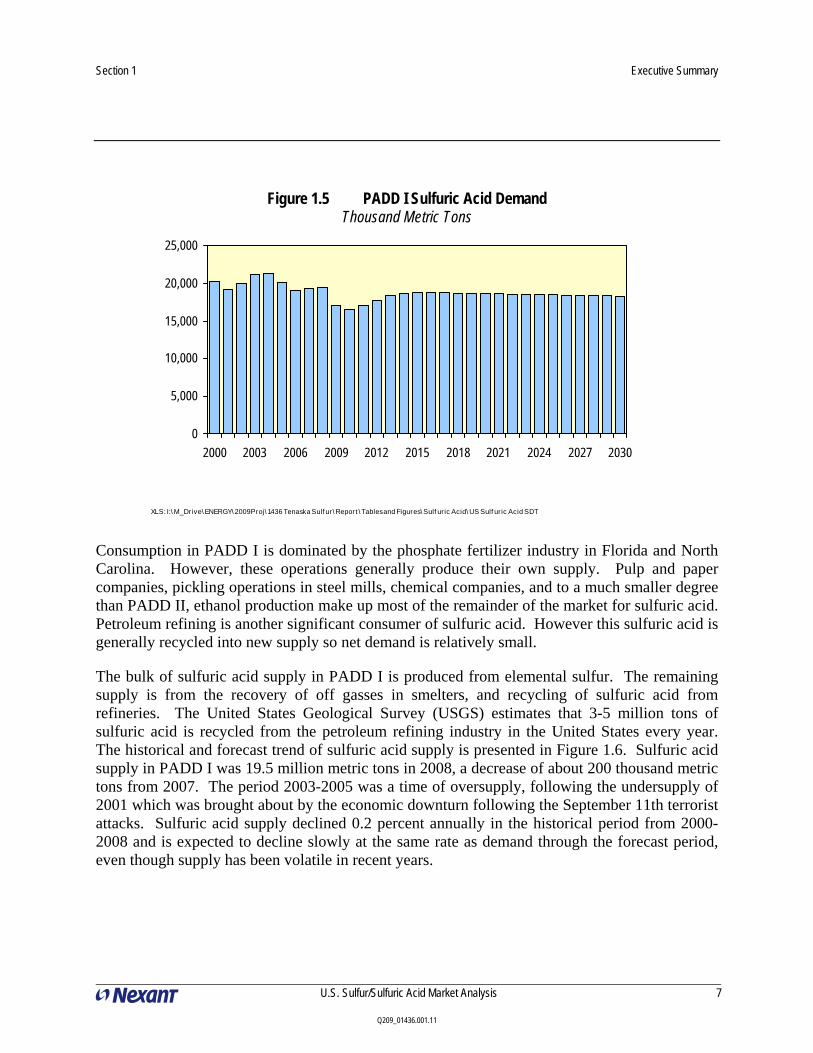
Figure 1.5 presents historical and forecast trends for sulfuric acid demand in PADD I. Demand for sulfuric acid in PADD I grew to 19.4 million metric tons in 2008, an increase of around 140 thousand metric tons from 2007. Demand fell at an annual rate of 0.5 percent during the historical period 2000-2008, and is forecast to continue to modestly decline during the forecast period.
Section 1 Executive Summary
U.S. Sulfur/Sulfuric Acid Market Analysis
7
Q209_01436.001.11
Figure 1.5 PADD I Sulfuric Acid Demand Thousand Metric Tons
0
5,000
10,000
15,000
20,000
25,000
2000 2003 2006 2009 2012 2015 2018 2021 2024 2027 2030
XLS: I:\ M_Drive\ ENERGY\ 2009Proj\ 1436 Tenaska Sulf ur\ Report \ Tables and Figures\ Sulf uric Acid\ US Sulf uric Acid SDT
Consumption in PADD I is dominated by the phosphate fertilizer industry in Florida and North Carolina. However, these operations generally produce their own supply. Pulp and paper companies, pickling operations in steel mills, chemical companies, and to a much smaller degree than PADD II, ethanol production make up most of the remainder of the market for sulfuric acid. Petroleum refining is another significant consumer of sulfuric acid. However this sulfuric acid is generally recycled into new supply so net demand is relatively small.
The bulk of sulfuric acid supply in PADD I is produced from elemental sulfur. The remaining supply is from the recovery of off gasses in smelters, and recycling of sulfuric acid from refineries. The United States Geological Survey (USGS) estimates that 3-5 million tons of sulfuric acid is recycled from the petroleum refining industry in the United States every year. The historical and forecast trend of sulfuric acid supply is presented in Figure 1.6. Sulfuric acid supply in PADD I was 19.5 million metric tons in 2008, a decrease of about 200 thousand metric tons from 2007. The period 2003-2005 was a time of oversupply, following the undersupply of 2001 which was brought about by the economic downturn following the September 11th terrorist attacks. Sulfuric acid supply declined 0.2 percent annually in the historical period from 2000-2008 and is expected to decline slowly at the same rate as demand through the forecast period, even though supply has been volatile in recent years.

Section 1 Executive Summary
U.S. Sulfur/Sulfuric Acid Market Analysis
8
Q209_01436.001.11
Figure 1.6 PADD I Sulfuric Acid Supply Thousand Metric Tons
0
5,000
10,000
15,000
20,000
25,000
2000 2003 2006 2009 2012 2015 2018 2021 2024 2027 2030
XLS: I:\ M_Drive\ ENERGY\ 2009Proj\ 1436 Tenaska Sulf ur\ Report \ Tables and Figures\ Sulf uric Acid\ US Sulf uric Acid SDT
PADD I has been a net exporter of sulfuric acid to outside the region since 2002 and is forecast to remain a modest net exporter during the forecast period. Driven by demand deterioration and the resulting supply decline, net trade (net shipments outside the region) is forecast to remain relatively low, staying less than 100 thousand tons per year, as shown in Table 1.5 and Figure 1.7.
Table 1.5 PADD I Sulfuric Acid Supply and Demand Thousand Metric Tons
Est
2000 2005 2008 2009 2010 2015 2020 2025 2030 2000-2008 2008-2015 2015-2030Capacity 21,300 21,300 21,300 21,300 21,300 21,300 21,300 21,300 21,300 Supply 19,838 20,514 19,478 17,074 16,595 18,864 18,699 18,535 18,373 -0.2% -0.5% -0.2%Demand 20,255 20,093 19,404 17,010 16,532 18,793 18,628 18,465 18,304 -0.5% -0.5% -0.2%Net Trade (417) 421 74 64 63 71 71 70 69
AAGR%Actual Forecast

Section 1 Executive Summary
U.S. Sulfur/Sulfuric Acid Market Analysis
9
Q209_01436.001.11
Figure 1.7 PADD I Sulfuric Acid Supply and Demand Balance Thousand Metric Tons
-600
-400
-200
0
200
400
600
800
2000 2003 2006 2009 2012 2015 2018 2021 2024 2027 2030
XLS: I:\ M_Drive\ ENERGY\ 2009Proj\ 1436 Tenaska Sulf ur \ Report \ Tables and Figures\ Sulf ur ic Acid\ US Sulf ur ic Acid SDT
1.1.3 PADD II
Figure 1.8 displays the definition of PADD II in map form. Figures 1.9 through 1.11 andt Table 1.6 present historical and forecast trends for sulfur in PADD II. Figures 1.12 through 1.14 and Table 1.6 present historical and forecast trends for sulfuric acid in PADD II.

Section 1 Executive Summary
U.S. Sulfur/Sulfuric Acid Market Analysis
10
Q209_01436.001.11
Figure 1.8 PADD II Map
Demand in PADD II is lower and more fragmented than PADD I, due mostly to the absence of the phosphate fertilizer industry’s concentration in PADD I.
The region had approximately 11 percent of the United States domestic sulfur supply in 2008. The majority of the sulfur supply, as seen also in PADD I, comes from petroleum refineries and coking plants. The remaining supply has been from the recovery in natural gas plants.
Sulfur production in PADD II declined 1.9 percent annually from 2000 to 2008 but is expected to grow 0.7 percent per year over the 2009 to 2030 forecast period due to the increase in the recovery of domestic elemental sulfur production from petroleum refineries and the increase in the average sulfur content of crude oil that will be processed in United States refineries. Figure 1.9 displays the historical and forecast sulfur supply in PADD II.

Section 1 Executive Summary
U.S. Sulfur/Sulfuric Acid Market Analysis
11
Q209_01436.001.11
Figure 1.9 PADD II Sulfur Supply Thousand Metric Tons
0
200
400
600
800
1,000
1,200
1,400
2000 2005 2006 2007 2008 2009 2010 2015 2020 2025 2030Petroleum and Coke Natural Gas
XLS: I:\ M_Drive\ ENERGY\ 2009Proj\ 1436 Tenaska Sulf ur\ Report \ Tables and Figures\ Sulf ur Market s

Section 1 Executive Summary
U.S. Sulfur/Sulfuric Acid Market Analysis
12
Q209_01436.001.11
Figure 1.10 PADD II Sulfur Demand Thousand Metric Tons
0
100
200
300
400
500
600
700
2000 2005 2006 2007 2008 2009 2010 2015 2020 2025 2030XLS: I:\ M_Drive\ ENERGY\ 2009Proj\ 1436 Tenaska Sulf ur\ Report \ Tables and Figures\ Sulf ur Market s
Table 1.6 PADD II Sulfur Supply and Demand Thousand Metric Tons
Actual Est. Forecast AAGR, %2000 2005 2006 2007 2008 2009 2010 2015 2020 2025 2030 2000-2008 2008-2015 2015-2030
Petroleum and Coke 1,123 1,016 1,010 944 969 987 977 1,035 1,067 1,099 1,133Natural Gas 42 38 40 40 30 37 37 39 40 41 43Total 1,165 1,054 1,050 984 999 1,024 1,014 1,074 1,107 1,141 1,176 -1.9% 1.0% 0.6%
638 623 603 598 643 551 536 600 592 584 576 0.1% -1.0% -0.3%527 431 447 386 356 472 478 473 515 557 601
Supply
DemandNet Trade

Section 1 Executive Summary
U.S. Sulfur/Sulfuric Acid Market Analysis
13
Q209_01436.001.11
Figure 1.11 PADD II Sulfur Supply and Demand Balance Thousand Metric Tons
0
100
200
300
400
500
600
700
2000 2005 2006 2007 2008 2009 2010 2015 2020 2025 2030XLS: I:\ M_Drive\ ENERGY\ 2009Proj\ 1436 Tenaska Sulf ur \ Report \ Tables and Figures\ Sulf ur Market s
Demand for sulfuric acid in the PADD II was approximately 2.47 million metric tons in 2008, an increase of 20 thousand metric tons from 2007. Sulfuric acid demand within PADD II has remained relatively constant in the historical period from 2000-2008, declining at 0.5 percent annually in the historic period, similar to the case with PADD I. Demand is forecast to continue to decline modestly during the forecast period.

Section 1 Executive Summary
U.S. Sulfur/Sulfuric Acid Market Analysis
14
Q209_01436.001.11
Figure 1.12 PADD II Sulfuric Acid Demand Thousand Metric Tons
0
500
1000
1500
2000
2500
3000
2000 2003 2006 2009 2012 2015 2018 2021 2024 2027 2030
Thou
sand
s of M
etric
Ton
s
XLS: I:\ M_Drive\ ENERGY\ 2009Proj\ 1436 Tenaska Sulf ur \ Report \ Tables and Figures\ Sulf ur ic Acid\ US Sulf ur ic Acid SDT
Figure 1.13 PADD II Sulfuric Acid Supply Thousand Metric Tons
0
200
400
600
800
1,000
1,200
1,400
1,600
1,800
2000 2005 2008 2009 2010 2015 2020 2025 2030
Thou
sand
s of M
etric
Ton
s
XLS: I:\ M_Drive\ ENERGY\ 2009Proj\ 1436 Tenaska Sulf ur\ Report \ Tables and Figures\ Sulf uric Acid\ US Sulf ur ic Acid SDT

Section 1 Executive Summary
U.S. Sulfur/Sulfuric Acid Market Analysis
15
Q209_01436.001.11
Table 1.7 summarizes historical and forecast PADD II sulfuric acid supply and demand. PADD II has been a net importer of sulfuric acid. The net sulfuric acid deficit in the region has varied slightly over the years, remaining under 1,000 thousand metric tons, as shown in Figure 1.14. With supply slowly declining at the same rate as demand in the forecast period, PADD II will remain a net importer of sulfuric acid.
Table 1.7 PADD II Sulfuric Acid Supply and Demand Thousand Metric Tons
Est2000 2005 2008 2009 2010 2015 2020 2025 2030 2000-2008 2008-2015 2015-2030
Capacity 1,800 1,800 1,800 1,800 1,800 2,600 2,600 2,600 2,600 Supply 1,653 1,710 1,623 1,423 1,383 1,572 1,558 1,545 1,531 -0.2% -0.5% -0.2%Demand 2,578 2,557 2,470 2,165 2,104 2,392 2,371 2,350 2,330 -0.5% -0.5% -0.2%Net Trade (925) (848) (846) (742) (721) (820) (813) (806) (798)
Actual Forecast AAGR%
Figure 1.14 PADD II Sulfuric Acid Supply and Demand Balance Thousand Metric Tons
-1,000-900-800-700-600-500-400-300-200-100
0
2000 2003 2006 2009 2012 2015 2018 2021 2024 2027 2030
Thou
sand
s of M
etric
Ton
s
XLS: I:\ M_Drive\ ENERGY\ 2009Proj\ 1436 Tenaska Sulf ur\ Report \ Tables and Figures\ Sulf uric Acid\ US Sulf uric Acid SDT
1.2 TENASKA SULFUR AND SULFURIC ACID PRODUCTION
1.2.1 Introduction
Tenaska is considering two coals as feed to its coal-to-SNG (CTS) project located in central Illinois. The coal being considered is expected to fall between the upper and lower limits of quality given by Coal “A” and Coal “Z”. As part of its study to consider the market potential of

Section 1 Executive Summary
U.S. Sulfur/Sulfuric Acid Market Analysis
16
Q209_01436.001.11
producing concentrated sulfuric acid instead of molten sulfur as a byproduct, Tenaska requested Nexant to determine the amount of sulfur byproduct generated from each of the two coal feeds when used to make the same amount of SNG. This task was evaluated based on producing the same total amount of CO and H2 in syngas exiting the gasifiers as an indication of identical SNG production.
Following is the current CTS plant design basis specified by Tenaska:
Type of Gasifier Slurry Feed Total Quench
Gasifier Sizes 900 ft3 each
Number of Gasifiers 3 operating + 1 spare
Gasification Pressure 1,000 psig
Total CO+H2 Needed 360 MMSCFD from 3 gasifiers
Oxygen Concentration 99.0 percent by volume
Oxygen Temperature 300 °F at gasifier inlet
Slurry Feed Preheat None
For Coal “A”, the CTS plant is capable of the following process performances:
Coal Feed 6,785 STPD (AR basis) total for 3 gasifiers
Slurry Feed Concentration 65 wt percent (dry solid basis)
Oxygen Feed Rate 5,354 STPD total for 3 gasifiers
Carbon Conversion 98 percent
Gasification Temperature 2,600 °F
1.2.2 Molten Sulfur Production
The estimated maximum molten sulfur production rates are presented in Table 1.8.
Table 1.8 Estimated Molten Sulfur Production
Coal “A” Coal “Z” Total AR Coal Feed, STPD 6,785 7,721 Total Sulfur in Syngas Exit Gasifiers, STPD 213.3 231.3 Sulfur in Treated Syngas, STPD 0.2 0.2 Sulfur in TGTU Incinerator Vent, STPD 0.4 0.5 Net Molten Sulfur Production, STPD 212.7 230.6

Section 1 Executive Summary
U.S. Sulfur/Sulfuric Acid Market Analysis
17
Q209_01436.001.11
The estimates of maximum molten sulfur production were based on the following assumptions:
Sweet syngas from Acid Gas Removal (AGR) system contains 10-ppmv residual sulfur, which will be removed in downstream zinc oxide guard beds;
Sulfur recovery from AGR acid gas in Claus sulfur recovery and Tail Gas Treatment systems is assumed to be 99.8 percent. The 0.2 percent un-recovered sulfur is vented to atmosphere via tail gas incinerator flue gas.
1.2.3 Sulfuric Acid Production
The estimated maximum sulfuric acid production rates are presented in Table 1.9.
Table 1.9 Estimated Sulfuric Acid Production
Coal “A” Coal “Z” Total AR Coal Feed, STPD 6,785 7,721 Total Sulfur in Syngas Exit Gasifiers, STPD 213.3 231.3 Sulfur in Treated Syngas, STPD 0.2 0.2 Sulfur in Acid Plant Exhaust, STPD 2.1 2.2 Net Sulfur in Sulfuric Acid, STPD Sulfur 211.0 228.9 Total Sulfuric Acid Production, STPD (98 wt%) 658.7 714.6
The estimates of maximum sulfuric acid production were based on the following assumptions:
Sweet syngas from Acid Gas Removal (AGR) system contains 10-ppmv residual sulfur, which will be removed in downstream zinc oxide guard beds;
Sulfur recovery from AGR acid gas in Sulfuric Acid Plant is assumed to be 99 percent. The 1 percent un-recovered sulfur is vented with Acid Plant Exhaust.
1.3 INDUSTRY PROFILES
The report identifies consumers and producers of both sulfur and sulfuric acid in PADDs I and PADD II, covering the following sectors: sulfur dioxide, elemental sulfur, pulp and paper, steel mills, ethanol and chemicals. Target customers and competitors for the project in Taylorville in PADD II, as well as in PADD I, have been identified and discussed in this section.
1.3.1 Sulfur
1.3.1.1 Potential Customers
A listing of potential sulfur consumers in Illinois is presented in Table 1.10, and as a map in Figure 1.15. Nexant has identified only 2 possible customers for sulfur produced at Taylorville,

Section 1 Executive Summary
U.S. Sulfur/Sulfuric Acid Market Analysis
18
Q209_01436.001.11
both of which are sulfuric acid producers. One is almost 200 miles away in Chicago, while the other is about 70 miles away in Sauget, just outside of St. Louis.
Table 1.10 Sulfur Consumers in Illinois Company LocationBig River Zinc SaugetPVS Chemical Solutions Chicago
Figure 1.15 Sulfur Consumers in Illinois
1.3.1.2 Potential Competition
A listing of potential competitors in Illinois is presented in Table 1.11 and in Figure 1.16. These possible competitors are generally closer to the possible customers than the Taylorville plant, allowing for a potential logistical advantage over Tenaska.

Section 1 Executive Summary
U.S. Sulfur/Sulfuric Acid Market Analysis
19
Q209_01436.001.11
Table 1.11 Potential Key Competitors Company LocationCITGO LemontConocoPhillips Wood RiverExxon Mobil JolietMarathon Petroleum RobinsonNatural Gas Pipeline Company of America St. Elmo
Figure 1.16 Potential Key Competitors
1.3.2 Sulfuric Acid
1.3.2.1 Potential Customers
A listing of potential sulfuric acid consumers in Illinois is presented in Tables 1.12 through 1.15, and is displayed in Figure 1.17. Chemical companies are clustered near Chicago, almost 200 miles from Taylorville, while other consumers are spread throughout the state.

Section 1 Executive Summary
U.S. Sulfur/Sulfuric Acid Market Analysis
20
Q209_01436.001.11
Table 1.12 Chemical Companies in Illinois
Company CitySteiner Electric Co. - Multiple Locations Multiple LocationsTRI SECT CORPORATION SchaumburgA-Z FACTORY SUPPLY Schiller ParkEDC Industries, Inc. Elk Grove VillageRydlyme: Apex Engineering Products Corp. AuroraElm Grove Industries, Inc. MundeleinSlide Products, Inc. WheelingChem-Impex Wood DaleCastrol Industrial North America Inc. NapervilleNuance Solutions ChicagoVelsicol Chemical Corp. RosemontDow Chemical Co. JolietWei T'o Index MattesonAdvanced Asymmetrics MillstadtPICO Chemical Corp. Chicago HeightsAtm America Corp Morton GroveStepan Co. NorthfieldRycoline Products, Inc. ChicagoTru-Test Mfg. Co. CaryRock Valley Oil & Chemical Co. RockfordR.I.T.A. Corp. WoodstockSpartan Flame Retardants Inc. Crystal LakeGraham Chemical, Inc BarringtonDow Chemical Co. ChnnahonDober Chemical Corp. MidlothianIvanhoe Industries Inc. MundeleinMPG Industries JolietOdor Management, Inc. BarringtonJLM Chemicals Inc. Blue IslandCoral Corp. WaukeganGC Electronics, Inc. RockfordExpomix WaucondaEureka Chemical Lab, Inc. ChicagoPaket Corp. ChicagoAkzo Chemicals Inc. ChicagoSunnyside Corporation WheelingTechdrive Inc. ChicagoBankmark Mount ProspectRho Chemical Co., Inc. JolietStarlite Technical Service Inc. ChicagoSearle Chemicals, Inc. Chicago

Section 1 Executive Summary
U.S. Sulfur/Sulfuric Acid Market Analysis
21
Q209_01436.001.11
Table 1.13 Pulp and Paper Mills in Illinois
Company City
Ahlstrom Paper Group TaylorvilleAlcoa Flexible Packaging Corp. JolietAlcoa Flexible Packaging Corp. PeoriaBBP America, Inc.(BBP Celotex) QuincyCaraustar Industries, Inc. ChicagoField Container Co. L.P. PekinJohns-Manville Corp. RockdaleMadison Paper Co. AlsipSCA Tissue North America L.L.C. (Svenska Cellulose Ab) AlsipRock-Tenn Co. Aurora
Table 1.14 Integrated Steel Mills in Illinois Company City
Interlake S. ChicagoNational Granite City
Table 1.15 Ethanol Plants in Illinois
Company City
Abengoa Bioenergy Corp. Madison
Adkins Energy, LLC* Lena
Ag Energy Resources, Inc. Benton
Archer Daniels Midland Decatur
Archer Daniels Midland Peoria
Aventine Renewable Energy, LLC Pekin
Big River Resources Galva, LLC Galva
Center Ethanol Company Sauget
Illinois River Energy, LLC Rochelle
Lincolnland Agri-Energy, LLC* Palestine
Marquis Energy, LLC Hennepin
One Earth Energy Gibson City
Patriot Renewable Fuels, LLC Annawan
Riverland Biofuels Canton

Section 1 Executive Summary
U.S. Sulfur/Sulfuric Acid Market Analysis
22
Q209_01436.001.11
Figure 1.17 Sulfuric Acid Consumers in Illinois
Integrated Steel Mills
Chemical Companies
Ethanol Plants
Pulp and Paper Mills
Integrated Steel Mills
Chemical Companies
Ethanol Plants
Pulp and Paper Mills
1.3.2.2 Potential Competition
The two competitive sulfuric acid producers in Illinois appear in Table 1.10 above as they are also sulfur consumers. Their locations are shown in Figure 1.17 above.
1.4 PRICING AND TAYLORVILLE NETBACKS
1.4.1 Sulfur
1.4.1.1 Pricing
Historical and forecast sulfur prices in Tampa are summarized in Table 1.16 and Figure 1.18, along with an estimated price for sulfur in Illinois. Benchmark prices in the United States are set at Tampa, and prices for sulfur in Illinois have been set relative to Tampa based on the cost of shipping sulfur from Illinois (which is surplus in sulfur) to Tampa (which is deficit in sulfur). Specifically, prices in Illinois are estimated based on the quoted price differential between Tampa and New Orleans (which is also a commonly available quotation), less the cost to ship sulfur from Illinois to New Orleans by barge. The New Orleans quoted price is marginally lower

Section 1 Executive Summary
U.S. Sulfur/Sulfuric Acid Market Analysis
23
Q209_01436.001.11
than the Tampa price, reflecting the fact that PADD 3 is surplus in sulfur. Sulfur prices are forecast to increase about 3 percent annually during the forecast period.
Table 1.16 United States Sulfur Prices Nominal Dollars per Metric Ton
Actual Est. Forecast2000 2005 2006 2007 2008 2009 2010 2015 2020 2025 2030
Tampa Contract 56 64 66 71 358 50 75 119 138 160 186Illinois 46 51 55 60 330 40 65 107 125 144 167Source: Green Markets, Pike and Fisher & Nexant Estimates
Figure 1.18 United States Sulfur Prices Nominal Dollars per Metric Ton
0
50
100
150
200
250
300
350
400
450
2000 2005 2010 2015 2020 2025 2030Tampa Contract Illinois
XLS: I:\ M_Drive\ ENERGY\ 2009Proj\ 1436 Tenaska Sulf ur \ Report \ Tables and Figures\ Sulf ur\ Sulf ur Pr icing
ForecastActual
1.4.1.2 Taylorville Netbacks
The current sulfur netback to Taylorville is approximately $16 per metric ton. This is about $16 per metric ton lower than the sulfur price in Tampa, based on sulfur transportation costs by barge. If the sulfur were shipped by rail, the current sulfur netback to Taylorville would be about $2 per metric ton. For facilities within 100 miles of Taylorville, the current sulfur netback is approximately $14 per metric ton, compared to the $20 per metric ton netback obtained for a customer within 50 miles.

Section 1 Executive Summary
U.S. Sulfur/Sulfuric Acid Market Analysis
24
Q209_01436.001.11
Nexant’s historical and forecast sulfur prices in Tampa and Illinois with netbacks to Taylorville are presented in Figure 1.19 and Table 1.17 for each of the transportation scenarios. The netbacks are slightly different for each scenario, reflecting different fuel surcharge rates for the rail transportation costs and tariffs for the barge transportation costs.
Figure 1.19 Taylorville Sulfur Netbacks Nominal Dollars per Metric Ton
-50
0
50
100
150
200
250
300
350
2000 2005 2006 2007 2008 2009 2010 2015 2020 2025 2030
Tampa Barge Netback Tampa Rail NetbackIllinois Truck Netback (50 miles) Illinois Truck Netback (100 miles)
XLS: I:\ M_Drive\ ENERGY\ 2009Proj\ 1436 Tenaska Sulf ur\ Report \ Tables and Figures\ Sulf ur\ Sulf ur Pr icing

Section 1 Executive Summary
U.S. Sulfur/Sulfuric Acid Market Analysis
25
Q209_01436.001.11
Table 1.17 Taylorville Sulfur Netbacks Values Nominal Dollars per Metric Ton
Actual Est. Forecast2000 2005 2006 2007 2008 2009 2010 2015 2020 2025 2030
Tampa Contract Price 56 64 66 71 358 50 75 119 138 160 186Barge Costs, Rail to St. Louis 35 53 57 55 64 64 65 71 77 85 93Sulfur Netback, Taylorville 21 11 9 16 294 -14 10 49 61 75 92
Tampa Contract Price 56 64 66 71 358 50 75 119 138 160 186Rail Costs, Rail to St. Louis 61 71 73 75 78 78 80 89 100 111 125Sulfur Netback, Taylorville -5 -7 -7 -4 280 -28 -5 30 39 49 61
Illinois Price - 50 miles 46 51 55 60 330 40 65 107 125 144 167Truck Costs 13 26 30 32 44 20 25 33 37 40 45Sulfur Netback, Taylorville 33 25 26 28 286 20 39 74 88 104 123
Illinois Price - 100 miles 46 51 55 60 330 40 65 107 125 144 167Truck Costs 16 33 38 41 56 25 32 43 47 52 57Sulfur Netback, Taylorville 30 18 17 19 274 14 32 65 77 93 110
1.4.2 Sulfuric Acid
1.4.2.1 Pricing
The price of sulfuric acid is tied in large part to the supply and price of sulfur. Tampa spot prices, taken over time, for sulfur and sulfuric acid are used as representative of transactions by large buyers and sellers, namely the fertilizer producers. Nexant profiles industry production economies by employing the concept of Leader and Laggard cash cost of production. The Leader plant is a modern double absorption sulfuric acid plant which can take full credit from production of byproduct steam. A Laggard plant is an older single absorption facility which is unable to use any portion of the steam byproduct credit. A Laggard plant typically represents the highest cost component of the industry, and thus can be seen as the marginal source of supply, whereas a Leader plant is more indicative of the economics of a new acid producer. Tampa sulfuric acid prices have generally been set by Laggard production economics, except for 2000/2001 when overcapacity and intense competition drove down prices to approach Leader production economics. The link between sulfur prices and sulfuric acid prices in Tampa is presented in Figure 1.20.

Section 1 Executive Summary
U.S. Sulfur/Sulfuric Acid Market Analysis
26
Q209_01436.001.11
Figure 1.20 Tampa Sulfuric Acid Price Trend
0
50
100
150
200
250
300
350
400
1996 1997 1998 1999 2000 2001 2002 2003 2004 2005 2006 2007 2008 2009Sulfuric Acid, Tampa Sulfur, Tampa Nexant Laggard Nexant Leader
$/m
etric
ton
XLS: C:\ Document s and Set t ings\ sslome\ Local Set t ings\ Temporary Int ernet Files\ OLK8\ sulf uric acid pr ice
Figure 1.21 and Table 1.18 present the United States sulfuric acid price forecast for Tampa and the U.S. Midwest.
1.4.2.2 Taylorville Netbacks
Netback values for sulfuric acid to Taylorville, based on shipping by barge, rail and truck are presented in Figure 1.22 and Table 1.19. Barge netbacks to Taylorville are negative in the short term, though becoming increasingly positive towards the end of the forecast period. The historical period, due to wild price fluctuations has both the highest and lowest netbacks. These netbacks also show that there is a cost advantage in shipping sulfuric acid by rail as opposed to barge, in the range of around $15 per ton. Trucking within 100 miles offers a greater netback to Taylorville than either barge or rail, throughout the entire time range of interest.

Section 1 Executive Summary
U.S. Sulfur/Sulfuric Acid Market Analysis
27
Q209_01436.001.11
Figure 1.21 US Sulfuric Acid Price Forecast
0
50
100
150
200
250
300
350
400
1996 1999 2002 2005 2008 2011 2014 2017 2020 2023 2026 2029Sulfuric Acid, Tampa Spot Sulfuric Acid, Midwest Spot
XLS: C:\ Document s and Set t ings\ sslome\ Local Set t ings\ Temporary Int ernet Files\ OLK8\ sulf uric acid pr ice working12109
Actual Forecast
Table 1.18 United States Sulfuric Acid Price Forecast
Nominal Dollars per Metric Ton Actual Est. Forecast
2000 2005 2006 2007 2008 2009 2010 2015 2020 2025 2030Sulfuric Acid, Tampa Spot 22 53 52 61 329 25 50 91 106 123 142Sulfuric Acid, Illinois Spot 40 59 59 67 346 38 63 105 122 141 164

Section 1 Executive Summary
U.S. Sulfur/Sulfuric Acid Market Analysis
28
Q209_01436.001.11
Figure 1.22 Taylorville Sulfuric Acid Netback Values Nominal Dollars per Metric Ton
-150
-100
-50
0
50
100
150
200
250
300
2000 2005 2008 2009 2010 2015 2020 2025 2030
Tampa Rail Netback Tampa Barge Netback
Illinois Truck Netback- 50 Miles or Less Illinois Truck Netback- 100 Miles
$/M
T
XLS: I:\ M_Drive\ ENERGY\ 2009Proj\ 1436 Tenaska Sulf ur \ Report \ Tables and Figures\ Sulf uric Acid\ sulf uric acid pr ice
Table 1.19 Taylorville Sulfuric Acid Netback Values Nominal Dollars per Metric Ton
Actual Est. ForecastUnits 2000 2005 2008 2009 2010 2015 2020 2025 2030
Tampa Price $/MT 22 53 329 25 50 91 106 123 142Rail Costs, Rail to St. Louis $/MT 52 72 80 80 81 88 96 105 115Sulfuric Acid Netback to Taylorville $/MT -30 -19 249 -55 -31 4 10 18 27
Tampa Price $/MT 22 53 329 25 50 91 106 123 142Barge Costs, Rail to St. Louis $/MT 69 98 109 110 111 120 130 142 155Sulfuric Acid Netback to Taylorville $/MT -47 -45 220 -85 -61 -28 -25 -19 -13
Illinois Price $/MT 40 59 346 38 63 105 122 141 164Trucking Costs $/MT 14 29 49 22 28 37 41 45 50Sulfuric Acid Netback - 50 Miles $/MT 25 30 297 16 34 68 81 96 114
Illinois Price $/MT 40 59 346 38 63 105 122 141 164Trucking Costs $/MT 18 36 62 28 36 47 52 57 63Sulfuric Acid Netback - 100 Miles $/MT 22 22 284 10 27 58 70 84 101

Section 1 Executive Summary
U.S. Sulfur/Sulfuric Acid Market Analysis
29
Q209_01436.001.11
1.5 RELATIVE ATTRACTIVENESS OF SULFUR VERSUS SULFURIC ACID
Tenaska wants to decide whether to recover sulfur or convert the recovered sulfur into sulfuric acid. From a market standpoint, both products have large markets. Nexant concludes that sulfuric acid potentially offers a higher netback than sulfur. This is due to the fact that PADD II is a net importer of acid, but a net exporter of sulfur. Therefore, the netbacks on acid sales will likely be closer to those assuming sales in Illinois presented above, say $30 to $114 per metric ton over the forecast period, but sulfur netbacks may be closer to those assuming sales to Tampa, say $10 to $90 per metric ton.
However, the marketing of sulfuric acid is complicated due to the highly fragmented nature of the market. Tenaska would need to retain an experienced sulfuric acid marketer to perform this task. There are several potential marketers in PADD II, including Chemtrade Logistics and PVS Sulfur Solutions, who also have a national and international sulfuric acid business position. Nexant believes a choice between selling sulfur and sulfuric acid can only be made after negotiating a sulfuric acid marketing agreement. Nexant has had some initial discussions with Chemtrade Logistics and they suggested potential interest in providing the capital for building the sulfuric acid plant.
A 660 to 715 STPD sulfuric acid plant is estimated to cost roughly 25 million dollars in 2009 dollars.


U.S. Sulfur/Sulfuric Acid Market Analysis
30
Q209_01436.001.11
Section 2 Introduction
Tenaska will be recovering 255 short tons per day of sulfur from its planned SNG/IGCC project, to be located at Taylorville, Illinois. Tenaska needs to decide whether to recover molten sulfur or to convert the sulfur to sulfuric acid for sale. In order to answer this question, it retained Nexant to conduct this market study for both sulfur and sulfuric acid. Nexant’s July 2006 study for Tenaska showed that current sulfur production in the Midwest (PADD 2) is greater than demand. Hence, Tenaska may need to sell outside the Midwest and into the East and Southeast of the U.S. (PADD 1).
This study updates the July 2006 sulfur market and pricing analysis and provides a similar demand and supply and pricing analysis for sulfuric acid. Merchant sulfuric acid demand in the U.S. overall is highly fragmented. Current major merchant suppliers (DuPont, General, Peak Sulfur, Marsulex, and Chemtrade Logistics) all regenerate spent sulfuric acid used for alkylation in refineries as well. Logistics is a key success factor in the sulfuric acid business.
Tenaska has also asked that Nexant provide the incremental costs associated with producing sulfur or sulfuric acid. The results of this market study will be shared and coordinated with the cost analysis.


U.S. Sulfur/Sulfuric Acid Market Analysis
31
Q209_01436.001.11
Section 3 U.S. Market Overview
3.1 INTRODUCTION
The United States is one of the world’s largest markets for sulfur and sulfuric markets. This section presents historical trends and forecast sulfur and sulfuric acid demand and supply to 2030.
3.2 UNITED STATES SULFUR DEMAND AND SUPPLY
3.2.1 Demand
Sulfur is used in many different industries to produce a variety of products. Figure 3.1 displays the range of end uses for sulfur consumption.
Figure 3.1 Sulfur End Uses
Source: U.S. Geological Survey
Approximately 90 percent of the sulfur in the United States is converted to sulfuric acid. It is the largest volume inorganic chemical and a key component in the manufacture of a wide range of products, especially phosphate fertilizers. Agricultural chemicals, mainly fertilizers, consumed about 60 percent of domestic sulfur demand. The petroleum refining and metal mining industries used approximately 25 and 3 percent, respectively. The remaining 12 percent of United States sulfur demand was used for various industrial products that require sulfur in different stages of their manufacturing process.

Section 3 U.S. Market Overview
U.S. Sulfur/Sulfuric Acid Market Analysis
32
Q209_01436.001.11
Overall growth in sulfur demand is expected to average 0.2 percent per year over the 2009 to 2030 period, a turnaround from the 1.6 percent average annual decline experienced over the last eight years.
Historical and forecast trends for sulfur demand are presented in Figure 3.2.
Figure 3.2 United States Sulfur Demand Thousand Metric Tons
0
2,000
4,000
6,000
8,000
10,000
12,000
14,000
2000 2005 2008 2009 2010 2015 2020 2025 2030XLS: I:\ M_Drive\ ENERGY\ 2009Proj\ 1436 Tenaska Sulf ur\ Report \ Tables and Figures\ Sulf ur Market s
Demand for sulfur in the United States totaled 12.8 million metric tons in 2008, an increase of 900 thousand metric tons over 2007. This sharp increase in US sulfur demand was due to a flyup in phosphate fertilizer demand and pricing globally which translated into sharply increased U.S. phosphate fertilizer production for both domestic use and exports and corresponding sulfur demand. However, the situation this year is sharply reversed with sharply declining phosphate fertilizer and corresponding sulfur demand for fertilizer. Overall sulfur demand in the United States has declined significantly since 2000 because of a significant decrease in the production of domestic phosphate fertilizers and therefore no growth in sulfur end use for that industry, along with weather related incidents within the Gulf Coast region, halting production within refineries during 2008.
Overall demand for sulfur is expected to reach about 11.5 million metric tons by 2030, a decrease of approximately 1.4 million metric tons from 2008 but an increase of about 500 thousand tons over estimated 2009 demand. Forecast sulfur demand will be driven by the outlook for phosphate fertilizer production in the U.S. and will be related to forecast U.S. GDP growth in other sectors. The demand for sulfur is seen to continue to decline in 2009 and 2010 due to the economic situation around the world but is expected to grow in the short-term forecast to 2015 as the global economy rebounds and U.S. phosphate fertilizer production and other U.S.

Section 3 U.S. Market Overview
U.S. Sulfur/Sulfuric Acid Market Analysis
33
Q209_01436.001.11
sulfur markets as well. However, since sulfur is in a mature commodity market in the United States, demand is seen to decrease slightly over the long term forecast from 2015 to 2030.
3.2.2 Supply
Sulfur production is expected to increase 0.7 percent per year over the 2009 to 2030 forecast period. This modest growth is a reversal of the 1.4 percent annual decline rate over the past eight years.
The United States is the leading sulfur producer in the world, next being Australia and Canada. During 2008, elemental sulfur was recovered by 40 companies at 107 plants in 26 States and the U.S. Virgin Islands. It was recovered at various petroleum refineries, natural gas processing plants and coking plants. Secondary sources of sulfur come from the sulfur dioxide from industrial mineral wastes, and flue gases. Increased recovery of domestic elemental sulfur production from petroleum refineries is expected to drive growth in future supply, reflecting modest increases in refinery throughput as well as a projected increase in the average sulfur content of crude oil processes in United States refineries.
Sulfur supply in the United States reached 9,200 thousand metric tons in 2008, 8,400 thousand metric tons coming from elemental sulfur from petroleum refineries, and the rest from other forms of sulfur production such as natural gas processing. This represented an increase of 110 thousand metric tons from 2007. However, overall sulfur supply has decreased approximately 1.6 percent over the last eight years due to the halt of United States Frasch mining at the end of 2000. Therefore, future supply will directly reflect the developments in the recovery from industrial processes such as refining and natural gas processing. It is expected that sulfur supply will slightly decrease from 2009 to 2010 due to the recession and the increase use of ethanol in the petroleum industry. However, supply is seen to increase in the long term forecast because of the lower quality crudes coming in from the Canadian oil sands, with higher sulfur contents that need to be extracted. The historical and forecast sulfur supply trends are presented in Figure 3.3.

Section 3 U.S. Market Overview
U.S. Sulfur/Sulfuric Acid Market Analysis
34
Q209_01436.001.11
Figure 3.3 United States Sulfur Supply Thousand Metric Tons
0
2,000
4,000
6,000
8,000
10,000
12,000
2000 2005 2008 2009 2010 2015 2020 2025 2030XLS: I:\ M_Drive\ ENERGY\ 2009Proj\ 1436 Tenaska Sulf ur\ Report \ Tables and Figures\ Sulf ur Market s
3.2.3 Supply/Demand Balance
The United States is a significant net importer of sulfur, primarily recovered from sour gas in Western Canada and from Mexico and Venezuela, and is expected to remain a net importer in the future. Net imports ranged from 17-28 percent of demand over the 2000-2008 historical period. Overall sulfur demand in the United States has decreased between 2000 and 2009, along with sulfur supply, creating an imbalance between domestic supply and demand. The net deficit of sulfur in the United States was approximately 3,600 thousand metric tons in 2008 (Table 3.1) compared to 2,810 thousand metric tons in 2007. Over the long term forecast period imports will decline to 0.852 million metric tons by 2030. Table 3.1 summarizes historical sulfur supply and demand and Figure 3.4 displays the historical and forecast sulfur supply/demand balance in the United States. Due to the slight decrease in sulfur demand growth over the long-term forecast, the balance between supply and demand is expected to decrease, with the United States being fewer dependants upon sulfur imports by 2030 as in 2008.
Table 3.1 United States Sulfur Supply and Demand Balance Thousand Metric Tons
Actual Est. Forecast AAGR, %2000 2005 2006 2007 2008 2009 2010 2015 2020 2025 2030 2000-2008 2008-2015 2015-2030
Supply 10,500 9,500 9,050 9,090 9,200 9,228 9,135 9,675 9,974 10,282 10,600 -1.4% 0.7% 0.6%Demand 12,700 12,400 12,000 11,900 12,800 10,971 10,663 11,940 11,775 11,612 11,451 -1.6% -1.0% -0.3%Net Trade (2,200) (2,900) (2,950) (2,810) (3,600) (1,744) (1,528) (2,265) (1,801) (1,330) (852)

Section 3 U.S. Market Overview
U.S. Sulfur/Sulfuric Acid Market Analysis
35
Q209_01436.001.11
Figure 3.4 United States Sulfur Supply and Demand Balance Net Exports Thousand Metric Tons
(4,000)
(3,500)
(3,000)
(2,500)
(2,000)
(1,500)
(1,000)
(500)
0
2000 2005 2008 2009 2010 2015 2020 2025 2030XLS: I:\ M_Drive\ ENERGY\ 2009Proj\ 1436 Tenaska Sulf ur\ Report \ Tables and Figures\ Sulf ur Market s
3.3 UNITED STATES SULFURIC ACID DEMAND AND SUPPLY
3.3.1 Demand
Sulfuric acid is the single most widely used chemical in the world today. It has uses as a reactant, catalyst, and for pH adjustment. Table 3.2 presents the range of end uses for sulfuric acid.
Table 3.2 Sulfuric Acid End Uses
End Use %Phosphoric Acid and Fertilizer Production 70Copper Leaching 5Petroleum Alkylation 4Pulp and Paper 3Ammonium Sulfate 2Aluminum Sulfate 1Other 15
Sulfuric acid is a key component in the manufacture of a wide range of products, especially phosphate fertilizers. Agricultural chemicals, mainly fertilizers, consumed about 70 percent of domestic sulfuric acid demand. The petroleum refining and metal mining industries used approximately 10 percent, combined.
Historical and forecast U.S. sulfuric acid demand is outlined in Figure 3.5. As with sulfur, sulfuric acid demand is driven by phosphate fertilizer production. Other sulfuric acid demand is

Section 3 U.S. Market Overview
U.S. Sulfur/Sulfuric Acid Market Analysis
36
Q209_01436.001.11
driven by general economic activity. Demand for sulfuric acid in the United States reached 35,280 thousand metric tons in 2008, which was an increase of approximately 200 thousand metric tons from 2007. Overall, sulfuric acid demand in the United States since 2000 has decreased by about 0.2 percent annually. Similar to sulfur, sulfuric acid demand in the United States is relatively stable and since 2000 has decreased by about 0.2 percent annually. Forecast demand is expected to rebound from a floor in 2010 and grow at a rate of 1.7 percent annually between 2009 and 2015. Demand recovery will be driven recovery in phosphate fertilizer production and by the economic recovery. However, longer term demand is forecast to fall by 0.2 percent annually from 2015-2030 as the greater overall trend of slowly diminishing demand continues.
Figure 3.5 United States Sulfuric Acid Demand Thousand Metric Tons
0
5,000
10,000
15,000
20,000
25,000
30,000
35,000
40,000
45,000
2000 2003 2006 2009 2012 2015 2018 2021 2024 2027 2030
Thou
sand
s of M
etric
Ton
s
XLS: Book1\ US Sulf . Acid. SDT

Section 3 U.S. Market Overview
U.S. Sulfur/Sulfuric Acid Market Analysis
37
Q209_01436.001.11
3.3.2 Supply
Sulfuric acid supply has been relatively stable over the past eight years, and is expected to remain constant over the forecast period with the exception of the additional capacity brought online by the Taylorville Project, should Tenaska choose to produce sulfuric acid. As this forecast is designed to help Tenaska make the decision whether to produce sulfuric acid, the forecast assumes production by Tenaska in order to evaluate such production. The sources of sulfuric acid supply vary by region and to some extent by time, but typically are as follows:
From sulfur as the feedstock − Sulfur is the source of about 63 percent of global sulfuric acid production − Sulfur generally is transported in preference to shipping sulfuric acid. Sulfur is
more cost effective to move since acid consists of a large percentage of contained water in the molecule. This allows large consumers of sulfur (especially phosphoric acid producers for fertilizer) to ship in their feedstock to their plant sites
From smelter gases − Smelter gas is the source of about 25 percent of global sulfuric acid production − Frequently smelters may not be located near the acid demand, resulting in
considerable shipments of acid product
Pyrites (sulfur-containing ores that contain FeS2, primarily) − Pyrites are the source of about nine percent of global sulfuric acid supply − Pyrites are mined on purpose for their sulfur content
Other sources constitute about three percent of acid supply (primarily the “regeneration” of spent acid and acid sludges)
With the exception of 2001 and 2003-2005, sulfuric acid supply in the United States has generally been in the range of 32.5-33 million metric tons. The years 2003-2005 experienced supply in excess of 35 million metric tons, following supply of 31 million metric tons in 2001, caused by the economic downturn following the September 11th terrorist attacks. Future supply is forecast to decline over the forecast period at the same rate as demand with the exception of the additional capacity brought online by the Taylorville Project during 2014, should Tenaska choose to produce sulfuric acid.

Section 3 U.S. Market Overview
U.S. Sulfur/Sulfuric Acid Market Analysis
38
Q209_01436.001.11
Figure 3.6 United States Sulfuric Acid Supply Thousand Metric Tons
0
5,000
10,000
15,000
20,000
25,000
30,000
35,000
40,000
2000 2003 2006 2009 2012 2015 2018 2021 2024 2027 2030
Thou
sand
s of M
etric
Ton
s
3.3.3 Supply/Demand Balance
The United States is a significant net importer of sulfuric acid, primarily from Canada, Mexico, and Venezuela, and is expected to remain a net importer in the future. Approximately 10 percent of sulfuric acid used for domestic consumption comes from imports. Historically a net importer, the United States is projected to remain a net importer over the 2015-2030 timeframe (Table 3.3 and Figure 3.7).
Table 3.3 United States Sulfuric Acid Supply and Demand Balance Thousand Metric Tons
Est2000 2005 2008 2009 2010 2015 2020 2025 2030 2000-2008 2008-2015 2015-2030
Capacity 36,400 36,400 36,400 36,400 36,400 37,200 37,200 37,200 37,200Supply 33,063 34,190 32,463 28,457 27,658 31,440 31,165 30,892 30,622 -0.2% -0.5% -0.2%
Demand 36,827 36,532 35,280 30,927 30,059 34,169 33,870 33,573 33,279 -0.5% -0.5% -0.2%Net Trade (3,764) (2,342) (2,818) (2,470) (2,401) (2,729) (2,705) (2,681) (2,658)
Actual Forecast AAGR%

Section 3 U.S. Market Overview
U.S. Sulfur/Sulfuric Acid Market Analysis
39
Q209_01436.001.11
Figure 3.7 United States Sulfuric Acid Net Exports Thousand Metric Tons
-4,000
-3,500
-3,000
-2,500
-2,000
-1,500
-1,000
-500
0
2000 2003 2006 2009 2012 2015 2018 2021 2024 2027 2030
Thou
sand
s of M
etric
Ton
s
XLS: Book1\ US Sulf . Acid. SDT
3.4 CONCLUSIONS
The following conclusions regarding sulfur and sulfuric acid markets for the United States are summarized below.
3.4.1 Sulfur
Approximately 90 percent of sulfur is converted to sulfuric acid
Even though demand in the United States has been declining since 2000, it is expected to see moderate growth from 2009 to 2030, around 0.2 percent due primarily to a recovery from current depressed economic conditions and phosphate fertilizer production
The United States is the leading sulfur producer in the world
Sulfur supply has declined from 2000-2008 due to the halt in Frasch mining in the United States
Increased recovery of domestic elemental sulfur production from petroleum refineries is expected to drive growth in future supply, reflecting modest increases in refinery throughput as well as a projected increase in the average sulfur content of crude oil processes in United States refineries.
The United States is the largest importer of sulfur around the world and is expected to continue to be an importer through the forecast period

Section 3 U.S. Market Overview
U.S. Sulfur/Sulfuric Acid Market Analysis
40
Q209_01436.001.11
3.4.2 Sulfuric Acid
Approximately 70 percent of sulfuric acid is consumed by the fertilizer industry
Sulfuric acid supply and demand in the United States is quite stable, and is forecast to slowly decline from 2015 onward
The United States is the leading sulfuric acid producer in the world
The United States has been historically a net importer of sulfuric acid and is expected to maintain this position during the forecast period
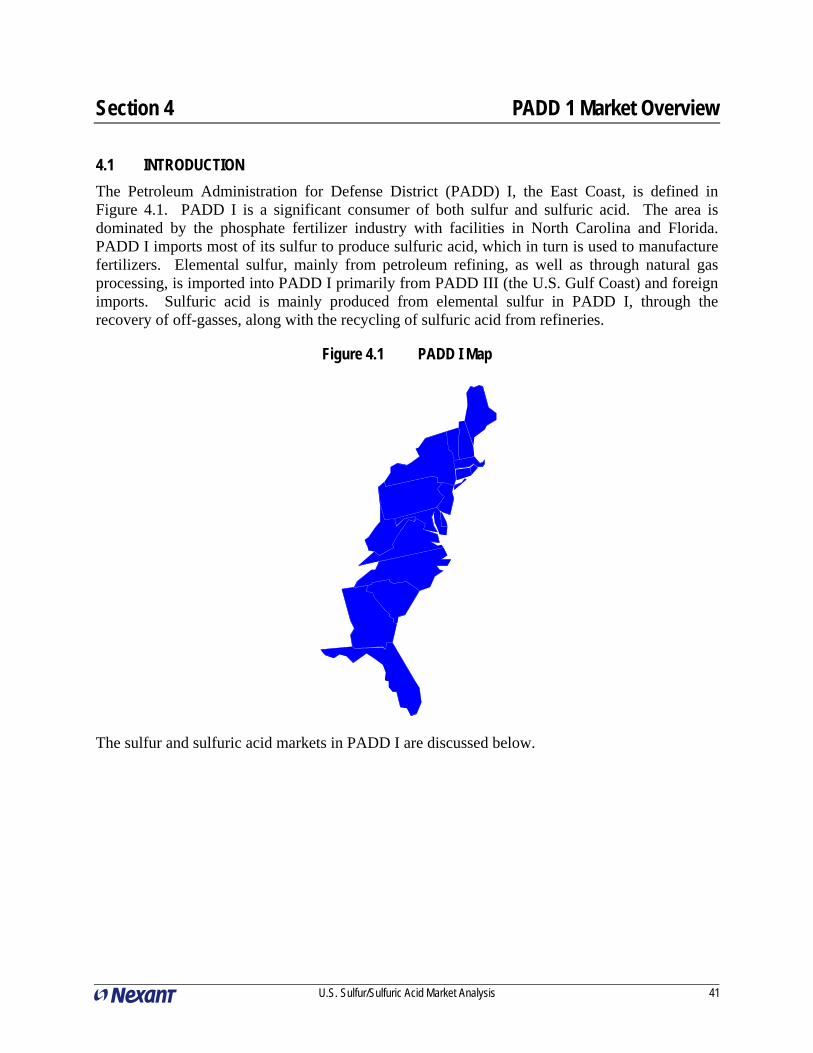
U.S. Sulfur/Sulfuric Acid Market Analysis
41
Section 4 PADD 1 Market Overview
4.1 INTRODUCTION
The Petroleum Administration for Defense District (PADD) I, the East Coast, is defined in Figure 4.1. PADD I is a significant consumer of both sulfur and sulfuric acid. The area is dominated by the phosphate fertilizer industry with facilities in North Carolina and Florida. PADD I imports most of its sulfur to produce sulfuric acid, which in turn is used to manufacture fertilizers. Elemental sulfur, mainly from petroleum refining, as well as through natural gas processing, is imported into PADD I primarily from PADD III (the U.S. Gulf Coast) and foreign imports. Sulfuric acid is mainly produced from elemental sulfur in PADD I, through the recovery of off-gasses, along with the recycling of sulfuric acid from refineries.
Figure 4.1 PADD I Map
The sulfur and sulfuric acid markets in PADD I are discussed below.

Section 4 PADD 1 Market Overview
U.S. Sulfur/Sulfuric Acid Market Analysis
42
Q209_01436.001.11
4.2 PADD I SULFUR DEMAND AND SUPPLY
4.2.1 Demand
PADD I accounts for about 60 percent of national sulfur demand, and is expected to maintain this market share throughout the study period. Sulfur consumption in PADD I is dominated by the phosphate fertilizer industry in Florida and North Carolina.
Sulfur demand in PADD I is expected to average 0.2 percent growth per year over the 2009 to 2030 period, compared to the 0.1 percent annual growth over the last eight years as shown in Figure 4.2 displays the historical and forecast trends for sulfur demand in PADD I.
Figure 4.2 PADD I Sulfur Demand Thousand Metric Tons
0
1,000
2,000
3,000
4,000
5,000
6,000
7,000
8,000
2000 2005 2006 2007 2008 2009 2010 2015 2020 2025 2030XLS: I:\ M_Drive\ ENERGY\ 2009Proj\ 1436 Tenaska Sulf ur\ Report \ Tables and Figures\ Sulf ur Market s
Demand for sulfur in PADD I increased 527 thousand metric tons to 7.497 million metric tons in 2008. The increase was due primarily to sharp increases in global phosphate fertilizer demand and U.S. phosphate fertilizer production. It is estimated to fall to 6.7 million metric tons by 2030. Demand is expected to track economic performance, and therefore demand is expected to suffer a severe contraction in 2009 and 2010, with a rebound taking place from 2011 to 2014. After 2015, it is forecast that demand will slowly decline by approximately 0.3 percent annually, reflecting the maturity of the markets served by sulfur.
4.2.2 Supply
Sulfur supply in PADD I was 292 thousand metric tons in 2008, which represented an increase of 9 thousand metric tons over 2007. Sulfur production within PADD I represents only about 3 percent of total sulfur supply to the region in 2008. The bulk of PADD I supply comes from petroleum refineries, coking plants and natural gas plants.

Section 4 PADD 1 Market Overview
U.S. Sulfur/Sulfuric Acid Market Analysis
43
Q209_01436.001.11
Sulfur production in PADD I declined over the past decade, but is forecast to grow 0.7 percent annually over the 2009 to 2030 period. Future supply growth will be driven by an increase in the recovery of sulfur from petroleum refineries, in part due to the projected increase in the average sulfur content of crude oil that will be processed in United States refineries.
Historical and forecast trends of sulfur supply in PADD I are presented in Figure 4.3.
Figure 4.3 PADD I Sulfur Supply Thousand Metric Tons
0
50
100
150
200
250
300
350
400
2000 2005 2006 2007 2008 2009 2010 2015 2020 2025 2030Petroleum and Coke Natural Gas
XLS: I:\ M_Drive\ ENERGY\ 2009Proj\ 1436 Tenaska Sulf ur\ Report \ Tables and Figures\ Sulf ur Market s

Section 4 PADD 1 Market Overview
U.S. Sulfur/Sulfuric Acid Market Analysis
44
Q209_01436.001.11
4.2.3 Supply/Demand Balance
Table 4.1 summarizes historical and forecast sulfur supply and demand. PADD I is a major net importer of sulfur, primarily from PADD III (the Gulf Coast) and foreign imports. The net deficit of sulfur in the PADD I was significant over the last eight years, reaching about 7.2 million metric tons in 2008. PADD I is forecast to remain a major net importer of sulfur over the forecast period, as illustrated in Figure 4.4.
Table 4.1 PADD I Sulfur Supply and Demand Balance Thousand Metric Tons
Actual Est. Forecast AAGR, %2000 2005 2006 2007 2008 2009 2010 2015 2020 2025 2030 2000-2008 2008-2015 2015-2030
Petroleum and Coke 307 277 229 270 279 269 267 283 291 300 310Natural Gas 26 24 42 13 13 23 23 24 25 26 26Total 333 301 271 283 292 292 289 307 316 326 336 -1.6% 0.7% 0.6%
7,438 7,262 7,028 6,970 7,497 6,426 6,245 6,993 6,896 6,801 6,707 0.1% -1.0% -0.3%(7,105) (6,961) (6,757) (6,687) (7,205) (6,133) (5,956) (6,687) (6,580) (6,475) (6,371)
Supply
DemandNet Trade
Figure 4.4 PADD I Sulfur Supply and Demand Balance Thousand Metric Tons
(8,000)
(7,000)
(6,000)
(5,000)
(4,000)
(3,000)
(2,000)
(1,000)
0
2000 2005 2006 2007 2008 2009 2010 2015 2020 2025 2030XLS: I:\ M_Drive\ ENERGY\ 2009Proj\ 1436 Tenaska Sulf ur\ Report \ Tables and Figures\ Sulf ur Market s

Section 4 PADD 1 Market Overview
U.S. Sulfur/Sulfuric Acid Market Analysis
45
Q209_01436.001.11
4.3 PADD I SULFURIC ACID SUPPLY AND DEMAND
4.3.1 Demand
Figure 4.5 outlines historical and forecast trends for sulfuric acid demand in PADD I. Demand for sulfuric acid in PADD I grew to 19.4 million metric tons in 2008, an increase of around 140 thousand metric tons from 2007. Demand fell at an annual rate of 0.5 percent during the historical period 2000-2008, and is forecast to continue to modestly decline during the forecast period.
Figure 4.5 PADD I Sulfuric Acid Demand Thousand Metric Tons
0
5,000
10,000
15,000
20,000
25,000
2000 2003 2006 2009 2012 2015 2018 2021 2024 2027 2030
XLS: I:\ M_Drive\ ENERGY\ 2009Proj\ 1436 Tenaska Sulf ur\ Report \ Tables and Figures\ Sulf uric Acid\ US Sulf uric Acid SDT
Consumption in PADD I is dominated by the phosphate fertilizer industry in Florida and North Carolina. However, these operations generally produce their own supply. Pulp and paper companies, pickling operations in steel mills, chemical companies, and to a much smaller degree than PADD II, ethanol production make up most of the remainder of the market for sulfuric acid. Petroleum refining is another significant consumer of sulfuric acid. However this sulfuric acid is generally recycled into new supply so net demand is relatively small.
4.3.2 Supply
The bulk of sulfuric acid supply in PADD I is produced from elemental sulfur. The remaining supply is from the recovery of off gasses in smelters, and recycling of sulfuric acid from refineries. The United States Geological Survey (USGS) estimates that 3-5 million tons of sulfuric acid is recycled from the petroleum refining industry in the United States every year. The historical and forecast trend of sulfuric acid supply is presented in Figure 4.6. Sulfuric acid supply in PADD I was 19.5 million metric tons in 2008, a decrease of about 200 thousand metric tons from 2007. The period 2003-2005 was a time of oversupply, following the undersupply of 2001 which was brought about by the economic downturn following the September 11th terrorist attacks. Sulfuric acid supply declined 0.2 percent annually in the historical period from 2000-

Section 4 PADD 1 Market Overview
U.S. Sulfur/Sulfuric Acid Market Analysis
46
Q209_01436.001.11
2008 and is expected to decline slowly at the same rate as demand through the forecast period, even though supply has been volatile in recent years.
Figure 4.6 PADD I Sulfuric Acid Supply Thousand Metric Tons
0
5,000
10,000
15,000
20,000
25,000
2000 2003 2006 2009 2012 2015 2018 2021 2024 2027 2030
XLS: I:\ M_Drive\ ENERGY\ 2009Proj\ 1436 Tenaska Sulf ur\ Report \ Tables and Figures\ Sulf uric Acid\ US Sulf uric Acid SDT
4.3.3 Supply/Demand Balance
PADD I has been a net exporter of sulfuric acid to outside the region since 2002 and is forecast to remain a modest net exporter during the forecast period. Driven by demand deterioration and the resulting supply decline, net trade (net shipments outside the region) is forecast to remain relatively low, staying less than 100 thousand tons per year, as shown in Table 4.2 and Figure 4.7.
Table 4.2 PADD I Sulfuric Acid Supply and Demand Thousand Metric Tons
Est
2000 2005 2008 2009 2010 2015 2020 2025 2030 2000-2008 2008-2015 2015-2030Capacity 21,300 21,300 21,300 21,300 21,300 21,300 21,300 21,300 21,300 Supply 19,838 20,514 19,478 17,074 16,595 18,864 18,699 18,535 18,373 -0.2% -0.5% -0.2%Demand 20,255 20,093 19,404 17,010 16,532 18,793 18,628 18,465 18,304 -0.5% -0.5% -0.2%Net Trade (417) 421 74 64 63 71 71 70 69
AAGR%Actual Forecast

Section 4 PADD 1 Market Overview
U.S. Sulfur/Sulfuric Acid Market Analysis
47
Q209_01436.001.11
Figure 4.7 PADD I Sulfuric Acid Supply and Demand Balance Thousand Metric Tons
-600
-400
-200
0
200
400
600
800
2000 2003 2006 2009 2012 2015 2018 2021 2024 2027 2030
XLS: I:\ M_Drive\ ENERGY\ 2009Proj\ 1436 Tenaska Sulf ur \ Report \ Tables and Figures\ Sulf ur ic Acid\ US Sulf ur ic Acid SDT

Section 4 PADD 1 Market Overview
U.S. Sulfur/Sulfuric Acid Market Analysis
48
Q209_01436.001.11
4.4 CONCLUSIONS
Below is a summary of conclusions made for PADD I sulfur and sulfuric acid markets.
4.4.1 Sulfur
Overall growth in sulfur demand in PADD I is expected to average 0.2 percent per year over the 2009 to 2030 period, in line with the 0.1 percent annual growth from 2000 to 2008
Consumption in PADD I is dominated by the phosphate fertilizer industry in Florida and North Carolina
Sulfur production is expected to achieve 0.7 percent annual growth over the 2009 to 2030 period compared to a decline of 1.6 percent annually over the past eight years
PADD I is a major net importer of sulfur, primarily from PADD III (the Gulf Coast) and foreign sources, and is expected to continue to be a net importer through the forecast period
4.4.2 Sulfuric Acid
Sulfuric acid consumption is mature, and is forecast to very slowly decline over the forecast period
The consumption of sulfuric acid in PADD I is dominated by the phosphate fertilizer industry in Florida and North Carolina
PADD I was responsible for 64 percent of supply and 55 percent of sulfuric acid demand in the United States in 2008
PADD I is relatively balanced in sulfuric acid, and has been a modest net exporter in recent years. It is expected that PADD I will remain an exporter through the forecast period

U.S. Sulfur/Sulfuric Acid Market Analysis
49
Section 5 PADD 2 Market Overview
5.1 INTRODUCTION
The Petroleum Administration for Defense District (PADD) II, the Midwest, is defined in Figure 5.1. PADD II is a significant producer and consumer of both sulfur and sulfuric acid. Elemental sulfur is produced mainly through petroleum refining, along with a small portion being made as a byproduct of natural gas processing. Sulfuric acid is produced from elemental sulfur in PADD II as well as through the recovery of off-gasses, as well as the recycling of sulfuric acid from refineries. The sulfur and sulfuric acid markets in PADD II are discussed below.
Figure 5.1 PADD II Map
5.2 PADD II SULFUR MARKET
5.2.1 Demand
In 2008, PADD II had the least sulfur consumption of all United States PADDs, representing approximately 5 percent of sulfur demand in the country. Demand in the PADD is expected to average 0.2 percent growth per year from 2009 to 2030, slightly higher than the 0.1 percent growth achieved from 2000 through 2008. Historical and forecast trends for sulfur demand for PADD II are presented in Figure 5.2.

Section 5 PADD 2 Market Overview
U.S. Sulfur/Sulfuric Acid Market Analysis
50
Q209_01436.001.11
Figure 5.2 PADD II Sulfur Demand Thousand Metric Tons
0
100
200
300
400
500
600
700
2000 2005 2006 2007 2008 2009 2010 2015 2020 2025 2030XLS: I:\ M_Drive\ ENERGY\ 2009Proj\ 1436 Tenaska Sulf ur\ Report \ Tables and Figures\ Sulf ur Market s
Demand for sulfur in the PADD II was 643 thousand metric tons in 2008, an increase of 20 thousand metric tons from 2007. It is forecast to reach approximately 576 thousand metric tons by 2030. Demand for sulfur has been declining in the region. Future demand is expected to generally follow this trend. Moreover, demand is projected to decline significantly in 2009 and 2010 because to the recent sharp economic downturn but recover during the 2011 to 2014 period. From 2015 to 2030, demand is forecast to gradually decline due to the maturity of the markets served by sulfur.

Section 5 PADD 2 Market Overview
U.S. Sulfur/Sulfuric Acid Market Analysis
51
Q209_01436.001.11
5.2.2 Supply
Sulfur supply increased in PADD II to 999 thousand metric tons in 2008, compared to 984 thousand metric tons in 2007. The region had approximately 11 percent of the 9.2 million metric tons of United States domestic sulfur supply in 2008. The majority of the sulfur supply, as seen also in PADD I, has come from the petroleum refineries and coking plants. The remaining supply has been from the recovery in natural gas plants.
Sulfur production in PADD II declined 1.9 percent annually from 2000 to 2008 but is expected to grow 0.7 percent per year over the 2009 to 2030 forecast period due to the increase in the recovery of domestic elemental sulfur production from petroleum refineries and the increase in the average sulfur content of crude oil that will be processed in United States refineries. Figure 5.3 displays the historical and forecast sulfur supply in PADD II.
Figure 5.3 PADD II Sulfur Supply Thousand Metric Tons
0
200
400
600
800
1,000
1,200
1,400
2000 2005 2006 2007 2008 2009 2010 2015 2020 2025 2030Petroleum and Coke Natural Gas
XLS: I:\ M_Drive\ ENERGY\ 2009Proj\ 1436 Tenaska Sulf ur\ Report \ Tables and Figures\ Sulf ur Market s

Section 5 PADD 2 Market Overview
U.S. Sulfur/Sulfuric Acid Market Analysis
52
Q209_01436.001.11
5.2.3 Supply/Demand Balance
Table 5.1 summarized sulfur supply and demand. PADD II has historically been a net exporter of sulfur, reaching a surplus of approximately 356 thousand metric tons in 2008. The region is forecast to remain an exporter of sulfur with over 601 thousand metric tons by 2030. Figure 5.4 displays the historical and forecast sulfur supply and demand balance for PADD II.
Table 5.1 PADD II Sulfur Supply and Demand Balance Thousand Metric Tons
Actual Est. Forecast AAGR, %2000 2005 2006 2007 2008 2009 2010 2015 2020 2025 2030 2000-2008 2008-2015 2015-2030
Petroleum and Coke 1,123 1,016 1,010 944 969 987 977 1,035 1,067 1,099 1,133Natural Gas 42 38 40 40 30 37 37 39 40 41 43Total 1,165 1,054 1,050 984 999 1,024 1,014 1,074 1,107 1,141 1,176 -1.9% 1.0% 0.6%
638 623 603 598 643 551 536 600 592 584 576 0.1% -1.0% -0.3%527 431 447 386 356 472 478 473 515 557 601
Supply
DemandNet Trade
Figure 5.4 PADD II Sulfur Supply and Demand Balance Thousand Metric Tons
0
100
200
300
400
500
600
700
2000 2005 2006 2007 2008 2009 2010 2015 2020 2025 2030XLS: I:\ M_Drive\ ENERGY\ 2009Proj\ 1436 Tenaska Sulf ur \ Report \ Tables and Figures\ Sulf ur Market s

Section 5 PADD 2 Market Overview
U.S. Sulfur/Sulfuric Acid Market Analysis
53
Q209_01436.001.11
5.3 PADD II SULFURIC ACID SUPPLY AND DEMAND
5.3.1 Demand
Figure 5.5 presents historical and forecast trends for sulfuric acid in PADD II. Demand for sulfuric acid in the PADD II was approximately 2.47 million metric tons in 2008, an increase of 20 thousand metric tons from 2007. Sulfuric acid demand within PADD II has remained relatively constant in the historical period from 2000-2008, declining at 0.5 percent annually in the historic period, similar to the case with PADD I. Demand is forecast to continue to decline modestly during the forecast period.
Figure 5.5 PADD II Sulfuric Acid Demand Thousand Metric Tons
0
500
1000
1500
2000
2500
3000
2000 2003 2006 2009 2012 2015 2018 2021 2024 2027 2030
Thou
sand
s of M
etric
Ton
s
XLS: I:\ M_Drive\ ENERGY\ 2009Proj\ 1436 Tenaska Sulf ur \ Report \ Tables and Figures\ Sulf ur ic Acid\ US Sulf ur ic Acid SDT
Demand in PADD II is lower and more fragmented than PADD I, due mostly to the absence of the phosphate fertilizer industry’s concentration in PADD I.

Section 5 PADD 2 Market Overview
U.S. Sulfur/Sulfuric Acid Market Analysis
54
Q209_01436.001.11
5.3.2 Supply
The sulfuric acid supply decreased in PADD II to about 1.6 million metric tons in 2008, which was a decrease of 15 thousand metric tons compared to the 1,638 thousand metric tons of supply in 2007. Sulfuric acid supply in PADD II has remained relatively flat over the historical period from 2000-2008, declining at 0.2 percent annually and is expected to decline slowly in the forecast period with the exception of additional production from the Taylorville Project. Figure 5.6 presents the historical and forecast trends for sulfuric acid supply in PADD II.
Figure 5.6 PADD II Sulfuric Acid Supply Thousand Metric Tons
0200400600800
1,0001,2001,4001,6001,8002,000
2000 2003 2006 2009 2012 2015 2018 2021 2024 2027 2030
Thou
sand
s of M
etric
Ton
s
XLS: I:\ M_Drive\ ENERGY\ 2009Proj\ 1436 Tenaska Sulf ur\ Report \ Tables and Figures\ Sulf uric Acid\ US Sulf uric Acid SDT

Section 5 PADD 2 Market Overview
U.S. Sulfur/Sulfuric Acid Market Analysis
55
Q209_01436.001.11
5.3.3 Supply/Demand Balance
Table 5.2 summarizes historical and forecast PADD II sulfuric acid supply and demand. PADD II has been a net importer of sulfuric acid. The net sulfuric acid deficit in the region has varied slightly over the years, remaining under 1,000 thousand metric tons, as shown in Figure 5.7. With supply slowly declining at the same rate as demand in the forecast period, PADD II will remain a net importer of sulfuric acid.
Table 5.2 PADD II Sulfuric Acid Supply and Demand Thousand Metric Tons
Est2000 2005 2008 2009 2010 2015 2020 2025 2030 2000-2008 2008-2015 2015-2030
Capacity 1,800 1,800 1,800 1,800 1,800 2,600 2,600 2,600 2,600 Supply 1,653 1,710 1,623 1,423 1,383 1,572 1,558 1,545 1,531 -0.2% -0.5% -0.2%Demand 2,578 2,557 2,470 2,165 2,104 2,392 2,371 2,350 2,330 -0.5% -0.5% -0.2%Net Trade (925) (848) (846) (742) (721) (820) (813) (806) (798)
Actual Forecast AAGR%
Figure 5.7 PADD II Sulfuric Acid Supply and Demand Balance Thousand Metric Tons
-1,000-900-800-700-600-500-400-300-200-100
0
2000 2003 2006 2009 2012 2015 2018 2021 2024 2027 2030
Thou
sand
s of M
etric
Ton
s
XLS: I:\ M_Drive\ ENERGY\ 2009Proj\ 1436 Tenaska Sulf ur\ Report \ Tables and Figures\ Sulf uric Acid\ US Sulf uric Acid SDT

Section 5 PADD 2 Market Overview
U.S. Sulfur/Sulfuric Acid Market Analysis
56
Q209_01436.001.11
5.4 CONCLUSIONS
The following conclusions regarding sulfur and sulfuric acid markets for PADD II are summarized below.
5.4.1 Sulfur
Sulfur demand growth in PADD II is expected to average 0.2 percent per year from 2009 to 2030 period, slightly higher than the 0.1 percent growth achieved from 2000 to 2008
Sulfur production is expected to increase 0.7 percent per year over the 2009 to 2030 forecast contrast to the 1.9 percent annual decline rate from 2000 to 2008
PADD II had approximately 11 percent of the United States domestic sulfur supply in 2008
PADD II is a net exporter of sulfur, primarily to locations within the region and PADD I
PADD II will continue to remain an exporter of sulfur through the forecast period, reaching a surplus of approximately 601 thousand metric tons in 2030
5.4.2 Sulfuric Acid
Sulfuric acid consumption is mature, and is forecast to very slowly decline over the forecast period
Sulfuric acid production has been relatively constant is expected remain relatively flat through the forecast period, tracking with demand with the exception of the capacity addition of the Taylorville Project
PADD II had approximately 5 percent of the United States sulfuric acid supply in 2008, and about 8 percent of sulfuric acid demand
PADD II has been a net importer of sulfuric acid historically, predominantly from PADD III (US Gulf Coast Region)

U.S. Sulfur/Sulfuric Acid Market Analysis
57
Q209_01436.001.11
Section 6 Estimated Tenaska Sulfur and Sulfuric Acid Production
6.1 INTRODUCTION
Tenaska is considering two coals as feed to its coal-to-SNG (CTS) project located in central Illinois. The range of coal quality being considered are shown in Table 6.1, are to fall between Coal “A”, and Coal “Z”. As part of its study to consider the market potential of producing concentrated sulfuric acid instead of molten sulfur as a byproduct, Tenaska requested Nexant to determine the amount of sulfur byproduct generated from each of the two coal feeds when used to make the same amount of SNG. This task was evaluated based on producing the same total amount of CO and H2 in syngas exiting the gasifiers as an indication of identical SNG production.
Following is the current CTS plant design basis specified by Tenaska:
Type of Gasifier Slurry Feed Total Quench
Gasifier Sizes 900 ft3 each
Number of Gasifiers 3 operating + 1 spare
Gasification Pressure 1,000 psig
Total CO+H2 Needed 360 MMSCFD from 3 gasifiers
Oxygen Concentration 99.0 percent by volume
Oxygen Temperature 300 °F at gasifier inlet
Slurry Feed Preheat None
For Coal “A”, the CTS plant is capable of the following process performances:
Coal Feed 6,785 STPD (AR basis) total for 3 gasifiers
Slurry Feed Concentration 65 wt percent (dry solid basis)
Oxygen Feed Rate 5,354 STPD total for 3 gasifiers
Carbon Conversion 98 percent
Gasification Temperature 2,600 °F

Section 6 Estimated Tenaska Sulfur and Sulfuric Acid Production
U.S. Sulfur/Sulfuric Acid Market Analysis
58
Q209_01436.001.11
6.2 EVALUATION METHODOLOGY
Gasification heat and material balances (H&MB) was carried out for the two feedstocks to determine the feed rates required to produce syngas containing the specified amount of CO and H2. The amount of sulfur in the gasifier syngas was used to determine the plant’s net sulfur production.
Table 6.1 Coal Characteristics

Section 6 Estimated Tenaska Sulfur and Sulfuric Acid Production
U.S. Sulfur/Sulfuric Acid Market Analysis
59
Q209_01436.001.11
For Coal “A”, H&MB was carried out at the specified coal and oxygen feed rates, slurry concentration, and carbon conversion to come up with a calculated gasification temperature. Comparison of the independently calculated temperature to the reported temperature served as a check on the consistency of the design information, and also served to establish the accuracy of the H&MB procedure. The same H&MB procedures, after adjustment for coal property differences, were applied to Coal “Z” to determine the coal feed and syngas product rates required for the specified amounts of CO and H2. Total sulfur containing species in the syngas were used to estimate the sulfur byproduct production for each feedstock.
Some of the H&MB adjustments made between Coal “A” and Coal “Z” are:
Slurry feed weight percent dry solids for Coal “Z” will be 4.4 percentage point lower than Coal “A” to account for the higher equilibrium moisture for Coal “Z”
Gasification temperature for Coal “Z” will be 30 °F lower than Coal “A” to account for the lower ash fusion temperature for Coal “Z”
Ash and Slag carbon content is assumed to be the same between the two coal cases. Carbon conversion for Coal “Z” will be less than Coal “A” due to its higher ash content
Results of the analysis are presented in Table 6.2.
Table 6.2 Gasification H&MB Results
Coal “A” Coal “Z” Total AR Coal Feed, STPD 6,785 7,721 Coal Equilibrium Moisture, wt% 10.6 15.0 Ash Fusion Temperature, deg F 2,328 2,300 Slurry Feed Concentration, wt% Dry Solid 65.0 60.6 99.0% Oxygen Consumption, STPD 5,355 5,788 Carbon Conversion, wt% 98.0 97.1 Gasification Temperature, deg F 2,550 2,520 Gasifier Exit Dry Gas Flow, lb moles/Hr 47,012 49,222 Gasifier Exit H2+CO Content: MMSCFD 360 360 Lb moles/Hr Gasifier Exit H2S+COS Content: Lb moles/Hr 554.4 601.2 STPD of Sulfur 213.3 231.3 Gasifier Exit Syngas Composition, Mole% Dry: H2 35.34 37.07 CO 48.72 43.23 CO2 13.65 17.38 H2S + COS 1.18 1.22 CH4 0.19 0.11 N2 + Argon 0.77 0.83 NH3 0.11 0.11 HCl 0.04 0.05 Total Mole% 100.00 100.00

Section 6 Estimated Tenaska Sulfur and Sulfuric Acid Production
U.S. Sulfur/Sulfuric Acid Market Analysis
60
Q209_01436.001.11
6.3 MOLTEN SULFUR PRODUCTION
The estimated maximum molten sulfur production rates are presented in Table 6.3.
Table 6.3 Estimated Molten Sulfur Production
Coal “A” Coal “Z” Total AR Coal Feed, STPD 6,785 7,721 Total Sulfur in Syngas Exit Gasifiers, STPD 213.3 231.3 Sulfur in Treated Syngas, STPD 0.2 0.2 Sulfur in TGTU Incinerator Vent, STPD 0.4 0.5 Net Molten Sulfur Production, STPD 212.7 230.6
The estimates of maximum molten sulfur production were based on the following assumptions:
Sweet syngas from Acid Gas Removal (AGR) system contains 10-ppmv residual sulfur, which will be removed in downstream zinc oxide guard beds;
Sulfur recovery from AGR acid gas in Claus sulfur recovery and Tail Gas Treatment systems is assumed to be 99.8 percent. The 0.2 percent un-recovered sulfur is vented to atmosphere via tail gas incinerator flue gas.
6.4 SULFURIC ACID PRODUCTION
The estimated maximum sulfuric acid production rates are presented in Table 6.4.
Table 6.4 Estimated Sulfuric Acid Production
Coal “A” Coal “Z” Total AR Coal Feed, STPD 6,785 7,721 Total Sulfur in Syngas Exit Gasifiers, STPD 213.3 231.3 Sulfur in Treated Syngas, STPD 0.2 0.2 Sulfur in Acid Plant Exhaust, STPD 2.1 2.2 Net Sulfur in Sulfuric Acid, STPD Sulfur 211.0 228.9 Total Sulfuric Acid Production, STPD (98 wt%) 658.7 714.6
The estimates of maximum sulfuric acid production were based on the following assumptions:
Sweet syngas from Acid Gas Removal (AGR) system contains 10-ppmv residual sulfur, which will be removed in downstream zinc oxide guard beds;
Sulfur recovery from AGR acid gas in Sulfuric Acid Plant is assumed to be 99 percent. The 1 percent un-recovered sulfur is vented with Acid Plant Exhaust.

U.S. Sulfur/Sulfuric Acid Market Analysis
61
Section 7 Industry Profiles for PADDs I and II
7.1 INTRODUCTION
This section identifies consumers and producers of both sulfur and sulfuric acid in PADDs I and PADD II, covering the following sectors: sulfur dioxide, elemental sulfur, pulp and paper, steel mills, ethanol and chemicals. Target customers and competitors for the project in Taylorville in PADD II, as well as in PADD I, have been identified and discussed in this section.
7.2 SULFUR INDUSTRY PROFILE
7.2.1 Consumer Profiles
Table 7.1 shows major sulfuric acid producers within PADDs I and II. Raw materials for each of the plants have been identified. Several of these plants process spent sulfuric acid and only purchase part of their throughput as elemental sulfur. The sulfuric acid regeneration business is an important aspect of the sulfuric acid business, and spent acid from oil refineries and other chemical processing plants is returned to sulfuric acid producers who regenerate pure acid from the spent acid. Other sulfuric acid producers are based on smelter by-product sulfur or run completely on spent acid, rather than on elemental sulfur.

Section 7 Industry Profiles for PADDs I and II
U.S. Sulfur/Sulfuric Acid Market Analysis
62
Q209_01436.001.11
Table 7.1 Sulfuric Acid Producers Capacity – Thousand Metric Tons
Company Location State PADD Capacity Raw MaterialValero Energy Corp Delaware City Delaware 1 190 70% SO2 in Utility off gases, 30% SludgeCF Industries Plant City Florida 1 2,400 100% Elemental; CaptiveThe Mosaic Company Bartow Florida 1 4,120 100% Elemental; CaptiveThe Mosaic Company New Wales Florida 1 3,930 100% Elemental; CaptiveThe Mosaic Company Nichols Florida 1 735 100% Elemental; mostly captiveThe Mosaic Company Riverview Florida 1 1,940 100% Elemental; mostly captivePCS Phosphate Co White Springs Florida 1 3,050 100% Elemental, Partly CaptiveTampa Electric Company Polk County Florida 1 65 SO2 and H2S in Utility off gasesGeneral Chemical Corp Augusta Georgia 1 260 100% Elemental, Partly CaptiveSouthern States Chemical Savannah Georgia 1 135 100% Elemental, 100% MerchantTronox Inc. Savannah Georgia 1 245 100% Elemental, mostly captiveGeneral Chemical Corp Newark New Jersey 1 140 100% ElementalPVS Chemicals Buffalo New York 1 110 20% Elemental, 80% SludgePCS Phosphate Co Aurora North Carolina 1 3,285 100% Elemental; CaptiveSouthern States Chemical Wilmington North Carolina 1 60 100% Elemental, Merchant
Elementis Pigments Easton Pennsylvania 1 15 Ferrous Sulfate; High Purity iron oxides as byproduct; Captive
Langeloth International Langeloth Pennsylvania 1 35 100% Molybdenum Smelter gasDuPont Richmond Virginia 1 85 100% Elemental; Partly CaptiveHoneywell International Hopewell Virginia 1 390 100% Elemental, CaptiveLucite International Belle West Virginia 1 110 100% Sludge; CaptiveWheeling Pittsburgh Steel Corp Follansbee West Virginia 1 25 100% H2S From coke oven gas, captiveBig River Zinc Sauget Illinois 2 135 100% Zinc smelter GasesPVS Chemical Solutions Chicago Illinois 2 80 100% ElementalRhodia Hammond Indiana 2 270 40% Elemental; 60% Sludge; Partially CaptiveClimax Molybdenum Co. Fort Madison Iowa 2 90 40% Molybdenum Smelter Gases; 60% ElementalPhelps Dodge Corp. Fort Madison Iowa 2 90 40% Molybdenum Smelter Gases; 60% ElementalDuPont Wurtland Kentucky 2 180 100% Elemental; Partly CaptiveThe Doe Run Company Herculaneum Missouri 2 70 100% Lead Smelter GasesAK Steel Corp Middletown Ohio 2 5 100% H2S From coke oven gasChemtrade Logistics Cairo Ohio 2 65 100% ElementalDuPont North Bend Ohio 2 160 100% ElementalMarsulex, Inc. Oregon Ohio 2 300 35% Elemental, 65% Sludge, neg H2SReliant Energy Niles Ohio 2 10 100% SO2 in utility off gasesChemtrade Refinery Services Tulsa Oklahoma 2 60 100% ElementalLucite International Memphis Tennesse 2 250 100% Sludge; CaptiveZinifex Clarksville Clarksville Tennesse 2 135 100% Zinc smelter gases, partly captive
Table 7.2 lists the major sulfur dioxide producers in PADDs I and II. Sulfur dioxide is either produced by burning sulfur or recovered from flue gas, particularly at ore smelting (copper, lead or zinc) operations. It can be used in different industries such as in chemicals, pulp and paper, water and waste treatments, metal and ore refining, oil recovery and refining, and other miscellaneous functions such as for the sulfonation of oils or as a reducing agent. Historically, the primary use of sulfur dioxide has been in the production of sodium hydrosulfite, which is consumed mainly as a bleaching agent by the textile and the pulp and paper industries and for the production of other chemicals. It is also essential in the agricultural and food processing sectors.
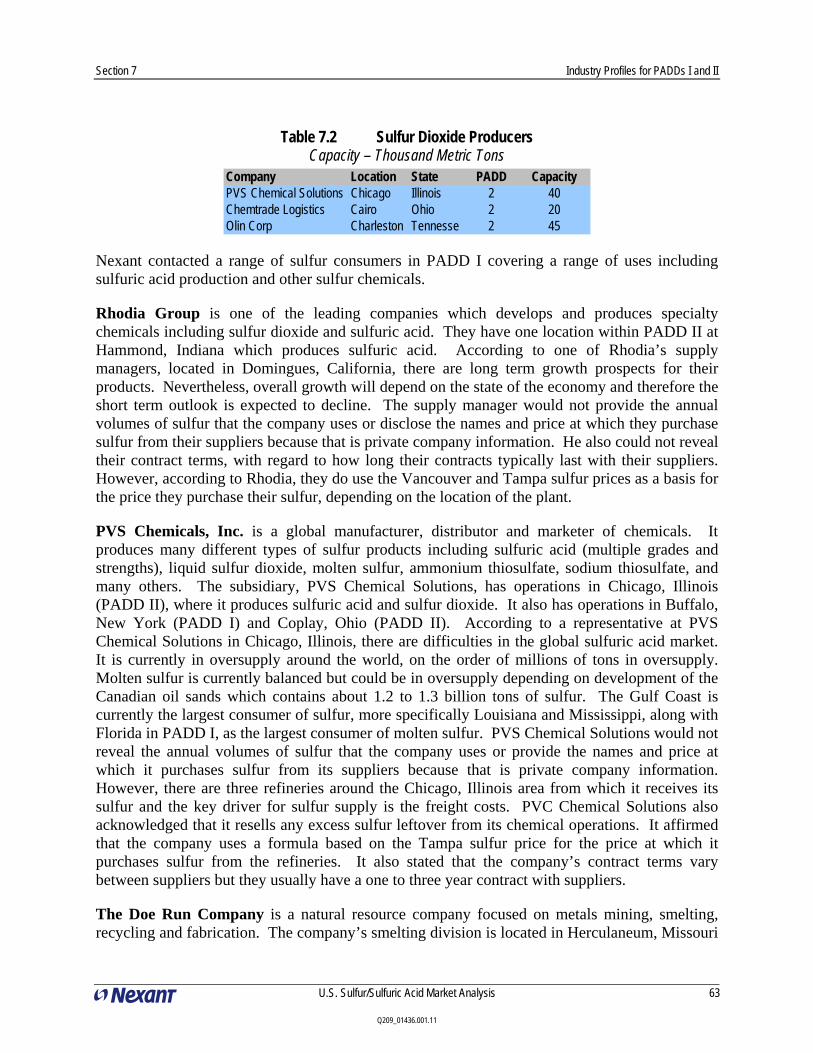
Section 7 Industry Profiles for PADDs I and II
U.S. Sulfur/Sulfuric Acid Market Analysis
63
Q209_01436.001.11
Table 7.2 Sulfur Dioxide Producers Capacity – Thousand Metric Tons
Company Location State PADD CapacityPVS Chemical Solutions Chicago Illinois 2 40Chemtrade Logistics Cairo Ohio 2 20Olin Corp Charleston Tennesse 2 45
Nexant contacted a range of sulfur consumers in PADD I covering a range of uses including sulfuric acid production and other sulfur chemicals.
Rhodia Group is one of the leading companies which develops and produces specialty chemicals including sulfur dioxide and sulfuric acid. They have one location within PADD II at Hammond, Indiana which produces sulfuric acid. According to one of Rhodia’s supply managers, located in Domingues, California, there are long term growth prospects for their products. Nevertheless, overall growth will depend on the state of the economy and therefore the short term outlook is expected to decline. The supply manager would not provide the annual volumes of sulfur that the company uses or disclose the names and price at which they purchase sulfur from their suppliers because that is private company information. He also could not reveal their contract terms, with regard to how long their contracts typically last with their suppliers. However, according to Rhodia, they do use the Vancouver and Tampa sulfur prices as a basis for the price they purchase their sulfur, depending on the location of the plant.
PVS Chemicals, Inc. is a global manufacturer, distributor and marketer of chemicals. It produces many different types of sulfur products including sulfuric acid (multiple grades and strengths), liquid sulfur dioxide, molten sulfur, ammonium thiosulfate, sodium thiosulfate, and many others. The subsidiary, PVS Chemical Solutions, has operations in Chicago, Illinois (PADD II), where it produces sulfuric acid and sulfur dioxide. It also has operations in Buffalo, New York (PADD I) and Coplay, Ohio (PADD II). According to a representative at PVS Chemical Solutions in Chicago, Illinois, there are difficulties in the global sulfuric acid market. It is currently in oversupply around the world, on the order of millions of tons in oversupply. Molten sulfur is currently balanced but could be in oversupply depending on development of the Canadian oil sands which contains about 1.2 to 1.3 billion tons of sulfur. The Gulf Coast is currently the largest consumer of sulfur, more specifically Louisiana and Mississippi, along with Florida in PADD I, as the largest consumer of molten sulfur. PVS Chemical Solutions would not reveal the annual volumes of sulfur that the company uses or provide the names and price at which it purchases sulfur from its suppliers because that is private company information. However, there are three refineries around the Chicago, Illinois area from which it receives its sulfur and the key driver for sulfur supply is the freight costs. PVC Chemical Solutions also acknowledged that it resells any excess sulfur leftover from its chemical operations. It affirmed that the company uses a formula based on the Tampa sulfur price for the price at which it purchases sulfur from the refineries. It also stated that the company’s contract terms vary between suppliers but they usually have a one to three year contract with suppliers.
The Doe Run Company is a natural resource company focused on metals mining, smelting, recycling and fabrication. The company’s smelting division is located in Herculaneum, Missouri

Section 7 Industry Profiles for PADDs I and II
U.S. Sulfur/Sulfuric Acid Market Analysis
64
Q209_01436.001.11
(PADD II). A representative from the smelting division at the Doe Run Company stated that they do not use sulfur for their sulfuric acid production. Their sulfuric acid production is based on their smelter by-product. The Doe Run Company burns sulfur dioxide which is recovered from their flue gas at the ore smelting operations, and then they produce sulfuric acid.
7.2.2 Producer Profiles
Table 7.3 displays the elemental sulfur producers within PADD I and PADD II. Elemental sulfur is recovered from oil refinery acid gas streams, containing sulfuric acid and sulfur dioxide. It can also be recovered from natural gas production, where sulfuric acid is removed from the raw gas. Elemental sulfur is mainly used to produce sulfuric acid, typically for fertilizer manufacture, sulfur dioxide, phosphorous pentasulfide, rubber vulcanizing and also in pulp and paper uses.

Section 7 Industry Profiles for PADDs I and II
U.S. Sulfur/Sulfuric Acid Market Analysis
65
Q209_01436.001.11
Table 7.3 Elemental Sulfur Producers (Capacity – Thousand Metric Tons)
Company Location State PADD Capacity Raw MaterialValero Delaware City Delaware 1 440 RefineryExxon Mobil Jay Florida 1 107 Natural Gas
Chemical Products Corporation Cartersville Georgia 1 7 Sulfur Chemicals byproduct
Amerada Hess Corp Port Reading New Jersey 1 5 RefineryConocoPhillips Linden New Jersey 1 145 RefinerySunoco, Inc. Westville New Jersey 1 30 RefineryValero Paulsboro New Jersey 1 90 RefineryConocoPhillips Marcus Hook Pennsylvania 1 60 RefinerySunoco, Inc. Philadelphia Pennsylvania 1 95 RefineryUnited Refining Company Warren Pennsylvania 1 15 RefineryGiant Industries Grafton Virginia 1 66 RefineryErgon Newell West Virginia 1 na RefineryCITGO Lemont Illinois 2 320 RefineryConocoPhillips Wood River Illinois 2 150 RefineryExxon Mobil Joliet Illinois 2 145 RefineryMarathon Petroleum Robinson Illinois 2 15 RefineryNatural Gas Pipeline Company of America St. Elmo Illinois 2 5 Natural Gas
BP America, Inc. Whiting Indiana 2 160 RefineryCoffeyville Resources Nitrogen Fertlizers Coffeyville Kansas 2 5 Refinery
Frontier El Dorado El Dorado Kansas 2 75 RefineryTessenderlo Kerley Coffeyville Kansas 2 na RefineryTessenderlo Kerley McPherson Kansas 2 na RefineryMarathon Petroleum Catlettsburg Kentucky 2 135 RefineryMarathon Petroleum Detroit Michigan 2 25 RefineryMerit Energy Company Fredric Michigan 2 5 Natural GasShell Exploration & Production Company Manistee Michigan 2 10 Natural Gas
Flint Hills Resources Inver Grove Heights Minnesota 2 265 Refinery
Marathon Petroleum St. Paul Park Minnesota 2 55 RefineryAmerada Hess Corp Tioga North Dakota 2 74 Natural GasBear Paw Energy L.L.C Lignite North Dakota 2 2 Natural GasPetro-Hunt, LLC Killdeer North Dakota 2 45 Natural GasTesoro Mandan North Dakota 2 5 RefineryBP America, Inc. Toledo Ohio 2 35 RefineryIneos Lima Ohio 2 13 RefineryMarathon Petroleum Canton Ohio 2 35 RefinerySunoco, Inc. Toledo Ohio 2 15 RefineryValero Lima Ohio 2 15 RefineryJupiter Sulfur Ponca City Oklahoma 2 40 RefinerySinclair Oil Tulsa Oklahoma 2 15 RefineryValero Ardmore Oklahoma 2 35 RefineryEastman Chemical Kingsport Tennesse 2 20 Coal GasificationValero Memphis Tennesse 2 15 RefineryMurphy Oil Superior Wisconsin 2 5 Refinery

Section 7 Industry Profiles for PADDs I and II
U.S. Sulfur/Sulfuric Acid Market Analysis
66
Q209_01436.001.11
Other domestic sulfur producers will be the main competition for the Taylorville project, should the project choose to produce sulfur. Nexant’s contact with one major sulfur producer in the United States is summarized below.
The Montana Sulphur and Chemical Company is one of the major manufacturers of sulfur and sulfur based products for agriculture and industry. They have one location in PADD IV in Billings, Montana which has a capacity of 80 thousand metric tons per year. The company produces sugar-house (flaked) sulfur, high purity hydrogen sulfide, high purity sulfur prill, disintegrating 90 percent sulfur and molten sulfur. According to a representative at Montana Sulphur there is a large surplus of sulfur on the market right now and major users are currently buying at a conservative rate. The person stated that having molten sulfur on hand right now is not a good idea and that sulfuric acid is very plentiful as well. The Montana Sulphur representative also stated that the marketplace is usually in a constant state of flux with conditions always changing.
7.3 SULFURIC ACID INDUSTRY PROFILE
7.3.1 Consumer Profiles
7.3.1.1 Pulp and Paper
Tables 7.4 and 7.5 display Pulp and Paper Mills within PADD I and PADD II, respectively. The pulp and paper industries use sulfuric acid as a neutralizer as well as a non-chlorinated chemical for the bleaching of kraft pulp, among a number of other uses.

Section 7 Industry Profiles for PADDs I and II
U.S. Sulfur/Sulfuric Acid Market Analysis
67
Q209_01436.001.11
Table 7.4 PADD I Pulp and Paper Mills Paper Production Capacity – Thousand Metric Tons
Owner Location State Capacity Ahlstrom Filtration, Inc. Mount Holly Springs PA 6 American Eagle Paper Mills (Team Ten, LLC) Tyrone PA 99 Caraustar Industries, Inc. Taylors SC 76 Cascades Tissue Group Inc. Ransom PA 61 Kimberly-Clark Corp. Beech Island SC 184 LinPac Inc. Cowpens SC 247 MH Dielectrics Inc. Mount Holly Springs PA 6 Moulded Fibre Technology Scarborough ME 1 National Gypsum Co. New Columbia PA 125 Newark Group, Inc. York PA 50 Newman & Co Philadelphia PA 79 PaperWorks Industries Inc. (Sun Capital Partners, Inc.) Philadelphia PA 137 Pratt Industries Inc. (Visy Pulp & Paper) Staten Island NY 382 Procter&Gamble Paper Products Mehoopany PA 303 Quin-T Corp. Erie PA 40 Rock-Tenn Co. Delaware Water Gap PA 56 Roses Southeastern Papers Sanford FL 28 Sealed Air Corp. Modena PA 28 Sealed Air Corp. Reading PA 25 United CorrStack Inc L.L.C. Reading PA 161 United States Gypsum Co. Jacksonville FL 85 Woodstream Corp.(EKCO Group Co.) Lititz PA 0AbitibiBowater Catawba SC 976American Tissue Corp. Augusta ME 17APC Paper Co. of New York Claremont NH 32APC Paper Co. of New York Norfolk NY 77Appleton Roaring Springs PA 139Atlas Paper Mills Ltd Hialeah FL 24Augusta Newsprint Co. Augusta GA 529Austell Boxboard(Caraustar) Austell GA 166Banner Fiberboard Co. Wellsburg WV 29Bennington Paperboard Co.(The Newark Group Inc.) North Hoosick NY 48Bio-Tech Mills, Inc. Greenwich NY 21Bontex Buena Vista VA 18Brownville Specialty Paper, Inc. Brownville NY 29Buckeye Technologies Inc. Perry FL 559Buckeye Technologies Inc. Lumberton NC 61Burrows Paper Corp. Little Falls NY 48Burrows Paper Corp. Lyons Falls NY 20Caraustar Industries, Inc. Baltimore MD 77Caraustar Industries, Inc. Lockport NY 83Caraustar Industries, Inc. Roanoke Rapids NC 36Cascades Inc. Auburn ME 88Cascades Inc. Mechanicville NY 66Cascades Tissue Group Inc. Rockingham NC 28Cascades, Inc. Versailles CT 205Cedartown Paperboard(Caraustar) Cedartown GA 33Cellu Tissue Holdings, Inc. East Hartford CT 31Cellu Tissue Holdings, Inc. Gouverneur NY 28Celotex Corp. Sunbury PA 100Climax Mfg. Co. Carthage NY 51Congoleum Corp. Finksburg MD 104Cottrell Paper Co., Inc. Rock City Falls NY 2Crane & Co., Inc. Dalton MA 74
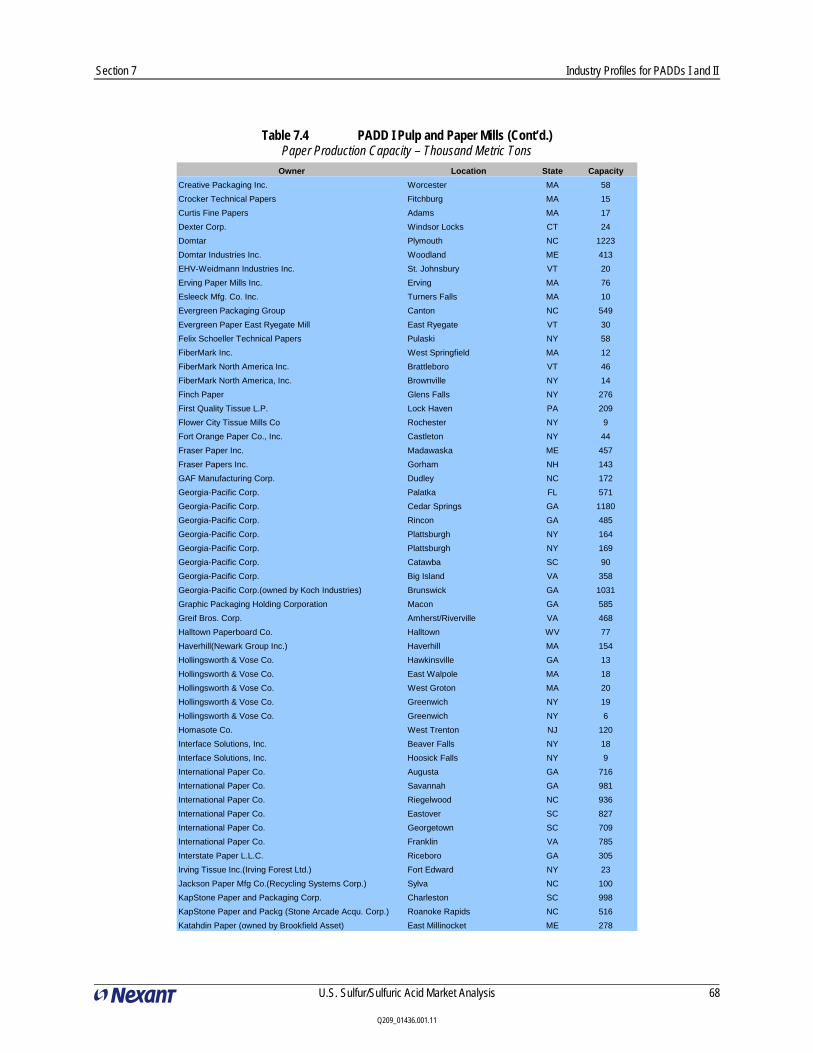
Section 7 Industry Profiles for PADDs I and II
U.S. Sulfur/Sulfuric Acid Market Analysis
68
Q209_01436.001.11
Table 7.4 PADD I Pulp and Paper Mills (Cont’d.) Paper Production Capacity – Thousand Metric Tons
Owner Location State CapacityCreative Packaging Inc. Worcester MA 58Crocker Technical Papers Fitchburg MA 15Curtis Fine Papers Adams MA 17Dexter Corp. Windsor Locks CT 24Domtar Plymouth NC 1223Domtar Industries Inc. Woodland ME 413EHV-Weidmann Industries Inc. St. Johnsbury VT 20Erving Paper Mills Inc. Erving MA 76Esleeck Mfg. Co. Inc. Turners Falls MA 10Evergreen Packaging Group Canton NC 549Evergreen Paper East Ryegate Mill East Ryegate VT 30Felix Schoeller Technical Papers Pulaski NY 58FiberMark Inc. West Springfield MA 12FiberMark North America Inc. Brattleboro VT 46FiberMark North America, Inc. Brownville NY 14Finch Paper Glens Falls NY 276First Quality Tissue L.P. Lock Haven PA 209Flower City Tissue Mills Co Rochester NY 9Fort Orange Paper Co., Inc. Castleton NY 44Fraser Paper Inc. Madawaska ME 457Fraser Papers Inc. Gorham NH 143GAF Manufacturing Corp. Dudley NC 172Georgia-Pacific Corp. Palatka FL 571Georgia-Pacific Corp. Cedar Springs GA 1180Georgia-Pacific Corp. Rincon GA 485Georgia-Pacific Corp. Plattsburgh NY 164Georgia-Pacific Corp. Plattsburgh NY 169Georgia-Pacific Corp. Catawba SC 90Georgia-Pacific Corp. Big Island VA 358Georgia-Pacific Corp.(owned by Koch Industries) Brunswick GA 1031Graphic Packaging Holding Corporation Macon GA 585Greif Bros. Corp. Amherst/Riverville VA 468Halltown Paperboard Co. Halltown WV 77Haverhill(Newark Group Inc.) Haverhill MA 154Hollingsworth & Vose Co. Hawkinsville GA 13Hollingsworth & Vose Co. East Walpole MA 18Hollingsworth & Vose Co. West Groton MA 20Hollingsworth & Vose Co. Greenwich NY 19Hollingsworth & Vose Co. Greenwich NY 6Homasote Co. West Trenton NJ 120Interface Solutions, Inc. Beaver Falls NY 18Interface Solutions, Inc. Hoosick Falls NY 9International Paper Co. Augusta GA 716International Paper Co. Savannah GA 981International Paper Co. Riegelwood NC 936International Paper Co. Eastover SC 827International Paper Co. Georgetown SC 709International Paper Co. Franklin VA 785Interstate Paper L.L.C. Riceboro GA 305Irving Tissue Inc.(Irving Forest Ltd.) Fort Edward NY 23Jackson Paper Mfg Co.(Recycling Systems Corp.) Sylva NC 100KapStone Paper and Packaging Corp. Charleston SC 998KapStone Paper and Packg (Stone Arcade Acqu. Corp.) Roanoke Rapids NC 516Katahdin Paper (owned by Brookfield Asset) East Millinocket ME 278

Section 7 Industry Profiles for PADDs I and II
U.S. Sulfur/Sulfuric Acid Market Analysis
69
Q209_01436.001.11
Table 7.4 PADD I Pulp and Paper Mills (Cont’d.) Paper Production Capacity – Thousand Metric Tons
Owner Location State CapacityKimberly-Clark Corp. New Milford CT 80Knowlton Specialty Papers Inc. Watertown NY 8Lafayette Paper L.P. New Windsor NY 158Laurel Hill Paper Co. Cordova NC 20Lincoln Paper and Tissue Co.(First Paper Holding LLC) Lincoln ME 125Madison Paper Industries Madison ME 248Marcal Paper Mills Inc. Elmwood Park NJ 180Martisco Paper Co., Inc. Marcellus NY 6Maryland Paper Co. L.P. Williamsport MD 161Masonite Corp. Towanda PA 281McGoldrick Paper Co., Inc. Hinsdale NH 4McIntyre Paper Co., Inc. Fayetteville NY 11MeadWestvaco Corp. South Lee MA 15MeadWestvaco Corp. Covington VA 1174Mohawk Fine Papers, Inc. Cohoes NY 54Mohawk Fine Papers, Inc. Waterford NY 41Monadnock Paper Mills, Inc. Bennington NH 28Munksjo Paper Decor Inc. Fitchburg MA 25National Gypsum, Corp. Delair NJ 66Newark America(Newark Group) Fitchburg MA 95Newark Group, Inc. Gardiner ME 39Newark Group, Inc. Natick MA 55Newark Group, Inc. Chatham NY 41NewPage Corp. Rumford ME 731NewPage Corp. Luke MD 640Newstech(Belkorp Industries Inc.) Deferiet NY 244Newstech(Belkorp Industries Inc.) Hagerstown MD 152Newton Falls Fine Paper Co. Newton Falls NY 77Norampac (Cascades Inc.) Niagara Falls NY 294NVF Co. Yorklyn DE 8NVF Co. Yorklyn DE 7P.H. Glatfelter Co. Spring Grove PA 320Packaging Corp. of America Valdosta GA 485Pactiv Corp. Macon GA 40Paper Service Ltd. Hinsdale NH 10Paper-Pak Products Inc. Washington GA 10Paramount Paper Ltd. Maxton NC 4Parsons Paper Co.(NVF Co.) Holyoke MA 13Penacook Fibre Co Penacook NH 2Pepperell Paper(Merrimac Paper) Pepperell MA 29Perkit Folding Box Corp. Mattapan MA 33Potsdam Specialty Paper, Inc. (PSPI) Potsdam NY 30Procter&Gamble Paper Products Albany GA 336Putney Paper Co. Inc. Putney VT 28Rayonier Fernandina Beach FL 165Rayonier Jesup GA 661Red Hook Paper Inc. Red Hook NY 6RFS Ecusta Inc.(Purico Ltd.) Pisgah Forest NC 110Rock-Tenn Co. Sheldon Springs VT 93Rock-Tenn Co. Lynchburg VA 154Rock-Tenn Company (previously Southern Container) Syracuse NY 793Sappi Fine Paper North America Westbrook ME 176Sappi Fine Paper North America Hinckley ME 749SCA Tissue North America, L.L.C. South Glens Falls/Greenwich NY 97

Section 7 Industry Profiles for PADDs I and II
U.S. Sulfur/Sulfuric Acid Market Analysis
70
Q209_01436.001.11
Table 7.4 PADD I Pulp and Paper Mills (Cont’d.) Paper Production Capacity – Thousand Metric Tons
Owner Location State CapacitySchweitzer-Mauduit Intl. Inc. Spotswood NJ 66Schweitzer-Mauduit Intl. Inc. Ancram NY 4Sealed Air Corp. Lenoir NC 8Seaman Paper Co. Otter River MA 48SFK Pulp Fairmont WV 231Simkins Industries Inc. Catonsville MD 77Smurfit-Stone Container Corp. Uncasville CT 195Smurfit-Stone Container Corp. Fernandina Beach FL 900Smurfit-Stone Container Corp. Panama City FL 985Smurfit-Stone Container Corp. Florence SC 753Smurfit-Stone Container Corp. Hopewell VA 489Smurfit-Stone Container Corp. West Point VA 918Smurfit-Stone Container Corp. (Seminole Mill) Jacksonville FL 549Sonoco Products Co. Atlanta GA 52Sonoco Products Co. Holyoke MA 73Sonoco Products Co. Hartsville SC 204Sonoco Products Co. Richmond VA 86Southworth Co. West Springfield MA 10Sweetwater Paperboard(Caraustar) Austell GA 154Temple-Inland Corp. Rome GA 907Texon International Russell MA 43United States Gypsum Co. Clark NJ 164United States Gypsum Co. Oakfield NY 58Verso Paper Holdings LLC Bucksport ME 562Verso Paper Holdings LLC Jay ME 851Visy Paper NY Inc.(Visy Industries) New York NY 329Wausau-Mosinee Paper Corp. Jay ME 22Weyerhaeuser Co. Oglethorpe GA 386Weyerhaeuser Co. Savannah, Port Wentworth GA 355Weyerhaeuser Co. New Bern NC 369Weyerhaeuser Co., Port Wentworth Mill Savannah GA 355White Birch Paper Co. Ashland VA 304White Birch Paper Co. (SP Newsprint Co.) Dublin GA 624Windsor-Stevens Inc Poquonock CT 4Total 46,107

Section 7 Industry Profiles for PADDs I and II
U.S. Sulfur/Sulfuric Acid Market Analysis
71
Q209_01436.001.11
Table 7.5 PADD II Pulp and Paper Mills Paper Production Capacity – Thousand Metric Tons
Owner Location State CapacityAbitibiBowater Calhoun TN 961Ahlstrom Filtration, Inc. Madisonville KY 23Ahlstrom Filtration, Inc. Chattanooga TN 11Ahlstrom Paper Group Taylorville IL 27Alcoa Flexible Packaging Corp. Joliet IL 56Alcoa Flexible Packaging Corp. Peoria IL 14Alcoa Flexible Packaging Corp. Detroit MI 61.25American Tissue Mills of WI (American Tissue Corp.) Tomahawk WI 8Appleton West Carrollton OH 175Appleton Coated LLC (Arjowiggins SAS 100%) Combined Locks WI 396Atlas Roofing Corp. Franklin OH 47Atlas Roofing Corp. Ardmore OK 18BBP America, Inc.(BBP Celotex) Quincy IL 88Beloit Box Board Co., Inc. Beloit WI 21Blandin Paper(UPM-Kymmene) Grand Rapids MN 475Blue Water Fibre L.P. Port Huron MI 70Boise Inc. International Falls MN 530BPB America Inc. LAnse MI 98Buckeye Technologies Inc. Memphis TN 210Caraustar Industries, Inc. Chicago IL 86Caraustar Industries, Inc. Tama IA 50Caraustar Industries, Inc. Cincinnati OH 74Caraustar Industries, Inc. Rittman OH 175Cascades Inc. Eau Claire WI 55CertainTeed Corp. Shakopee MN 87CertainTeed Corp. Milan OH 32Cheney Pulp & Paper Co. Franklin OH 11CityForest Corp. Ladysmith WI 49Columbus Specialty Paper L.L.C. Columbus OH 18Crown Vantage Inc. Parchment MI 110Crystal Tissue Co Middletown OH 28Domtar Hawesville KY 75Domtar Hawesville KY 639Domtar Kingsport TN 166Domtar Rothschild WI 150Domtar Industries Inc. Port Huron MI 94Domtar Industries Inc. Nekoosa WI 218Dunn Paper Port Huron MI 80Eco Fibre, Inc. De Pere WI 35Fibercorr Inc. Massillon OH 79FiberMark, Inc. Owensboro KY 10Field Container Co. L.P. Pekin IL 28Field Container Co. L.P. Battle Creek MI 119Filter Materials Waupaca WI 5Flambeau River Papers, LLC Park Falls WI 137Fletcher Paper Co. Alpena MI 30

Section 7 Industry Profiles for PADDs I and II
U.S. Sulfur/Sulfuric Acid Market Analysis
72
Q209_01436.001.11
Table 7.5 PADD II Pulp and Paper Mills (Cont’d.) Paper Production Capacity – Thousand Metric Tons
Owner Location State CapacityForest Ressources L.L.C. Hartford City IN 224Fox River Fiber Co. De Pere WI 77Fox River Paper Co. Vicksburg MI 21Fraser Paper Inc. Dayton OH 55French Paper Co. Niles MI 19Geo. A. Whiting Paper Co. Menasha WI 10Georgia-Pacific Corp. Duluth MN 91Georgia-Pacific Corp. Green Bay WI 425Georgia-Pacific Corp. Superior WI 51Georgia-Pacific Corp. Green Bay WI 175Georgia-Pacific Corp. Pryor OK 69Georgia-Pacific LLC Muskogee OK 374Glatfelter Chillicothe OH 465Globe Building Materials Inc. Cornell WI 73Graphic Packaging Holding Company Middletown OH 153Graphic Packaging Holding Corporation Kalamazoo MI 351Great Lakes Tissue Co. Cheboygan MI 36Green Bay Packaging Inc. Green Bay WI 225Greif Bros. Corp. Massillon OH 120Huebert Brothers Products L.L.C. Boonville MO 27International Paper Co. (former Weyerhaeuser Co.) Cedar Rapids IA 979International Paper Co. (former Weyerhaeuser Co.) Henderson KY 249International Paper Co. (former Weyerhaeuser Co.) Valliant OK 1360Johns-Manville Corp. Rockdale IL 73Kimberly-Clark Corp. Owensboro KY 136Kimberly-Clark Corp. Munising MI 48Kimberly-Clark Corp. Loudon TN 60Kimberly-Clark Corp. Marinette WI 75Kimberly-Clark Corp. Neenah WI 100Kimberly-Clark Corp. Jenks OK 72Kruger Tissue Group Memphis TN 121Liberty Paper Inc.(Liberty Industries) Becker MN 155Little Rapids Corp. Shawano WI 56Ludlow Corp. Constantine MI 53Madison Paper Co. Alsip IL 228Manistique Papers Inc.(Kruger Inc.) Manistique MI 110Menominee Paper Co. Menominee MI 15Middletown Paperboard(Newark Group, Inc.) Middletown OH 55Mohawk Fine Papers, Inc. Hamilton OH 65National Gypsum Co. Pryor OK 79Neenah Paper(Kimberly-Clark Corp.) Neenah WI 80Neenah Paper(Kimberly-Clark Corp.) Stevens Point WI 80Neenah Paper, Inc. Appleton WI 35Newark Group Inc.(Franklin Boxboard Corp.) Franklin OH 66NewPage Corp. Escanaba MI 761NewPage Corp. Stevens Point WI 239

Section 7 Industry Profiles for PADDs I and II
U.S. Sulfur/Sulfuric Acid Market Analysis
73
Q209_01436.001.11
Table 7.5 PADD II Pulp and Paper Mills (Cont’d.) Paper Production Capacity – Thousand Metric Tons
NewPage Corp. Wisconsin Rapids WI 320NewPage Corp. Wisconsin Rapids WI 108NewPage Corp. Stevens Point WI 152NewPage Corp. Wisconsin Rapids WI 579NewPage Corp.(Cerberus Capital Mgt.) Wickliffe KY 426NewPage Corp.(Cerberus Capital Mgt.) Duluth MN 240NewPage Corp.(Cerberus Capital Mgt.) Duluth MN 132Ohio Paperboard (Newark Group Inc.) Baltimore OH 125Ohio Pulp Mills, Inc. Cincinnati OH 18Orchids Paper Products Co. Pryor OK 35Packaging Corp. of America Filer City MI 310Packaging Corp. of America Counce TN 927Packaging Corp. of America Tomahawk WI 520Pactiv Corp. Griffith IN 32PaperWorks Industries Inc. (Sun Capital Partners, Inc.) Wabash IN 142Plainfield Asset Management Hamilton OH 146Plainwell Tissue Inc. Memphis TN 44Ponderosa Fibres of America Inc. Memphis TN 70Ponderosa Fibres of America Inc. Oshkosh WI 77Procter&Gamble Paper Products Green Bay WI 229Rock-Tenn Co. Aurora IL 35Rock-Tenn Co. Eaton IN 60Rock-Tenn Co. Battle Creek MI 130Rock-Tenn Co. St. Paul MN 180Rock-Tenn Co. Cincinnati OH 53Rock-Tenn Co. Chattanooga TN 120Sappi Fine Paper North America Muskegon MI 285Sappi Fine Paper North America Cloquet MN 230SCA Tissue North America L.L.C. (Svenska Cellulose Ab) Alsip IL 60SCA Tissue North America, L.L.C. (Svenska Cellulose Ab) Menasha WI 220SFK Pulp Menominee MI 165Simkins Industries Inc. Indianapolis IN 26Simplicity Pattern Co., Inc. Niles MI 12Smurfit-Stone Container Corp. Ontonagon MI 271Smurfit-Stone Container Corp. Coshocton OH 328Sonoco Products Co. Hutchinson KS 109Sonoco Products Co. Lancaster OH 45Sonoco Products Co. Munroe Falls OH 25Sonoco Products Co. Newport TN 119Sonoco Products Co. Menasha WI 63Sorenson Paperboard Corp. Palmyra MI 28Southern Cellulose Products Inc. Chattanooga TN 50ST Paper, LLC Oconto Falls WI 68Tamko Roofing Products, Inc. Phillipsburg KS 36Tamko Roofing Products, Inc. Joplin MO 51Tamko Roofing Products, Inc. Knoxville TN 80

Section 7 Industry Profiles for PADDs I and II
U.S. Sulfur/Sulfuric Acid Market Analysis
74
Q209_01436.001.11
Table 7.5 PADD II Pulp and Paper Mills (Cont’d.) Paper Production Capacity – Thousand Metric Tons
Owner Location State CapacityTemple-Inland Corp. Maysville KY 486Temple-Inland Corp. New Johnsonville TN 330Temple-Inland Corp., Premier Boxboard Ltd. Cayuga IN 323Thilmany, LLC Kaukauna WI 200Thilmany, LLC De Pere WI 65U.S. Paper Mills Corp. De Pere WI 35United States Gypsum Co. North Kansas City MO 35United States Gypsum Corp. Otsego MI 228Valley Converting Co. Toronto OH 39Verso Paper Holdings LLC Norway, Quinnesec Mill MI 605Verso Paper Holdings LLC Sartell MN 310Wausau Paper Corp. Brokaw WI 176Wausau Paper Corp. Mosinee WI 116Wausau-Mosinee Paper Corp Brainerd MN 155Wausau-Mosinee Paper Corp. Rhinelander WI 199White Pigeon Paper Co. White Pigeon MI 70Wisconsin Paperboard(Newark Group) Milwaukee WI 152Total 25,325
As the Kraft Process for pulp making requires sulfuric acid amongst other paper making processes, and due to the large amount of paper production in the United States, particularly in PADD I and II, the pulp and paper industry are large end users of sulfuric acid. Summarized below are contacts with major players in the pulp and paper industry in the United States.
International Paper Company is a global paper and packaging company that is complemented by an extensive North American merchant distribution system, with primary markets and manufacturing operations in North America, Europe, Latin America, Russia, Asia and North Africa. International Paper had sales in 2007 of $22 billion and for 2007 was ranked No. 93 among Fortune 500 companies. They operate 16 pulp, paper and packaging mills, 85 converting and packaging plants and 4 wood products facilities in the United States. International Paper stated that they expect demand growth in sulfuric acid for the pulp and paper industry to be flat. They currently source their sulfuric acid from various suppliers. Pricing for purchased sulfuric acid is done through bidding, with the lowest delivered price generally winning the contract, and is done on a case by case basis for each mill location. Long and short term supply contracts are possible, though many suppliers are wary to lock in a price for a long term contract as there has been considerable volatility in the sulfuric acid price in recent years. International Paper stated that they would welcome a new source of supply, as long as the price was favorable.
Georgia-Pacific is one of the world's leading manufacturers of tissue, pulp, paper, packaging, building products and related chemicals. They have approximately 300 manufacturing facilities across North America, South America and Europe, ranging from large pulp, paper and tissue

Section 7 Industry Profiles for PADDs I and II
U.S. Sulfur/Sulfuric Acid Market Analysis
75
Q209_01436.001.11
operations to gypsum plants, box plants and building products complexes. Headquartered in Atlanta, Georgia-Pacific employs more than 45,000 people at approximately 300 locations worldwide. In 2005 it was acquired as a wholly owned subsidiary of Koch Industries, Inc., a privately owned company based in Wichita, Kansas. Similar to International Paper’s view of demand growth for sulfuric acid in the pulp and paper industry, Georgia-Pacific expects demand growth to be flat. Unlike the situation with International Paper, Georgia-Pacific’s sulfuric acid purchasing for the entire company is handled through their corporate office. Georgia-Pacific corporate stated that they generally do not accept unsolicited offers from vendors.
Smurfit-Stone is another one of the largest pulp and paper manufacturers in the United States. They operate approximately 150 facilities with nearly 22,000 employees in the United States, Canada, Mexico, and Asia. Smurfit-Stone stated that they too see demand growth for sulfuric acid in the pulp and paper industry as flat. They currently are supplied with sulfuric acid by Chemtrade Logistics, and Norfalco. Smurfit-Stone’s stated that their choice of supplier is based upon the bidding for the lowest possible price. Long and short term contracts are available, and interest in a new supplier is largely dependant on pricing.
7.3.1.2 Integrated Steel Mills
Table 7.6 lists integrated steel mills in PADDs I and II. Steel mills use an acid bath to do what is called “pickling” of steel, a purification step removing scale and other undesirables from the final product. In excess of half of all steel products are pickled. Sulfuric acid and hydrochloric acid are used for pickling of carbon steel, which accounts for in excess of 90 percent of steel manufactured in the United States. Beginning in the mid 1960’s the trend has been to use hydrochloric acid instead of sulfuric acid because it is less expensive, cleaner, requires a smaller amount of acid, has a higher utilization of acid, lower steam consumption, less waste pickle liquor, and creates a more uniformed product. Typically hydrochloric acid is used for continuous and so called push pull pickling, whereas sulfuric acid is still used for batch-wise pickling. Nexant’s relevant contacts with the steel industry are summarized below.
ArcelorMittal is the world's largest steel company, present in more than 60 countries. It led the consolidation of the world steel industry, and as a result is the leader in all major global markets, including automotive, construction, household appliances and packaging. The Group leads in R&D and technology, holds sizeable captive supplies of raw materials and operates extensive distribution networks. Its industrial presence in Europe, Asia, Africa and America gives the Group exposure to all the key steel markets, from emerging to mature. ArcelorMittal key financials for 2008 show revenues of $124.9 billion and crude steel production of 103.3 million tons, representing approximately 10% of world steel output. ArcelorMittal stated that they no longer use sulfuric acid in the pickling process, opting to use hydrochloric acid instead. They stated that they expect sulfuric acid demand growth in the steel industry to be negative, as the trend is towards using hydrochloric acid in place of sulfuric acid; additionally this is a tough time for the steel industry as the economic crisis has drastically reduced both the price and demand for steel in the United States. However, substitution of other acids for sulfuric acid is will not necessarily create a depression of demand, as sulfuric acid is used to produce some other acids commonly used as replacements such as hydrochloric and hydrofluoric acids.
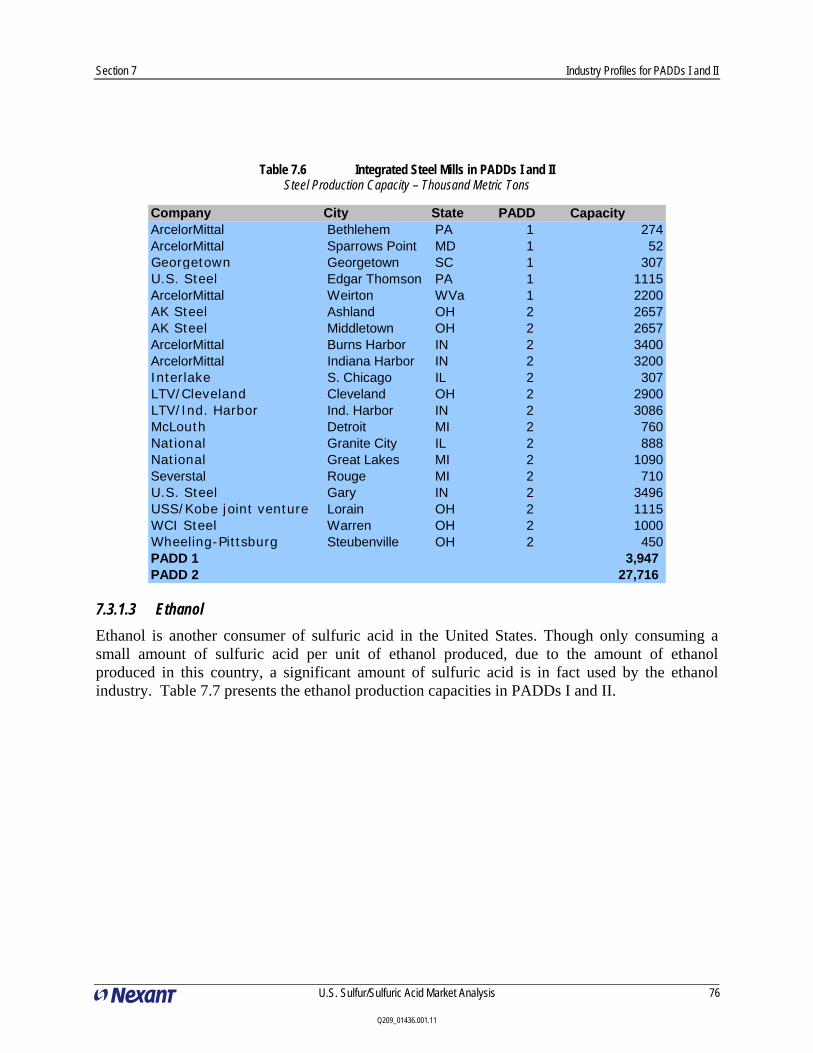
Section 7 Industry Profiles for PADDs I and II
U.S. Sulfur/Sulfuric Acid Market Analysis
76
Q209_01436.001.11
Table 7.6 Integrated Steel Mills in PADDs I and II Steel Production Capacity – Thousand Metric Tons
Company City State PADD CapacityArcelorMittal Bethlehem PA 1 274ArcelorMittal Sparrows Point MD 1 52Georgetown Georgetown SC 1 307U.S. Steel Edgar Thomson PA 1 1115ArcelorMittal Weirton WVa 1 2200AK Steel Ashland OH 2 2657AK Steel Middletown OH 2 2657ArcelorMittal Burns Harbor IN 2 3400ArcelorMittal Indiana Harbor IN 2 3200Interlake S. Chicago IL 2 307LTV/Cleveland Cleveland OH 2 2900LTV/Ind. Harbor Ind. Harbor IN 2 3086McLouth Detroit MI 2 760National Granite City IL 2 888National Great Lakes MI 2 1090Severstal Rouge MI 2 710U.S. Steel Gary IN 2 3496USS/Kobe joint venture Lorain OH 2 1115WCI Steel Warren OH 2 1000Wheeling-Pittsburg Steubenville OH 2 450PADD 1 3,947 PADD 2 27,716
7.3.1.3 Ethanol
Ethanol is another consumer of sulfuric acid in the United States. Though only consuming a small amount of sulfuric acid per unit of ethanol produced, due to the amount of ethanol produced in this country, a significant amount of sulfuric acid is in fact used by the ethanol industry. Table 7.7 presents the ethanol production capacities in PADDs I and II.

Section 7 Industry Profiles for PADDs I and II
U.S. Sulfur/Sulfuric Acid Market Analysis
77
Q209_01436.001.11
Table 7.7 Ethanol Production Capacity in PADDs I and II Capacity – Millions of Gallons per Year
Estimated
PADD Acid Demand
(MMGPY) (Thousand Metric Tons)Bional Clearfield Clearfield, PA 1 Corn
Clean Burn Fuels, LLC Raeford, NC 1 Corn
Northeast Biofuels Volney, NY 1 Corn
Range Fuels Soperton, GA 1 Wood waste
Southwest Georgia Ethanol, LLC Camilla, GA 1 Corn 100 2.13
Western New York Energy LLC Shelby, NY 1 50 1.06Wind Gap Farms Baconton, GA 1 Brewery waste 0.4 0.01
Abengoa Bioenergy Corp. (Total) 2 168 3.57
Abengoa Bioenergy Corp. Madison, IL 2 corn
Abengoa Bioenergy Corp. Mt. Vernon, IN 2 corn
Abengoa Bioenergy Corp. Colwich, KS 2 corn/milo
Abengoa Bioenergy Corp. Ravenna, NE 2 Corn
Abengoa Bioenergy Corp. York, NE 2 Corn
Absolute Energy, LLC* St. Ansgar, IA 2 Corn 100 2.13
ACE Ethanol, LLC Stanley, WI 2 Corn 41 0.87
Adkins Energy, LLC* Lena, IL 2 Corn 40 0.85
Advanced Bioenergy, LLC Fairmont, NE 2 Corn 100 2.13
Advanced Bioenergy, LLC Aberdeen, SD 2 Corn 50 1.06
Advanced Bioenergy, LLC Huron, SD 2 Corn 32 0.68
Ag Energy Resources, Inc. Benton, IL 2 corn
AGP* Hastings, NE 2 Corn 52 1.11
Agri-Energy, LLC* Luverne, MN 2 Corn 21 0.45
Al-Corn Clean Fuel* Claremont, MN 2 Corn 42 0.89Alchem Ltd. LLP Grafton, ND 2 Corn
AltraBiofuels Coshocton Ethanol, LLC Coshocton, OH 2 corn
AltraBiofuels Indiana, LLC Cloverdale, IN 2 corn
Amaizing Energy, LLC* Atlantic, IA 2 Corn
Amaizing Energy, LLC* Denison, IA 2 Corn 48 1.02
18 - Archer Daniels Midland (Total) 2 1,070.00 22.76
Archer Daniels Midland Cedar Rapids, IA 2 Corn
Archer Daniels Midland Clinton, IA 2 Corn
Archer Daniels Midland Decatur, IL 2 Corn
Archer Daniels Midland Peoria, IL 2 Corn
Archer Daniels Midland Marshall, MN 2 Corn
Archer Daniels Midland Wallhalla, ND 2 Corn/barley
Archer Daniels Midland Columbus, NE 2 Corn
Arkalon Energy, LLC Liberal, KS 2 Corn 110 2.34
26 - Aventine Renewable Energy, LLC (Total) 2 207 4.40
Aventine Renewable Energy, LLC Pekin, IL 2 Corn
Aventine Renewable Energy, LLC Aurora, NE 2 Corn
Badger State Ethanol, LLC* Monroe, WI 2 Corn 48 1.02
Big River Resources Galva, LLC Galva, IL 2 corn
Big River Resources, LLC* West Burlington, IA 2 Corn 92 1.96
BioFuel Energy - Buffalo Lake Energy, LLC Fairmont, MN 2 Corn 115 2.45
BioFuel Energy - Pioneer Trail Energy, LLC Wood River, NE 2 Corn 115 2.45
Blue Flint Ethanol Underwood, ND 2 Corn 50 1.06
Bonanza Energy, LLC Garden City, KS 2 Corn/milo 55 1.17Bridgeport Ethanol Bridgeport, NE 2 corn 54 1.15
Bushmills Ethanol, Inc.* Atwater, MN 2 Corn 50 1.06
Cardinal Ethanol Union City, IN 2 Corn 100 2.13
Cargill, Inc. Eddyville, IA 2 Corn 35 0.74
Cargill, Inc. Blair, NE 2 Corn 85 1.81
Castle Rock Renewable Fuels, LLC Necedah, WI 2 Corn 50 1.06Center Ethanol Company Sauget, IL 2 Corn 54 1.15
Central Indiana Ethanol, LLC Marion, IN 2 Corn 40 0.85
Central MN Ethanol Coop* Little Falls, MN 2 Corn 21.5 0.46
Chief Ethanol Hastings, NE 2 Corn 62 1.32
Chippewa Valley Ethanol Co.* Benson, MN 2 Corn 45 0.96
Commonwealth Agri-Energy, LLC* Hopkinsville, KY 2 Corn 33 0.70
Corn Plus, LLP* Winnebago, MN 2 Corn 44 0.94
Corn, LP* Goldfield, IA 2 Corn 55 1.17
Cornhusker Energy Lexington, LLC Lexington, NE 2 Corn 40 0.85
Dakota Ethanol, LLC* Wentworth, SD 2 Corn 50 1.06
DENCO, LLC Morris, MN 2 Corn
Didion Ethanol Cambria, WI 2 Corn 40 0.85E Caruso (Goodland Energy Center) Goodland, KS 2 Corn
Operating ProductionCompany Location Feedstock

Section 7 Industry Profiles for PADDs I and II
U.S. Sulfur/Sulfuric Acid Market Analysis
78
Q209_01436.001.11
Table 7.7 Ethanol Production Capacity in PADDs I and II (Cont’d.) Capacity – Millions of Gallons per Year
Estimated
PADD Acid Demand
(MMGPY) (Thousand Metric Tons)E Energy Adams, LLC Adams, NE 2 Corn 50 1.06E3 Biofuels Mead, NE 2 corn
East Kansas Agri-Energy, LLC* Garnett, KS 2 Corn 35 0.74ESE Alcohol Inc. Leoti, KS 2 Seed corn 1.5 0.03
Ethanol Grain Processors, LLC Obion, TN 2 Corn 100 2.13Gateway Ethanol Pratt, KS 2 Corn
Glacial Lakes Energy, LLC - Mina Mina, SD 2 corn 107 2.28
Glacial Lakes Energy, LLC* Watertown, SD 2 Corn 100 2.13
Global Ethanol/Midwest Grain Processors Lakota, IA 2 Corn 97 2.06
Global Ethanol/Midwest Grain Processors Riga, MI 2 Corn 57 1.21
Golden Grain Energy, LLC* Mason City, IA 2 Corn 115 2.45
Golden Triangle Energy, LLC* Craig, MO 2 Corn 20 0.43
Grain Processing Corp. Muscatine, IA 2 Corn 20 0.43
Granite Falls Energy, LLC* Granite Falls, MN 2 Corn 52 1.11
Greater Ohio Ethanol, LLC Lima, OH 2 Corn
Green Plains Renewable Energy Shenandoah, IA 2 Corn 55 1.17
Green Plains Renewable Energy Superior, IA 2 Corn 55 1.17
Hawkeye Renewables, LLC Fairbank, IA 2 Corn 120 2.55
Hawkeye Renewables, LLC Iowa Falls, IA 2 Corn 105 2.23
Hawkeye Renewables, LLC Menlo, IA 2 Corn 110 2.34
Hawkeye Renewables, LLC Shell Rock, IA 2 Corn 110 2.34Heartland Corn Products* Winthrop, MN 2 Corn 100 2.13
Heron Lake BioEnergy, LLC Heron Lake, MN 2 Corn 50 1.06
Highwater Ethanol LLC Lamberton, MN 2 Corn
Homeland Energy New Hampton, IA 2 Corn
Husker Ag, LLC* Plainview, NE 2 Corn 75 1.60
Illinois River Energy, LLC Rochelle, IL 2 Corn 100 2.13
Indiana Bio-Energy Bluffton, IN 2 Corn 101 2.15
Iroquois Bio-Energy Company, LLC Rensselaer, IN 2 corn 40 0.85
KAAPA Ethanol, LLC* Minden, NE 2 Corn 40 0.85
Kansas Ethanol, LLC Lyons, KS 2 Corn 55 1.17Land O' Lakes* Melrose, MN 2 Cheese whey 2.6 0.06
LDCommodities Grand Junction, IA 2 corn
LDCommodities Norfolk, NE 2 Corn 45 0.96
Lifeline Foods, LLC St. Joseph, MO 2 Corn 40 0.85Lincolnland Agri-Energy, LLC* Palestine, IL 2 Corn 48 1.02
Lincolnway Energy, LLC* Nevada, IA 2 Corn 50 1.06
Little Sioux Corn Processors, LP* Marcus, IA 2 Corn 92 1.96
Marquis Energy, LLC Hennepin, IL 2 Corn 100 2.13Marysville Ethanol, LLC Marysville, MI 2 Corn 50 1.06Mid America Agri Products/Horizon Cambridge, NE 2 Corn
Mid America Agri Products/Wheatland Madrid, NE 2 Corn 44 0.94
Mid-Missouri Energy, Inc.* Malta Bend, MO 2 Corn 50 1.06
Midwest Renewable Energy, LLC Sutherland, NE 2 Corn 25 0.53
Minnesota Energy* Buffalo Lake, MN 2 Corn 18 0.38NEDAK Ethanol Atkinson, NE 2 corn
Nesika Energy, LLC Scandia, KS 2 corn 10 0.21New Energy Corp. South Bend, IN 2 Corn 102 2.17North Country Ethanol, LLC* Rosholt, SD 2 Corn 20 0.43
One Earth Energy Gibson City, IL 2 corn
Otter Tail Ag Enterprises Fergus Falls, MN 2 Corn 57.5 1.22
Parallel Products Louisville, KY 2 Beverage waste 5.4 0.11
Patriot Renewable Fuels, LLC Annawan, IL 2 Corn 100 2.13
Penford Products Cedar Rapids, IA 2 Corn 45 0.96
Pine Lake Corn Processors, LLC Steamboat Rock, IA 2 corn 30 0.64
Platinum Ethanol, LLC* Arthur, IA 2 Corn 110 2.34
Plymouth Ethanol, LLC* Merrill, IA 2 Corn 50 1.06
POET Biorefining - Alexandria Alexandria, IN 2 Corn 68 1.45
POET Biorefining - Ashton Ashton, IA 2 Corn 56 1.19
POET Biorefining - Big Stone Big Stone City, SD 2 Corn 79 1.68
POET Biorefining - Bingham Lake Bingham Lake, MN 2 Corn 35 0.74
POET Biorefining - Caro Caro, MI 2 Corn 53 1.13
POET Biorefining - Chancellor Chancellor, SD 2 Corn 110 2.34
POET Biorefining - Coon Rapids Coon Rapids, IA 2 Corn 54 1.15
POET Biorefining - Corning Corning, IA 2 Corn 65 1.38
POET Biorefining - Emmetsburg Emmetsburg, IA 2 Corn 55 1.17
Company Location Feedstock Operating Production

Section 7 Industry Profiles for PADDs I and II
U.S. Sulfur/Sulfuric Acid Market Analysis
79
Q209_01436.001.11
Table 7.7 Ethanol Production Capacity in PADDs I and II (Cont’d.) Capacity – Millions of Gallons per Year
Estimated
PADD Acid Demand
(MMGPY) (Thousand Metric Tons)POET Biorefining - Fostoria Fostoria, OH 2 Corn 68 1.45
POET Biorefining - Glenville Albert Lea, MN 2 Corn 42 0.89
POET Biorefining - Gowrie Gowrie, IA 2 Corn 69 1.47
POET Biorefining - Hanlontown Hanlontown, IA 2 Corn 56 1.19
POET Biorefining - Hudson Hudson, SD 2 Corn 56 1.19
POET Biorefining - Jewell Jewell, IA 2 Corn 69 1.47
POET Biorefining - Laddonia Laddonia, MO 2 Corn 50 1.06
POET Biorefining - Lake Crystal Lake Crystal, MN 2 Corn 56 1.19
POET Biorefining - Leipsic Leipsic, OH 2 Corn 68 1.45
POET Biorefining - Macon Macon, MO 2 Corn 46 0.98
POET Biorefining - Marion Marion, OH 2 Corn
POET Biorefining - Mitchell Mitchell, SD 2 Corn 68 1.45
POET Biorefining - North Manchester North Manchester, IN 2 Corn 68 1.45
POET Biorefining - Portland Portland, IN 2 Corn 68 1.45
POET Biorefining - Preston Preston, MN 2 Corn 46 0.98
POET Biorefining - Scotland Scotland, SD 2 Corn 11 0.23
POET Biorefining- Groton Groton, SD 2 Corn 53 1.13
Prairie Horizon Agri-Energy, LLC Phillipsburg, KS 2 Corn 40 0.85
Quad-County Corn Processors* Galva, IA 2 Corn 30 0.64
Red Trail Energy, LLC Richardton, ND 2 Corn 50 1.06
Redfield Energy, LLC * Redfield, SD 2 Corn 50 1.06Reeve Agri-Energy Garden City, KS 2 Corn/milo 12 0.26Renew Energy Jefferson Junction, WI 2 Corn 130 2.77Riverland Biofuels Canton, IL 2 corn 37 0.79
Show Me Ethanol Carrollton, MO 2 Corn 55 1.17
Siouxland Energy & Livestock Coop* Sioux Center, IA 2 Corn 60 1.28
Siouxland Ethanol, LLC Jackson, NE 2 Corn 50 1.06Southwest Iowa Renewable Energy, LLC * Council Bluffs, IA 2 Corn 110 2.34
Tate & Lyle Ft. Dodge, IA 2 Corn
Tate & Lyle Loudon, TN 2 Corn 67 1.43Tharaldson Ethanol Casselton, ND 2 Corn 110 2.34
The Andersons Albion Ethanol LLC Albion, MI 2 Corn 55 1.17
The Andersons Clymers Ethanol, LLC Clymers, IN 2 Corn 110 2.34
The Andersons Marathon Ethanol, LLC Greenville, OH 2 Corn 110 2.34
Trenton Agri Products, LLC Trenton, NE 2 Corn 40 0.85
United Ethanol Milton, WI 2 Corn 52 1.11United WI Grain Producers, LLC* Friesland, WI 2 Corn 49 1.04
Utica Energy, LLC Oshkosh, WI 2 Corn 48 1.02
VeraSun Energy Corp. Dyersville, IA 2 corn
VeraSun Energy Corp. Linden, IN 2 Corn
VeraSun Energy Corp. Lake Odessa, MI 2 Corn
VeraSun Energy Corp. Janesville, MN 2 corn
VeraSun Energy Corp. Welcome, MN 2 corn
VeraSun Energy Corp. Hankinson, ND 2 corn
VeraSun Energy Corp. Albion, NE 2 corn
VeraSun Energy Corp. Central City, NE 2 corn
VeraSun Energy Corp. Ord, NE 2 Corn
VeraSun Energy Corp. Bloomingburg, OH 2 corn
VeraSun Energy Corp. Marion, SD 2 corn
178 - VeraSun Energy Corporation (Total) 2 450 9.57
VeraSun Energy Corporation Albert City, IA 2 Corn
VeraSun Energy Corporation Charles City, IA 2 Corn
VeraSun Energy Corporation Ft. Dodge, IA 2 Corn
VeraSun Energy Corporation Hartley, IA 2 Corn
VeraSun Energy Corporation Welcome, MN 2 Corn
VeraSun Energy Corporation Aurora, SD 2 Corn
Western Plains Energy, LLC* Campus, KS 2 Corn 45 0.96
Western Wisconsin Renewable Energy, LLC* Boyceville, WI 2 Corn 40 0.85
White Energy Russell, KS 2 Milo/wheat starch 48 1.02
Xethanol BioFuels, LLC Blairstown, IA 2 Corn 5 0.11
Ethanol Production PADD 1 150 3.20
Ethanol Production PADD 2 3,415 72.64
Total 3,565 75.84
Operating ProductionCompany Location Feedstock

Section 7 Industry Profiles for PADDs I and II
U.S. Sulfur/Sulfuric Acid Market Analysis
80
Q209_01436.001.11
Ethanol, though only using a small amount of acid per gallon produced, is a very large end user of sulfuric acid domestically due to the volume of ethanol produced in the United States. Nexant’s relevant contacts with the ethanol industry are summarized below.
Poet, formerly known as Broin, is the largest Ethanol producer in the United States. With a network of 26 plants in seven states producing over one billion gallons of ethanol annually, their facilities are the most successful and profitable in the industry. Poet consumes roughly 13 million pounds (about 6,000 metric tons) of sulfuric acid annually as part of the ethanol production process. Poet expects demand growth for sulfuric acid in the ethanol industry as flat to negative, as the industry is trying to become more efficient, and is trying to diminish sulfuric acid use, though they stated that the technology is not there yet. Though Poet is currently supplied by Hawkins, Inc., a sulfuric acid supplier in the Midwest, a supply agreement that was just entered into, Poet invites new suppliers to bid for supply in 2-3 years when the current supply contract expires. Suppliers will be chosen based upon two criteria, the first of which is price. Similar to other consumers of sulfuric acid, supply contracts are bid on, with the low bidder generally winning the supply. The second criterion is security of supply. Poet stated that they would not be able to accept a supply interruption as this would force a pause in production.
Advanced Bioenergy, LLC is another large ethanol producer in the Midwest. With plants in South Dakota, and Nebraska, they too are significant consumers of sulfuric acid. Advanced bioenergy consumes 200 million gallons of sulfuric acid annually. While they do not expect demand to increase for sulfuric acid, they also stated that they do not see that the demand by the ethanol industry will be decreased as the Renewable Fuel Standard (RFS) is increasing the demand for ethanol. The increased demand for ethanol is expected to increase domestic production, which in turn will increase the amount of consumers, buffering against demand loss due to increased efficiencies and lower consumption per gallon of ethanol produced.
7.3.1.4 Chemical Companies
Virtually all chemical companies have some requirement for sulfuric acid. This can be as a reagent, catalyst for a reaction, or as a pH adjustment or neutralizer amongst other uses. Tables 7.9 and 7.10 present chemical companies in PADDs I and II respectively. This listing includes chemical retailers such as Sigma Aldrich and Malinckrodt, who are distributors, typically to laboratories, and typically in smaller quantities. Also included in this listing are the larger chemical companies such as DOW and Carolina Eastman, who are chemical manufacturers.

Section 7 Industry Profiles for PADDs I and II
U.S. Sulfur/Sulfuric Acid Market Analysis
81
Q209_01436.001.11
Table 7.8 PADD I Chemical Companies
Company City StateCoastal Products Co. Westbrook MEAronol Westbrook MEChemfast Westbrook MEChute Chemical Co., Inc. Bangor MEMedical Isotopes, Inc. Pelham NHRoymal, Inc. Newport NHDigital Specialty Chemicals Limited Dublin NHAmerican Sand-Banum Co., Inc. Sunapee NHCoating Systems, Inc. Nashua NHChem-Pak, Inc. Martinsburg WVNew Chem Inc. New Cumberland WVKincaid Enterprises, Inc. Nitro WVRaybo Chemical Corp. Huntington WVGE Co., GE Specialty Chemicals Parkersburg WVCreative Materials, Inc. Tyngsboro MASolutek Corp. Boston MAIris Engineering, Inc. Ashland MAMulti-Sport Norwood MAWebco Chemical Corp. Dudley MAPrime Polymers, Inc. Lynn MANano-C, Inc. Westwood MAHeesung Metals Rehoboth MAGlsynthesis Inc Worcester MABorden & Remington Corp. Fall River MABoremco Specialty Chemicals Fall River MAMascon Woburn MABarclay Water Management, Inc. Watertown MAHapco Hanover MASensiv, Inc. Waltham MAWireway/Husky Corp. Sterling MACarlisle Chemical Co. Lexington MABorregaard Synthesis Inc. Newburyport MACristy Corp. Fitchburg MANEN Life Science Products Boston MABay State Adhesive Corp. Salem MADiptech Inc. Manchester MAWater Chemicals, Inc. Chelsea MANew England Biolabs Inc. Beverly MARamsey Co. Marlborough MAPolaroid Corp., Chemicals Div. Waltham MASphinx Adsorbents, Inc. Springfield MAHOLLAND COMPANY INC. ADAMS MAProcess Solutions Inc. Longmeadow MALab Chem Plus Indian Orchard MALoctite Industrial, Henkel Corp. Rocky Hill CTJensen Fabricating Engineers, Inc./JENFAB Berlin CTRose Mill Co. West Hartford CTSimoniz USA, Inc Bolton CTHampford Research Stratford CTPfaltz & Bauer Waterbury CTAlcan International Network USA, Inc. Alcan Chemical Stamford CTCharkit Chemical Corp. Norwalk CTMacDermid, Inc. Waterbury CTMomentive Performance Materials Inc. Wilton CTRago Industries, Inc Shelton CTRem Chemicals, Inc. Southington CTMica Corporation Shelton CTRSA Corp. Danbury CTPurification Technologies, Inc Chester CTDow Chemical Co. Gales Ferry CTDiagnostic Chemicals Ltd. (USA) Oxford CTSanitized, Inc. New Preston CTChessco Industries, Inc. Westport CTU.S. Chemical, Inc. New Canaan CTTechnical Industries, Inc. Peace Dale RITerecon Corporation Saunderstown RIBercen, Inc. Cranston RINerl Diagnostics Corporation East Providence RI

Section 7 Industry Profiles for PADDs I and II
U.S. Sulfur/Sulfuric Acid Market Analysis
82
Q209_01436.001.11
Table 7.8 PADD I Chemical Companies (Cont’d.)
Company City StateEpoxies Etc. Cranston RIUltra Scientific, Inc. Kingstown RICal Chemical Corp. Coventry RISpectral Chemical Co., Inc. Warwick RIInternational Dioxcide, Inc. North Kingstown RIHess, John R. Co. Cranston RICNC International Corp. Woonsocket RIOriginal Bradford Soap Works, Inc. West Warwick RIHercules, Inc. Wilmington DEArchimica, Inc. Wilmington DEGrace, W. R. & Co. Columbia MDChemgen Gaithersburg MDArcal Chemicals, Inc. Capitol Heights MDErachem Comilog Baltimore MDColonial Metals, Inc. Elkton MDPharmaKinetics Laboratories, Inc. Baltimore MDDentocide Chemical Co. Brooklyn MDPaulen Industries, Inc. Beltsville MDDynasurf Chemical Corp. Baltimore MDPhiladelphia Quartz Co. Baltimore MDChem-Met Co. Clinton MDNiacet Corp. Niagara Falls NYIndium Corp. of America Utica NYFerro Corp. Penn Yan NYCridel Syracuse NYRemet, Inc. Utica NYAldon Corporation Avon NYComac Builders Supply Corp. Rochester NYSurpass Chemical Albany NYBison Laboratories, Inc. Buffalo NYTarksol Inc. Rochester NYRochester Midland Corp. (RMC) Rochester NYUc Coatings Buffalo NYFlame Control Coatings, Inc. Niagara Falls NYMorgan Materials, Inc. Buffalo NYAmerican Biorganics, Inc. Niagara Falls NYMil-Spec Industries Corp. Roslyn Heights NYAlfa Chemical Corp. Kings Point NYChemi-Coatings, Inc. Walden NYTridon Chemical Deer Park NYChemcor Chester NYPositive Products Laboratories Inc. Poughkeepsie NYPall Corporation Port Washington NYSovereign Products Inc Brooklyn NYIdp Labs Inc Chappaqua NYGlobal Decisions, Inc. Islip NYChemclean Corp. Jamaica NYSundial Fragrances & Flavors, Inc. Bohemia NYM. Michel & Company, Inc. New York NYAlconox, Inc. White Plains NYBalchem Corp. Slate Hill NYHogan Flavors & Fragrances, Inc. New York NYAxel Plastics Research Laboratories, Inc. Woodside NYFiber-Shield Industries, Inc. Yaphank NYCitrus & Allied Essences Ltd New Hyde Park NYArc Specialty Products - Balchem Corp. Slate Hill NYAtomergic Chemetals Corp. Farmingdale NYMitsui Chemicals America, Inc. Rye Brook NYLeico Industries New York NYCrowley Tar Products Co., Inc. New York NYMelax Mfg., Inc. Woodside NYVitriturf Hauppauge NYSanofi Pharmaceuticals New York NYNuvite Chemical Compounds Corporation Brooklyn NYSafeguard Chemical Corporation Bronx NYPax Surface Chemicals, Inc. Syosset NYCiba Speciality Chemicals Tarrytown NYPower Chemical Co., Inc. Bronx NY

Section 7 Industry Profiles for PADDs I and II
U.S. Sulfur/Sulfuric Acid Market Analysis
83
Q209_01436.001.11
Table 7.8 PADD I Chemical Companies (Cont’d.) Company City StateMetro Group, Inc., Cosmopolitan Chemical Co. Div. Long Island City NYTelstar Industries, Inc. Commack NYCentflor Manufacturing Co., Inc. New York NYCentury Multech, Inc. Flushing NYSilfen, Leo, Inc. Bedford NYAyers International Corp. Irvington NYParke-Hill Chemical Corp. Mount Vernon NYRONA/EM Industries, Inc. Hawthorne NYTwintex Chemical Corp. Brooklyn NYCA Aromatics Co. Floral Park NYEnequist Chemical Co., Inc. Brooklyn NYMeta-Therm Corp. Harrison NYAjax Chemical Corp. Floral Park NYJax Chemical Co. Floral Park NYEssential Fine Ingredients, Inc. Port Washington NYNon Tox Chemical Corp. Woodside NYVitricon Commack NYAndrews Paper & Chemical Co., Inc. Port Washington NYNepera, Inc., A Cambrex Co. Harriman NYBio-Scientific Specialty Products, Inc. Freeport NYACL Mill Neck NYAquaphoenix Scientific Hanover PASartomer Co., Inc. Exton PAHoughton International Valley Forge PAFMC Corp. Philadelphia PAEsstech, Inc. Essington PAQuaker Chemical Conshohocken PAPolysciences, Inc. Warrington PAClarkson Chromatography Products Inc. South Williamsport PAPharmachem Corp. Bethlehem PACurtiss Labs Inc. Bensalem PACarbochem, Inc. Ardmore PAArkema, Inc. Philadelphia PAOsram Sylvania Inc., Chemicals & Metallurgical Products Towanda PASunoco Chemicals Philadelphia PAHeico Chemicals, Inc. Delaware Water Gap PAHydrol Chemical Company Yeadon PAChemtech Media PAEpichem Ltd Allentown PACoopers Creek Chemical Corporation West Conshohocken PADCL Solutions Philadelphia PAPQ Corp. Valley Forge PARohm & Haas Co. Philadelphia PAVexcon Chemicals Philadelphia PAPurolite International Limited Bala Cynwyd PAApplied Separations, Inc. Allentown PAMartin, R. & E. Chemicals Philadelphia PAPeacock Laboratories, Inc. Philadelphia PASchafco Packaging Company Lancaster PACantol, Inc. Philadelphia PACorco Chemical Corp. Fairless Hills PAMiller, Harry, Corp. Philadelphia PATwin Specialties Corp. Conshohocken PAJonas, N., & Co., Inc. Bensalem PALeatex Chemical Co. Philadelphia PAA + A Chemical Products Kingston PACeramic Color & Chemical Manufacturing Co. New Brighton PALANXESS Corp. - Material Protection Products Pittsburgh PAPPG Industries, Inc. Pittsburgh PAPenn Carbose Somerset PACallery Chemical Company Evans City PAPressure Chemical Company Pittsburgh PABayer MaterialScience LLC - Inorganic Basic Chemicals Pittsburgh PAAlmatis, Inc. Leetsdale PAFerro Corp. Washington PAABCO Manufacturing Blawnox PAApplied Creativity, Inc. Export PACraft Products Co., Inc. Pittsburgh PA

Section 7 Industry Profiles for PADDs I and II
U.S. Sulfur/Sulfuric Acid Market Analysis
84
Q209_01436.001.11
Table 7.8 PADD I Chemical Companies (Cont’d.) Company City StatePenn Champ, Inc. East Butler PABeaver Alkali Products Rochester PAPenn Texstyle Somerset PASpec Sciences Inc. Sharon PAQuality Chemicals Inc. Tyrone PAEaton Electrical Pittsburgh PAP.W. Perkins Co., Inc. Woodstown NJW.D. Service Co., Inc. Bellmawr NJNortheast Industrial and Marine Equipment Cape May NJBuckton Scott USA Princeton NJGanes Chemicals, Inc. Pennsville NJShieldalloy Metallurgical Corp. Swedesboro NJJohnson Matthey Pharmaceuticals West Deptford NJElementis Specialties Inc. Hightstown NJChemetall America New Providence NJBanner Chemical Corp. Orange NJAtlantic Equipment Engineers, Div. of Micron Metals, Inc. Bergenfield NJDunbar Sales & Manufacturing Co., Inc. Bayonne NJL & R Manufacturing Co. Kearny NJInternational Crystal Laboratories Garfield NJElan Chemical Co. Newark NJPhilipp Brothers Chemicals, Inc. Fort Lee NJPlenum Scientific Research Hackensack NJEvonik Indusatries Ridgefield Park NJIBF Corp. Garfield NJHydro Med Sciences Cranbury NJISP Wayne NJAkcros Chemicals New Brunswick NJMerck & Co., Inc. Whitehouse Station NJHummel Croton Inc. Plainfield NJPenetone Corp. Tenafly NJMallinc.Krodt Baker, Inc. Phillipsburg NJFerro Corp. Edison NJMarisol, Inc. Bound Brook NJBASF Chemical Co. Florhamparic NJDrom International, Inc. Towaco NJJame Fine Chemicals, Inc. Bound Brook NJThermo Cote Inc. Franklin NJSurepure Chemetals, Inc. Florham Park NJBaumar Industries, Inc. Nutley NJCSL Water Treatment, Inc. Warren NJVenture Chemical Co., Inc. Tinton Falls NJRotuba Extruders Inc. Linden NJLipo Chemicals, Inc. Paterson NJMRI International Newton NJOctagon Process, Inc Edison NJCommonwealth Metal Corp. Fort Lee NJCambrex Corp. East Rutherford NJCooper Chemical Company, Inc. Long Valley NJBerje Inc. Bloomfield NJCommercial Products Co. Inc. Hawthorne NJJersey Chemicals, Inc Paterson NJQualco, Inc Passaic NJHoneywell, Inc. Morristown NJFinetex, Inc. Edison NJAdvanced Polymer, Inc. Carlstadt NJArmour Products Hawthorne NJADM Tronics Unlimited, Inc. Northvale NJPharmacia Corp. Peapack NJPariser Industries Chemicals Paterson NJNapp Technologies Saddle Brook NJDiamond Chemical East Rutherford NJInt'l Consolidated Chemex Corporation New Brunswick NJGeneral Chemical Corp. Parsippany NJDow Chemical Co. Bound Brook NJReheis Inc. Berkeley Heights NJCloroben Chemical Corp. Passaic NJHorizon Products, LLC Ridgefield Park NJ

Section 7 Industry Profiles for PADDs I and II
U.S. Sulfur/Sulfuric Acid Market Analysis
85
Q209_01436.001.11
Table 7.8 PADD I Chemical Companies (Cont’d.) Company City StateZrchem Flemington NJStanson Kearney NJPenta Manufacturing Livingston NJEmulsitone Whippany NJCosan Chemical Corp., A Cambrex Co. Carlstadt NJEngelhard Corp., Specialty Chemicals Div. Iselin NJCP/PhibroChem Fort Lee NJEngineering Chemical Services, Inc. Whippany NJUniqema Paterson NJHonig Chemical & Processing Corp. Newark NJFederal Mining & Mfg. Co. Roselle NJRempak Industries, Inc. Fort Lee NJHy-Test 303 Corp. Rutherford NJAetna Chemical Corp. Elmwood Park NJFabric Chemical Corp. Jersey City NJSentry/Custom Services Corp., Specialty Products Div. Allamuchy NJChemisphere Corp. Boonton NJNoramco Inc. New Brunswick NJFoster & Co., Inc. Cedar Knolls NJDegen Co. Jersey City NJLaplace, L.J. & M. Elmwood Park NJPilar River Plate Co. Newark NJUltra Chemical Co. Red Bank NJH & S Chemical Co., Inc. Wallington NJPfister Chemical, Inc. Ridgefield NJBio Clinical Lab, Inc. Phillipsburg NJGrant Chemical Co. Elmwood Park NJDover Laboratories, Inc. Paterson NJScher Chemicals, Inc. Clifton NJFales, W. H., Co. Newton NJExpanded Products, Inc. Pompton Plains NJPolarome Mfg. Co., Inc. Jersey City NJDrew Chemical Corp. Boonton NJGalaxie Chemical Corp. Paterson NJChris Industries, Inc. Freehold NJCapital Janitorial Supply & Service, LLC Richmond VAGoldschmidt Chemical Corp. Hopewell VADanchem Technologies, Inc. Danville VAExloc Instruments, Inc. Warrenton VABoehringer Ingelheim Chemicals, Inc Petersburg VAEthyl Corp. Richmond VADominion Chemical Co. Petersburg VAWen-Don Corp. Roanoke VATidewater Chemical Corp. Chesapeake VAHampton Roads Chemical Corp. Newport News VADow Chemical Co. Richmond VAReagents Charlotte NCGiles Chemical Waynesville NCPisgah Labs, Inc. Pisgah Forest NCProchem Chemicals High Point NCArrochem, Inc. Holly NCHandi-Clean Products Greensboro NCSouth Atlantic Services, Inc. Wilmington NCWright Corporation Wilmington NCChemical Specialties Inc. Charlotte NCApollo Chemical Company, LLC, Inc. Burlington NCSmith Brothers Chemical Co. Plymouth NCLord Corp. Cary NCMorflex Greensboro NCBest Lab Deals Garner NCCvchem Cary NCBoron Molecular Inc. Research Triangle Park NCSurry Chemicals, Inc. Mount Airy NCChtusa Charlotte NCPiedmont Chemical Industries High Point NCForshaw Chemicals Inc. Charlotte NCUnitex Chemical Corporation Greensboro NCStockhausen, LLC Greensboro NC

Section 7 Industry Profiles for PADDs I and II
U.S. Sulfur/Sulfuric Acid Market Analysis
86
Q209_01436.001.11
Table 7.8 PADD I Chemical Companies (Cont’d.) Company City StateNcfi Mount Airy NCCosmechem Hampstead NCMilanco Chemical Inc. Charlotte NCHuron Tech Corp. Delco NCCatawba-Charlab, Inc. Charlotte NCAgri-Tech Systems LLC Dunn NCAthol Manufacturing Co. Butner NCChemol, Inc. Greensboro NCCarochem, Inc. Durham NCAerochem Corp. High Point NCSuper Absorbent Co., Inc. Lumberton NCTillett Chemical, Inc. Pineville NCSoutheastern Chemical Corp. Graham NCMWT & O Inc. Boone NCDavidson Labs, Inc. Davidson NCAll-Chemie, Ltd. Mount Pleasant SCDPI Chemical Lancaster SCLindau Chemicals, Inc. Columbia SCCaraustar Industrial & Consumer Products Group Rock Hill SCEthox Greenville SCMilliken & Co. Spartanburg SCAPEX Chemical Corp. of South Carolina Spartanburg SCBASF Catalysts LLC Seneca SCInnovative Chemical Solutions, Inc Duncan SCKing's Laboratory, Inc. Blythewood SCChemco International, Inc. Greenville SCLubrizol, Inc. Spartanburg SCAxon Products Greenville SCBlackman Uhler Chemical Spartanburg SCMetal Chem, Inc Greenville SCOrtec, Inc. Easley SCSynalloy Corp. Spartanburg SCFire Equipment Services Sumter SCAutomotive Technology Corp. Easley SCFibre Chemicals Anderson SCPatrick, C.H., & Co., Inc. Greenville SCAstro American Chemical Co. Fountain Inn SCSequa Chemicals Inc. Chester SCLever Industrial Co. Ladson SCPlexon Corp. Pelzer SCSpecialty Industrial Products Spartanburg SCAiken Chemical Co., Inc. Greenville SCCarolina Eastman Co. Columbia SCAtlantic Products Westminster SCChapman Corporation Nokomis FLFlorida Chemical Co., Inc. Winter Haven FLR2J Chemical Services, Inc Largo FLTroy Industries Miami FLInternational Chemical Corporation West Melbourne FLBrewer International Vero Beach FLNorthland Manufacturing Tallahassee FLWalter Industries, Inc. Tampa FLHuey Chemical Tampa FLAlchem Laboratories Co. Alachua FLT2 Laboratories Inc Jacksonville FLBastech Chemicals, Inc. Jacksonville FLW.R. Grace & Co. Boca Raton FLBeckman Coulter, Inc. Miami FLStratford Corp. Clearwater FLChemline, Inc. Kissimmee FLJones Chemicals, Inc. Sarasota FLDyco Paints Inc. Clearwater FLPrecision Chemicals, Inc. Tallahassee FLChemical Standards Laboratory, Inc. Clearwater FLChemical Systems Of Florida, Inc. Zellwood FLWebb Wright Corp. Bokeelia FLAstor Products, Inc. Jacksonville FLCleanlook Chemical Corp. Opa Locka FL

Section 7 Industry Profiles for PADDs I and II
U.S. Sulfur/Sulfuric Acid Market Analysis
87
Q209_01436.001.11
Table 7.8 PADD I Chemical Companies (Cont’d.)
Company City StateAppearance Products, Inc. Venice FLU.S. Chemical & Funeral Miami FLAssociated Engineering Chemistry, Inc. Fort Lauderdale FLSun Sanitary Supplies, Inc. Crossroads FLMagnolia Plastics, Inc. Chamblee GAQualiChem Technologies Roswell GAEagle Solutions Adairsville GAAMRep / AMRep MRO Products Marietta GAHuber Engineered Materials Atlanta GAMayzo, Inc. Norcross GAAjay North America LLC Powder Springs GATechnochem, Inc. Augusta GAWaco Chemical & Supply Co., Inc. Dalton GAKor-Chem, Inc. Atlanta GAImerys Alpharetta GAAbaco, Inc Eastanollee GAChemical Products Technology - CPT LLC Cartersville GAEcolink, Inc. Tucker GADow Chemical Co. Dalton GATelechem Atlanta GAKrudKutter Cumming GAFerro Corp. Toccoa GALPS Laboratories, Inc., An Illinois Tool Works Co. Tucker GAAmrep, Inc. Marietta GAAmrep - MRO Products Group Marietta GAJ&S Chemical Canton GAMomar, Inc. Atlanta GAAtco Marietta GAHead's Chemicals, Inc. Atlanta GAResource Innovations, Inc Cartersville GAApollo Industries, Inc. Smyrna GAChemlink Labs Kennesaw GACJB Industries Valdosta GASelecto, Inc. Swanee GALynex Chemical Co. Smyrna GASoutheastern Latex Dalton GAVinings Industries, Inc. Kennesaw GAARI Griffin GAChemtall, Inc. Hinesville GAXL Corp. Calhoun GALiquid Glaze Inc. Toccoa GALLC Industries, Inc. East Point GABlackman-Uhler Chemical Co. Augusta GA

Section 7 Industry Profiles for PADDs I and II
U.S. Sulfur/Sulfuric Acid Market Analysis
88
Q209_01436.001.11
Table 7.9 PADD II Chemical Companies
Company City StateAllied Pressure Washers Vermillion SDRieke Metals Lincoln NEAbs Corporation Omaha NEOdor Z Way Phillipsburg KSVulcan Materials Co. Wichita KSFlint Hills Resources Wichita KSSpurrier Chemical Companies Wichita KSITW Dymon Olathe KSCcpi Topeka KSKaw Valley, Inc. Leavenworth KSMission Clay Products Div., MCP Industries, Inc. Pittsburg KSNatur's Way, Inc. Horton KSMid Continent Packaging Enid OKMagnesium Products, Inc. Tulsa OKPhillips Petroleum Co. Bartlesville OKMontello, Inc. Tulsa OKPhillips Chemical Co., Specialty Chemicals Bartlesville OKTomco Harwel Industries, Inc Tulsa OKSMC Technologies, Inc. Midwest City OKBio Cide International, Inc. Norman OKFluorine & Acetates Catoosa OKKerr McGee Corp. Oklahoma City OKKerr McGee Chemical Corp. Oklahoma City OKTechnisond Inc. Roff OKKinark Corp. Tulsa OKASAS/Tysol Woodbury MNFastenal Winona MNChaska Chemical Savage MNSeacole Specialty Chemical Saint Paul MNHobo Inc Lakeville MNUS Carton & Supply, Inc. Chaska MNFremont Industries, Inc. Shakopee MNEcolab Inc. St. Paul MNUncommon Conglomerates, Inc. St. Paul MNMultiClean Shoreview MNAgsco, Inc. Crookston MNStanke Technical Sales Saint Paul MNAquacide Co. White Bear Lake MNVersaPak Shakopee MNSentinel Chemical Co., Inc. Minneapolis MNFiemont Industries, Inc. Shakopee MNTerra Environmental Technologies, A Terra Industries Co. - Sioux City IATucker Manufacturing Co., Inc. - Cedar Rapids IAMI-T-M - Peosta IAJacobson Warehouse Co. Des Moines IAGreen Valley Chemical Corporation Union County IASalsbury Chemicals, Inc. Charles City IAHigley Chemical Co. Dubuque IAPermeate Refining Inc Cedar Rapids IAWalter Wurdack, Inc. Saint Louis MOChampion Brands, LLC Clinton MOFoam Supplies, Inc. Earth City MOSigma Aldrich Corp. St. Louis MOLubar Chemical Co. Kansas City MOAmerican Chemical Enterprises, Inc. St. Louis MOBrewer Science, Inc. Rolla MOHohn Manufacturing, Inc. Fenton MOJenkin-Guerin, Inc. St Louis MOWhitmire Micro-Gen Research Laboratories, Inc. St. Louis MOKO Mfg. Springfield MOMallinckrodt, Inc. Hazelwood MONavy Brand Manufacturing Co. St. Louis MOWSI Industries LLC/N-Terpinal Springfield MOTerrace Packaging Kansas City MOVarley, James & Sons, Inc. St. Louis MONorth American Chemical Corp. Kansas City MO
Wagner Brake Subsidiary, Moog Automotive, Div. of Cooper Industries St. Louis MO
El Dorado Chemical, Inc. Bonne Terre MO

Section 7 Industry Profiles for PADDs I and II
U.S. Sulfur/Sulfuric Acid Market Analysis
89
Q209_01436.001.11
Table 7.9 PADD II Chemical Companies (Cont’d)
Company City StateQV Chemicals, LLC Chesterfield MODouglas Products Pkg. Liberty MOProducts Supply, Inc. Bonne Terre MOCustom Compunders, Inc. Arnold MOHydrite Chemical Co. Brookfield WICERAC, Inc., Subsidiary of Williams Advanced Materials, Inc. Milwaukee WIElectro Polish Systems, Inc. Milwaukee WIWedor Corp. West Allis WIMetalline Chemicals Corp. Mequon WIAthea Laboratories, Inc. Milwaukee WIMotomco Madison WIChemelex Div., RBP Chemical Corp. Milwaukee WIAgi-Water Treatment/Chemical Formulations Germantown WIApplied Biochemists Germantown WISigma Aldrich Chemical, Co. Milwaukee WINova Molecular Technologies Inc. Janesville WIRBP Chemical Technology, Inc. Milwaukee WIProchemicals LLC Green Bay WIWayne Consultants & Mfg., Inc. Waukesha WITetrionics, Inc. Madison WIAT Products Corp. Waukesha WIOnline Packaging, Inc. Plover WIChem-Tech International Inc. Random Lake WIWinn-Sol Products, Inc. Oshkosh WIFluka Chemical Corp. Milwaukee WIKyros Corp. Middleton WIMarschall Products Madison WISteiner Electric Co. - Multiple Locations Multiple Locations ILTRI SECT CORPORATION Schaumburg ILA-Z FACTORY SUPPLY Schiller Park ILEDC Industries, Inc. Elk Grove Village ILRydlyme: Apex Engineering Products Corp. Aurora ILElm Grove Industries, Inc. Mundelein ILSlide Products, Inc. Wheeling ILChem-Impex Wood Dale ILCastrol Industrial North America Inc. Naperville ILNuance Solutions Chicago ILVelsicol Chemical Corp. Rosemont ILDow Chemical Co. Joliet ILWei T'o Index Matteson ILAdvanced Asymmetrics Millstadt ILPICO Chemical Corp. Chicago Heights ILAtm America Corp Morton Grove ILStepan Co. Northfield ILRycoline Products, Inc. Chicago ILTru-Test Mfg. Co. Cary ILRock Valley Oil & Chemical Co. Rockford ILR.I.T.A. Corp. Woodstock ILSpartan Flame Retardants Inc. Crystal Lake ILGraham Chemical, Inc Barrington ILDow Chemical Co. Chnnahon ILDober Chemical Corp. Midlothian ILIvanhoe Industries Inc. Mundelein ILMPG Industries Joliet ILOdor Management, Inc. Barrington ILJLM Chemicals Inc. Blue Island ILCoral Corp. Waukegan ILGC Electronics, Inc. Rockford ILExpomix Wauconda ILEureka Chemical Lab, Inc. Chicago ILPaket Corp. Chicago ILAkzo Chemicals Inc. Chicago ILSunnyside Corporation Wheeling ILTechdrive Inc. Chicago ILBankmark Mount Prospect ILRho Chemical Co., Inc. Joliet IL
Starlite Technical Service Inc. Chicago IL
Searle Chemicals, Inc. Chicago IL

Section 7 Industry Profiles for PADDs I and II
U.S. Sulfur/Sulfuric Acid Market Analysis
90
Q209_01436.001.11
Table 7.9 PADD II Chemical Companies (Cont’d) Company City StatePolyenviro Labs, Inc. Mokena ILCP Inorganics Joliet ILK.C.I. Chemical Co. Matteson ILAngus Chemical Co. Buffalo Grove ILCalgene Chemical Inc. Skokie ILBasic Products Co. Chicago ILRiver Valley Coatings, Inc. Aurora ILChemrock Chemical Co. Northbrook ILWatts, J. B. Co., Inc. Chicago ILPierce Chemical Co. Rockford ILK & N Laboratories Deerfield ILMasterbond, Inc. Lake In The Hills ILAtrachem L.P. Bedford Park ILSesco Enterprises, Inc. Chicago Heights ILGeneral Chemical Corp. East St Louis ILL. Carlton Mertz Co. Chicago ILNyatex Adhesive and Chemical Company Howell MICross Chemical Detroit MIDow Chemical Co., The Midland MIArrow Chemical Products, Inc. Detroit MIDetrex Solvents & Environmental Services Div. Southfield MIDaimlerChrysler Auburn Hills MIFreiborne Industries, Inc. Pontiac MIDow Chemical Co. Midland MIPhoto-Systems Inc. Dexter MIEnergy Additives, Inc. Battle Creek MIDSC Products Inc. Muskegon MIDow Chemical Co. Ludington MIExcelda Manufacturing Co., Inc. Brighton MIDow Chemical Co. Midland MIWacker Chemical Corp. Adrian MIPeninsula Copper Industries, Inc. Hubbell MIPremiere Packaging Flint MIDetroit Chemical Supply Co. Detroit MIDow Chemical Co., The Midland MIAG Group Worldwide Inc. Clinton Twp MISun Chemical Corp. Muskegon MIWyckoff Chemical Co., Inc. South Haven MIMbi Lansing MIStandhardt Chemical Corp. Grand Rapids MIAlgoma Products Grand Rapids MIPacific Steamex Muskegon MIDow Chemical Co. Midland MIGage Products Co. Ferndale MIRutherford Chemicals, Inc Zeeland MIDow Chemical Co. Midland MIProducto Chemicals, Inc. Livonia MIVertellus Specialties, Inc. Zeeland MIHaviland Enterprises Inc. Grand Rapids MIChem-Trend Howell MIAmsa Inc Midland MIDifco Laboratories Detroit MIESCO Co., Ltd. Partnership Muskegon MISuperior Manufacturing Corp. Detroit MIEnvironmental Marketing Services Lansing MIDow Chemical Co. Bay City MIGuardsman Products, Inc., Specialty Products Div. Fremont MIQuaker Chemical Corporation Bingham Farms MIL.I.S. Manufacturing Livonia MIAmerichem, Inc. Mason MIe-Chemicals Inc. Ann Arbor MINorth American Group Flat Rock MINelsonite Chemical Products, Inc. Grand Rapids MICory Labs, Inc. Menominee MIChemical Systems Corp. Livonia MIDow Chemical Co., Materials Engineering Center Midland MI
High-Po-Chlor Inc. Romulus MI
Electro Cote Chemicals Co. Inc. Detroit MI

Section 7 Industry Profiles for PADDs I and II
U.S. Sulfur/Sulfuric Acid Market Analysis
91
Q209_01436.001.11
Table 7.9 PADD II Chemical Companies (Cont’d) Company City StateFepco Tool & Supply Noblesville INProsco, Inc. Indianapolis INCentury Chemical Corp. Elkhart INIndian Naval Stores Indianapolis INMidwest Custom Chemicals Inc. Newburgh INRed Bird, Inc. Osgood INPfau, George Sons Co., Inc. Jeffersonville INChemtura Corp. West Lafayette INReilly Industries, Inc Indianapolis INFerro Corp. Hammond INFerro Corp. Plymouth INCaypin Industries, Inc. Fort Wayne INWayne Chemical Inc. Fort Wayne INQO Chemicals Inc. West Lafayette INMason Metals Co. Schererville INRexford Rand Corp. Michigan City INGreat Lakes Products, Inc. Indianapolis INChemicals-Solvents & Lubricants, Inc Fort Wayne INGSD Technology Inc. Elkhart INAmerican Chemical Service, Inc. Griffith INChem-A-Co, Inc. Monticello INBlue Grass Chemical Specialties New Albany INChallenge Inc. Indianapolis INPalmer Bolt & Supply Co. Piqua OHAmerican Lubricants & Chemicals, LLC Marietta OHBernard Laboratories, Inc. Cincinnati OHMichelman, Inc. Cincinnati OHCognis Corp., Chemicals Group, Oleochemicals Cincinnati OHPMC Specialties Group, Inc. Cincinnati OHCognis Corp. Cincinnati OHJBS Industries Lebanon OHDow Chemical Co. Ironton OHOrchem Corp. Fairfield OHAshland Chemical Co. Columbus OHDuBois Chemicals Sharonville OHAluchem Reading OHBorden Graphics, Inc. Cincinnati OHShepherd Chemical Co., The Cincinnati OHMicrotek Laboratories Dayton OHAshland Specialty Chemical Co. Dublin OHDuBois Sharonville OHChemical Ventures Cincinnati OHOhio Valley Chemical Corp. Cincinnati OHQuaker Chemical Corporation Middletown OHCorrugated Chemicals Cincinnati OHSyrgis Covington KYH&S Chemical Co. Inc. Covington KYKenway Distributors Inc. Louisville KYAshland, Inc. Covington KYChemPharma Richmond KYAngstrom Technologies Erlanger KYAlltech Inc. Nicholasville KYDynatex Elizabethtown KYCalvert City Chemical Co. Calvert City KYThe Walter A. Wood Supply Co., Inc. Chattanooga TNCulligan of Chattanooga Chattanooga TNAquaphase, Inc. Gallatin TNEastman Chemical Co. Kingsport TNIndustrial Process Services, Inc. Knoxville TNDrexel Chemical Co. Memphis TNWater Services, Inc Knoxville TNPrecious Metals Corp. Sevierville TNColonial Chemical South Pittsburg TNAlco Chemical Chattanooga TNW.M. Barr & Co. Inc. Memphis TNBuckman Laboratories Memphis TN
Cedar Chemical Corp. Memphis TN
ETRAC Laboratories, Inc. Oak Ridge TN

Section 7 Industry Profiles for PADDs I and II
U.S. Sulfur/Sulfuric Acid Market Analysis
92
Q209_01436.001.11
Table 7.9 PADD II Chemical Companies (Cont’d) Company City StateGFS Chemicals, Inc. Powell OHPalmer Bolt & Supply Co. Piqua OHKrylon Products Group Cleveland OHJRM Chemical Cleveland OHCerCo, LLC Shreve OHVitex Corp. Cleveland OHDow Chemical Co. Findlay OHRohm & Haas Co. North Olmsted OHFerro Corp. Orrville OHApplied Specialties, Inc. Avon Lake OHLubrizol Corp., The Wickliffe OHZaclon LLC Cleveland OHChemix Corporation Berea OHSpecrete Ip, Inc Cleveland OHFerro Corp., Pigment Group Cleveland OHFerro Corp., Specialty Ceramics Div. Cleveland OHFerro Corp., Plastic Colorants Div. Stryker OHStruktol Stow OHDover Chemical Limited Dover OHFerro Corp., Porcelain Plant East Liverpool OHGE Co., GE Lighting Components & Sales Cleveland OHQuantam Technologies Inc. Akron OHO'Brien Products/Zinkan Enter., Inc. Twinsburg OHFerro Corp. Stryker OHUSB Corp. Cleveland OHFerro Corp., Electronic Materials Group, Cleveland Plant Cleveland OHEcmorris Wadsworth OHRoyal Sheen North Canton OHTaskem Brooklyn Heights OHJet Inc. Cleveland OHFlexsys America L.P. Akron OHFerro Corp., Porcelain Enamel Div. Cleveland OHFerro Corp. Cleveland OHGAC Chemical Corp. Holland OHJMP Industries, Inc. Cleveland OHTremco, Inc. Beachwood OHAkron Dispersions, Inc. Akron OHBetco Toledo OHSeaforth Mineral & Ore Co., Inc. Cleveland OHFerro Corp., Industrial Coatings Div. Cleveland OHSHH Company, Ltd Lewis Center OHExochem, Inc. Lorain OHAMRESCO, Inc. Solon OHState Chemical Ltd Cleveland OHBasic Coatings, Inc. Toledo OHCanberra Corp. Toledo OHMaxum, Inc. Akron OHWiley Organics, Inc. Coshocton OHDegussa Initiators, LLC Elyria OHTRA Coatings Corp. Cortland OHElectroplating & Fabricating Co. Cleveland OHNational Borax Corp. Cleveland OHNewton Laboratories, Inc. Toledo OHInceptor, Inc. Toledo OHCleveland Chemical Corp. Cleveland OHRyzel Corp. Bristolville OHLakewood Chemical & Supply Co. East Palestine OHSovereign Chemical Co. Cuyahoga Falls OHBond Chemicals, Inc. Medina OHAlcan Chemicals Beachwood OH

Section 7 Industry Profiles for PADDs I and II
U.S. Sulfur/Sulfuric Acid Market Analysis
93
Q209_01436.001.11
7.3.2 Sulfuric Acid Producer Profiles
Sulfuric acid producers within PADDs I and II are presented in Table 7.10.
Table 7.10 Sulfuric Acid Producers Capacity – Thousand Metric Tons
Company Location State PADD Capacity Raw MaterialValero Energy Corp Delaware City Delaware 1 190 70% SO2 in Utility off gases, 30% SludgeCF Industries Plant City Florida 1 2,400 100% Elemental; CaptiveThe Mosaic Company Bartow Florida 1 4,120 100% Elemental; CaptiveThe Mosaic Company New Wales Florida 1 3,930 100% Elemental; CaptiveThe Mosaic Company Nichols Florida 1 735 100% Elemental; mostly captiveThe Mosaic Company Riverview Florida 1 1,940 100% Elemental; mostly captivePCS Phosphate Co White Springs Florida 1 3,050 100% Elemental, Partly CaptiveTampa Electric Company Polk County Florida 1 65 SO2 and H2S in Utility off gasesGeneral Chemical Corp Augusta Georgia 1 260 100% Elemental, Partly CaptiveSouthern States Chemical Savannah Georgia 1 135 100% Elemental, 100% MerchantTronox Inc. Savannah Georgia 1 245 100% Elemental, mostly captiveGeneral Chemical Corp Newark New Jersey 1 140 100% ElementalPVS Chemicals Buffalo New York 1 110 20% Elemental, 80% SludgePCS Phosphate Co Aurora North Carolina 1 3,285 100% Elemental; CaptiveSouthern States Chemical Wilmington North Carolina 1 60 100% Elemental, Merchant
Elementis Pigments Easton Pennsylvania 1 15 Ferrous Sulfate; High Purity iron oxides as byproduct; Captive
Langeloth International Langeloth Pennsylvania 1 35 100% Molybdenum Smelter gasDuPont Richmond Virginia 1 85 100% Elemental; Partly CaptiveHoneywell International Hopewell Virginia 1 390 100% Elemental, CaptiveLucite International Belle West Virginia 1 110 100% Sludge; CaptiveWheeling Pittsburgh Steel Corp Follansbee West Virginia 1 25 100% H2S From coke oven gas, captiveBig River Zinc Sauget Illinois 2 135 100% Zinc smelter GasesPVS Chemical Solutions Chicago Illinois 2 80 100% ElementalRhodia Hammond Indiana 2 270 40% Elemental; 60% Sludge; Partially CaptiveClimax Molybdenum Co. Fort Madison Iowa 2 90 40% Molybdenum Smelter Gases; 60% ElementalPhelps Dodge Corp. Fort Madison Iowa 2 90 40% Molybdenum Smelter Gases; 60% ElementalDuPont Wurtland Kentucky 2 180 100% Elemental; Partly CaptiveThe Doe Run Company Herculaneum Missouri 2 70 100% Lead Smelter GasesAK Steel Corp Middletown Ohio 2 5 100% H2S From coke oven gasChemtrade Logistics Cairo Ohio 2 65 100% ElementalDuPont North Bend Ohio 2 160 100% ElementalMarsulex, Inc. Oregon Ohio 2 300 35% Elemental, 65% Sludge, neg H2SReliant Energy Niles Ohio 2 10 100% SO2 in utility off gasesChemtrade Refinery Services Tulsa Oklahoma 2 60 100% ElementalLucite International Memphis Tennesse 2 250 100% Sludge; CaptiveZinifex Clarksville Clarksville Tennesse 2 135 100% Zinc smelter gases, partly captive

Section 7 Industry Profiles for PADDs I and II
U.S. Sulfur/Sulfuric Acid Market Analysis
94
Q209_01436.001.11
7.4 RELAVENCE TO TENASKA
7.4.1 Sulfur
7.4.1.1 Potential Customers
A listing of potential sulfur consumers in Illinois is presented in Table 7.11, and as a map in Figure 7.1. Nexant has identified only 2 possible customers for sulfur produced at Taylorville. One is almost 200 miles away in Chicago, while the other is about 70 miles away in Sauget, just outside of St. Louis.
Table 7.11 Sulfur Consumers in Illinois Company LocationBig River Zinc SaugetPVS Chemical Solutions Chicago
Figure 7.1 Sulfur Consumers in Illinois
7.4.1.2 Potential Competition
A listing of potential competitors in Illinois is presented in Table 7.12, and as a map in Figure 7.2. All of the possible competitors are closer to the possible customers than the Taylorville plant, allowing for a potential logistical advantage over Tenaska.

Section 7 Industry Profiles for PADDs I and II
U.S. Sulfur/Sulfuric Acid Market Analysis
95
Q209_01436.001.11
Table 7.12 Potential Key Competitors Company LocationCITGO LemontConocoPhillips Wood RiverExxon Mobil JolietMarathon Petroleum RobinsonNatural Gas Pipeline Company of America St. Elmo
Figure 7.2 Potential Key Competitors
7.4.2 Sulfuric Acid
7.4.2.1 Potential Customers
A listing of potential sulfuric acid consumers in Illinois is presented in Tables 7.13 through 7.16, and is displayed on a map in Figure 7.3 below. Chemical companies are clustered near Chicago, almost 200 miles from Taylorville, while other consumers are spread throughout the state.

Section 7 Industry Profiles for PADDs I and II
U.S. Sulfur/Sulfuric Acid Market Analysis
96
Q209_01436.001.11
Table 7.13 Chemical Companies in Illinois
Company CitySteiner Electric Co. - Multiple Locations Multiple LocationsTRI SECT CORPORATION SchaumburgA-Z FACTORY SUPPLY Schiller ParkEDC Industries, Inc. Elk Grove VillageRydlyme: Apex Engineering Products Corp. AuroraElm Grove Industries, Inc. MundeleinSlide Products, Inc. WheelingChem-Impex Wood DaleCastrol Industrial North America Inc. NapervilleNuance Solutions ChicagoVelsicol Chemical Corp. RosemontDow Chemical Co. JolietWei T'o Index MattesonAdvanced Asymmetrics MillstadtPICO Chemical Corp. Chicago HeightsAtm America Corp Morton GroveStepan Co. NorthfieldRycoline Products, Inc. ChicagoTru-Test Mfg. Co. CaryRock Valley Oil & Chemical Co. RockfordR.I.T.A. Corp. WoodstockSpartan Flame Retardants Inc. Crystal LakeGraham Chemical, Inc BarringtonDow Chemical Co. ChnnahonDober Chemical Corp. MidlothianIvanhoe Industries Inc. MundeleinMPG Industries JolietOdor Management, Inc. BarringtonJLM Chemicals Inc. Blue IslandCoral Corp. WaukeganGC Electronics, Inc. RockfordExpomix WaucondaEureka Chemical Lab, Inc. ChicagoPaket Corp. ChicagoAkzo Chemicals Inc. ChicagoSunnyside Corporation WheelingTechdrive Inc. ChicagoBankmark Mount ProspectRho Chemical Co., Inc. JolietStarlite Technical Service Inc. ChicagoSearle Chemicals, Inc. Chicago

Section 7 Industry Profiles for PADDs I and II
U.S. Sulfur/Sulfuric Acid Market Analysis
97
Q209_01436.001.11
Table 7.14 Pulp and Paper Mills in Illinois
Company City
Ahlstrom Paper Group TaylorvilleAlcoa Flexible Packaging Corp. JolietAlcoa Flexible Packaging Corp. PeoriaBBP America, Inc.(BBP Celotex) QuincyCaraustar Industries, Inc. ChicagoField Container Co. L.P. PekinJohns-Manville Corp. RockdaleMadison Paper Co. AlsipSCA Tissue North America L.L.C. (Svenska Cellulose Ab) AlsipRock-Tenn Co. Aurora
Table 7.15 Integrated Steel Mills in Illinois
Company City
Interlake S. ChicagoNational Granite City
Table 7.16 Ethanol Plants in Illinois
Company City
Abengoa Bioenergy Corp. Madison
Adkins Energy, LLC* Lena
Ag Energy Resources, Inc. Benton
Archer Daniels Midland Decatur
Archer Daniels Midland Peoria
Aventine Renewable Energy, LLC Pekin
Big River Resources Galva, LLC Galva
Center Ethanol Company Sauget
Illinois River Energy, LLC Rochelle
Lincolnland Agri-Energy, LLC* Palestine
Marquis Energy, LLC Hennepin
One Earth Energy Gibson City
Patriot Renewable Fuels, LLC Annawan
Riverland Biofuels Canton

Section 7 Industry Profiles for PADDs I and II
U.S. Sulfur/Sulfuric Acid Market Analysis
98
Q209_01436.001.11
Figure 7.3 Sulfuric Acid Consumers in Illinois
Integrated Steel Mills
Chemical Companies
Ethanol Plants
Pulp and Paper Mills
Integrated Steel Mills
Chemical Companies
Ethanol Plants
Pulp and Paper Mills
7.4.2.2 Potential Competition
A listing of potential sulfuric acid producers in Illinois is presented in Table 7.17 below, and is displayed on a map in Figure 7.4 below. Illinois has only two possible competitors with regard to sulfuric acid.
Table 7.17 Sulfuric Acid Producers in Illinois
Company LocationBig River Zinc SaugetPVS Chemical Solutions Chicago
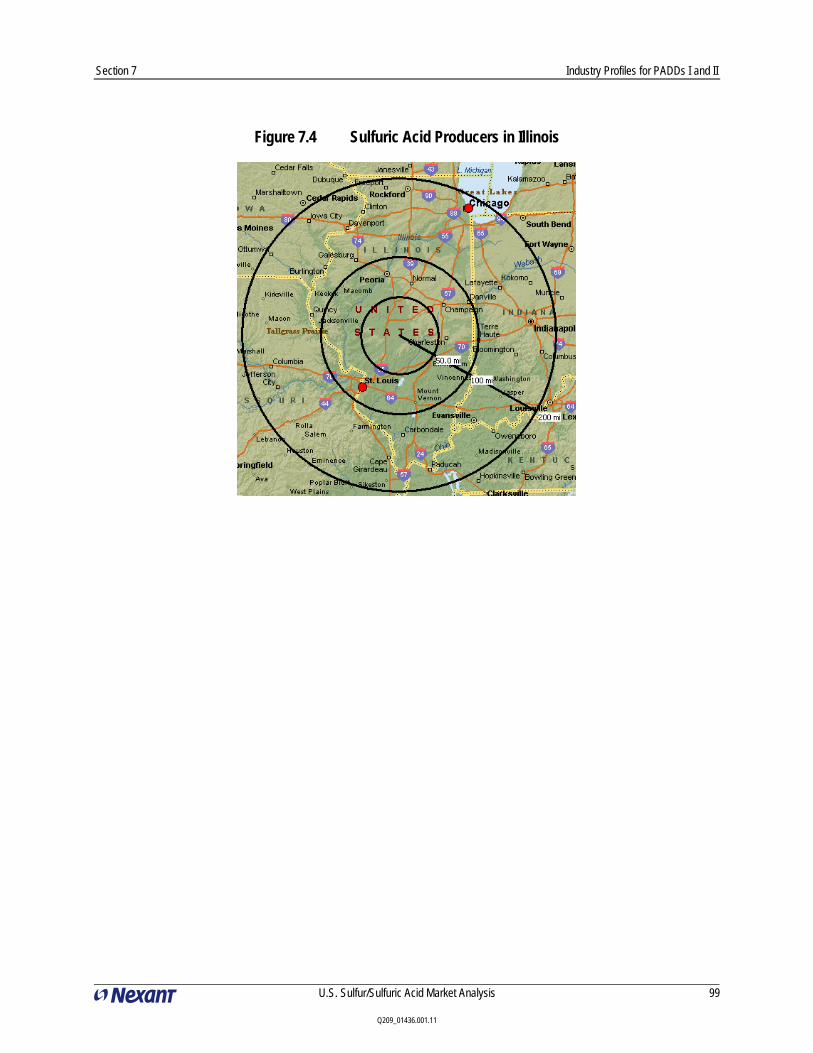
Section 7 Industry Profiles for PADDs I and II
U.S. Sulfur/Sulfuric Acid Market Analysis
99
Q209_01436.001.11
Figure 7.4 Sulfuric Acid Producers in Illinois


U.S. Sulfur/Sulfuric Acid Market Analysis
100
Section 8 Pricing
8.1 INTRODUCTION
The major price setting hub for sulfur and sulfuric acid in the United States is Tampa, Florida. Prices are set here for sulfur by negotiations between sulfur producers and the fertilizer industry. Sulfuric acid prices are set by supply and demand conditions, but sulfur price is a major component in sulfuric acid cost. Historically, both sulfur and sulfuric acid prices have been volatile, similar to most commodity industries that periodically suffer from boom and bust cycles.
8.2 MOLTEN SULFUR
There are many different price assessments in the global market for sulfur which include:
FOB Vancouver spot or contract (USD/MT)
CFR Tampa (USD/LT)
CFR China (USD/MT)
FOB Black Sea (USD/MT)
Liquid Sulfur (USD/MT)
DEL Benelux (USD/MT)
FOB Saudi/Kuwait/UAE (low-end N African contracts) (USD/MT)
CFR Mediterranean spot (USD/MT)
CFR North Africa contract (USD/MT)
CFR India (USD/MT)
FOB Iran (formed) (USD/MT)
FOB Mideast (USD/MT)
Globally, prices are usually quoted for sulfur traded in formed, crushed bulk or flaked form and in liquid (molten) form for the United States. Spot prices for China are for recovered sulfur. The major reference prices in the global sulfur market are the FOB Vancouver contract (formed sulfur), FOB Saudi/Kuwait/UAE (contract and spot), FOB Iran (spot) and FOB Black Sea (contract and spot) quotes. In the United States, market pricing is determined by the quarterly price negotiations between the sulfur producers and the phosphate fertilizer industry which are represented by the Tampa quotation.
The majority of sulfur shipped in the United States is shipped in its molten state. For large quantities of molten sulfur, rail tank cars or barges are typically used for shipment. Trucks are usually used to move small quantities of molten sulfur for consumers closer to the supplier. A key issue for suppliers is the freight cost to ship molten sulfur to a particular customer.

Section 8 Pricing
U.S. Sulfur/Sulfuric Acid Market Analysis
101
Q209_01436.001.11
The sections below discuss the historical and forecast pricing of molten sulfur at the benchmark Tampa location, along with relative freight rates to ship the product around the country and the resulting netbacks for the facility in Taylorville.
8.2.1 FOB Pricing
Global sulfur prices are typically set by low cost production in remote locations that then must be shipped to market. Thus, in addition to Tampa, Florida, FOB Vancouver sulfur pricing is a key indication of global sulfur pricing, reflecting the major quantities of sulfur produced and exported from Western Canada and the remote location of some of the region’s major production locations.
The United States Gulf Coast price for liquid sulfur compared to Vancouver’s FOB price for solid sulfur indicates that the two markets function independently much of the time. The North American market is somewhat unique in that it consumes almost entirely liquid sulfur, while the rest of the world works almost entirely with solid sulfur. United States sulfur consumers are not presently equipped to re-melt solid sulfur, so they are serviced by liquid sulfur suppliers: the United States, Western Canada, Mexico, Venezuela, and Germany. This prevents the United States from having access to most of the sulfur on the world spot market and increases the potential for volatility in the North American market.
As shown in Figure 8.1, sulfur pricing has generally been stable between 2000 and 2007, with prices in the $30-$60 per metric ton. Price volatility within this range can be primarily attributed to Canadian sulfur producers and the delicate balance they strike between oversupplying the market, achieving positive returns, and a growing sulfur inventory stockpile. In early 2008 sulfur prices increased sharply, peaking at over US$639 per ton during the third quarter of 2008. This flyup can be attributed to the general flyup in commodity prices that occurred during that period, including similar flyups in the price of crude oil, steel, commodity chemicals, etc. During the first quarter of 2009, the price of sulfur has collapsed due to the decline in crude oil prices and the global and United States economic slowdown, reaching about US$5 per ton in Vancouver. Figure 8.1 also demonstrates that prices in each of the three key markets in the United States track each other very closely.
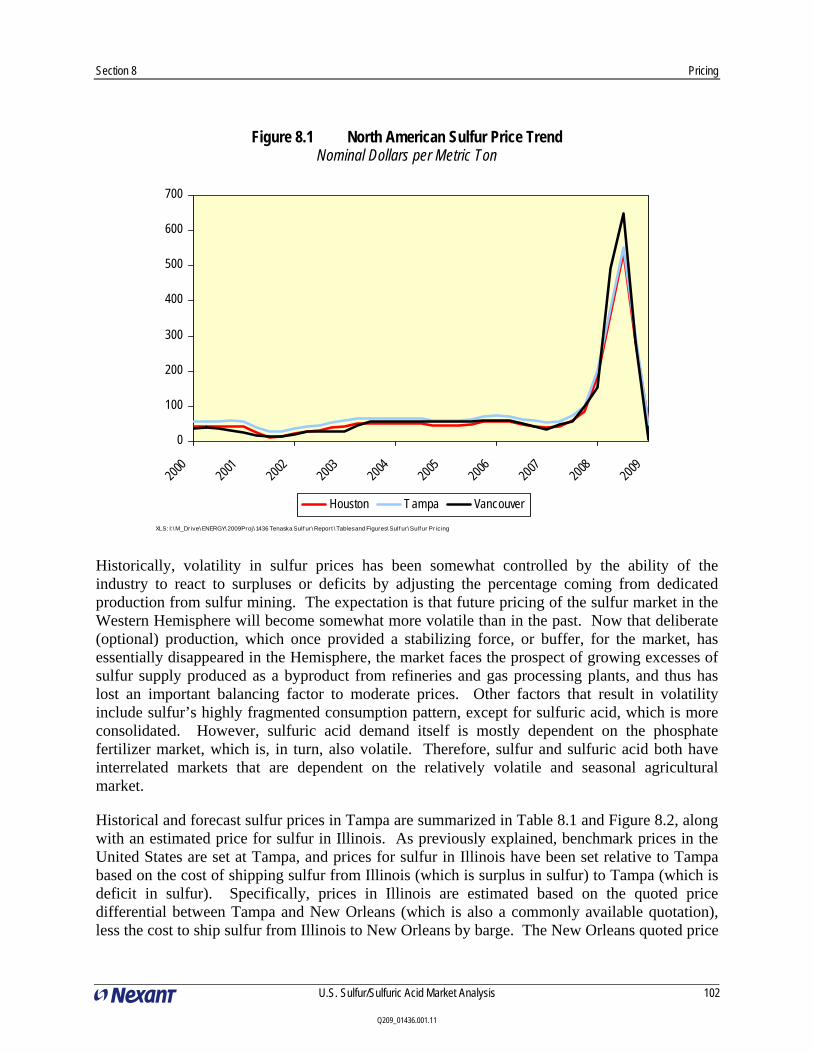
Section 8 Pricing
U.S. Sulfur/Sulfuric Acid Market Analysis
102
Q209_01436.001.11
Figure 8.1 North American Sulfur Price Trend Nominal Dollars per Metric Ton
0
100
200
300
400
500
600
700
2000
2001
2002
2003
2004
2005
2006
2007
2008
2009
Houston Tampa Vancouver
XLS: I:\ M_Drive\ ENERGY\ 2009Proj\ 1436 Tenaska Sulf ur\ Report \ Tables and Figures\ Sulf ur\ Sulf ur Pricing
Historically, volatility in sulfur prices has been somewhat controlled by the ability of the industry to react to surpluses or deficits by adjusting the percentage coming from dedicated production from sulfur mining. The expectation is that future pricing of the sulfur market in the Western Hemisphere will become somewhat more volatile than in the past. Now that deliberate (optional) production, which once provided a stabilizing force, or buffer, for the market, has essentially disappeared in the Hemisphere, the market faces the prospect of growing excesses of sulfur supply produced as a byproduct from refineries and gas processing plants, and thus has lost an important balancing factor to moderate prices. Other factors that result in volatility include sulfur’s highly fragmented consumption pattern, except for sulfuric acid, which is more consolidated. However, sulfuric acid demand itself is mostly dependent on the phosphate fertilizer market, which is, in turn, also volatile. Therefore, sulfur and sulfuric acid both have interrelated markets that are dependent on the relatively volatile and seasonal agricultural market.
Historical and forecast sulfur prices in Tampa are summarized in Table 8.1 and Figure 8.2, along with an estimated price for sulfur in Illinois. As previously explained, benchmark prices in the United States are set at Tampa, and prices for sulfur in Illinois have been set relative to Tampa based on the cost of shipping sulfur from Illinois (which is surplus in sulfur) to Tampa (which is deficit in sulfur). Specifically, prices in Illinois are estimated based on the quoted price differential between Tampa and New Orleans (which is also a commonly available quotation), less the cost to ship sulfur from Illinois to New Orleans by barge. The New Orleans quoted price

Section 8 Pricing
U.S. Sulfur/Sulfuric Acid Market Analysis
103
Q209_01436.001.11
is marginally lower than the Tampa price, reflecting the fact that PADD 3 is surplus in sulfur. Sulfur prices are forecast to increase about 3 percent annually during the forecast period.
Table 8.1 United States Sulfur Prices Nominal Dollars per Metric Ton
Actual Est. Forecast2000 2005 2006 2007 2008 2009 2010 2015 2020 2025 2030
Tampa Contract 56 64 66 71 358 50 75 119 138 160 186Illinois 46 51 55 60 330 40 65 107 125 144 167Source: Green Markets, Pike and Fisher & Nexant Estimates
Figure 8.2 United States Sulfur Prices Nominal Dollars per Metric Ton
0
50
100
150
200
250
300
350
400
450
2000 2005 2010 2015 2020 2025 2030Tampa Contract Illinois
XLS: I:\ M_Drive\ ENERGY\ 2009Proj\ 1436 Tenaska Sulf ur \ Report \ Tables and Figures\ Sulf ur \ Sulf ur Pr icing
ForecastActual
8.2.2 Freight Costs
Inventorying and the permanent storage of sulfur are used to balance supply and demand now that nearly all sulfur is produced as a byproduct. Sulfur is now stored on site in block, granular or pelletized form. It can also be stored in molten form, but very expensively, in rail tank cars because there is insufficient storage capacity to handle sulfur generation at refineries and gas processing plants. The United States Gulf Coast is one of the few places in the world where sulfur is produced, stored, and shipped in molten form. The molten sulfur is available from numerous United States refineries and is transported to Louisiana and central Florida for the production of fertilizers.
Most sulfur elsewhere in the world is formed into solid blocks for storage. The world’s current block sulfur inventories and government policies on the inventories contribute to volatility.

Section 8 Pricing
U.S. Sulfur/Sulfuric Acid Market Analysis
104
Q209_01436.001.11
Major block inventories in Western Canada and Kazakhstan, and smaller ones in Russia and Iran could potentially precipitously increase the sulfur supply.
Sulfur can be shipped as a solid in bulk or in molten form as a liquid. At room temperature, sulfur is a soft, yellow solid while molten sulfur turns a blood red color. Molten sulfur is a normally carried commodity that uses purpose built cars for transport. The main issue in transporting sulfur in its molten form is keeping its temperature at about 135°C to 145°C. Short distance shipments can be done in well insulated containers to maintain sulfur in its molten form. Sulfur has low thermal conductivity which minimizes heat loss and helps it to preserve heat so it does not solidify. A heating system is needed to keep sulfur in the liquid state over long distances.
Large quantities of the product are transported by rail. Molten sulfur needs to be heated until it becomes a liquid for it to be loaded and unloaded from a tank car. A six inch thick layer of insulation keeps the contents in the tank car from losing a large amount of heat while being shipped. Steam is passed through a series of heating coils welded to the tank envelop hidden under the tank car’s insulation and a thin metal jacket in order to heat the molten sulfur in the car during unloading.
Table 8.2 displays molten sulfur rail transportation costs from East St. Louis, Illinois to Tampa, Florida provided by CSX Transportation (St. Louis to Tampa), and Norfolk Southern (Taylorville to St. Louis) with Nexant estimates of forecast costs. The majority of molten sulfur is shipped to PADD I, more specifically to North Carolina, Florida and Georgia, the leaders in the phosphate fertilizer industry. The cost to ship the product increases as the distance between the supplier and customer grows. Therefore, the distance between suppliers and their customers is one of the most important issues when it comes for a customer to choose where their supply is coming from.
Table 8.2 Molten Sulfur Rail Rates Nominal Dollars per Metric Ton
Actual Est. Forecast2000 2005 2006 2007 2008 2009 2010 2015 2020 2025 2030
Taylorville to St. Louis (Rail) 24 27 28 29 30 30 31 34 38 43 48St. Louis to Tampa 38 43 45 46 48 48 49 55 61 68 77Taylorville to Tampa 61 71 73 75 78 78 80 89 100 111 125
Taylorville to St. Louis (Truck) 16 33 38 41 56 25 32 43 47 52 57St. Louis to Tampa 38 43 45 46 48 48 49 55 61 68 77Taylorville to Tampa 54 76 83 88 104 73 81 97 108 120 134
Source: CSX Transportation, Norfolk Southern and Nexant Estimates
To ship sulfur by ocean on barges, it can be shipped either as a solid or liquid over long distances. Solid sulfur can be transported in almost any bulk carrier if it has been thoroughly cleaned in and out. Molten sulfur is shipped in specially designed ships that are equipped with heating systems to maintain the sulfur in its liquid form. It is more feasible to ship solid sulfur over molten sulfur because molten sulfur requires special equipment in order to keep the product
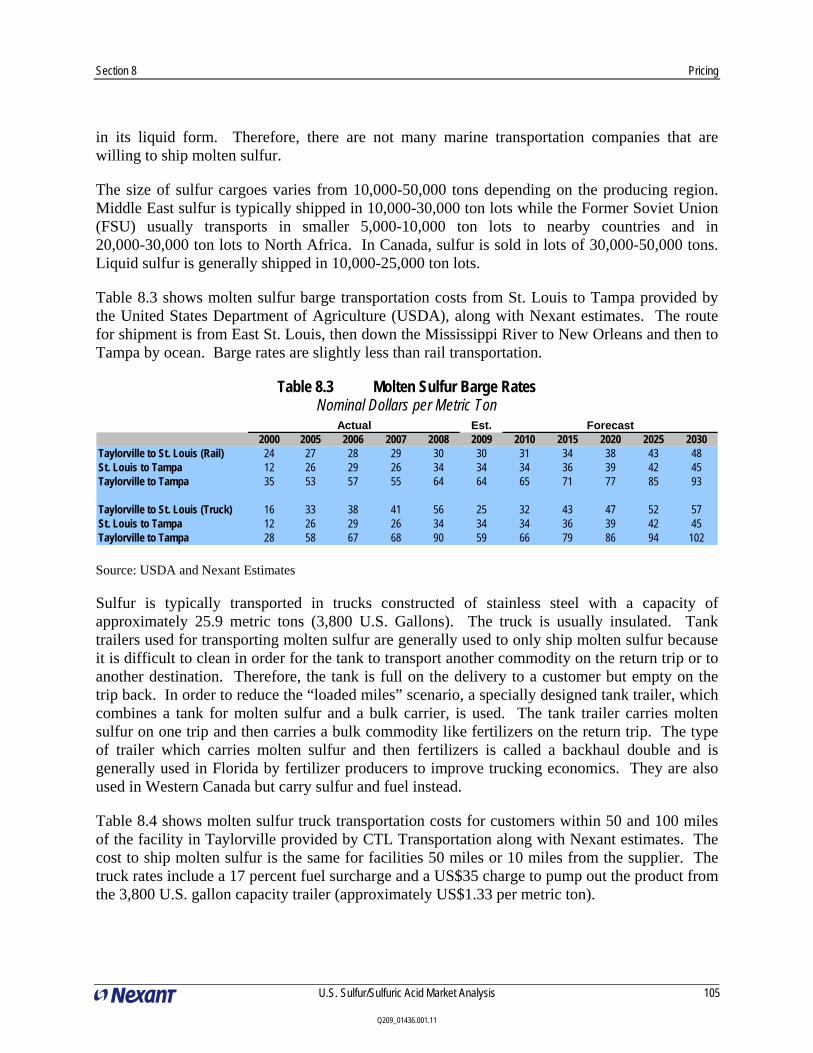
Section 8 Pricing
U.S. Sulfur/Sulfuric Acid Market Analysis
105
Q209_01436.001.11
in its liquid form. Therefore, there are not many marine transportation companies that are willing to ship molten sulfur.
The size of sulfur cargoes varies from 10,000-50,000 tons depending on the producing region. Middle East sulfur is typically shipped in 10,000-30,000 ton lots while the Former Soviet Union (FSU) usually transports in smaller 5,000-10,000 ton lots to nearby countries and in 20,000-30,000 ton lots to North Africa. In Canada, sulfur is sold in lots of 30,000-50,000 tons. Liquid sulfur is generally shipped in 10,000-25,000 ton lots.
Table 8.3 shows molten sulfur barge transportation costs from St. Louis to Tampa provided by the United States Department of Agriculture (USDA), along with Nexant estimates. The route for shipment is from East St. Louis, then down the Mississippi River to New Orleans and then to Tampa by ocean. Barge rates are slightly less than rail transportation.
Table 8.3 Molten Sulfur Barge Rates Nominal Dollars per Metric Ton
Actual Est. Forecast2000 2005 2006 2007 2008 2009 2010 2015 2020 2025 2030
Taylorville to St. Louis (Rail) 24 27 28 29 30 30 31 34 38 43 48St. Louis to Tampa 12 26 29 26 34 34 34 36 39 42 45Taylorville to Tampa 35 53 57 55 64 64 65 71 77 85 93
Taylorville to St. Louis (Truck) 16 33 38 41 56 25 32 43 47 52 57St. Louis to Tampa 12 26 29 26 34 34 34 36 39 42 45Taylorville to Tampa 28 58 67 68 90 59 66 79 86 94 102
Source: USDA and Nexant Estimates
Sulfur is typically transported in trucks constructed of stainless steel with a capacity of approximately 25.9 metric tons (3,800 U.S. Gallons). The truck is usually insulated. Tank trailers used for transporting molten sulfur are generally used to only ship molten sulfur because it is difficult to clean in order for the tank to transport another commodity on the return trip or to another destination. Therefore, the tank is full on the delivery to a customer but empty on the trip back. In order to reduce the “loaded miles” scenario, a specially designed tank trailer, which combines a tank for molten sulfur and a bulk carrier, is used. The tank trailer carries molten sulfur on one trip and then carries a bulk commodity like fertilizers on the return trip. The type of trailer which carries molten sulfur and then fertilizers is called a backhaul double and is generally used in Florida by fertilizer producers to improve trucking economics. They are also used in Western Canada but carry sulfur and fuel instead.
Table 8.4 shows molten sulfur truck transportation costs for customers within 50 and 100 miles of the facility in Taylorville provided by CTL Transportation along with Nexant estimates. The cost to ship molten sulfur is the same for facilities 50 miles or 10 miles from the supplier. The truck rates include a 17 percent fuel surcharge and a US$35 charge to pump out the product from the 3,800 U.S. gallon capacity trailer (approximately US$1.33 per metric ton).

Section 8 Pricing
U.S. Sulfur/Sulfuric Acid Market Analysis
106
Q209_01436.001.11
Table 8.4 Molten Sulfur Truck Rates Nominal Dollars per Metric Ton
Actual Est. Forecast2000 2005 2006 2007 2008 2009 2010 2015 2020 2025 2030
50 miles 13 26 30 32 44 20 25 33 37 40 45100 miles 16 33 38 41 56 25 32 43 47 52 57
Source: CTL Transportation, LLC and Nexant Estimates

Section 8 Pricing
U.S. Sulfur/Sulfuric Acid Market Analysis
107
Q209_01436.001.11
8.2.3 Netback to Taylorville
The current sulfur netback to Taylorville is approximately $16 per metric ton, about $16 per metric ton lower than the sulfur price in Tampa, based on sulfur transportation costs by barge. If the sulfur were shipped by rail, the current sulfur netback to Taylorville would be about $2 per metric ton. For facilities within 100 miles of Taylorville, the current sulfur netback is approximately $14 per metric ton, compared to the $20 per metric ton netback obtained for a customer within 50 miles.
Nexant’s historical and forecast sulfur prices in Tampa and Illinois with netbacks to Taylorville are presented in Figure 8.3 and Table 8.5 for each of the transportation scenarios. The netbacks are slightly different for each scenario, reflecting different fuel surcharge rates for the rail transportation costs and tariffs for the barge transportation costs. For transport between St. Louis and Taylorville, two options were considered, namely rail and truck transport. Rail was the method of transport used in the netback model as it is lower cost, for most of the forecast period.
Figure 8.3 Taylorville Sulfur Netbacks Nominal Dollars per Metric Ton
-50
0
50
100
150
200
250
300
350
2000 2005 2006 2007 2008 2009 2010 2015 2020 2025 2030
Tampa Barge Netback Tampa Rail NetbackIllinois Truck Netback (50 miles) Illinois Truck Netback (100 miles)
XLS: I:\ M_Drive\ ENERGY\ 2009Proj\ 1436 Tenaska Sulf ur\ Report \ Tables and Figures\ Sulf ur\ Sulf ur Pr icing

Section 8 Pricing
U.S. Sulfur/Sulfuric Acid Market Analysis
108
Q209_01436.001.11
Table 8.5 Taylorville Sulfur Netbacks Values Nominal Dollars per Metric Ton
Actual Est. Forecast2000 2005 2006 2007 2008 2009 2010 2015 2020 2025 2030
Tampa Contract Price 56 64 66 71 358 50 75 119 138 160 186Barge Costs, Rail to St. Louis 35 53 57 55 64 64 65 71 77 85 93Sulfur Netback, Taylorville 21 11 9 16 294 -14 10 49 61 75 92
Tampa Contract Price 56 64 66 71 358 50 75 119 138 160 186Rail Costs, Rail to St. Louis 61 71 73 75 78 78 80 89 100 111 125Sulfur Netback, Taylorville -5 -7 -7 -4 280 -28 -5 30 39 49 61
Illinois Price - 50 miles 46 51 55 60 330 40 65 107 125 144 167Truck Costs 13 26 30 32 44 20 25 33 37 40 45Sulfur Netback, Taylorville 33 25 26 28 286 20 39 74 88 104 123
Illinois Price - 100 miles 46 51 55 60 330 40 65 107 125 144 167Truck Costs 16 33 38 41 56 25 32 43 47 52 57Sulfur Netback, Taylorville 30 18 17 19 274 14 32 65 77 93 110
8.3 SULFURIC ACID
The price of sulfuric acid is tied in large part to the supply and price of sulfur. When sulfur is in short supply, the price of sulfur and in turn sulfuric acid increases. Tampa spot prices, taken over time, for sulfur and sulfuric acid are used as representative of transactions by large buyers and sellers, namely the fertilizer producers. Nexant profiles industry production economies by employing the concept of Leader and Laggard cash cost of production. The Leader plant is a modern double absorption sulfuric acid plant which can take full credit from production of byproduct steam. A Laggard plant is an older single absorption facility which is unable to use any portion of the steam byproduct credit. A Laggard plant typically represents the highest cost component of the industry, and thus can be seen as the marginal source of supply, whereas a Leader plant is more indicative of the economics of a new acid producer. Tampa sulfuric acid prices have generally been set by Laggard production economics, except for 2000/2001 when overcapacity and intense competition drove down prices to approach Leader production economics. The link between sulfur prices and sulfuric acid prices in Tampa is presented in Figure 8.4.

Section 8 Pricing
U.S. Sulfur/Sulfuric Acid Market Analysis
109
Q209_01436.001.11
Figure 8.4 Tampa Historical Sulfuric Acid Price Setting Mechanism
0
50
100
150
200
250
300
350
400
1996 1997 1998 1999 2000 2001 2002 2003 2004 2005 2006 2007 2008 2009Sulfuric Acid, Tampa Sulfur, Tampa Nexant Laggard Nexant Leader
$/m
etric
ton
XLS: C:\ Document s and Set t ings\ sslome\ Local Set t ings\ Temporary Int ernet Files\ OLK8\ sulf uric acid pr ice
In the United States, sulfur market pricing is determined by the quarterly price negotiations between sulfur producers and the phosphate fertilizer industry, which in turn is one factor in determining the price of sulfuric acid.
It should be noted that demand for sulfuric acid is also a key price-setting factor that may drive the price independently of the price of sulfur. One example of this is the sulfuric acid oversupply in 2000/2001 that caused a price drop.
The sections below discuss the historical and forecast pricing of sulfuric acid, along with relative freight rates to ship the product around the country and the netbacks for the facility at Taylorville.
8.3.1 FOB Pricing
Due to undersupply in PADD II and an oversupply in PADD I, Midwest sulfuric acid prices tend to be at a premium to Tampa sulfuric acid prices.
As shown in Figure 8.4, sulfuric acid pricing, outside of the recent flyup period, has been somewhat volatile through the historical period. The price volatility can be primarily attributed to Canadian sulfur producers and the delicate balance they struck between oversupplying the market, achieving positive returns, and a growing sulfur inventory stockpile. As stated previously, sulfuric acid prices are closely tied to sulfur prices, so price volatility in sulfur generates price volatility in the sulfuric acid market. In early 2008, sulfur and sulfuric acid prices sharply increased, reaching record levels in the third quarter of 2008. During the first

Section 8 Pricing
U.S. Sulfur/Sulfuric Acid Market Analysis
110
Q209_01436.001.11
quarter of 2009, the prices have fallen significantly due to the decline in crude oil prices and the global economic crisis.
As discussed above, Nexant has forecast Tampa sulfuric acid prices at Laggard cash costs of production. Figure 8.5 and Table 8.6 present the United States sulfuric acid price forecast for Tampa and the U.S. Midwest.
Figure 8.5 US Sulfuric Acid Price Forecast
0
50
100
150
200
250
300
350
400
1996 1999 2002 2005 2008 2011 2014 2017 2020 2023 2026 2029Sulfuric Acid, Tampa Spot Sulfuric Acid, Midwest Spot
XLS: C:\ Document s and Set t ings\ sslome\ Local Set t ings\ Temporary Int ernet Files\ OLK8\ sulf uric acid pr ice working12109
Actual Forecast
Table 8.6 United States Sulfuric Acid Price Forecast
Nominal Dollars per Metric Ton Actual Est. Forecast
2000 2005 2006 2007 2008 2009 2010 2015 2020 2025 2030Sulfuric Acid, Tampa Spot 22 53 52 61 329 25 50 91 106 123 142Sulfuric Acid, Illinois Spot 40 59 59 67 346 38 63 105 122 141 164
8.3.2 Freight Costs
Sulfuric acid is typically transported by rail or barge. Rail costs from St. Louis to New Orleans are currently around $50 per ton, and costs from St. Louis to Tampa are in the range of $60 per ton. Barge costs for shipments from St. Louis to New Orleans are around $50-60/ton, with costs of further barging to Tampa from New Orleans in the range of $30/ton. This barge route is generally not done, PADD II (the Midwest) is an importing region, while PADD I (the East Coast) is an exporting region. Additionally if large quantities were to be shipped consistently, Nexant believes that economies of scale may be achieved with freight companies. Rail and barge rates to Tampa from Taylorville over the forecast period are given in Table 8.8 and 8.9.. Costs for shipping sulfuric acid by truck for distances within 50, and 100 miles are presented in

Section 8 Pricing
U.S. Sulfur/Sulfuric Acid Market Analysis
111
Q209_01436.001.11
Table 8.7 below. Rates are based upon fully loaded trucks of 45,000 lbs per load, using 2009 as the base year for the forecast, with a 17 percent fuel surcharge and a $35 per truck pumping fee. Changes in future truck shipping rates are tied to changes in Nexant’s forecast price for diesel fuel, which is the major variable cost of shipping by truck.
Table 8.7 Sulfuric Acid Trucking Rates from Taylorville Nominal Dollars per Metric Ton
EstUnits 2000 2005 2008 2009 2010 2015 2020 2025 2030
50 Miles $/MT 14 29 49 22 28 37 41 45 50100 Miles $/MT 18 36 62 28 36 47 52 57 63
Actual Forecast
Source: CTL Transportation, LLC and Nexant Estimates
Table 8.8 Sulfuric Acid Rail Rates from Taylorville Nominal Dollars per Metric Ton
Actual Est. ForecastUnits 2000 2005 2008 2009 2010 2015 2020 2025 2030
Taylorville to St. Louis (Rail) $/MT 24 27 30 30 31 34 38 43 48St. Louis to Tampa $/MT 28 44 49 50 50 53 57 62 67Taylorville to Tampa $/MT 52 72 80 80 81 88 96 105 115
Taylorville to St. Louis (Truck) $/MT 18 36 62 28 36 47 52 57 63St. Louis To Tampa $/MT 28 44 49 50 50 53 57 62 67Taylorville to Tampa $/MT 46 81 112 78 86 100 109 119 130
Source: CSX, Norfolk Southern, CTL Transportation and Nexant Estimates
Table 8.9 Sulfuric Acid Barge Rates from Taylorville Nominal Dollars per Metric Ton
Actual Est. ForecastUnits 2000 2005 2008 2009 2010 2015 2020 2025 2030
Taylorville to St. Louis (Rail) $/MT 24 27 30 30 31 34 38 43 48St. Louis to Tampa $/MT 45 71 79 80 80 85 92 99 107Taylorville to Tampa $/MT 69 98 109 110 111 120 130 142 155
Taylorville to St. Louis (Truck) $/MT 18 36 62 28 36 47 52 57 63St. Louis To Tampa $/MT 45 71 79 80 80 85 92 99 107Taylorville to Tampa $/MT 63 107 141 108 116 132 144 156 170 Source: Kirby, CTL Transportation, Norfolk Southern , and Nexant Estimates
8.3.3 Netback to Taylorville
Netback values for sulfuric acid to Taylorville, based on shipping by barge, rail and truck are presented in Figure 8.6 and Table 8.10. As barge and rail to Tampa from Taylorville must be sent via St. Louis, two options were considered for transport between Taylorville and St. Louis,

Section 8 Pricing
U.S. Sulfur/Sulfuric Acid Market Analysis
112
Q209_01436.001.11
namely rail and truck. Rail rates were approximately $30/ton, which is more costly than the trucking option, which is what is shown in the netbacks. Barge netbacks to Taylorville are negative in most of the forecast period. The historical period, due to wild price fluctuations has both the highest and lowest netbacks. These netbacks also show that there is a cost advantage in shipping sulfuric acid by rail as opposed to barge, in the range of around $15 per ton. Trucking within 100 miles offers a greater netback to Taylorville than either barge or rail, throughout the entire time range of interest.
Figure 8.6 Taylorville Sulfuric Acid Netback Values Nominal Dollars per Metric Ton
-150
-100
-50
0
50
100
150
200
250
300
2000 2005 2008 2009 2010 2015 2020 2025 2030
Tampa Rail Netback Tampa Barge Netback
Illinois Truck Netback- 50 Miles or Less Illinois Truck Netback- 100 Miles
$/M
T
XLS: I:\ M_Drive\ ENERGY\ 2009Proj\ 1436 Tenaska Sulf ur \ Report \ Tables and Figures\ Sulf uric Acid\ sulf uric acid pr ice

Section 8 Pricing
U.S. Sulfur/Sulfuric Acid Market Analysis
113
Q209_01436.001.11
Table 8.10 Taylorville Sulfuric Acid Netback Values Nominal Dollars per Metric Ton
Actual Est. ForecastUnits 2000 2005 2008 2009 2010 2015 2020 2025 2030
Tampa Price $/MT 22 53 329 25 50 91 106 123 142Rail Costs, Rail to St. Louis $/MT 52 72 80 80 81 88 96 105 115Sulfuric Acid Netback to Taylorville $/MT -30 -19 249 -55 -31 4 10 18 27
Tampa Price $/MT 22 53 329 25 50 91 106 123 142Barge Costs, Rail to St. Louis $/MT 69 98 109 110 111 120 130 142 155Sulfuric Acid Netback to Taylorville $/MT -47 -45 220 -85 -61 -28 -25 -19 -13
Illinois Price $/MT 40 59 346 38 63 105 122 141 164Trucking Costs $/MT 14 29 49 22 28 37 41 45 50Sulfuric Acid Netback - 50 Miles $/MT 25 30 297 16 34 68 81 96 114
Illinois Price $/MT 40 59 346 38 63 105 122 141 164Trucking Costs $/MT 18 36 62 28 36 47 52 57 63Sulfuric Acid Netback - 100 Miles $/MT 22 22 284 10 27 58 70 84 101
8.4 CONCLUSIONS
The following is a summary of conclusions regarding pricing for sulfur and sulfuric acid.
8.4.1 Sulfur
In addition to Tampa, Florida, FOB Vancouver sulfur pricing is a key indication of global sulfur pricing, reflecting the major quantities of sulfur produced and exported from Western Canada and the remote location of some of the region’s major production locations.
Sulfur pricing has generally been stable between 2000 and 2007, with prices in the $30 to $60 per metric ton, however, sulfur price peaked at over US$639 per ton in the third quarter of 2008 due to a flyup in commodity prices
During the first quarter of 2009, the price of sulfur has collapsed due to the decline in crude oil prices and the global and United States economic slowdown, reaching about US$5 per ton in Vancouver
Sulfur can be transported by barge or rail over long distances and by truck for short distances
The current sulfur netback to Taylorville is negative byt approximately $14 per metric ton, about $64 per metric ton lower than the sulfur price in Tampa, based on sulfur transportation costs by barge
The current sulfur netback to Taylorville if shipment were by rail would be negative by about $28 per metric ton.
Based on truck transportation, for facilities within 100 miles of Taylorville, the current sulfur netback is approximately $14 per metric ton, compared to the $20 per metric ton netback obtained for a customer within 50 miles
Section 8 Pricing
U.S. Sulfur/Sulfuric Acid Market Analysis
114
Q209_01436.001.11
8.4.2 Sulfuric Acid
Tampa, Florida sulfuric acid pricing is a key factor for sulfuric acid pricing in the United States
Sulfuric acid prices are tied closely to sulfur prices and Tampa prices are projected to be at Laggard cash costs.
During the first quarter of 2009, the price of sulfuric acid has collapsed due to the decline in sulfur prices, driven by crude oil prices and the global and United States economic slowdown
Sulfuric acid can be transported by barge or rail over long distances and by truck for short distances
The current sulfuric acid netback to Taylorville is currently negative for barge and rail; while remaining negative for barge shipments, rail shipments will become slightly positive reaching $4 per ton by 2015, and $28 per ton by 2030
The capital cost for a 660-715 STPD sulfuric acid plant is roughly 25 million dollars in 2009 dollars


U.S. Sulfur/Sulfuric Acid Market Analysis
115
Section 9 Relative Attractiveness of Sulfur Versus Sulfuric Acid
Tenaska wants to decide whether to recover sulfur or convert the recovered sulfur into sulfuric acid. From a market standpoint, both products have large markets. Nexant concludes that sulfuric acid potentially offers a higher netback than sulfur. This is due to the fact that PADD II is a net importer of acid, but a net exporter of sulfur. Therefore, the netbacks on acid sales will likely be closer to those assuming sales in Illinois presented above, say $30 to $114 per metric ton over the forecast period, but sulfur netbacks may be closer to those assuming sales to Tampa, say $10 to $90 per metric ton.
However, the marketing of sulfuric acid is complicated due to the highly fragmented nature of the market. Tenaska would need to retain an experienced sulfuric acid marketer to perform this task. There are several potential marketers in PADD II, including Chemtrade Logistics and PVS Sulfur Solutions, who also have a national and international sulfuric acid business position. Nexant believes a choice between selling sulfur and sulfuric acid can only be made after negotiating a sulfuric acid marketing agreement. Nexant has had some initial discussions with Chemtrade Logistics and they suggested potential interest in providing the capital for building the sulfuric acid plant.
The capital cost for a 660-715 STPD sulfuric acid plant is roughly 25 million dollars in 2009 dollars.