expanding the impact of hepatitis b vaccines · expanding the impact of hepatitis b vaccines ......
TRANSCRIPT

Expanding the impact of hepatitis B vaccines
Optimising schedules & delivery strategies
Fernando de la Hoz –Restrepo MD, MSc, PhD
Universidad Nacional de Colombia
SAGE meeting, October 20, 2016

Vaccination coverage with HepB3 in infants, 2015
Source: WHO/UNICEF coverage estimates 2015 revision. July 2016. Map production:
Immunization Vaccines and Biologicals, (IVB). World Health Organization. 194 WHO
Member States. Date of slide: 20 July 201 6
The boundaries and names shown and the designations used on this map do not imply the expression of any opinion
whatsoever on the part of the World Health Organization concerning the legal status of any country, territory, city or
area or of its authorities, or concerning the delimitation of its frontiers or boundaries. Dotted lines on maps represent
approximate border lines for which there may not yet be full agreement. © WHO 2016. All rights reserved
<50% (6 countries or 3%) 50-79% (30 countries or 16%) 80-89% (35 countries or 18%) >=90% (114 countries or 59%)
Not available / HepB not introduced or no coverage data available (9 countries or 5)%)
Not applicable
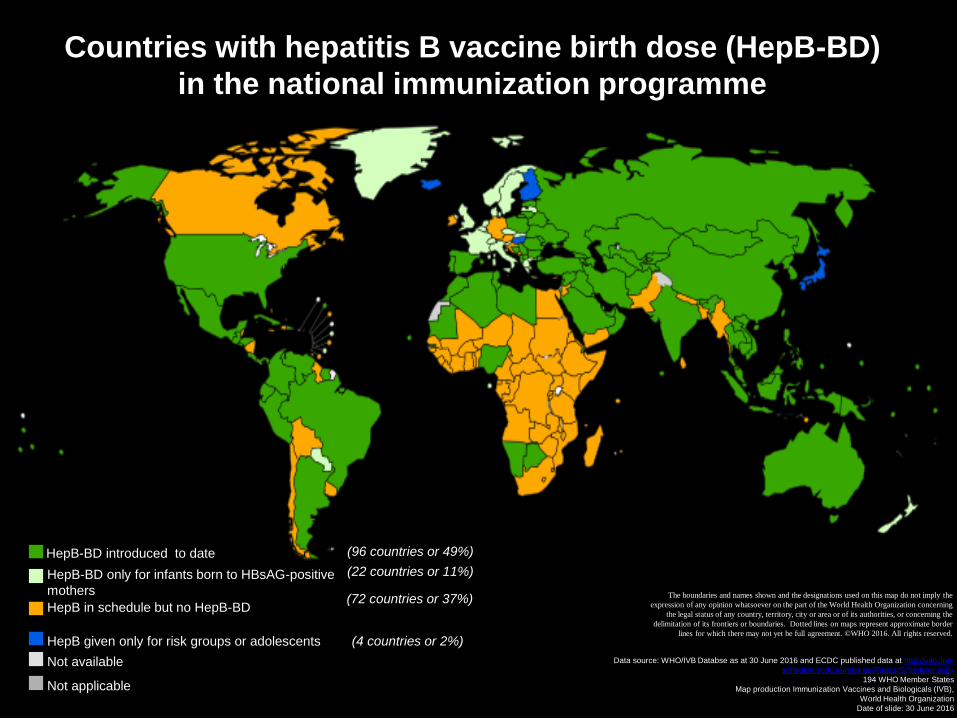
Countries with hepatitis B vaccine birth dose (HepB-BD)
in the national immunization programme
The boundaries and names shown and the designations used on this map do not imply the
expression of any opinion whatsoever on the part of the World Health Organization concerning
the legal status of any country, territory, city or area or of its authorities, or concerning the
delimitation of its frontiers or boundaries. Dotted lines on maps represent approximate border
lines for which there may not yet be full agreement. ©WHO 2016. All rights reserved.
Data source: WHO/IVB Databse as at 30 June 2016 and ECDC published data at http://vaccine-
schedule.ecdc.europa.eu/Pages/Scheduler.aspx
194 WHO Member States
Map production Immunization Vaccines and Biologicals (IVB),
World Health Organization
Date of slide: 30 June 2016
(96 countries or 49%)
HepB-BD only for infants born to HBsAG-positive
mothers
(22 countries or 11%)
HepB given only for risk groups or adolescents (4 countries or 2%)
HepB in schedule but no HepB-BD
Not available
Not applicable
(72 countries or 37%)
HepB-BD introduced to date

Typical serological course of acute hepatitis B virus (HBV) infection with progression to chronic HBV infection
Serological marker Interpretation HBsAg Total
anti-HBC IgM anti-HBC
Anti-HBs
- - - - Never infected No vaccinated
+ + - - Chronic infection
+ + + - Acute infection
- + - + Recovered from infection; immune
- - - + Immune (vaccine or natural)
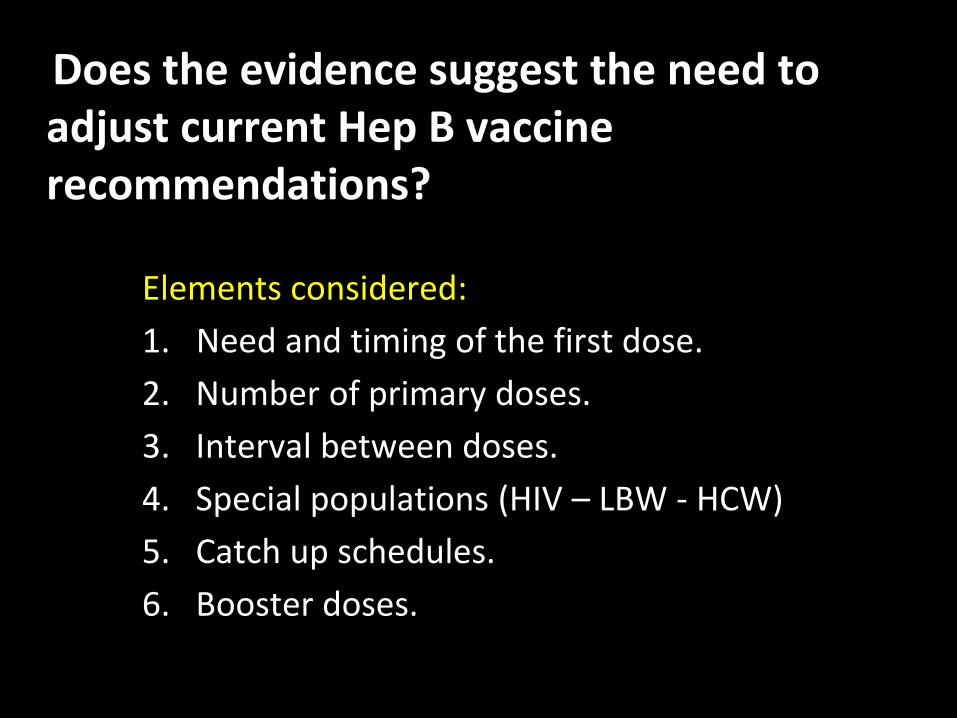
Does the evidence suggest the need to adjust current Hep B vaccine recommendations?
Elements considered:
1. Need and timing of the first dose.
2. Number of primary doses.
3. Interval between doses.
4. Special populations (HIV – LBW - HCW)
5. Catch up schedules.
6. Booster doses.
Does the emerging evidence suggest the need to adjust current HBV vaccine recommendation?
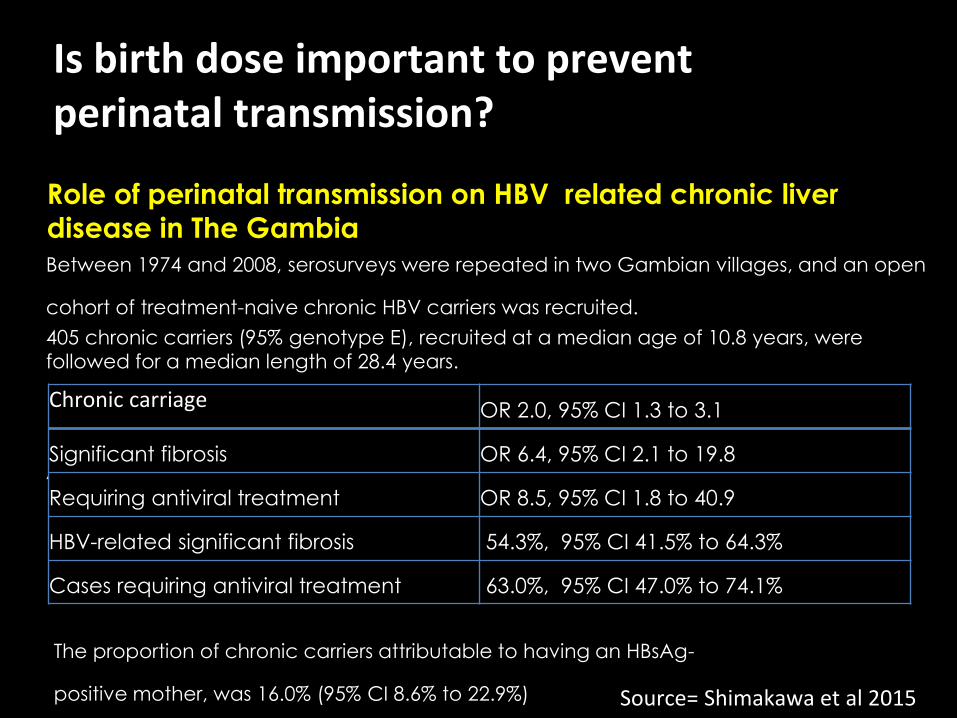
Role of perinatal transmission on HBV related chronic liver
disease in The Gambia
Is birth dose important to prevent perinatal transmission?
Source= Shimakawa et al 2015
Between 1974 and 2008, serosurveys were repeated in two Gambian villages, and an open
cohort of treatment-naive chronic HBV carriers was recruited.
405 chronic carriers (95% genotype E), recruited at a median age of 10.8 years, were
followed for a median length of 28.4 years.
After controlling for age and sex, having an HBsAg-positive mother was associated with:
Chronic carriage OR 2.0, 95% CI 1.3 to 3.1
Significant fibrosis OR 6.4, 95% CI 2.1 to 19.8
Requiring antiviral treatment OR 8.5, 95% CI 1.8 to 40.9
HBV-related significant fibrosis 54.3%, 95% CI 41.5% to 64.3%
Cases requiring antiviral treatment 63.0%, 95% CI 47.0% to 74.1%
The proportion of chronic carriers attributable to having an HBsAg-
positive mother, was 16.0% (95% CI 8.6% to 22.9%)

Does the emerging evidence suggest the need to adjust current HBV cine recommendation?
Studies comparing birth dose vs no birth dose
Protection against HBsAg carriage - Plasma vaccine One RCT (Wong, 1984) compared birth dose (1 hr after birth) vs no birth dose (and no HBIG).
VE of birth dose alone =71%
Another RCT (Grosheidi, 1993) compared birth dose (0-3 days) vs no birth dose. All received HBIG.
No difference with a RR =1.0
Other RCT (Beasley 1983) compared birth dose (0-15 days) vs no birth dose. All
received HBIG.
No difference with a RR=1.4 (0.3-5.7)
How protective is a birth dose against HBsAg carriage?
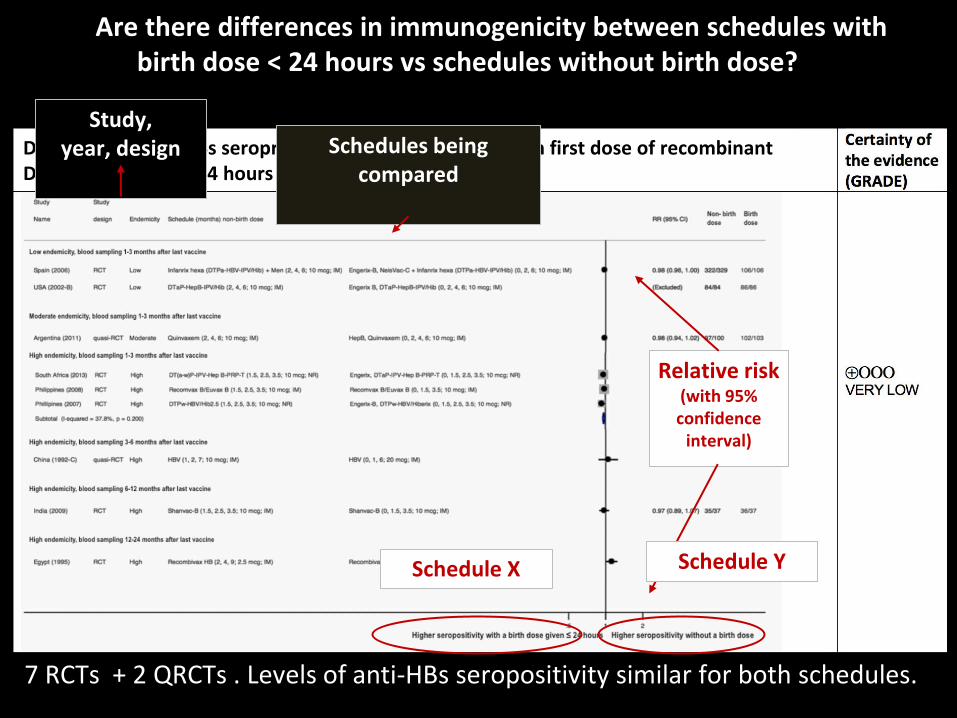
Difference in anti-HBs seroprotection proportions between first dose of recombinant DNA HBV given at ≤24 hours vs. no birth dose
the emerging evidence suggest the need to adjust current HBV vaccine recommendation?
7 RCTs + 2 QRCTs . Levels of anti-HBs seropositivity similar for both schedules.
Are there differences in immunogenicity between schedules with birth dose < 24 hours vs schedules without birth dose?
Study, year, design
Relative risk (with 95% confidence
interval)
Schedule X Schedule Y
Schedules being compared
No difference in seroprotection rates between schedules .
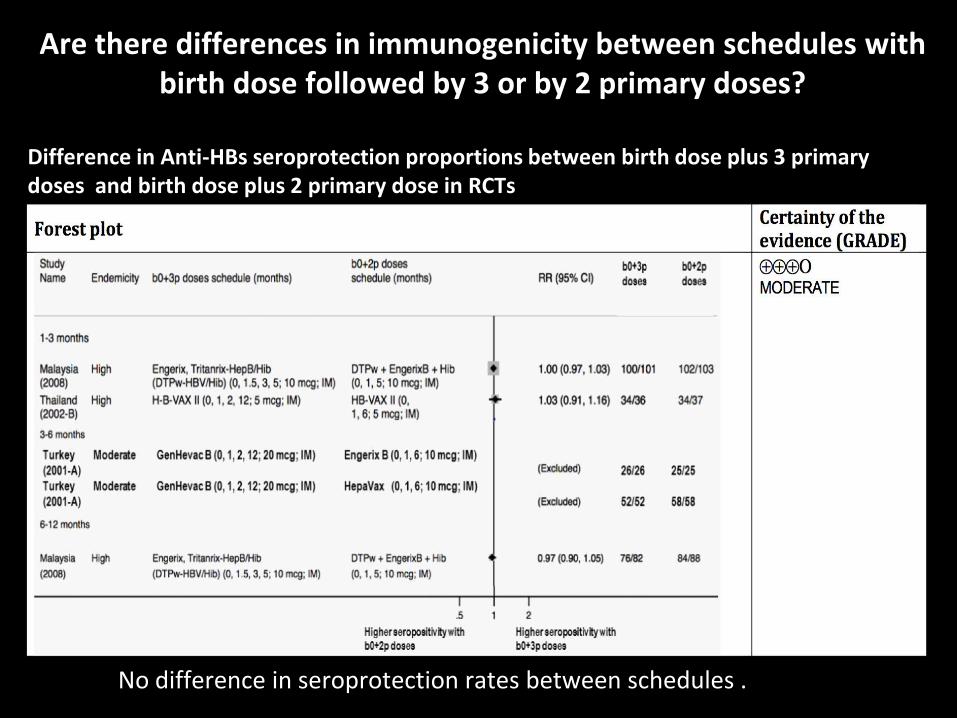
Difference in Anti-HBs seroprotection proportions between birth dose plus 3 primary doses and birth dose plus 2 primary dose in RCTs
Are there differences in immunogenicity between schedules with birth dose followed by 3 or by 2 primary doses?
No difference in seroprotection rates between schedules .
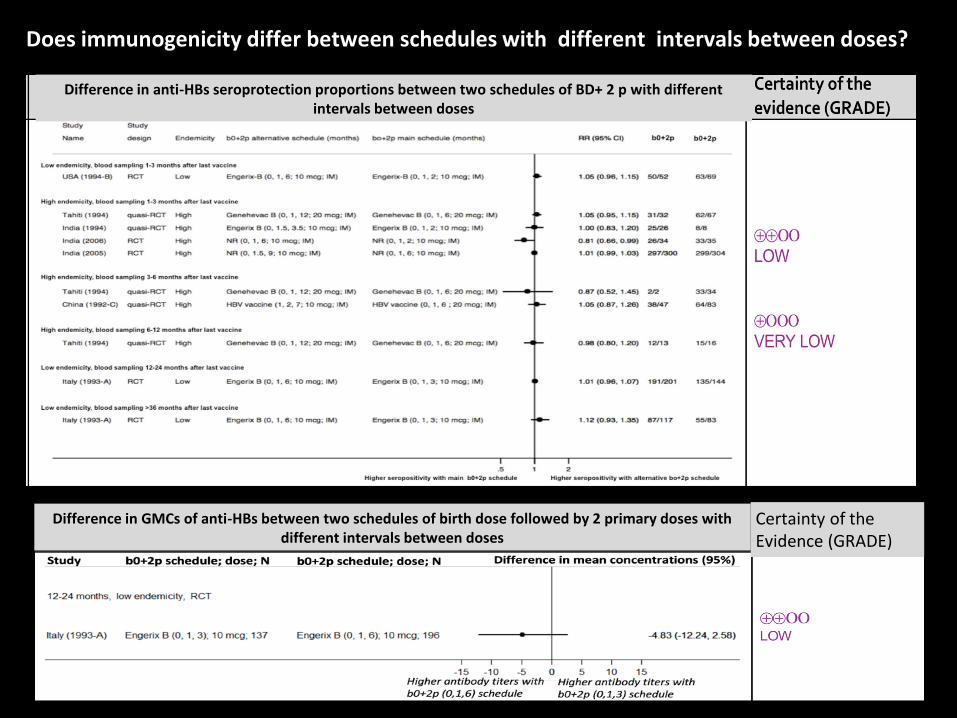
Does immunogenicity differ between schedules with different intervals between doses?
Difference in GMCs of anti-HBs between two schedules of birth dose followed by 2 primary doses with different intervals between doses
Certainty of the Evidence (GRADE)
Difference in anti-HBs seroprotection proportions between two schedules of BD+ 2 p with different intervals between doses
Summary on effect of birth dose, number of primary doses and intervals between doses
Infants who are infected perinatally had a much higher risk of liver disease. Protection against HBsAg carriage Anti –HBs seroprotection
There is no difference in schedules using a birth dose followed by 2 or 3 primary doses HBsAg seroprevalence GMCs
There is no difference in schedules with intervals of 1, 2 or 5 months between primary doses Anti –HBs seroprotection Mean concentrations

Do HIV positive people may benefit from additional doses or higher dosage of HBV vaccine? Effect of 3 injections with a double dose (3 doses of 40 µg) of recombinant HBV
vaccine vs standard dose (3 doses of 20 µg doses)
Source: Wakefield 2014
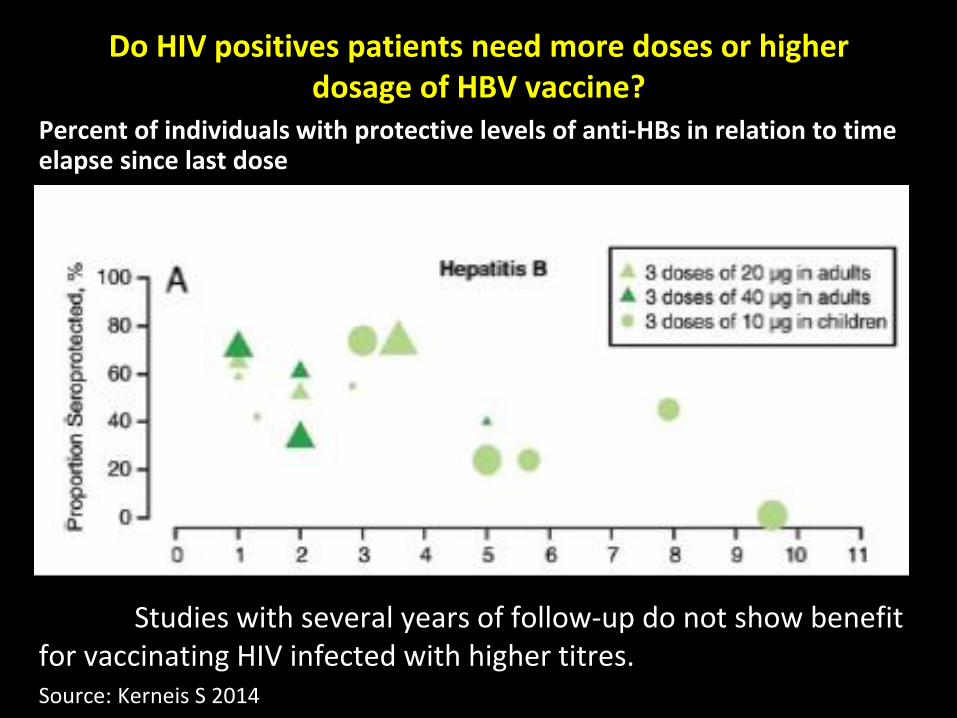
Do HIV positives patients need more doses or higher dosage of HBV vaccine?
Studies with several years of follow-up do not show benefit for vaccinating HIV infected with higher titres.
Percent of individuals with protective levels of anti-HBs in relation to time elapse since last dose
Source: Kerneis S 2014

Does recommendation for Hep B vaccination among LBW babies need to be reviewed?
Difference in seropositivity for infants vaccinated at different birth weights

Special populations Health care workers
HBV infection is a well-recognized occupational risk for HCW.
HBV is stable, infectious on surfaces for at least 7 days.
Transmissible in the absence of visible blood.
HCW do not recognize all exposures.
Even recognized, HCW often do not seek post-exposure prophylaxis.
Hepatitis B vaccine of health care workers safeguards the health of workers
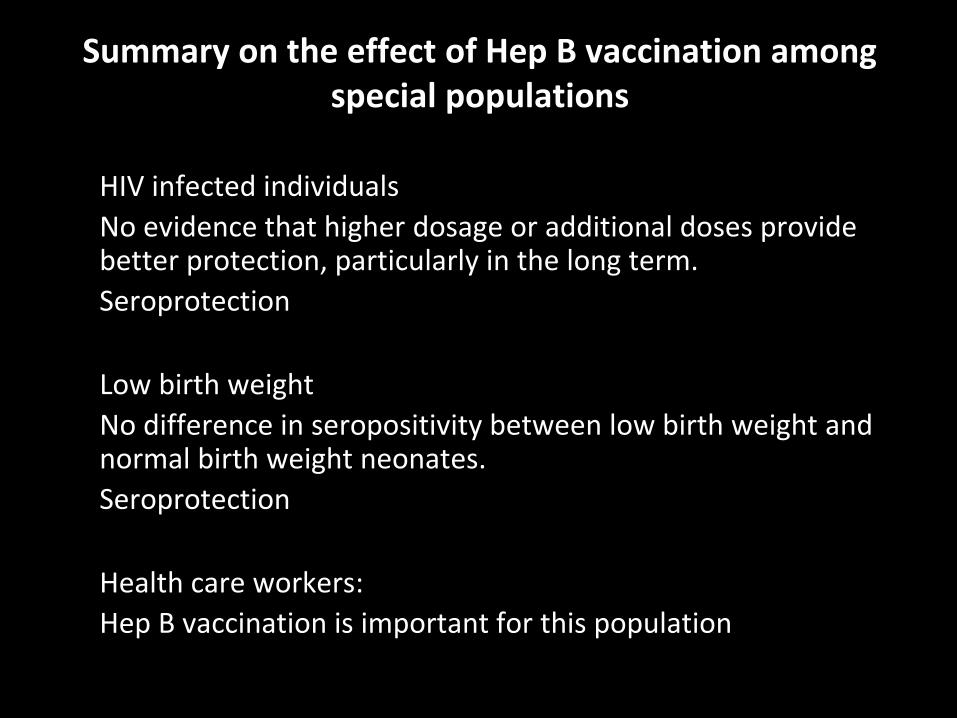
Summary on the effect of Hep B vaccination among special populations
HIV infected individuals
No evidence that higher dosage or additional doses provide better protection, particularly in the long term.
Seroprotection
Low birth weight
No difference in seropositivity between low birth weight and normal birth weight neonates.
Seroprotection
Health care workers:
Hep B vaccination is important for this population
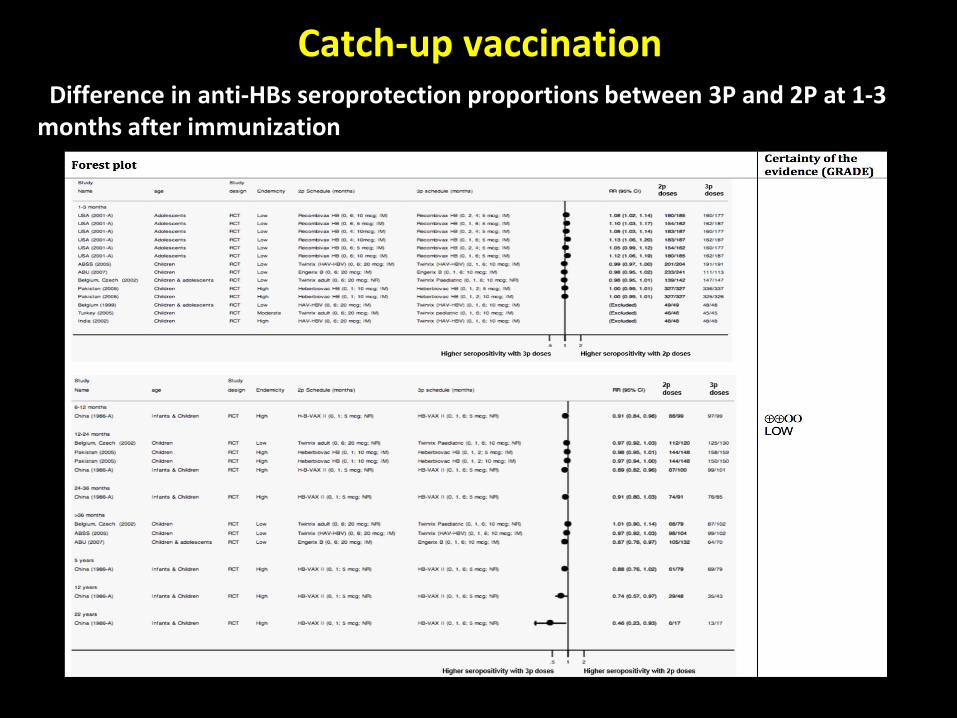
Catch-up vaccination Difference in anti-HBs seroprotection proportions between 3P and 2P at 1-3
months after immunization

Is a booster dose needed? Incidence risk of HBV breakthrough infection
Source: Poorolajal (2010)
5 yrs
6-10 yrs
11-15 yrs
16-20 yrs

Summary on vaccination for catch up and booster dose
Catch up schedules:
Consideration should be given adjust the number of doses recommended (2 or 3 doses)
Booster doses:
No evidence supporting the use of a booster dose.

2. What is the impact of Hep B vaccination programmes on HBV epidemiology ?
Elements considered:
1. HBV epidemiology (The Gambia, Western Pacific countries, Alaska Eskimos communities)
2. Liver cancer (China)
3. Economic analysis of Hep B vaccination
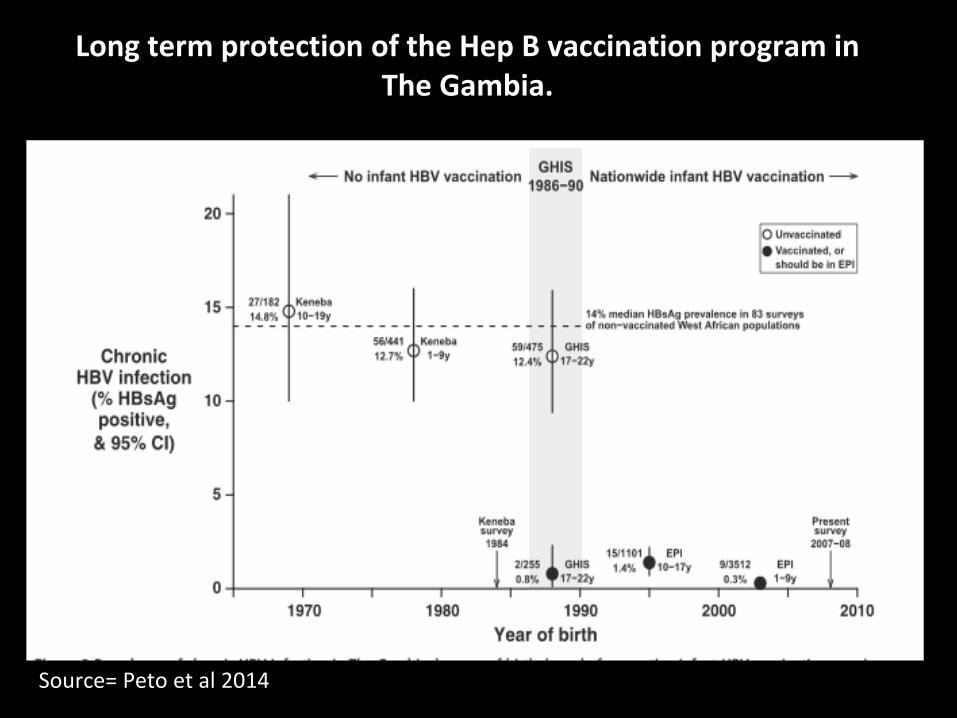
Long term protection of the Hep B vaccination program in The Gambia.
Source= Peto et al 2014
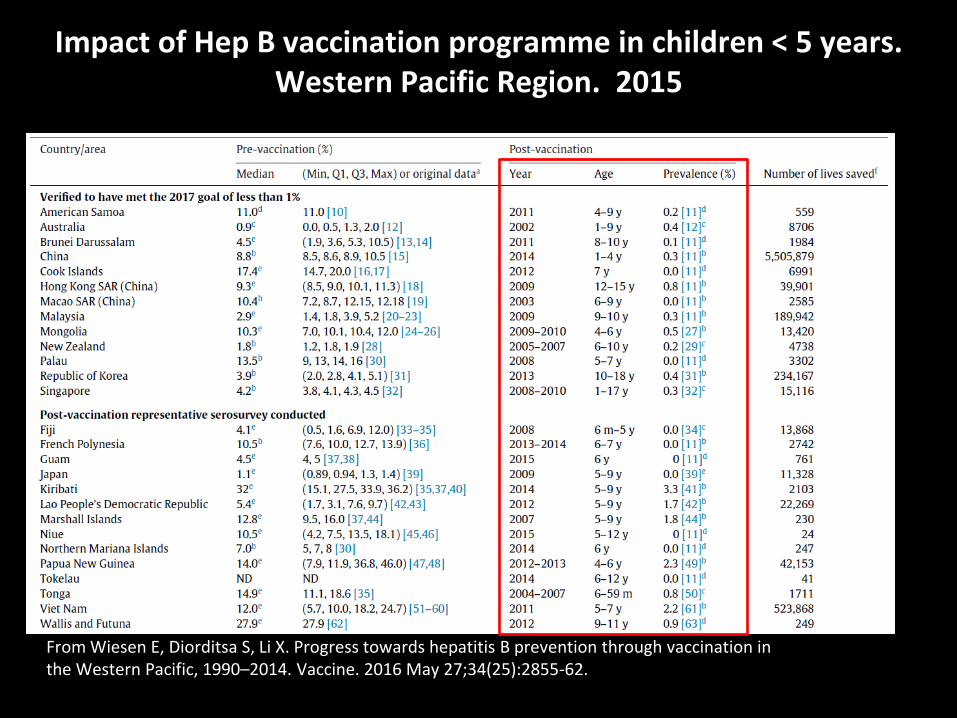
Impact of Hep B vaccination programme in children < 5 years. Western Pacific Region. 2015
From Wiesen E, Diorditsa S, Li X. Progress towards hepatitis B prevention through vaccination in the Western Pacific, 1990–2014. Vaccine. 2016 May 27;34(25):2855-62.

Control of hepatitis B among Alaska Natives
1578 Alaska Native adults and adolescents (15 communities ) aged ≥6 months received 3 doses of plasma derived hepB vaccine.
Tested for antibody to hepatitis B surface antigen (anti-HBs) levels 30 years after primary series. Booster of recombinant vaccine to those with anti-HBs<10 mIU/mL 2–4 weeks later Re-evaluated for anti-HBs levels 30 days after the booster.
243 persons (56%) responded to the original primary and did not received
additional doses during the 30-year period, 125/243 (51%) had anti-HBs level ≥10 mIU/mL. 75 /85 (88%) with < 10mlIU/ml responded to a booster dose (anti-HBs ≥10 mIU/mL) at 30 days. Initial anti-HBs level after the primary series correlated with higher anti-HBs levels at 30 years.
Based on anti-HBs level at 30 years and an 88% booster dose response
concluded that ≥90% of participants had evidence of protection 30 years later. Booster doses are therefore not needed
Bruce 2016.
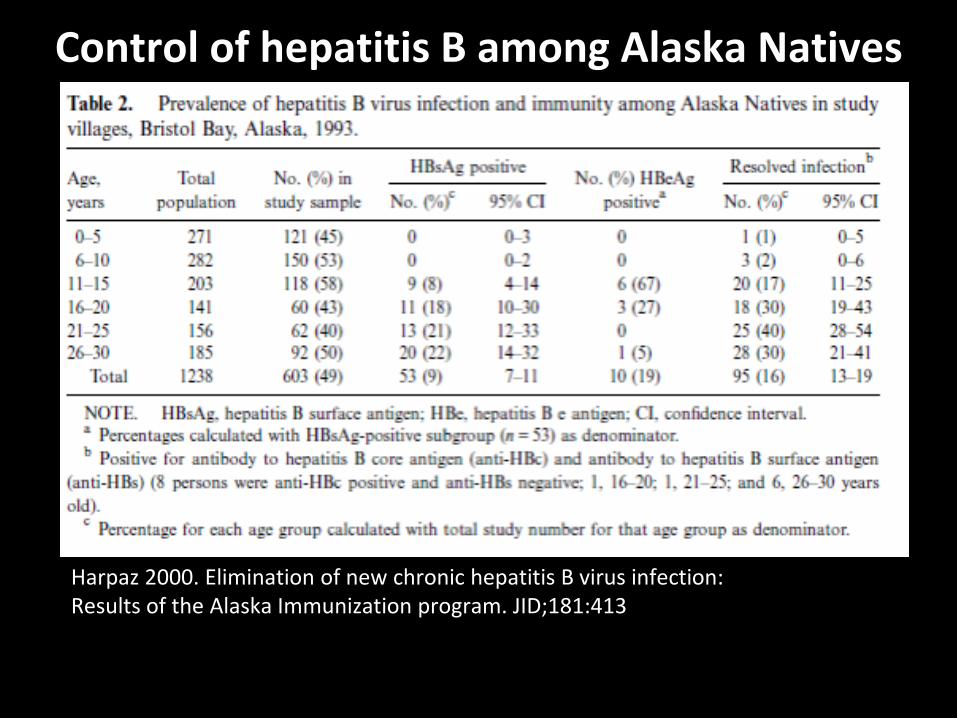
Control of hepatitis B among Alaska Natives
Harpaz 2000. Elimination of new chronic hepatitis B virus infection: Results of the Alaska Immunization program. JID;181:413
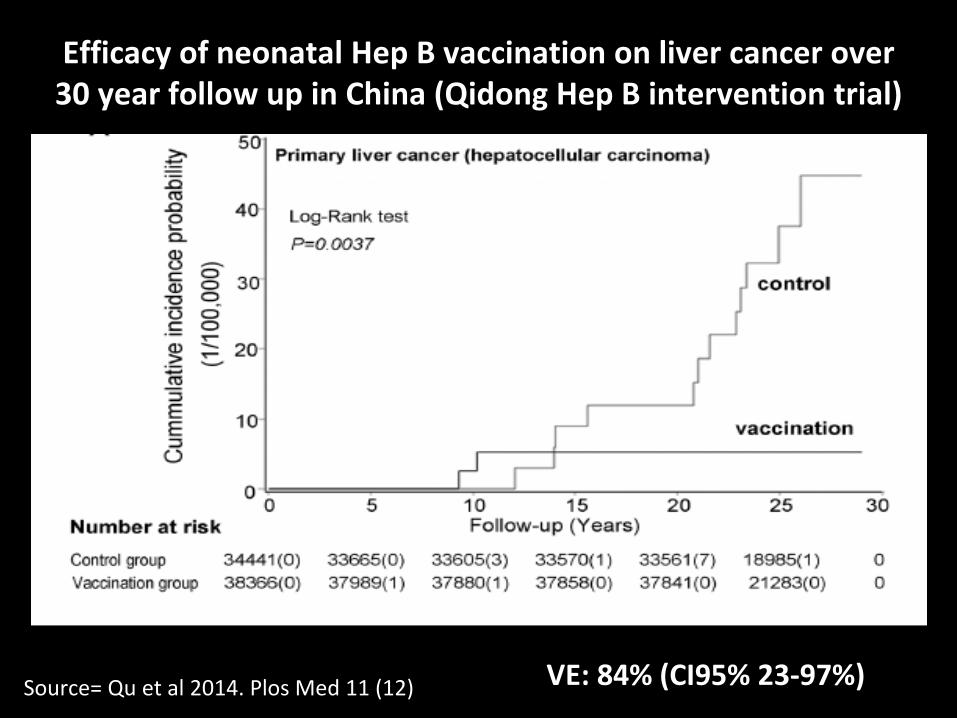
Efficacy of neonatal Hep B vaccination on liver cancer over 30 year follow up in China (Qidong Hep B intervention trial)
Source= Qu et al 2014. Plos Med 11 (12) VE: 84% (CI95% 23-97%)

Systematic review of economic evaluation of Hep B vaccine in LMICs
Since introduction of Hep B vaccine 19 CEA studies
14 Asia
China (8), Vietnam (1), India (3), Thailand (1), Iran (1)
5 Africa
The Gambia (2), Mozambique (2), Ethiopia (1)
Vaccination approach Universal (12)
Targeted (4)
Not specified (3)
Source= Soakaew et al. In publication
18/19 studies considered Hep B vaccination cost saving or cost effective. Only one study reported it was unlikely to be effective. 5/6 studies that considered the birth dose reported it was cost effective. Vaccine price, prevalence of HBV infection, cost component, wastage rate and efficacy assumptions are key drivers.
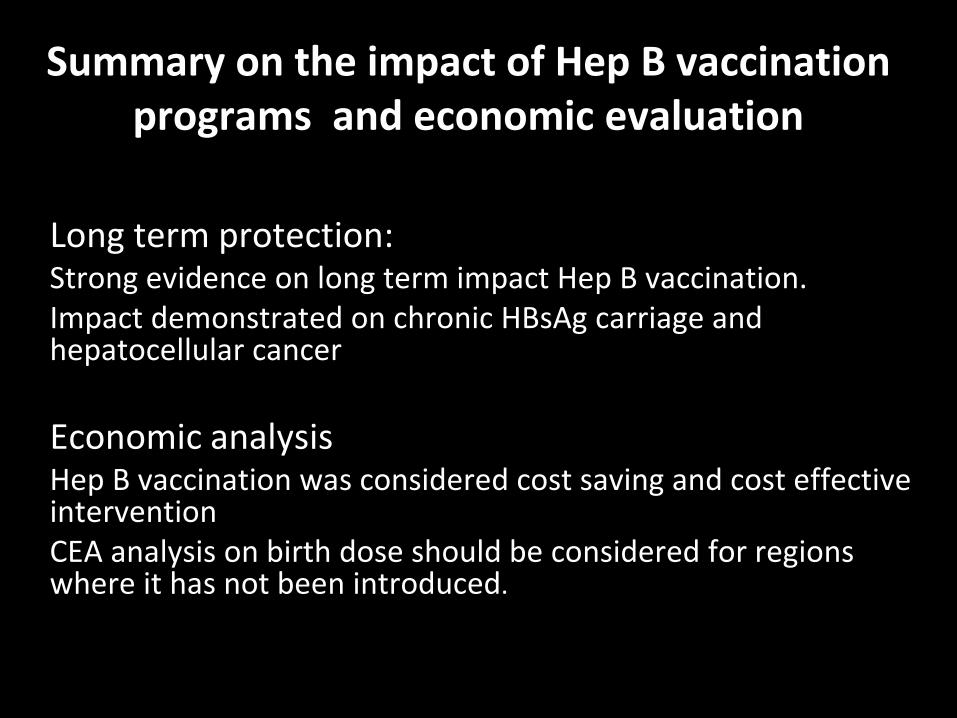
Summary on the impact of Hep B vaccination programs and economic evaluation
Long term protection: Strong evidence on long term impact Hep B vaccination. Impact demonstrated on chronic HBsAg carriage and hepatocellular cancer
Economic analysis Hep B vaccination was considered cost saving and cost effective intervention CEA analysis on birth dose should be considered for regions where it has not been introduced.

Does the evidence support flexibility in the cold chain requirement for monovalent Hep B vaccine?
Elements considered:
1. Barriers for birth dose introduction and coverage
2. Thermostability of Hep B monovalent vaccines
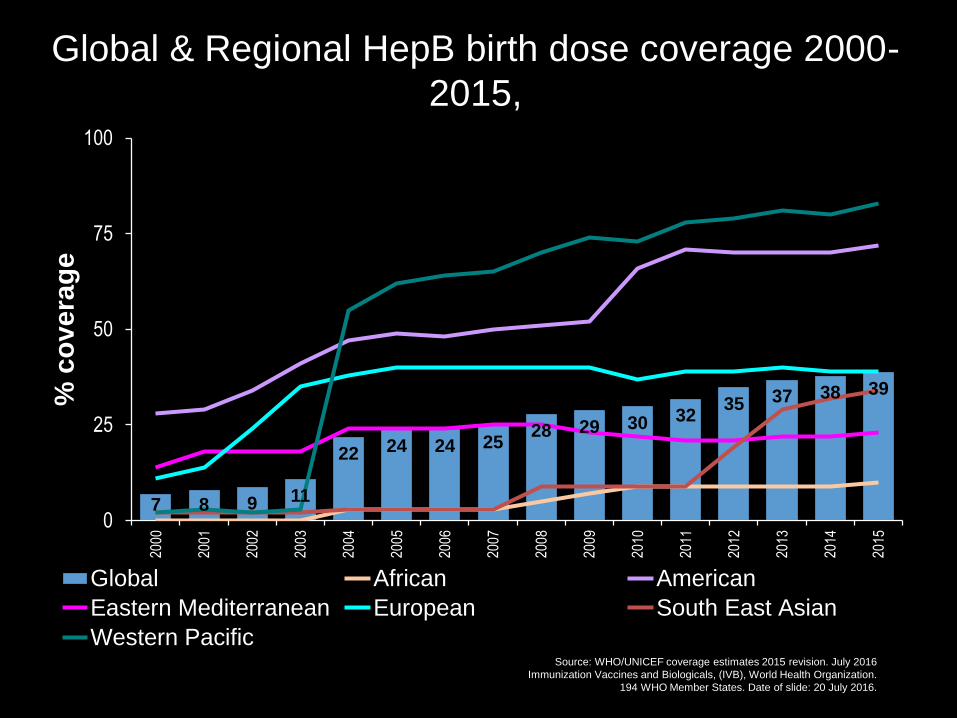
Global & Regional HepB birth dose coverage 2000-
2015,
7 8 9 11
22 24 24 25 28 29 30 32
35 37 38 39
0
25
50
75
100
% c
overa
ge
Global African American
Eastern Mediterranean European South East Asian
Western PacificSource: WHO/UNICEF coverage estimates 2015 revision. July 2016
Immunization Vaccines and Biologicals, (IVB), World Health Organization.
194 WHO Member States. Date of slide: 20 July 2016.

% of births in health facility by country in Africa (UNICEF 2015)
• > or = 90 8 countries
• 80-89 6 countries
• 70-79 6
• 60-69 7
• 50-59 8
• <50 9
Source=UNICEF 2015

Barriers to the introduction of the Hep B birth dose Survey in selected WHO Regional offices
AFRO and SEARO Regions
Most common barriers Proposed actions to overcome barriers
Funding not available Partners being supportive of birth dose delivery Advocacy with MoH to identify resources/budget allocation
Births outside health facilities Strength outreach activities to vaccinate newborns outside the health facilities
Vaccine storage/cold chain Cold chain adequacy Conduct country pilot studies on OCC
Insufficient local disease burden data
Conduct seroprevalence surveys
Capacity to develop national policies and guidelines
Capacity building for NITAGs and NRAs
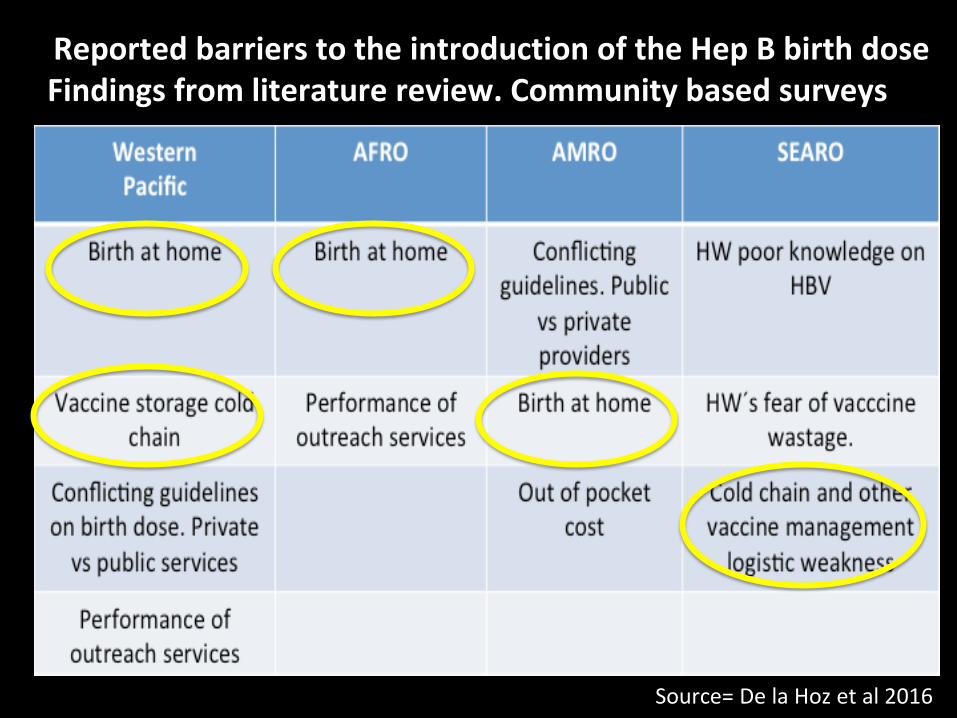
Birth at home
Performance of outreach services
Reported barriers to the introduction of the Hep B birth dose Findings from literature review. Community based surveys
Source= De la Hoz et al 2016
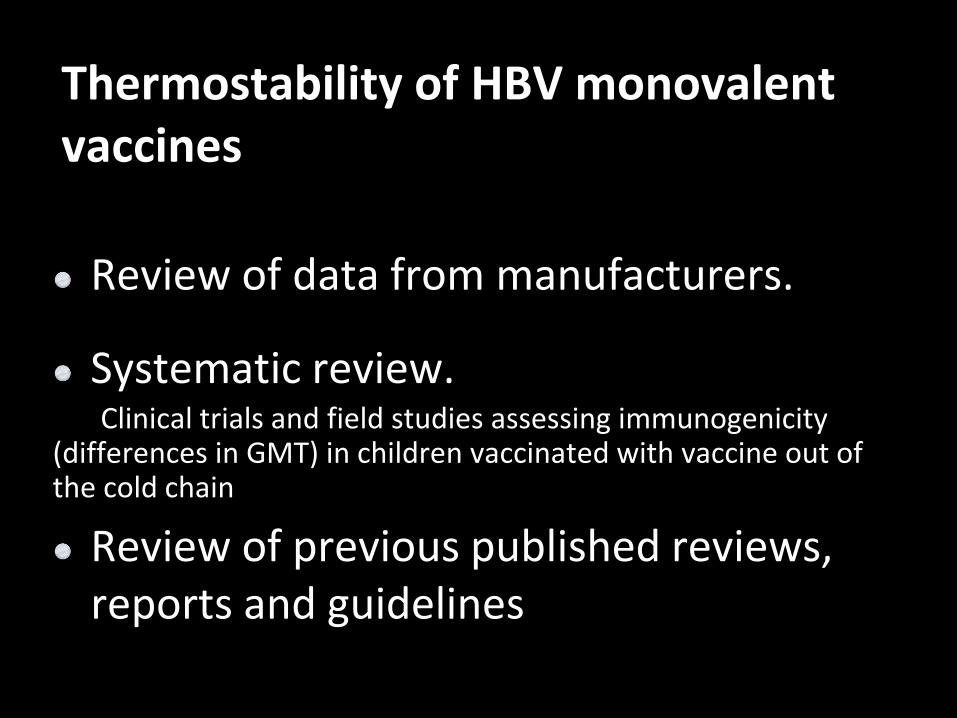
Thermostability of HBV monovalent vaccines
Review of data from manufacturers.
Systematic review. Clinical trials and field studies assessing immunogenicity
(differences in GMT) in children vaccinated with vaccine out of the cold chain
Review of previous published reviews, reports and guidelines
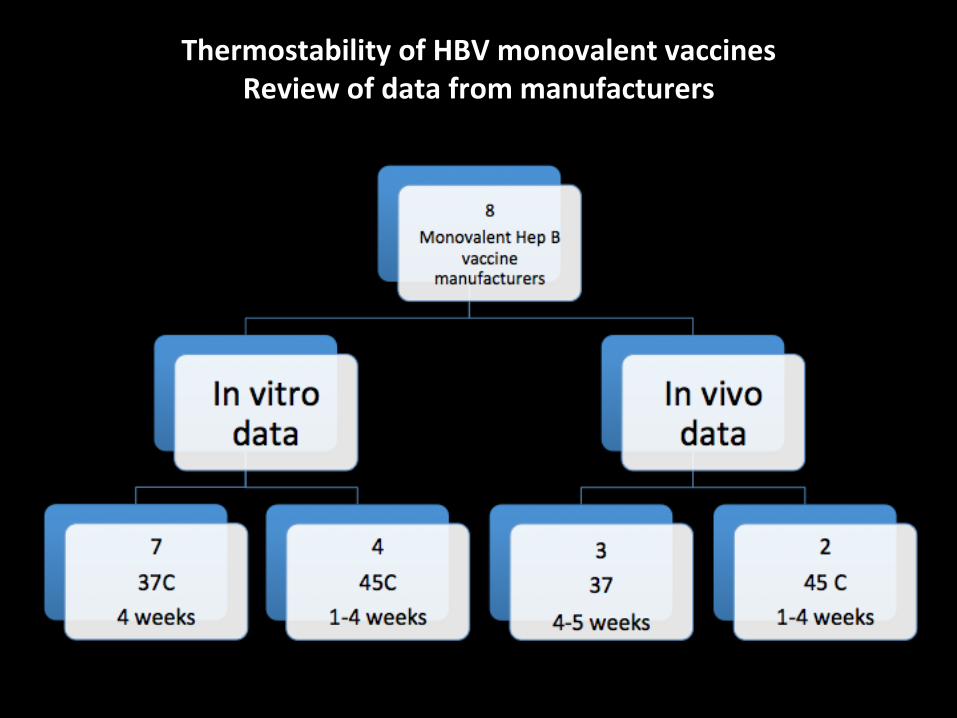
Thermostability of HBV monovalent vaccines Review of data from manufacturers

In-vitro relative potency of manufacturer C monovalent hepatitis B vaccine, exposed to different temperatures for different time periods. Minimum release and end of shelf-life relative potency >=0.50. Data provided by manufacturer. Values represent averages of two different lots.
In-vitro relative potency of manufacturer A monovalent hepatitis B vaccine, exposed to different temperatures for different time periods. Minimum release and end of shelf-life relative potency >=0.45. Data provided by manufacturer and results based on Murex test kit (Diasorin).

In-vitro relative potency of manufacturer D monovalent hepatitis B vaccine, exposed to 37oC for 5 weeks. Minimum release and end of shelf-life relative potency >=0.80. Data provided by manufacturer and based on in-house potency test. Values represent averages of three different lots.

• In-vitro relative potency of manufacturer B monovalent hepatitis B vaccine, exposed to 37oC for 4 weeks. Minimum release and end of shelf-life relative potency >= 20ug/ml. Data provided by manufacturer and based on in-house potency test. Values represent averages of two batches.
In-vitro relative potency of manufacturer B monovalent hepatitis B vaccine, exposed to different temperatures and times. Minimum release and end of shelf-life relative potency >=20 ug/ml. Data provided by manufacturer and based on in-house potency test. Values represent averages of three different lots and error bars show maximum and minimum values.

In-vitro relative potency of manufacturer E monovalent hepatitis B vaccine, exposed to 37oC for 4 weeks and 45 oC for 1 week. Minimum release and end of shelf-life relative potency 15-25 ug/ml. Data provided by manufacturer and based on in-house potency test. Values represent averages of four different lots at 37oC and three lots at 45 oC.
In-vitro relative potency of manufacturer H monovalent hepatitis B vaccine, exposed to 37oC for 6 months (average value for testing of 10 lots), 45oC for 2 weeks (average value of 2 lots), and 60oC for 2 weeks (average value of 2 lots). Minimum release and end of shelf-life relative potency 15 ug/ml. Data provided by manufacturer.

Average seroconverson from four community-based studies that delivered childhood hepatitis B vaccine after storage inside or outside the cold chain. Error bars show range of values.

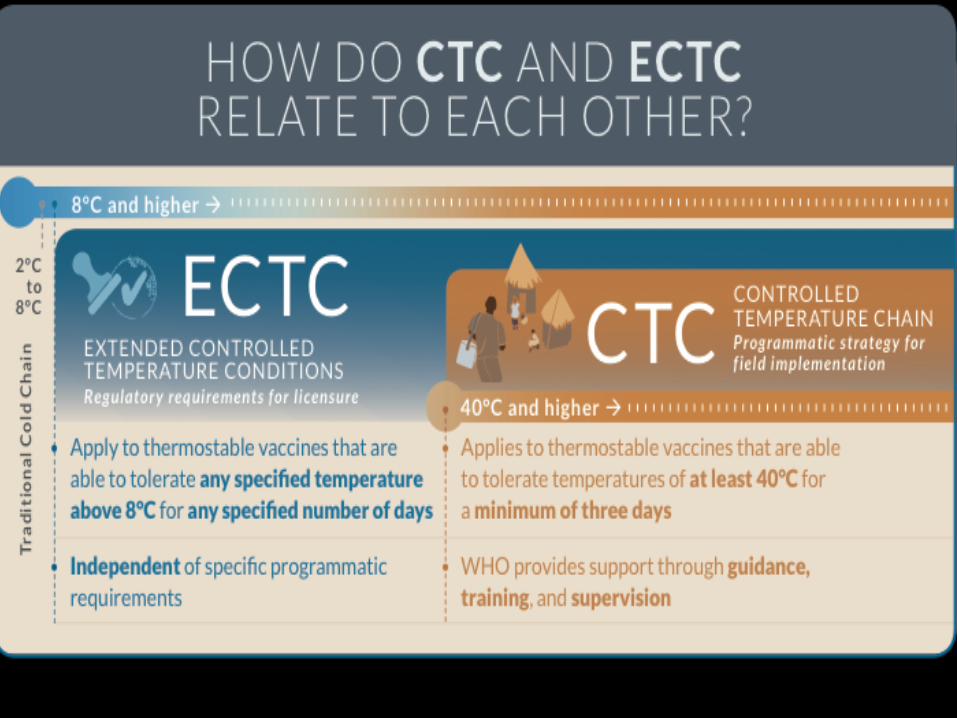
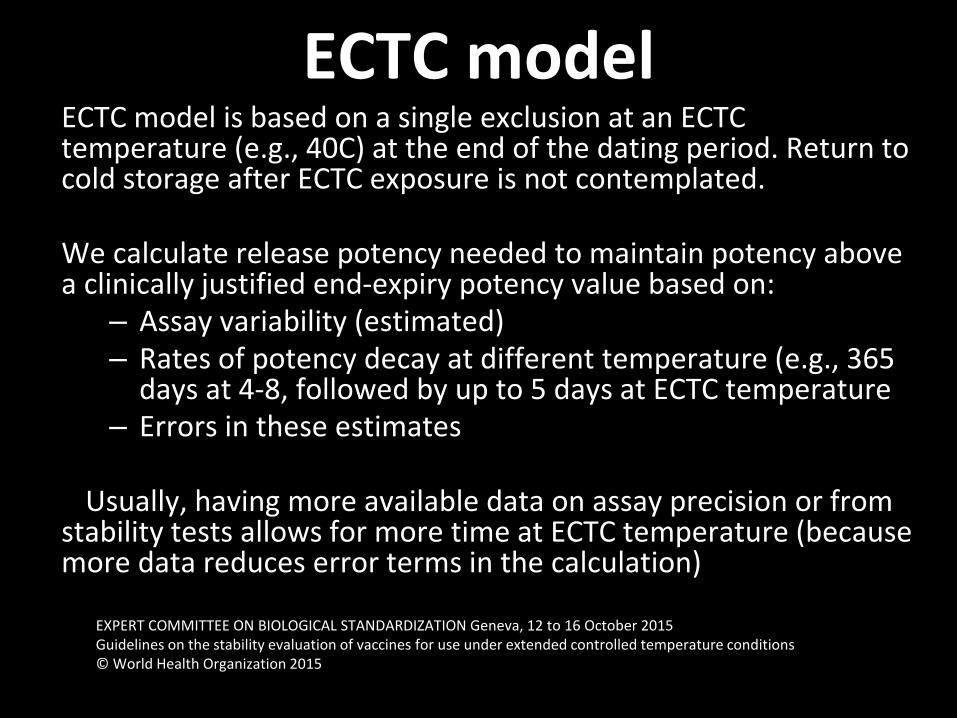
ECTC model ECTC model is based on a single exclusion at an ECTC temperature (e.g., 40C) at the end of the dating period. Return to cold storage after ECTC exposure is not contemplated. We calculate release potency needed to maintain potency above a clinically justified end-expiry potency value based on:
– Assay variability (estimated) – Rates of potency decay at different temperature (e.g., 365
days at 4-8, followed by up to 5 days at ECTC temperature – Errors in these estimates
Usually, having more available data on assay precision or from
stability tests allows for more time at ECTC temperature (because more data reduces error terms in the calculation)
EXPERT COMMITTEE ON BIOLOGICAL STANDARDIZATION Geneva, 12 to 16 October 2015 Guidelines on the stability evaluation of vaccines for use under extended controlled temperature conditions © World Health Organization 2015
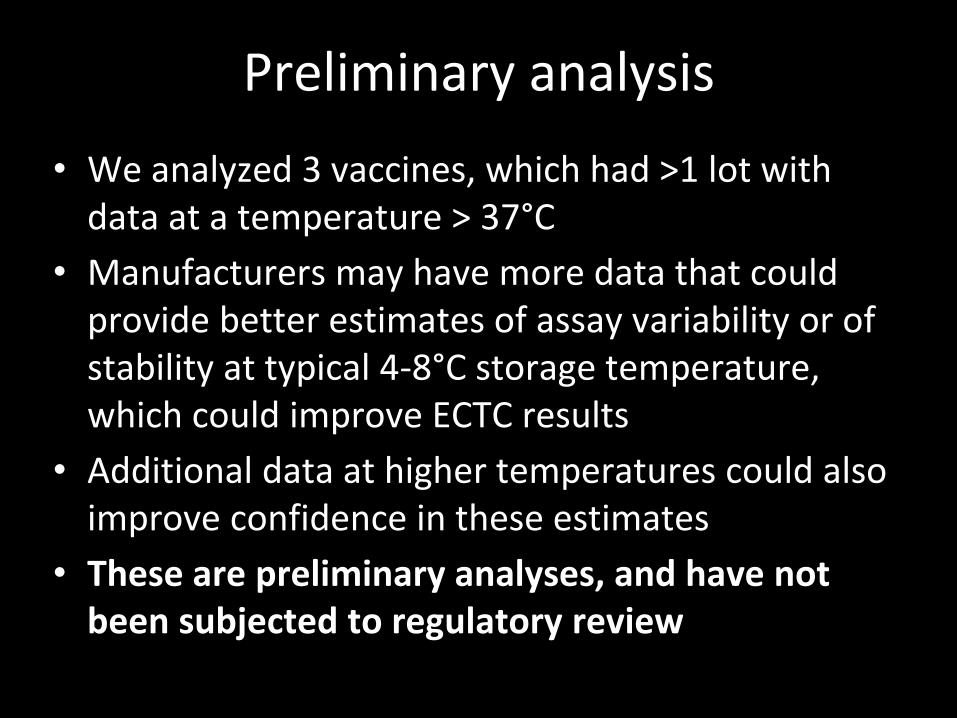
Preliminary analysis
• We analyzed 3 vaccines, which had >1 lot with data at a temperature > 37°C
• Manufacturers may have more data that could provide better estimates of assay variability or of stability at typical 4-8°C storage temperature, which could improve ECTC results
• Additional data at higher temperatures could also improve confidence in these estimates
• These are preliminary analyses, and have not been subjected to regulatory review
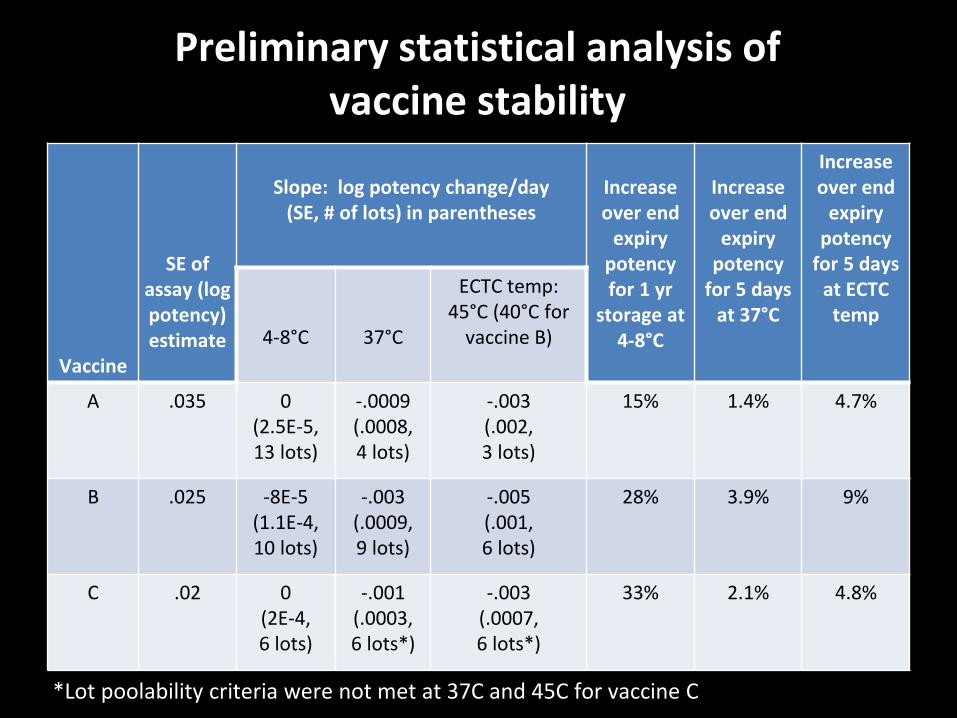
Preliminary statistical analysis of vaccine stability
Vaccine
SE of assay (log potency) estimate
Slope: log potency change/day
(SE, # of lots) in parentheses
Increase over end
expiry potency for 1 yr
storage at 4-8°C
Increase over end
expiry potency
for 5 days at 37°C
Increase over end
expiry potency
for 5 days at ECTC temp
4-8°C
37°C
ECTC temp: 45°C (40°C for
vaccine B)
A .035 0 (2.5E-5, 13 lots)
-.0009 (.0008, 4 lots)
-.003 (.002, 3 lots)
15% 1.4% 4.7%
B .025 -8E-5 (1.1E-4, 10 lots)
-.003 (.0009, 9 lots)
-.005 (.001, 6 lots)
28% 3.9% 9%
C .02 0 (2E-4, 6 lots)
-.001 (.0003, 6 lots*)
-.003 (.0007, 6 lots*)
33% 2.1% 4.8%
*Lot poolability criteria were not met at 37C and 45C for vaccine C
Conclusions
These analyses are not comprehensive and would need to be considered in the context of each manufacturer’s release model and may need to consider other factors (e.g., poolability, representativeness of data with limited lots). Nonetheless, even with limited data, 5 days at ECTC temperatures could likely be supported with only modest (5-9% of end-expiry potency) increases in vaccine potency for these vaccines Existing filling models may already provide this leeway for some of these vaccines
Summary on the thermostability of hepatitis B vaccine
An important proportion of deliveries take place at home and there are places with limited cold chain in peripheral health facilities. Existing data indicates that hepatitis B vaccines are heat stable and found to maintain immunogenicity after exposures of up to 45C for one week and 37C and 41C for several weeks Field experience suggest there are programmatic advantages in keeping hepatitis B vaccine in ambient temperatures at service delivery points, in certain settings. Even with limited data, 5 days at ECTC temperatures could likely be supported with only modest increases in vaccine potency for these vaccines (maybe already cover in the over the end period potency increases)

Thank you