experimental investigation on the heat transfer between
TRANSCRIPT
Experimental investigation on the heat transfer between condensing steam and sCO2 in a compact heat exchanger
Straetz, Marcel Ralf; Mertz, Rainer; Starflinger, Jörg
In: 2nd European sCO2 Conference 2018
This text is provided by DuEPublico, the central repository of the University Duisburg-Essen.
This version of the e-publication may differ from a potential published print or online version.
DOI: https://doi.org/10.17185/duepublico/46078
URN: urn:nbn:de:hbz:464-20180827-123236-0
Link: https://duepublico.uni-duisburg-essen.de:443/servlets/DocumentServlet?id=46078
License:
This work may be used under a Creative Commons Namensnennung 4.0 International license.
1
DOI: 10.17185/duepublico/46078
2nd
European supercritical CO2 Conference
August 30-31, 2018, Essen, Germany
2018-sCO2.eu-104
EXPERIMENTAL INVESTIGATION ON THE HEAT TRANSFER BETWEEN
CONDENSING STEAM AND SCO2 IN A COMPACT HEAT EXCHANGER
Marcel Straetz*
University of Stuttgart
Stuttgart, Germany
Rainer Mertz
University of Stuttgart
Stuttgart, Germany
Joerg Starflinger
University of Stuttgart
Stuttgart, Germany
ABSTRACT
In the frame of the “sCO2-HeRo” project (supercritical
carbon-dioxide heat removal system) a self-launching and
self-sustaining decay heat removal system for retrofitting into
nuclear power plants is investigated. The system should be able
to transfer the decay heat from the reactor core to the ultimate
heat sink, e.g. the ambient air, in case of a station-blackout and
loss-of-ultimate-heat-sink accident scenario. The system, in fact
a Brayton cycle, consists of a compressor, a compact heat
exchanger, a turbine, a sink heat exchanger and a generator.
Since the turbine of the cycle produces more power than it is
used in the compressor, the system is self-sustaining and excess
electricity of the generator can be used e.g. for auxiliary
devices in the power plant or for recharging batteries. Due to its
convenient fluid properties near the critical point, for instance
the heat capacity and the fluid density, supercritical carbon
dioxide is used as working fluid.
Within the project a two-scale approach is applied. This
means, that in the first part of the project a small-scale
demonstrator unit of the sCO2-HeRo system is designed,
manufactured and retrofitted into the pressurized water reactor
glass model at Gesellschaft für Simulatorschulung (GfS),
Essen. In the second part the received experimental results at
the demonstrator will be used for validation of models e.g. for
heat transfer and pressure drop. Afterwards, they will be
transferred to component models on power plant size to be
implemented into the thermal-hydraulic code ATHLET.
The Institute of Nuclear Technology and Energy Systems
(IKE), University of Stuttgart, is responsible for the
experimental investigation on the heat transfer between
condensing steam and supercritical carbon-dioxide in the
compact heat exchanger. Thereby, low pressure (glass model
application) and high pressure (power plant application)
investigations on the heat transfer between condensing steam
and supercritical carbon-dioxide were carried out. This paper
starts with an overview of the sCO2-HeRo system, retrofitted
into a PWR, followed by a description of the investigated
two-plate CHX test configuration. Afterwards, the test facility
for the high pressure steam experiments is shown and the
measurement parameter as well as the position of each
measurement device is described. The analyzed experimental
results, for example the sCO2 pressure drop as a function of the
sCO2 mass flow rate, the heat transfer ratio between the steam
side and the sCO2 side or the surface temperature distribution
on the sCO2 side of the CHX, and the calculated measurement
errors are discussed. Finally, the received results are
summarized and a conclusion is given.
INTRODUCTION
In case of a station-blackout (SBO) and loss-of-ultimate-
heat-sink (LUHS) accident scenario in a light water reactor,
plant accident measures depend on the availability of external
power. If this is not guaranteed, the core will be violated if no
other cooling measures will be successful. Such scenarios lead
to the development of self-launching, self-propelling and
self-sustaining decay heat removal systems which are
independent from external energy, but fulfilling the safety
function transferring the decay heat from the reactor core to an
ultimate heat sink, e.g. the ambient air. The supercritical
carbon-dioxide (sCO2) heat removal system “sCO2-HeRo” is
2
DOI: 10.17185/duepublico/46078
such a system. It is a Brayton cycle, using sCO2 as working
fluid due to his convenient fluid properties near the critical
point. The main components of the cycle are a
turbo-compressor-system (TCS) with integrated generator, a
compact heat exchanger (CHX) and an air-cooled heat
exchanger. Since the turbine of the cycle produces more power
than it is used for the compression work, excess electricity can
be generated in the generator for any kind of auxiliary devices.
Supercritical CO2 is chosen as working fluid because it is not
toxic, not combustible and abundantly available. Furthermore,
the convenient fluid properties near the critical point, e.g. the
fluid density and the specific heat capacity, allows the design of
compact components. This is especially important for the
compact heat exchanger, connecting the steam generator of the
power plant with the sCO2-HeRo cycle, because of space
limitations in the containment.
Venker et al. [1-6] have studied the feasibility of such a
decay heat removal system using the German thermal-hydraulic
code ATHLET “Analysis of Thermal-hydraulic of Leaks and
Transients” for a boiling water reactor (BWR). The simulation
results have shown that the sCO2-HeRo system has the
potential to enlarge the grace time for interaction to more than
72 h. However, the results are based upon the implemented heat
transfer and pressure drop models in ATHLET and these must
be validated for the working fluid sCO2.
Therefore, partners from three European countries are
working in the first part of sCO2-HeRo project on the design,
manufacturing and assessment of a small-scale demonstrator
unit into the pressure water reactor (PWR) glass model at
Gesellschaft für Simulatorschulung (GfS), Essen, Germany.
This is the step towards technology readiness level 3
(TRL3) [7]. By means of the small-scale demonstrator unit,
experiments will be carried out and the received results will be
used for validation of heat transfer and pressure drop
correlations. In the second part the results will be transferred to
component models on power plant scale to be implemented into
the German thermal-hydraulic code ATHLET.
In the early stage of the project thermodynamic cycle
calculations were performed for the small-scale demonstrator
unit and for the power plant system. The optimum cycle
parameters were determined with respect to maximum
generator excess electricity. The received results as well as the
determined optimum cycle parameters for the small-scale
demonstrator unit of the glass model are summarized by Straetz
et al. [8] and for the power plant scale by Hajek [9].
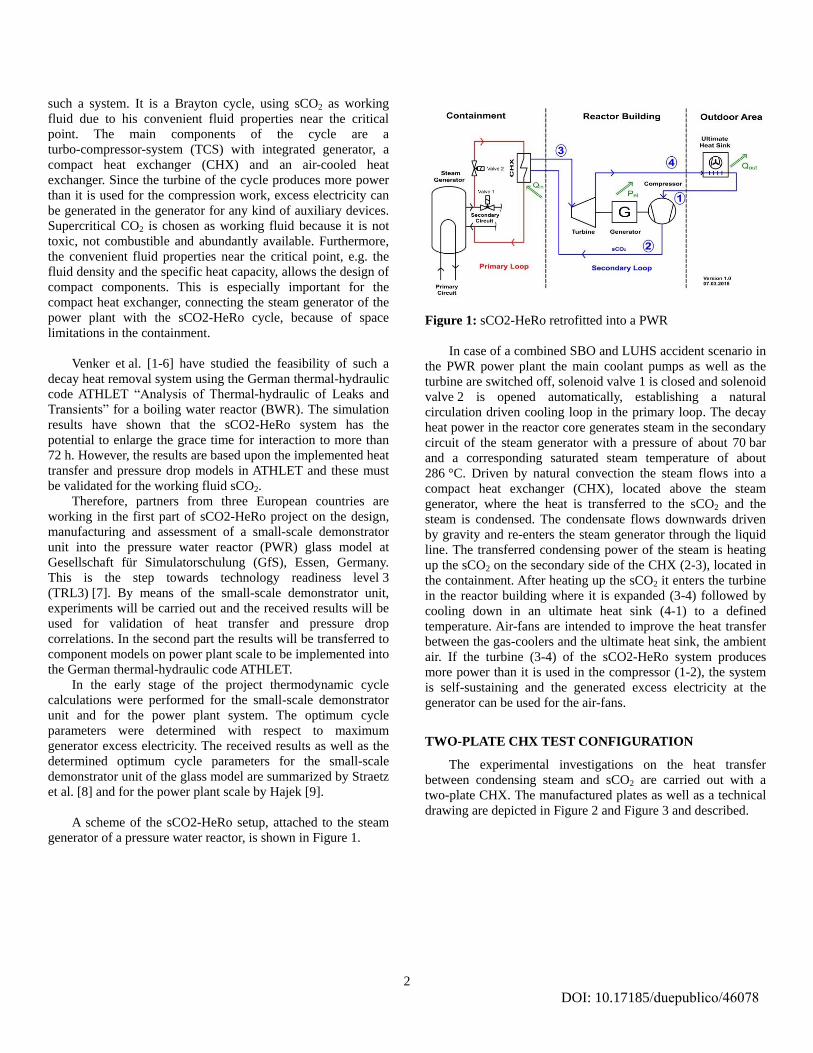
A scheme of the sCO2-HeRo setup, attached to the steam
generator of a pressure water reactor, is shown in Figure 1.
Figure 1: sCO2-HeRo retrofitted into a PWR
In case of a combined SBO and LUHS accident scenario in
the PWR power plant the main coolant pumps as well as the
turbine are switched off, solenoid valve 1 is closed and solenoid
valve 2 is opened automatically, establishing a natural
circulation driven cooling loop in the primary loop. The decay
heat power in the reactor core generates steam in the secondary
circuit of the steam generator with a pressure of about 70 bar
and a corresponding saturated steam temperature of about
286 °C. Driven by natural convection the steam flows into a
compact heat exchanger (CHX), located above the steam
generator, where the heat is transferred to the sCO2 and the
steam is condensed. The condensate flows downwards driven
by gravity and re-enters the steam generator through the liquid
line. The transferred condensing power of the steam is heating
up the sCO2 on the secondary side of the CHX (2-3), located in
the containment. After heating up the sCO2 it enters the turbine
in the reactor building where it is expanded (3-4) followed by
cooling down in an ultimate heat sink (4-1) to a defined
temperature. Air-fans are intended to improve the heat transfer
between the gas-coolers and the ultimate heat sink, the ambient
air. If the turbine (3-4) of the sCO2-HeRo system produces
more power than it is used in the compressor (1-2), the system
is self-sustaining and the generated excess electricity at the
generator can be used for the air-fans.
TWO-PLATE CHX TEST CONFIGURATION
The experimental investigations on the heat transfer
between condensing steam and sCO2 are carried out with a
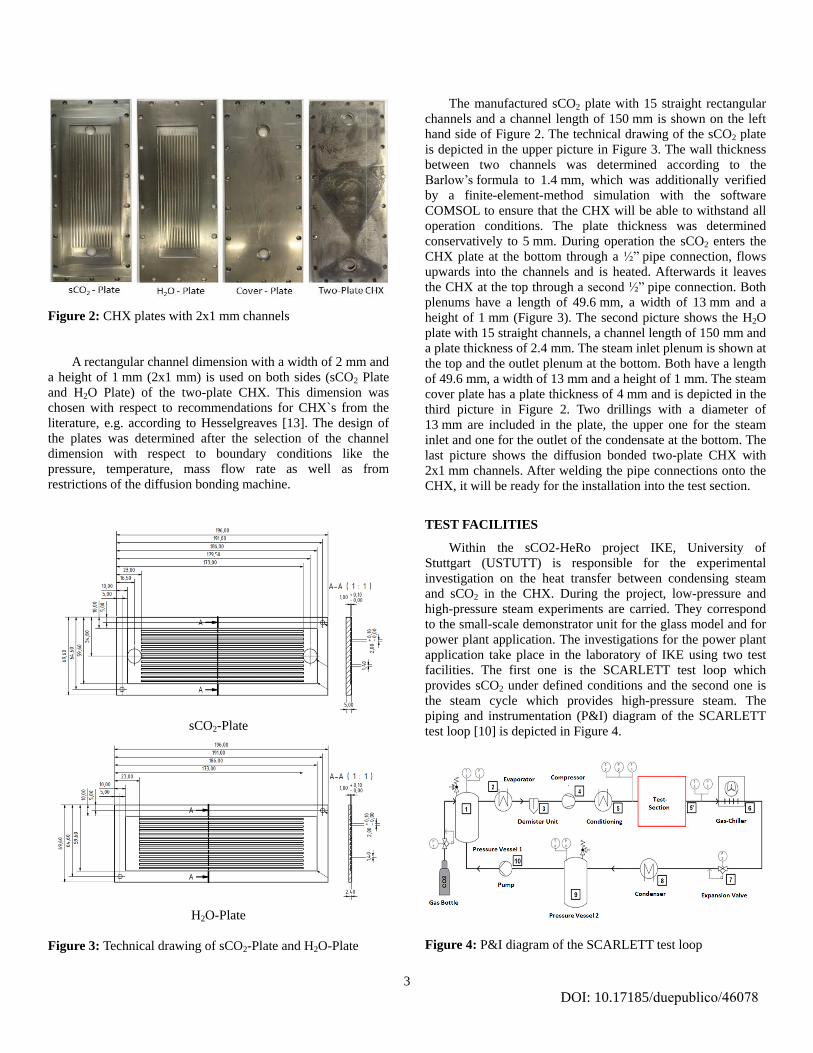
two-plate CHX. The manufactured plates as well as a technical
drawing are depicted in Figure 2 and Figure 3 and described.
3
DOI: 10.17185/duepublico/46078
Figure 2: CHX plates with 2x1 mm channels
A rectangular channel dimension with a width of 2 mm and
a height of 1 mm (2x1 mm) is used on both sides (sCO2 Plate
and H2O Plate) of the two-plate CHX. This dimension was
chosen with respect to recommendations for CHX`s from the
literature, e.g. according to Hesselgreaves [13]. The design of
the plates was determined after the selection of the channel
dimension with respect to boundary conditions like the
pressure, temperature, mass flow rate as well as from
restrictions of the diffusion bonding machine.
sCO2-Plate
H2O-Plate
Figure 3: Technical drawing of sCO2-Plate and H2O-Plate
The manufactured sCO2 plate with 15 straight rectangular
channels and a channel length of 150 mm is shown on the left
hand side of Figure 2. The technical drawing of the sCO2 plate
is depicted in the upper picture in Figure 3. The wall thickness
between two channels was determined according to the
Barlow’s formula to 1.4 mm, which was additionally verified
by a finite-element-method simulation with the software
COMSOL to ensure that the CHX will be able to withstand all
operation conditions. The plate thickness was determined
conservatively to 5 mm. During operation the sCO2 enters the
CHX plate at the bottom through a ½” pipe connection, flows
upwards into the channels and is heated. Afterwards it leaves
the CHX at the top through a second ½” pipe connection. Both
plenums have a length of 49.6 mm, a width of 13 mm and a
height of 1 mm (Figure 3). The second picture shows the H2O
plate with 15 straight channels, a channel length of 150 mm and
a plate thickness of 2.4 mm. The steam inlet plenum is shown at
the top and the outlet plenum at the bottom. Both have a length
of 49.6 mm, a width of 13 mm and a height of 1 mm. The steam
cover plate has a plate thickness of 4 mm and is depicted in the
third picture in Figure 2. Two drillings with a diameter of
13 mm are included in the plate, the upper one for the steam
inlet and one for the outlet of the condensate at the bottom. The
last picture shows the diffusion bonded two-plate CHX with
2x1 mm channels. After welding the pipe connections onto the
CHX, it will be ready for the installation into the test section.
TEST FACILITIES
Within the sCO2-HeRo project IKE, University of
Stuttgart (USTUTT) is responsible for the experimental
investigation on the heat transfer between condensing steam
and sCO2 in the CHX. During the project, low-pressure and
high-pressure steam experiments are carried. They correspond
to the small-scale demonstrator unit for the glass model and for
power plant application. The investigations for the power plant
application take place in the laboratory of IKE using two test
facilities. The first one is the SCARLETT test loop which
provides sCO2 under defined conditions and the second one is
the steam cycle which provides high-pressure steam. The
piping and instrumentation (P&I) diagram of the SCARLETT
test loop [10] is depicted in Figure 4.
Figure 4: P&I diagram of the SCARLETT test loop
4
DOI: 10.17185/duepublico/46078
At the start the pressure vessels (1, 9) are filled with CO2
by a gas bottle after evacuating the loop with a vacuum pump.
During operation, liquid CO2 flows from the pressure vessel 1
into an electrical heated evaporator (2) where it is slightly
superheated. In a demister unit (3) remaining liquid CO2 is
separated from the flow before it enters a compressor (4) where
it is compressed to a defined pressure and simultaneously
compression-heated. After the compressor the sCO2 is
conditioned before it enters the test section, which means that a
defined temperature can be adjusted via heating or cooling the
sCO2 mass flow rate. In a test-section (red box) different kind
of experiments can be performed, e.g. the heat transfer in CHX
with condensing steam and sCO2 or electrically heated plates.
The installed measurement devices, for instance resistance
thermometers (Pt-100), pressure gauges and mass flow meters,
at the inlet (5) and outlet (5’) of the test section measures
relevant parameters of the experiments. The sCO2 is cooled
down in a gas chiller (6) after leaving the test section and
before entering an expansion valve (7). In a condenser (8) the
CO2 can be cooled down again before it flows into the pressure
vessel 2 (9). From there it is pumped back into vessel 1.
The sCO2 mass flow rate msCO2 can be varied in the
SCARLETT test loop from about 30 to 110 g/s. The achievable
mass flow rate depends on the compressor performance map,
which leads to less mass flow rate at higher pressures and vice
versa. The sCO2 temperature at the inlet of the test section T06
can be varied by conditioning from about 0 °C to 40 °C and the
pressure P04 can be adjusted from about 75 bar to 110 bar.
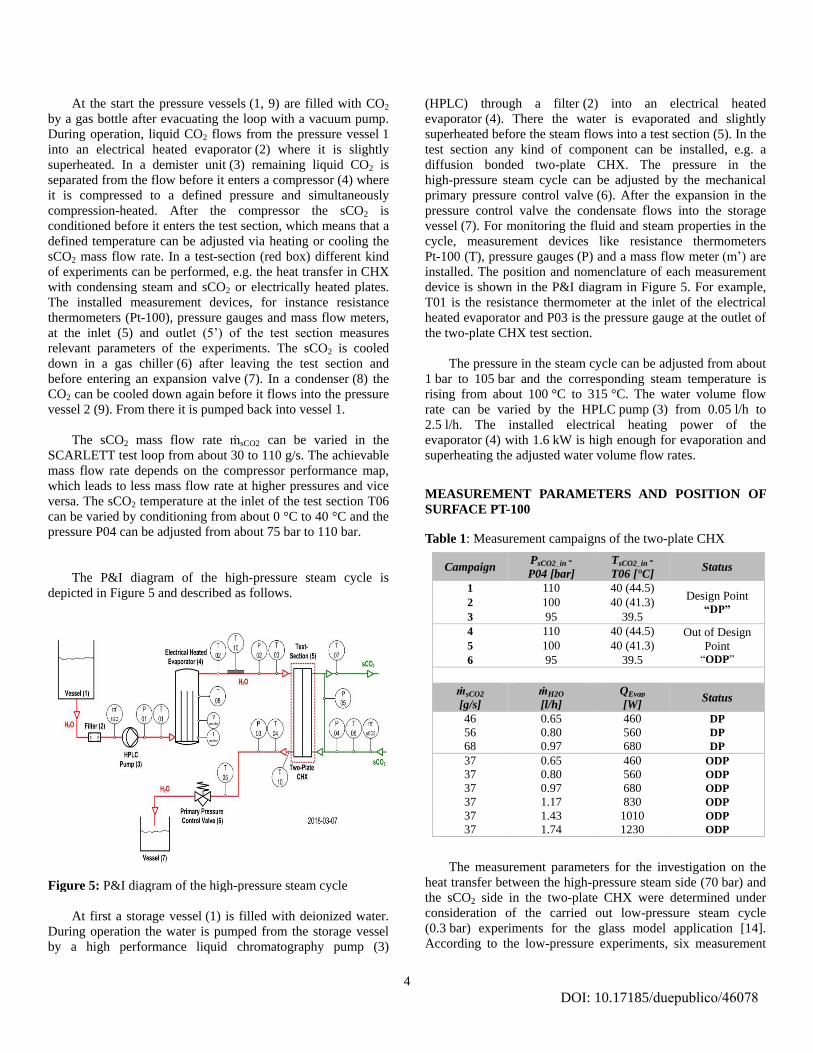
The P&I diagram of the high-pressure steam cycle is
depicted in Figure 5 and described as follows.
Figure 5: P&I diagram of the high-pressure steam cycle
At first a storage vessel (1) is filled with deionized water.
During operation the water is pumped from the storage vessel
by a high performance liquid chromatography pump (3)
(HPLC) through a filter (2) into an electrical heated
evaporator (4). There the water is evaporated and slightly
superheated before the steam flows into a test section (5). In the
test section any kind of component can be installed, e.g. a
diffusion bonded two-plate CHX. The pressure in the
high-pressure steam cycle can be adjusted by the mechanical
primary pressure control valve (6). After the expansion in the
pressure control valve the condensate flows into the storage
vessel (7). For monitoring the fluid and steam properties in the
cycle, measurement devices like resistance thermometers
Pt-100 (T), pressure gauges (P) and a mass flow meter (m’) are
installed. The position and nomenclature of each measurement
device is shown in the P&I diagram in Figure 5. For example,
T01 is the resistance thermometer at the inlet of the electrical
heated evaporator and P03 is the pressure gauge at the outlet of
the two-plate CHX test section.
The pressure in the steam cycle can be adjusted from about
1 bar to 105 bar and the corresponding steam temperature is
rising from about 100 °C to 315 °C. The water volume flow
rate can be varied by the HPLC pump (3) from 0.05 l/h to
2.5 l/h. The installed electrical heating power of the
evaporator (4) with 1.6 kW is high enough for evaporation and
superheating the adjusted water volume flow rates.
MEASUREMENT PARAMETERS AND POSITION OF
SURFACE PT-100
Table 1: Measurement campaigns of the two-plate CHX
Campaign PsCO2_in -
P04 [bar]
TsCO2_in -
T06 [°C] Status
1 110 40 (44.5) Design Point
“DP” 2 100 40 (41.3)
3 95 39.5
4 110 40 (44.5) Out of Design
Point “ODP”
5 100 40 (41.3)
6 95 39.5
msCO2
[g/s]
mH2O
[l/h]
QEvap
[W] Status
46 0.65 460 DP
56 0.80 560 DP
68 0.97 680 DP
37 0.65 460 ODP
37 0.80 560 ODP
37 0.97 680 ODP
37 1.17 830 ODP
37 1.43 1010 ODP
37 1.74 1230 ODP
The measurement parameters for the investigation on the
heat transfer between the high-pressure steam side (70 bar) and
the sCO2 side in the two-plate CHX were determined under
consideration of the carried out low-pressure steam cycle
(0.3 bar) experiments for the glass model application [14].
According to the low-pressure experiments, six measurement

5
DOI: 10.17185/duepublico/46078
campaigns were carried out in which different inlet conditions
on both sides (H2O and sCO2) of the two-plate CHX were used
to obtain experimental results of the heat transfer performance
under “design point” (DP) and “Out of the design point” (ODP)
conditions. It should be mentioned, that the measurement
parameters for the DP and ODP experiments were derived from
investigations at the glass model [11] and from internal
restrictions at the test facilities. To be able to compare the
results of both, the low-pressure and high-pressure steam cycle,
the same measurement campaigns were used (Table 1).
In the DP experiments according to campaign 1, 2 and 3
the sCO2 mass flow rates msCO2 from 46 g/s to 68 g/s
correspond to the water volume flow rates mH2O from 0.65 l/h to
0.97 l/h. The power of the electrical heated evaporator QEvap
was adjusted according to the water volume flow rates from
460 W to 680 W. To investigate the heat transfer capacity also
ODP, measurement campaign 4, 5 and 6 were done. Therefore,
a constant sCO2 mass flow rate msCO2 of 37 g/s and gradually
increasing water volume flow rates mH2O from 0.65 l/h to
1.74 l/h were used. The power of the electrical heated
evaporator QEvap was adjusted according to the water volume
flow rates from 460 W to 1230 W. To investigate the heat
transfer behavior additionally with different sCO2 inlet
pressures P04, new thermodynamic cycle calculations were
carried out for the sCO2-HeRo system to determine the sCO2
inlet temperatures T06 into the CHX. The results have led to a
temperature of T06 = 39.5 °C for P04 = 95 bar, T06 = 41.3 °C
for P04 = 100 bar and T06 = 44.5 °C for P04 = 110 bar.
Considering the internal restrictions of the SCARLETT test
facility, the maximum sCO2 inlet pressure was determined
to P04 = 110 bar and the inlet temperature to T06 = 40 °C.
For monitoring the temperatures on the surface of the CHX
during the investigation, nine resistance thermometers (Pt-100)
are mounted on the sCO2 plate. The position of each Pt-100 is
shown in the CAD drawing (Figure 6).
Figure 6: Pt-100 position on the sCO2 plate surface
The resistance thermometers are mounted symmetrically in
three levels on the surface of the sCO2 plate. Level 1 is located
30 mm above the sCO2 inlet plenum, level 2 is 45 mm above
level 1 and level 3 is 45 mm above level 2. The Pt-100 02, 05
and 08 are mounted in the center line of the sCO2 plate. Pt-100
01, 04 and 07 are located 15 mm on the left hand side of the
center line and Pt-100 03, 06 and 09 15 mm on the right hand
side of the center line.
EXPERIMENTAL RESULTS AND MEASUREMENT
ERRORS
The experimental results of the sCO2 pressure drop P05
in the two-plate CHX with 15 straight channels and a channel
dimension of 2x1 mm is shown in Figure 7 for the DP
experiments as a function of the sCO2 mass flow rate msCO2.
Figure 7: Results of P05 and msCO2 - DP
The results show, that an increased sCO2 mass flow rate
msCO2 leads to an increased pressure drop P05, for a constant
inlet pressure P04 and inlet temperature T06. For example, that
is shown by the 100 bar results, where a sCO2 mass flow rate
msCO2 = 45 g/s leads to a sCO2 pressure drop P05 = 0.17 bar,
55 g/s leads to 0.26 bar and 67 g/s leads to 0.37 bar. The results
additionally show that an increased inlet pressure P04 leads to
decreased sCO2 pressure drops P05 - for a constant mass
flow rate msCO2 and inlet temperature T06. This can be
explained by the equation of continuity and the fluid density.
The fluid density of sCO2 depends on the pressure and the
lower the pressure, the closer the pressure is to the critical
point, the lower is the density and due to that the higher is the
pressure drop for a given sCO2 mass flow rate because of
higher flow velocities in the channels. According to the results
depicted in Figure 7 a sCO2 inlet pressure P04 = 95 bar,
combined with an inlet temperature T06 = 40 °C and a mass
flow rate msCO2 = 56 g/s, leads to a pressure drop
P05 = 0.27 bar, P04 = 100 bar leads to P05 = 0.26 bar and
P04 = 110 bar leads to P05 = 0.24 bar.
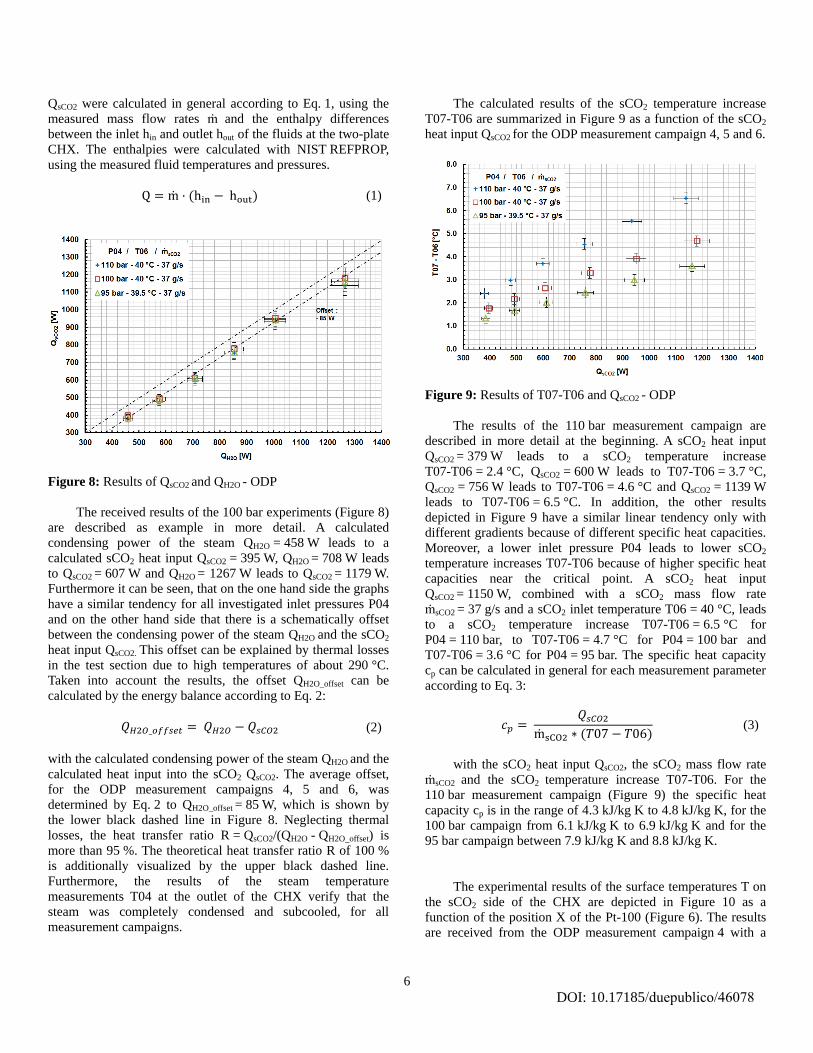
The results of the heat input into the sCO2 QsCO2 are
depicted in Figure 8 as a function of the condensing power of
the steam QH2O for the ODP experiments (Table 1). QH2O and
6
DOI: 10.17185/duepublico/46078
QsCO2 were calculated in general according to Eq. 1, using the
measured mass flow rates m and the enthalpy differences
between the inlet hin and outlet hout of the fluids at the two-plate
CHX. The enthalpies were calculated with NIST REFPROP,
using the measured fluid temperatures and pressures.
Q = m · (hin − hout) (1)
Figure 8: Results of QsCO2 and QH2O - ODP
The received results of the 100 bar experiments (Figure 8)
are described as example in more detail. A calculated
condensing power of the steam QH2O = 458 W leads to a
calculated sCO2 heat input QsCO2 = 395 W, QH2O = 708 W leads
to QsCO2 = 607 W and QH2O = 1267 W leads to QsCO2 = 1179 W.
Furthermore it can be seen, that on the one hand side the graphs
have a similar tendency for all investigated inlet pressures P04
and on the other hand side that there is a schematically offset
between the condensing power of the steam QH2O and the sCO2
heat input QsCO2. This offset can be explained by thermal losses
in the test section due to high temperatures of about 290 °C.
Taken into account the results, the offset QH2O_offset can be
calculated by the energy balance according to Eq. 2:
𝑄𝐻2𝑂_𝑜𝑓𝑓𝑠𝑒𝑡 = 𝑄𝐻2𝑂 − 𝑄𝑠𝐶𝑂2 (2)
with the calculated condensing power of the steam QH2O and the
calculated heat input into the sCO2 QsCO2. The average offset,
for the ODP measurement campaigns 4, 5 and 6, was
determined by Eq. 2 to QH2O_offset = 85 W, which is shown by
the lower black dashed line in Figure 8. Neglecting thermal
losses, the heat transfer ratio R = QsCO2/(QH2O - QH2O_offset) is
more than 95 %. The theoretical heat transfer ratio R of 100 %
is additionally visualized by the upper black dashed line.
Furthermore, the results of the steam temperature
measurements T04 at the outlet of the CHX verify that the
steam was completely condensed and subcooled, for all
measurement campaigns.
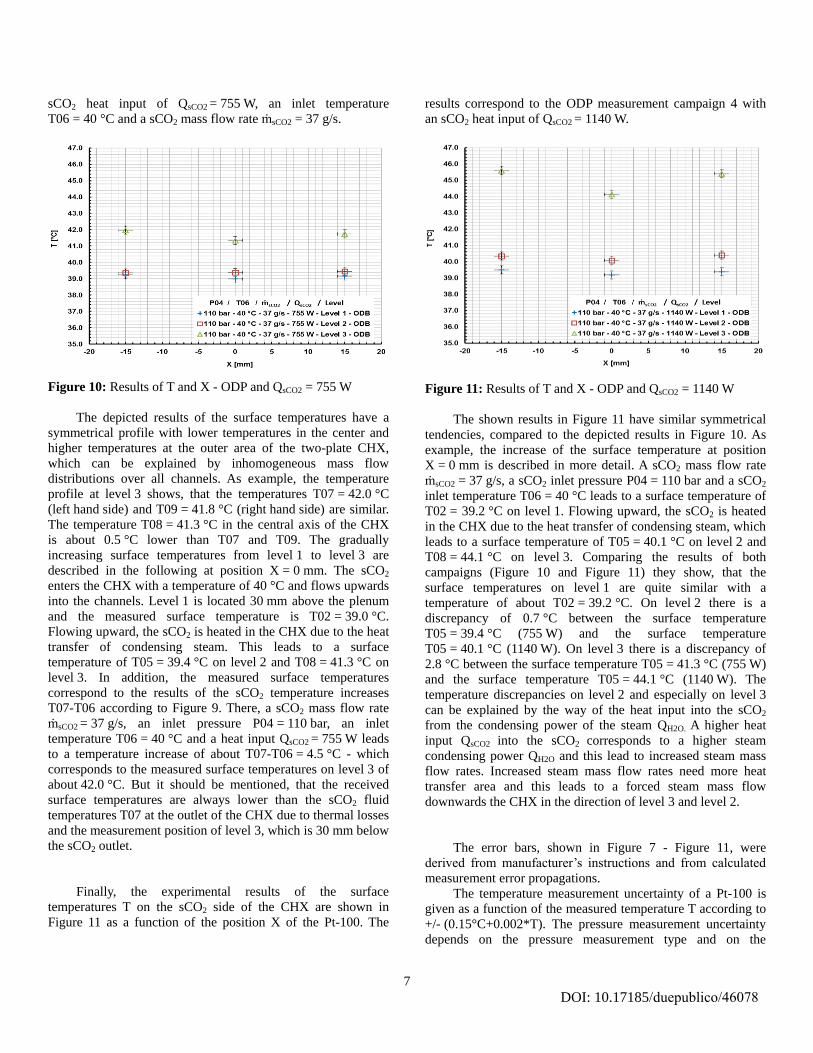
The calculated results of the sCO2 temperature increase
T07-T06 are summarized in Figure 9 as a function of the sCO2
heat input QsCO2 for the ODP measurement campaign 4, 5 and 6.
Figure 9: Results of T07-T06 and QsCO2 - ODP
The results of the 110 bar measurement campaign are
described in more detail at the beginning. A sCO2 heat input
QsCO2 = 379 W leads to a sCO2 temperature increase
T07-T06 = 2.4 °C, QsCO2 = 600 W leads to T07-T06 = 3.7 °C,
QsCO2 = 756 W leads to T07-T06 = 4.6 °C and QsCO2 = 1139 W
leads to T07-T06 = 6.5 °C. In addition, the other results
depicted in Figure 9 have a similar linear tendency only with
different gradients because of different specific heat capacities.
Moreover, a lower inlet pressure P04 leads to lower sCO2
temperature increases T07-T06 because of higher specific heat
capacities near the critical point. A sCO2 heat input
QsCO2 = 1150 W, combined with a sCO2 mass flow rate
msCO2 = 37 g/s and a sCO2 inlet temperature T06 = 40 °C, leads
to a sCO2 temperature increase T07-T06 = 6.5 °C for
P04 = 110 bar, to T07-T06 = 4.7 °C for P04 = 100 bar and
T07-T06 = 3.6 °C for P04 = 95 bar. The specific heat capacity
cp can be calculated in general for each measurement parameter
according to Eq. 3:
𝑐𝑝 = 𝑄𝑠𝐶𝑂2
msCO2 ∗ (𝑇07 − 𝑇06)(3)
with the sCO2 heat input QsCO2, the sCO2 mass flow rate
msCO2 and the sCO2 temperature increase T07-T06. For the
110 bar measurement campaign (Figure 9) the specific heat
capacity cp is in the range of 4.3 kJ/kg K to 4.8 kJ/kg K, for the
100 bar campaign from 6.1 kJ/kg K to 6.9 kJ/kg K and for the
95 bar campaign between 7.9 kJ/kg K and 8.8 kJ/kg K.
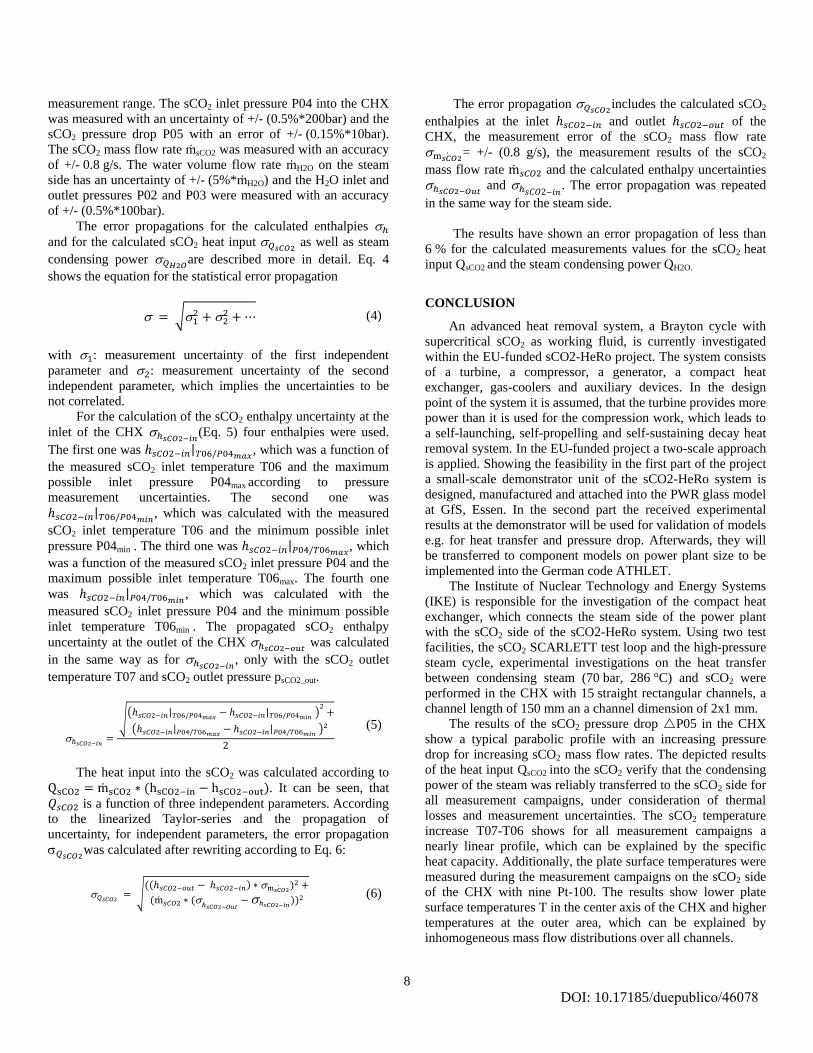
The experimental results of the surface temperatures T on
the sCO2 side of the CHX are depicted in Figure 10 as a
function of the position X of the Pt-100 (Figure 6). The results
are received from the ODP measurement campaign 4 with a
7
DOI: 10.17185/duepublico/46078
sCO2 heat input of QsCO2 = 755 W, an inlet temperature
T06 = 40 °C and a sCO2 mass flow rate msCO2 = 37 g/s.
Figure 10: Results of T and X - ODP and QsCO2 = 755 W
The depicted results of the surface temperatures have a
symmetrical profile with lower temperatures in the center and
higher temperatures at the outer area of the two-plate CHX,
which can be explained by inhomogeneous mass flow
distributions over all channels. As example, the temperature
profile at level 3 shows, that the temperatures T07 = 42.0 °C
(left hand side) and T09 = 41.8 °C (right hand side) are similar.
The temperature T08 = 41.3 °C in the central axis of the CHX
is about 0.5 °C lower than T07 and T09. The gradually
increasing surface temperatures from level 1 to level 3 are
described in the following at position X = 0 mm. The sCO2
enters the CHX with a temperature of 40 °C and flows upwards
into the channels. Level 1 is located 30 mm above the plenum
and the measured surface temperature is T02 = 39.0 °C.
Flowing upward, the sCO2 is heated in the CHX due to the heat
transfer of condensing steam. This leads to a surface
temperature of T05 = 39.4 °C on level 2 and T08 = 41.3 °C on
level 3. In addition, the measured surface temperatures
correspond to the results of the sCO2 temperature increases
T07-T06 according to Figure 9. There, a sCO2 mass flow rate
msCO2 = 37 g/s, an inlet pressure P04 = 110 bar, an inlet
temperature T06 = 40 °C and a heat input QsCO2 = 755 W leads
to a temperature increase of about T07-T06 = 4.5 °C - which
corresponds to the measured surface temperatures on level 3 of
about 42.0 °C. But it should be mentioned, that the received
surface temperatures are always lower than the sCO2 fluid
temperatures T07 at the outlet of the CHX due to thermal losses
and the measurement position of level 3, which is 30 mm below
the sCO2 outlet.
Finally, the experimental results of the surface
temperatures T on the sCO2 side of the CHX are shown in
Figure 11 as a function of the position X of the Pt-100. The
results correspond to the ODP measurement campaign 4 with
an sCO2 heat input of QsCO2 = 1140 W.
Figure 11: Results of T and X - ODP and QsCO2 = 1140 W
The shown results in Figure 11 have similar symmetrical
tendencies, compared to the depicted results in Figure 10. As
example, the increase of the surface temperature at position
X = 0 mm is described in more detail. A sCO2 mass flow rate
msCO2 = 37 g/s, a sCO2 inlet pressure P04 = 110 bar and a sCO2
inlet temperature T06 = 40 °C leads to a surface temperature of
T02 = 39.2 °C on level 1. Flowing upward, the sCO2 is heated
in the CHX due to the heat transfer of condensing steam, which
leads to a surface temperature of T05 = 40.1 °C on level 2 and
T08 = 44.1 °C on level 3. Comparing the results of both
campaigns (Figure 10 and Figure 11) they show, that the
surface temperatures on level 1 are quite similar with a
temperature of about T02 = 39.2 °C. On level 2 there is a
discrepancy of 0.7 °C between the surface temperature
T05 = 39.4 °C (755 W) and the surface temperature
T05 = 40.1 °C (1140 W). On level 3 there is a discrepancy of
2.8 °C between the surface temperature T05 = 41.3 °C (755 W)
and the surface temperature T05 = 44.1 °C (1140 W). The
temperature discrepancies on level 2 and especially on level 3
can be explained by the way of the heat input into the sCO2
from the condensing power of the steam QH2O. A higher heat
input QsCO2 into the sCO2 corresponds to a higher steam
condensing power QH2O and this lead to increased steam mass
flow rates. Increased steam mass flow rates need more heat
transfer area and this leads to a forced steam mass flow
downwards the CHX in the direction of level 3 and level 2.
The error bars, shown in Figure 7 - Figure 11, were
derived from manufacturer’s instructions and from calculated
measurement error propagations.
The temperature measurement uncertainty of a Pt-100 is
given as a function of the measured temperature T according to
+/- (0.15°C+0.002*T). The pressure measurement uncertainty
depends on the pressure measurement type and on the
8
DOI: 10.17185/duepublico/46078
measurement range. The sCO2 inlet pressure P04 into the CHX
was measured with an uncertainty of +/- (0.5%*200bar) and the
sCO2 pressure drop P05 with an error of +/- (0.15%*10bar).
The sCO2 mass flow rate msCO2 was measured with an accuracy
of +/- 0.8 g/s. The water volume flow rate mH2O on the steam
side has an uncertainty of +/- (5%*mH2O) and the H2O inlet and
outlet pressures P02 and P03 were measured with an accuracy
of +/- (0.5%*100bar).
The error propagations for the calculated enthalpies ℎ
and for the calculated sCO2 heat input 𝑄𝑠𝐶𝑂2 as well as steam
condensing power 𝑄𝐻2𝑂are described more in detail. Eq. 4
shows the equation for the statistical error propagation
= √12 + 2
2 + ⋯ (4)
with 1: measurement uncertainty of the first independent
parameter and 2: measurement uncertainty of the second
independent parameter, which implies the uncertainties to be
not correlated.
For the calculation of the sCO2 enthalpy uncertainty at the
inlet of the CHX ℎ𝑠𝐶𝑂2−𝑖𝑛(Eq. 5) four enthalpies were used.
The first one was ℎ𝑠𝐶𝑂2−𝑖𝑛|𝑇06/𝑃04𝑚𝑎𝑥, which was a function of
the measured sCO2 inlet temperature T06 and the maximum
possible inlet pressure P04max according to pressure
measurement uncertainties. The second one was
ℎ𝑠𝐶𝑂2−𝑖𝑛|𝑇06/𝑃04𝑚𝑖𝑛, which was calculated with the measured
sCO2 inlet temperature T06 and the minimum possible inlet
pressure P04min . The third one was ℎ𝑠𝐶𝑂2−𝑖𝑛|𝑃04/𝑇06𝑚𝑎𝑥, which
was a function of the measured sCO2 inlet pressure P04 and the
maximum possible inlet temperature T06max. The fourth one
was ℎ𝑠𝐶𝑂2−𝑖𝑛|𝑃04/𝑇06𝑚𝑖𝑛, which was calculated with the
measured sCO2 inlet pressure P04 and the minimum possible
inlet temperature T06min . The propagated sCO2 enthalpy
uncertainty at the outlet of the CHX ℎ𝑠𝐶𝑂2−𝑜𝑢𝑡 was calculated
in the same way as for ℎ𝑠𝐶𝑂2−𝑖𝑛, only with the sCO2 outlet
temperature T07 and sCO2 outlet pressure psCO2_out.
ℎ𝑠𝐶𝑂2−𝑖𝑛=
√(ℎ𝑠𝐶𝑂2−𝑖𝑛|𝑇06/𝑃04𝑚𝑎𝑥
− ℎ𝑠𝐶𝑂2−𝑖𝑛|𝑇06/𝑃04𝑚𝑖𝑛 )
2+
(ℎ𝑠𝐶𝑂2−𝑖𝑛|𝑃04/𝑇06𝑚𝑎𝑥− ℎ𝑠𝐶𝑂2−𝑖𝑛|𝑃04/𝑇06𝑚𝑖𝑛
)²
2
(5)
The heat input into the sCO2 was calculated according to
QsCO2 = msCO2 ∗ (hsCO2−in − hsCO2−out). It can be seen, that
𝑄𝑠𝐶𝑂2 is a function of three independent parameters. According
to the linearized Taylor-series and the propagation of
uncertainty, for independent parameters, the error propagation
𝑄𝑠𝐶𝑂2was calculated after rewriting according to Eq. 6:
𝑄𝑠𝐶𝑂2 = √
((ℎ𝑠𝐶𝑂2−𝑜𝑢𝑡 − ℎ𝑠𝐶𝑂2−𝑖𝑛) ∗ m𝑠𝐶𝑂2 )2 +
(m𝑠𝐶𝑂2 ∗ (ℎ𝑠𝐶𝑂2−𝑂𝑢𝑡
−ℎ𝑠𝐶𝑂2−𝑖𝑛))2 (6)
The error propagation 𝑄𝑠𝐶𝑂2includes the calculated sCO2
enthalpies at the inlet ℎ𝑠𝐶𝑂2−𝑖𝑛 and outlet ℎ𝑠𝐶𝑂2−𝑜𝑢𝑡 of the
CHX, the measurement error of the sCO2 mass flow rate
m𝑠𝐶𝑂2 = +/- (0.8 g/s), the measurement results of the sCO2
mass flow rate m𝑠𝐶𝑂2 and the calculated enthalpy uncertainties
ℎ𝑠𝐶𝑂2−𝑂𝑢𝑡 and ℎ𝑠𝐶𝑂2−𝑖𝑛
. The error propagation was repeated
in the same way for the steam side.
The results have shown an error propagation of less than
6 % for the calculated measurements values for the sCO2 heat
input QsCO2 and the steam condensing power QH2O.
CONCLUSION
An advanced heat removal system, a Brayton cycle with
supercritical sCO2 as working fluid, is currently investigated
within the EU-funded sCO2-HeRo project. The system consists
of a turbine, a compressor, a generator, a compact heat
exchanger, gas-coolers and auxiliary devices. In the design
point of the system it is assumed, that the turbine provides more
power than it is used for the compression work, which leads to
a self-launching, self-propelling and self-sustaining decay heat
removal system. In the EU-funded project a two-scale approach
is applied. Showing the feasibility in the first part of the project
a small-scale demonstrator unit of the sCO2-HeRo system is
designed, manufactured and attached into the PWR glass model
at GfS, Essen. In the second part the received experimental
results at the demonstrator will be used for validation of models
e.g. for heat transfer and pressure drop. Afterwards, they will
be transferred to component models on power plant size to be
implemented into the German code ATHLET.
The Institute of Nuclear Technology and Energy Systems
(IKE) is responsible for the investigation of the compact heat
exchanger, which connects the steam side of the power plant
with the sCO2 side of the sCO2-HeRo system. Using two test
facilities, the sCO2 SCARLETT test loop and the high-pressure
steam cycle, experimental investigations on the heat transfer
between condensing steam (70 bar, 286 °C) and sCO2 were
performed in the CHX with 15 straight rectangular channels, a
channel length of 150 mm an a channel dimension of 2x1 mm.
The results of the sCO2 pressure drop P05 in the CHX
show a typical parabolic profile with an increasing pressure
drop for increasing sCO2 mass flow rates. The depicted results
of the heat input QsCO2 into the sCO2 verify that the condensing
power of the steam was reliably transferred to the sCO2 side for
all measurement campaigns, under consideration of thermal
losses and measurement uncertainties. The sCO2 temperature
increase T07-T06 shows for all measurement campaigns a
nearly linear profile, which can be explained by the specific
heat capacity. Additionally, the plate surface temperatures were
measured during the measurement campaigns on the sCO2 side
of the CHX with nine Pt-100. The results show lower plate
surface temperatures T in the center axis of the CHX and higher
temperatures at the outer area, which can be explained by
inhomogeneous mass flow distributions over all channels.
9
DOI: 10.17185/duepublico/46078
NOMENCLATURE
Variable Description Unit
cp Heat Capacity kJ/kg K
ℎ Enthalpy kJ/kg K
m Mass Flow kg/s
𝑃 Pressure bar
∆𝑃 Pressure Drop bar
𝑄 Heat Power W
R Heat Transfer Ratio %
T Temperature °C
TO Temperature Surface °C
X Position mm
Measurement uncertainty -
Subscripts Description Unit
H20 Steam / Water -
H20_offset Thermal Losses -
in Inlet -
Evap Evaporator -
out Outlet -
sCO2 Supercritical Carbon Dioxide -
ABBREVIATIONS
Variable Description Unit
ATHLET Analysis of Thermal-hydraulic of
Leaks and Transients -
BWR Boiling Water Reactor -
CHX Compact Heat Exchanger -
COMSOL Comsol Multiphysics -
DP Design Point -
EU European Union -
GfS Gesellschaft für
Simulatorschulung mbH -
HeRo Heat Removal -
HPLC High Performance Liquid
Chromatography -
IKE Institute of Nuclear Technology
and Energy Systems -
LUHS Loss of Ultimate Heat Sink -
ODP Out of Design Point -
P&I Piping and Instrumentation -
PWR Pressurized Water Reactor -
SCARLETT Supercritical Carbon Dioxide
Loop at IKE Stuttgart -
SBO Station Black Out -
sCO2 Supercritical Carbon Dioxide -
TCS Turbo-Compressor-System -
TRL Technology Readiness Level -
USTUTT University of Stuttgart -
The project leading to this application has
received funding from the Euratom research
and training programme 2014-2018 under
grant agreement No 662116.
REFERENCES
[1] J. VENKER, “Development and Validation of Models for
Simulation of Supercritical Carbon Dioxide Brayton
Cycle and Application to Self-Propelling Heat Removal
Systems in Boiling Water Reactors”, University of
Stuttgart, IKE2-156, ISSN-0173-6892 (2015).
[2] J. VENKER, “A passive heat removal retrofit for BWRs”,
Nuclear Engineering International, 58, 711, 14-17 (2013).
[3] J. VENKER, J. STARFLINGER and A. SCHAFFRATH,
“Code Development and Simulation of the supercritical
CO2 Heat Removal System”, Proceedings of the
European Nuclear Conference, Warsaw, Poland, October
9-13 (2016).
[4] J. VENKER, D. VON LAVANTE, M. BUCK, D. GITZEL
and J. STARFLINGER, "Interaction between Retrofittable
and Existing Emergency Cooling Systems in BWRs”,
Proceedings of the 10th International Topical Meeting on
Nuclear Thermal-Hydraulics, Operation and Safety,
NUTHOS-10, Okinawa, Japan (2014).
[5] J. VENKER, D. VON LAVANTE, M. BUCK, D.
GITZEL, and J. STARFLINGER, "Transient Analysis of
an Autarkic Heat Removal System", Proceedings of the
2014 International Congress on Advances in Nuclear
Power Plants, ICAPP 2014, Charlotte, USA (2014).
[6] J. VENKER, D. VON LAVANTE, M. BUCK, D.
GITZEL, J. STARFLINGER, "Concept of a Passive
Cooling System to Retrofit Existing Boiling Water
Reactors", Proceedings of the 2013 International Congress
on Advances in Nuclear Power Plants, ICAPP 2013, Jeju,
South Korea (2013).
[7] K-F. BENRA, D. BRILLERT, O. FRYBORT, P. HAJEK,
M. ROHDE, S. SCHUSTER, M. SEEWALD and J.
STARFLINGER, “A Supercritical CO2 Low Temperature
Brayton-Cycle for Residual Heat Removal”, Proceedings
of the 5th International sCO2 Power Cycles Symposium,
San Antonio, Texas (2016).
[8] M. STRAETZ, R. MERTZ and J. STARFLINGER,
“Power cycle calculations and preliminary design of a
compact heat exchanger of a scaled down sCO2-HeRo-
system for a PWR glass model at KSG/GfS”, 1st European
Seminar on Supercritical CO2 (sCO2) Power Systems, 29-
30 September 2016, Vienna, Austria (2016).
ACKNOWLEDGEMENTS
10
DOI: 10.17185/duepublico/46078
[9] P. HAJEK, “Advantages Analysis of Supercritical Power
CO2 Cycles”, 1st European Seminar on Supercritical CO2
(sCO2) Power Systems, 29-30 September 2016, Vienna,
Austria (2016).
[10] W. FLAIG, R. MERTZ, and J. STARFLINGER, “Setup of
the supercritical CO2 test-facility „SCARLETT“ for basic
experimental investigations of a compact heat exchanger
for an innovative decay heat removal system”,
Proceedings of the 25th international conference on
nuclear engineering, ICONE25, 02-06 July 2017,
Shanghai, China (2017).
[11] M. SEEWALD and M. STRAETZ, “Deliverable No. 1.1 -
Release thermodynamic cycle parameter”, sCO2-HeRo
Project (2015).
[12] M. STRAETZ and S. SCHUSTER, “Milestone No. 1.1 -
Review control characteristics/ strategy/ number of sCO2-
HeRo turbo-machine sets for parallel use”, sCO2-HeRo
Project (2016).
[13] J. E. HESSELGREAVES, “Compact Heat Exchangers -
Selection, Design and Operation”, Pergamon, Amsterdam
– London – New York – Oxford – Paris – Shannon –
Tokyo (2001).
[14] M. STRAETZ, R. MERTZ and J. STARFLINGER,
“’Design of a compact heat exchanger and heat transfer
investigations of a scaled down sCO2-HeRo system”,
Proceedings of the 2018 International Congress on
Advances in Nuclear Power Plants, ICAPP 2018,
08-11 April 2018, Charlotte, USA (2018).