experimental investigations on compression behavior parameters of nsc and scc intermediate rc...
TRANSCRIPT

http://www.iaeme.com/IJCIET/index.asp 100 [email protected]
International Journal of Civil Engineering and Technology (IJCIET)
Volume 6, Issue 8, Aug 2015, pp. 100-117, Article ID: IJCIET_06_08_008
Available online at
http://www.iaeme.com/IJCIET/issues.asp?JTypeIJCIET&VType=6&IType=8
ISSN Print: 0976-6308 and ISSN Online: 0976-6316
© IAEME Publication
___________________________________________________________________________
EXPERIMENTAL INVESTIGATIONS ON
COMPRESSION BEHAVIOR PARAMETERS
OF NSC AND SCC INTERMEDIATE RC
COLUMNS
Prabhakara R
Professor and Head, Civil Engineering,
M. S. Ramaiah Institute of Technology, Karnataka, India
Chethankumar N E
Research Scholar, Civil Engineering,
M. S. Ramaiah Institute of Technology, Karnataka, India
Atul Gopinath
Research Scholar, Civil Engineering,
M. S. Ramaiah Institute of Technology, Karnataka, India
Sanjith J
Research Scholar, Civil Engineering,
Adhichunchangiri Institute of Technology, Karnataka, India
ABSTRACT
A total of six intermediate columns with same cross sectional area of
125mm X 125mm were cast and tested. Experimental study was conducted to
know the behavior of intermediate columns under axial load made out of
Normal strength concrete (NSC) and Self-compacting concrete (SCC). Main
objective of this study was to compare the behavior of NSC intermediate
columns and SCC intermediate columns for various percentage of steel. Axial
load ratio, stiffness ratio were the main parameters which increased as the
axial load increased. However in this study, special attention was given on
stiffness degradation, energy absorption, ultimate load carrying capacity,
shortening index of each intermediate column. The results showed that
shortening index, axial load ratio, stiffness ratio and stiffness degradation
increased with increase in axial load. On the other hand as the percentage of
steel increased the ultimate load carrying capacity increased while shortening
index and stiffness degradation decreased. SCC had ultimate load carrying
capacity and ultimate deflection more than NSC for same percentage of steel.

Experimental Investigations On Compression Behavior Parameters of NSC and SCC
Intermediate RC Columns
http://www.iaeme.com/IJCIET/index.asp 101 [email protected]
Key words: Slenderness Ratio, Percentage of Steel, Axial Load Ratio,
Stiffness Ratio, Stiffness Degradation, Shortening Index
Cite this Article: Prabhakara R, Chethankumar N E, Atul Gopinath and
Sanjith J. Experimental Investigations on Compression Behavior Parameters
of NSC and SCC Intermediate RC Columns. International Journal of Civil
Engineering and Technology, 6(8), 2015, pp. 100-117.
http://www.iaeme.com/IJCIET/issues.asp?JTypeIJCIET&VType=6&IType=8
1. INTRODUCTION
Reinforced concrete (RC) has become one of the most important building materials
and is widely used in many types of engineering structures. The economy, the
efficiency, the strength and the stiffness of reinforced concrete make it an attractive
material for a wide range of structural applications. For its use as structural material,
concrete must satisfy the following conditions.
The structure must be strong and safe, stiff and appear unblemished and should be
economical.
Columns are major structural supporting elements which carries beam load from
super-structure and transfers to the footings. Columns should be strong by both its
intrinsic and extrinsic factors in order to get more strength and durability. Many have
been studied the behaviour of columns by both analytically as well as experimentally
so some of the important factor on which column strength depends on young’s
modulus, characteristic compressive strength, material grades, stiffness and
slenderness ratio. Axial load on a perfectly straight slender column with elastic
material property is increased in magnitude. A compression member subjected to pure
axial load rarely occurs in practice. All columns are subjected to some moment which
may be due to accidental eccentricity or due to end restraint imposed by
monolithically placed beams or slabs. Even though many research works have been
conducted, only they used EURO codes, Chinese codes, but investigations are
required based on IS codes.
Hugo Rodrigues et al studied on Behavior of reinforced concrete column under
biaxial cyclic loading [6], X. Zeng et al studied on axial compression behaviour of RC
columns under rapid loading [5], Jiaquan Zhong et al informed about “Stiffness
degradation and time cracking of cover concrete in reinforced concrete structures
subject to corrosion [14] , R. Jansson et al conducted study on“Factor influencing fire
spalling of self-compacting concrete [13]”, A.Bourouz et al studied about
“Confinement of high strength concrete columns with CFRP sheets”(2014)[7], Bing li
studied on “Initial stiffness of reinforced concrete columns and walls” in 2012[8], Jia
Jinquing, Jiang Rui (2007) “Dynamic analysis of steel reinforced super high strength
concrete columns”[9]and the author Biswajit Basu Identified of stiffness degradation
in structures using wavelet analysis [11]. In this study axial load was applied to know
the structural performance of intermediate columns.
2. SCOPE OF PRESENT INVESTIGATION
1. To obtain M30 grade NSC and SCC mix using 20mm and 12.5mm coarse
aggregate respectively.
2. Observation of load transfer mechanism in NSC and SCC Intermediate columns
with different reinforcement percentage tested under axial load.

Prabhakara R, Chethankumar N E, Atul Gopinath and Sanjith J
http://www.iaeme.com/IJCIET/index.asp 102 [email protected]
3. To observe the compression behavior and variation in load deflection of
intermediate RC columns for different reinforcement ratio and slenderness ratio.
4. Evaluation of shortening index, energy absorption over intermediate RC column
made out of NSC and SCC.
5. Understanding the stiffness degradation and the parameters which influence it in
NSC and SCC.
6. Analyzing the data on the compression behavior of RC columns with respect to
geometric properties, concrete, reinforcement ratio.
3. MATERIALS AND MIX PROPORTIONS
The following materials were used in the present investigation.
Cement: 43 Grade OPC as per IS 12269- 1989 with specific gravity 3.15.
Fly Ash: Fly Ash conforming to ClassF IS 3812:2003.
Coarse Aggregates: 20mm downsize Aggregates with specific gravity 2.65 for NSC.
12.5mm down size aggregates with specific gravity 2.62 for SCC. Coarse aggregates
were conforming IS 383:1970[20].
Fine Aggregates: Manufactured Sand with specific gravity 2.57 and Fineness
Modulus 3.05 conforming to zone II of IS 383:1970[20].
Super Plasticizers: Naphthalene based polymer. Glenium B233 Modified poly-
carboxylic ether for SCC.
Viscosity Modifying Agent: Glenium Stream 2 for SCC. Steel: longitudinal
reinforcement varied as 2.01%, 2.89% and 5.15%.and lateral ties 8mm at 125mm c/c.
Water: Potable water conforming to IS 456:2000[18].
3.1. Mix Proportions
Mix design adopted for the present investigations are as follows: NSC M-30 as per
IS 10262:2009[19]; SCC M-30 NAN–SU method [16] and it is shown in Table 1.
Table 1 Mix Proportions of NSC, SCC.
Based on the literature review and series of trial and errors the dimension of the
column specimen was chosen. The specimens were cast using moulds of
125x125x1500mm. The specimens were reinforced with cage reinforcement of 8mmɸ
tie bars 125mm c/c and longitudinal reinforcement of 2.09%, 2.89% and 5.15%.
(TORKARI) of Fe500.
NSC SCC
Cement in kg/m3 348.33 214.28
Fly Ash in kg/m3 - 248.43
Fine Aggregates in kg/m3 681.66 925.63
Coarse Aggregates in kg/m3 1146.8 (20mm) 743.69 (12.5 mm)
Water in lit/m3 191.58 148.07
Super Plasticizer - 1.3%
VMA - 0.18%

Experimental Investigations On Compression Behavior Parameters of NSC and SCC
Intermediate RC Columns
http://www.iaeme.com/IJCIET/index.asp 103 [email protected]
Figure 1 Cross Section Details Figure 2 Schematic diagram of column specimen with
cage reinforcement
In the present investigation, a total of six column specimens were cast using
different category of concretes such as NSC (M30) and SCC (M30). Slenderness ratio
12 was maintained to study the behavior of intermediate RC columns. In all the
columns a constant cross sectional area of 125mm 125mm was maintained. Height
of intermediate column was 1.5m. The dimensions of the columns are arrived based
on the literature and the facility available in the lab. The typical pattern of column
with cross section (125mmX125mm) and varying longitudinal reinforcement is as
shown in Fig 1 and Fig 2.
The results of cube compressive strength of different grades of concretes NSC,
SCC after trail mixes used to cast column specimens is as tabulated in the Table 2.
Table 2 Cube Compressive Strength
4. TESTING ARRANGEMENT AND TESTING PROCEDURE
All the columns were white washed after the curing period was completed and
mounted on the loading frame capacity of 1000 KN. All the columns were fixed on
both ends with an effective span of 1.46m. A typical loading arrangement of
intermediate column is shown in the Fig 3. Two cross bars were provided for
intermediate columns to prevent the danger of sudden lateral movements.
Concrete type and max.
aggregate size Grade of concrete
Average Cube compressive
strength, fck (MPa)
28days
NSC M30 37.52
SCC M30 44.29

Prabhakara R, Chethankumar N E, Atul Gopinath and Sanjith J
http://www.iaeme.com/IJCIET/index.asp 104 [email protected]
NSC SCC
Figure 3 Test setup of a typical
columns
Figure 4 Cracked surfaces of failed column specimens
Load was applied using hydraulic jack and observations were made on these
parameters such as deflection, cracks and the failure pattern. This was continued for
every increment of load till this structural or functional failure. Cracked surface of
failed column specimens are shown in Fig 4. All the intermediate RC Columns
experienced crushing failure as shown in Fig 5.
Figure 5 Crack and failure patterns of intermediate columns
The Table 3 shows the test results of all the six columns. For each specimen by
applying axial load, ultimate Load Pu (Exp) and axial deformation (∆u) was observed.
Using Pu (Exp) and ∆u, Energy Absorption (EA), Shortening Index (SI), Axial Load
Ratio (ALR) and Stiffness Ratio (SR) was calculated. fck is the cube compressive
strength.

Experimental Investigations On Compression Behavior Parameters of NSC and SCC
Intermediate RC Columns
http://www.iaeme.com/IJCIET/index.asp 105 [email protected]
Table 3 Test results of the Column Specimen
The specimens are named as follows. NSC/12/2.09 means type of
concrete/slenderness ratio/longitudinal percentage of steel.
5. RESULTS AND DISCUSSIONS
A detailed analysis has been carried out on the following parameters to understand
structural performance of RC columns.
Load deflection behavior
Ultimate load
Energy absorption
Shortening index
Axial load ratio and stiffness ratio
Stiffness degradation
5.1 Load Deformation Behavior of RC Columns
An important aspect in the analysis and design of structures relates to the
deformations caused by the loads applied to a structure. Clearly it is important to
avoid deformations so large that they may prevent the structure from fulfilling the
purpose for which it is intended. But the analysis of deformations may also help us in
the determination of stresses. To determine the actual distribution of stresses within a
member, it is necessary to analyze the deformations which take place in that member.
This project deals with the deformations of column under axial loading. Section 5.1.1
covers the compression behavior of intermediate RC columns.
5.1.1 Load Deformation Behavior of Intermediate RC Columns.
The graphical representation of load-deformation behavior for intermediate columns
is as shown in Fig 6 and Fig 7.
SPECIMEN fck
(MPa) Pcr (kN)
Pu(Exp)
(kN)
∆u
(mm)
E A
(kN-
mm)
S I A L
R S R FAILURE
NSC/12/2.09 37.50 189.90 500.00 9.87 2248.3 0.0066 1.38 54.14 Crushing
NSC/12/2.89 37.50 177.77 518.99 7.54 4111.3 0.0050 1.43 56.68 Crushing
NSC/12/5.15 37.50 240.51 556.62 6.96 3525.8 0.0046 1.53 61.89 Crushing
SCC/12/2.09 43.16 215.19 495.00 9.20 3553.3 0.0061 1.23 47.39 Crushing
SCC/12/2.89 43.16 240.51 520.35 9.15 3672.8 0.0061 1.29 50.25 Crushing
SCC/12/5.15 43.16 253.16 632.91 6.95 4242.6 0.0046 1.57 64.04 Crushing

Prabhakara R, Chethankumar N E, Atul Gopinath and Sanjith J
http://www.iaeme.com/IJCIET/index.asp 106 [email protected]
0.00
100.00
200.00
300.00
400.00
500.00
600.00
700.00
0.00 5.00 10.00
AX
IAL
LOA
D (
kN)
AXIAL DEFORMATION(mm)
SCC 16
SCC 12
SCC 10
Figure 6 Combined load-deformation curve for NSC intermediate RC columns
From the Fig 6, it is clear that NSC10, NSC12 and NSC16 intermediate columns have
maximum axial deformations 9.87mm, 7.54mm and 6.96mm at an ultimate loads of
494.42kN, 518.99kN and 556.62kN respectively. Also it is evident that with increase
in percentage of steel, axial load carrying capacity has been increased whereas axial
deformations decreased.
Figure 7 Combined load-deformation curve for SCC intermediate RC columns
Fig 7 shows the graphical representation of the axial load vs axial deformation for
SCC with varying percentage of reinforcement. It is noticeable that, SCC10, SCC12
and SCC16 intermediate columns have maximum axial deformations 9.2mm, 9.15mm
and 6.95mm at an ultimate loads of 495kN, 520.35kN and 632.91kN respectively.
With increase in percentage of steel, axial deformation decreased whereas load
carrying capacity increased.
Following graphs show the comparison of axial load vs axial deformation for NSC
and SCC intermediate columns with same percentage of steel reinforcement.
0.00
100.00
200.00
300.00
400.00
500.00
600.00
0.00 5.00 10.00 15.00
AX
IAL
LOA
D (
kN)
AXIAL DEFORMATION (mm)
NSC 16
NSC 12
NSC 10

Experimental Investigations On Compression Behavior Parameters of NSC and SCC
Intermediate RC Columns
http://www.iaeme.com/IJCIET/index.asp 107 [email protected]
0.00
100.00
200.00
300.00
400.00
500.00
600.00
0.00 2.00 4.00 6.00 8.00 10.00
AX
IAL
LOA
D (
kN)
AXIAL DEFORMATION (mm)
NSC 12
SCC 12
0.00
100.00
200.00
300.00
400.00
500.00
600.00
700.00
0.00 2.00 4.00 6.00 8.00
AX
IAL
LOA
D (
kN)
AXIAL DEFORMATION (mm)
NSC 16
SCC 16
Figure 8 Combined load-deformation curve-2.09%
Figure 9 Combined load-deformation curve-2.89%
Figure 10 Combined load-deformation curve- 5.15%
From the Fig 8, Fig 9 and Fig 10 it has been observed that, the SCC intermediate
columns carried more load than the NSC intermediate columns with same
reinforcement %. But ultimate deformation of SCC intermediate columns was more
0.00
100.00
200.00
300.00
400.00
500.00
600.00
0.00 2.00 4.00 6.00 8.00 10.00 12.00
AX
IAL
LOA
D (
kN)
AXIAL DEFORMATION (mm)
NSC 10
SCC 10
Prabhakara R, Chethankumar N E, Atul Gopinath and Sanjith J
http://www.iaeme.com/IJCIET/index.asp 108 [email protected]
than NSC intermediate columns of same reinforcement percentage (this is because
SCC has less young’s modulus ‘E’ than NSC, thus its flexural rigidity ‘EI’ is less).
Load carrying capacity for SCC/12/2.09 was 1.01% lesser and SCC/12/5.15 was
12.05% higher compared to NSC/12/2.09 and NSC/12/5.15 columns respectively.
But, the load carrying capacity for SCC/12/2.89 and NSC/12/2.89 was approximately
equal.
Axial deformation for SCC/12/2.09 was 6.71% lesser and SCC/12/2.89 was
21.35% higher compared to NSC/12/2.09 and NSC/12/2.89 columns respectively.
But, the axial deformation for SCC/12/5.15 and NSC/12/5.15 was approximately
equal.
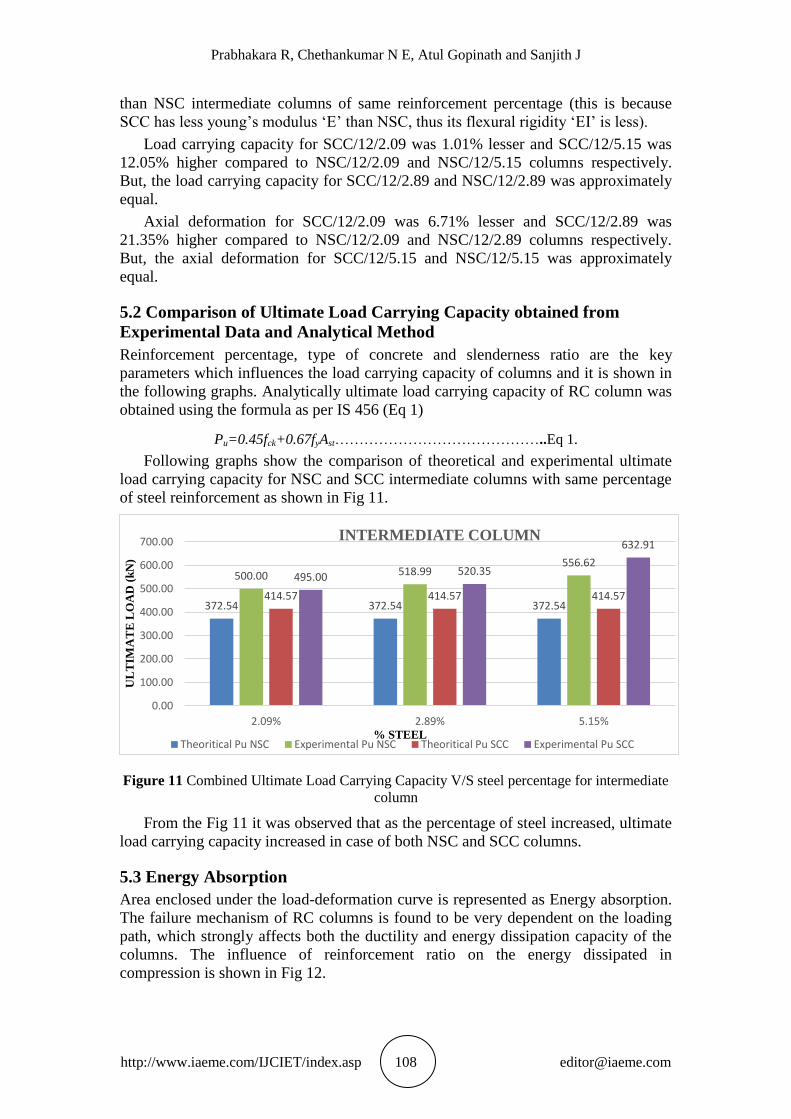
5.2 Comparison of Ultimate Load Carrying Capacity obtained from
Experimental Data and Analytical Method
Reinforcement percentage, type of concrete and slenderness ratio are the key
parameters which influences the load carrying capacity of columns and it is shown in
the following graphs. Analytically ultimate load carrying capacity of RC column was
obtained using the formula as per IS 456 (Eq 1)
Pu=0.45fck+0.67fyAst……………………………………..Eq 1.
Following graphs show the comparison of theoretical and experimental ultimate
load carrying capacity for NSC and SCC intermediate columns with same percentage
of steel reinforcement as shown in Fig 11.
Figure 11 Combined Ultimate Load Carrying Capacity V/S steel percentage for intermediate
column
From the Fig 11 it was observed that as the percentage of steel increased, ultimate
load carrying capacity increased in case of both NSC and SCC columns.
5.3 Energy Absorption
Area enclosed under the load-deformation curve is represented as Energy absorption.
The failure mechanism of RC columns is found to be very dependent on the loading
path, which strongly affects both the ductility and energy dissipation capacity of the
columns. The influence of reinforcement ratio on the energy dissipated in
compression is shown in Fig 12.
372.54 372.54 372.54
500.00 518.99 556.62
414.57 414.57 414.57
495.00 520.35
632.91
0.00
100.00
200.00
300.00
400.00
500.00
600.00
700.00
2.09% 2.89% 5.15%
UL
TIM
AT
E L
OA
D (
kN
)
% STEEL
INTERMEDIATE COLUMN
Theoritical Pu NSC Experimental Pu NSC Theoritical Pu SCC Experimental Pu SCC

Experimental Investigations On Compression Behavior Parameters of NSC and SCC
Intermediate RC Columns
http://www.iaeme.com/IJCIET/index.asp 109 [email protected]
2248.255
4111.265
3525.754 3553.332 3672.844
4242.564
0.000
1000.000
2000.000
3000.000
4000.000
5000.000
2.01% 2.89% 5.15%
EN
ER
GY
AB
SO
RP
TIO
N
(k
N-m
m)
% OF STEEL
INTERMEDIATE COLUMN
NSC
SCC
Figure 12 Combined Energy absorption V/S steel percentage for intermediate column
Energy absorption for NSC/12/2.01 was 36.72% lesser, NSC/12/2.89 was 10.67%
higher and NSC/12/5.15 was 20.33% lesser compared to SCC/12/2.09, SCC/12/2.89
and SCC/12/5.15 column respectively as shown in Fig 12.
5.4 Shortening Index
Shortening index is a dimensionless property and is defined as the ratio of ultimate
deformation to the length of column. Graphs of shortening index vs steel percentage
have been plotted for all intermediate columns as shown in Fig 13.
Figure 13 Combined shortening index V/S steel percentage for intermediate column
The shortening index of both SCC and NSC intermediate columns decreased with
increase in percentage of steel as shown in Fig 13.
Shortening index for SCC/12/2.09 was 8.19% lesser, SCC/12/2.89 was 18.03%
higher compared to NSC/12/2.09, NSC/12/2.89 columns respectively. But,
SCC/12/5.15 and NSC/12/5.15 columns showed equal shortening index as shown in
Fig 13.
5.5 Stiffness Degradation of RC Columns
Load required per unit deformation is termed as stiffness of a member and stiffness
degradation is defined as the damage to engineering materials essentially results in a
0.0090
0.0057 0.0049
0.0068
0.0059 0.0057
0.0000
0.0010
0.0020
0.0030
0.0040
0.0050
0.0060
0.0070
0.0080
0.0090
0.0100
2.01% 2.89% 5.15%
SH
OR
TE
NIN
G I
ND
EX
% OF STEEL
INTERMEDIATE COLUMNS
NSC
SCC

Prabhakara R, Chethankumar N E, Atul Gopinath and Sanjith J
http://www.iaeme.com/IJCIET/index.asp 110 [email protected]
decrease of the free energy stored in the body with consequent degradation of the
material stiffness. To understand the stiffness degradation of RC columns, it is
required to plot the graph between stiffness and axial deformation with varying
percentage of steel reinforcement for both NSC and SCC. Section 5.5.1 covers the
stiffness degradation of intermediate columns respectively.
5.5.1 Stiffness Degradation of Intermediate RC Columns.
The stiffness degradation curves for intermediate columns have been plotted as shown
in Fig 14 and Fig 15.
Figure 14 Combined Stiffness degradation curve for NSC intermediate RC columns
As the axial load and axial deformation increased, the stiffness of columns having
higher percentage of steel reinforcement decreased suddenly up to a deformation
value of 0.34mm and the decrement became marginally slow after this. Whereas the
stiffness of columns with lesser percentage of steel reinforcement for NSC decreased
constantly for all values of axial deformation as shown in Fig 14.
Figure 15 Combined Stiffness degradation curve for SCC intermediate RC columns
It is conspicuous that there was a sudden drop of stiffness for all the SCC
intermediate columns up to a certain deformation value and stiffness degradation
beyond these values was marginally constant which is shown in Fig 15. It was
observed from the above graphs that as the percentage of steel increases, the stiffness
of column increases and the stiffness degradation decreases for both NSC and SCC.
Following graphs show the stiffness degradation for both NSC and SCC intermediate
columns with same percentage of steel reinforcement.
0
100
200
300
400
500
600
0 2 4 6 8 10
STIF
FNES
S (k
N/m
m)
AXIAL DEFORMATION (mm)
SCC 16
SCC 12
SCC 10

Experimental Investigations On Compression Behavior Parameters of NSC and SCC
Intermediate RC Columns
http://www.iaeme.com/IJCIET/index.asp 111 [email protected]
0
50
100
150
200
250
0 5 10 15
STIF
FNES
S (k
N/m
m)
AXIAL DEFORMATION (mm)
NSC 10
SCC 10
0
50
100
150
200
250
0 5 10 15
STIF
FNES
S (k
N/m
m)
AXIAL DEFORMATION (mm)
NSC 10
SCC 10
0
200
400
600
800
1000
1200
1400
0 2 4 6 8
STIF
FNES
S (k
N/m
m)
AXIAL DEFORMATION (mm)
NSC 16
SCC 16
Figure 16 Combined Stiffness degradation curve-2.09%
Figure 17 Combined Stiffness degradation curve 2.89%
Figure 18 Combined Stiffness degradation curve-5.15%
It has been observed from the Fig 16, Fig 17 and Fig 18 that, for 2.09%, 2.89%
and 5.15% steel, NSC intermediate columns had more stiffness value than SCC
intermediate columns. Whereas for 2.89% steel, SCC intermediate column had more
stiffness value than NSC intermediate column. After comparing all the above graphs
it was observed that stiffness value of 5.15% steel was much greater. And also
stiffness degradation of 5.15% steel was rapid than 2.09% and 2.89% steel.
Stiffness at ultimate load for SCC/12/2.09 was 6.78% higher and SCC/12/2.89
was 13.54% lesser and SCC/12/5.15 was 12.13% higher compared to NSC/12/2.09

Prabhakara R, Chethankumar N E, Atul Gopinath and Sanjith J
http://www.iaeme.com/IJCIET/index.asp 112 [email protected]
and NSC/12/2.89 and NSC/12/5.15 columns respectively as shown in Fig 16, 17 and
18.
5.6 Stiffness Ratio and Axial Load Ratio of RC Columns.
The ratio of applied load to the theoretical load is defined as the axial load ratio.
Stiffness ratio is very important parameters which play an important role in the
structural performance of RC columns. In order to study the influence and the
relationship between the above mentioned parameters, it is necessary to plot the graph
between axial load ratio and stiffness ratio. Section 5.6.1 covers the stiffness ratio v/s
axial load ratio relationship for intermediate columns.
5.6.1 Stiffness Ratio and Axial Load Ratio of Intermediate RC Columns.
The graphical representation of stiffness ratio and axial load ratio for both NSC and
SCC is as shown in Fig 19 and Fig 20.
Figure 19 Combined Axial load ratio curve for NSC intermediate RC columns
From the Fig 19 it has been observed that, NSC10, NSC12 and NSC16
intermediate columns achieved an axial load ratios 1.37, 1.42 and 1.53 respectively.
SCC10, SCC12 and SCC16 intermediate columns achieved an axial load ratios 1.23,
1.3 and 1.57 respectively at ultimate axial load. It is observed that, axial load ratio and
stiffness ratio increased linearly.
Figure 20 Combined Stiffness Ratio curve for SCC intermediate RC columns
1.15
1.20
1.25
1.30
1.35
1.40
1.45
1.50
1.55
1.60
1.65
0.00% 1.00% 2.00% 3.00% 4.00% 5.00% 6.00%
AX
IAL
LO
AD
RA
TIO
% OF STEEL
NSC
SCC
40.00
45.00
50.00
55.00
60.00
65.00
70.00
0.00% 1.00% 2.00% 3.00% 4.00% 5.00% 6.00%
ST
IFF
NE
SS
RA
TIO
% OF STEEL
NSC
SCC

Experimental Investigations On Compression Behavior Parameters of NSC and SCC
Intermediate RC Columns
http://www.iaeme.com/IJCIET/index.asp 113 [email protected]
0.000
10.000
20.000
30.000
40.000
50.000
60.000
0.0
35
0.1
39
0.2
44
0.3
48
0.4
53
0.5
57
0.6
61
0.7
66
0.8
70
0.9
75
1.0
79
1.1
84
1.2
88
STIF
FNES
S R
ATI
O
AXIAL LOAD RATIO
NSC 10
SCC 10
0.000
10.000
20.000
30.000
40.000
50.000
60.000
0.0
35
0.1
39
0.2
44
0.3
48
0.4
53
0.5
57
0.6
61
0.7
66
0.8
70
0.9
75
1.0
79
1.1
84
1.2
88
1.3
93
STIF
FNES
S R
ATI
O
AXIAL LOAD RATIO
NSC 12
SCC 12
From the Fig 20 it has been observed that, , NSC10, NSC12 and NSC16
intermediate columns achieved stiffness ratios 47.4, 50.25 and 64.04 and SCC10,
SCC12 and SCC16 intermediate columns achieved stiffness ratios 54.14, 56.68 and
61.89 respectively at ultimate axial load. It was observed that, axial load ratio and
stiffness ratio for all intermediate columns increased linearly.
Following graphs show the variation of axial load ratio and stiffness ratio for both
NSC and SCC intermediate columns with same percentage of steel reinforcement.
Figure 21 stiffness ratio vs axial load ratio-2.09%
Figure 22 stiffness ratio vs axial load ratio curve 2.89%

Prabhakara R, Chethankumar N E, Atul Gopinath and Sanjith J
http://www.iaeme.com/IJCIET/index.asp 114 [email protected]
0.000
10.000
20.000
30.000
40.000
50.000
60.000
70.000
0.0
35
0.1
39
0.2
44
0.3
48
0.4
53
0.5
57
0.6
61
0.7
66
0.8
70
0.9
75
1.0
79
1.1
84
1.2
88
1.3
93
1.4
97
STIF
FNES
S R
ATI
O
AXIAL LOAD RATIO
NSC 16
SCC 16
Figure 23 Combined stiffness ratio vs axial load ratio curve-5.15%
From the Fig 21, Fig 22 and Fig 23 it has been observed that, Stiffness ratio and
axial load ratio for NSC and SCC intermediate columns having 5.15% steel were
found to be greater than that of 2.89% and 2.09% steel. As studied from the graphs,
for all the intermediate columns stiffness ratio and axial load ratio were nearly same.
Axial load ratio at ultimate load for SCC/12/2.09 was 11.38% lesser, SCC/12/2.89
was 10.07% lesser and SCC/12/5.15 was 2.54% higher compared to NSC/12/2.09,
NSC/12/2.89 and NSC/12/5.15 columns respectively. Stiffness ratio at ultimate load
for SCC/12/2.09 was 14.24% lesser, SCC/12/2.89 was 12.79% lesser and
SCC/12/5.15 was 3.34% higher compared to NSC/12/2.09, NSC/12/2.89 and
NSC/12/5.15 columns respectively.
6. ACKNOWLEDGEMENT
We acknowledge the support rendered by the Management of MSRIT, Principal,
HOD, Faculty and Staff of Civil Dept. of MSRIT, Affiliated to VTU Belagavi. In
particular we express our deep sense of gratitude to Hirannaiah, Chief Engineer,
Bhagirathi constructions for extending his help throughout the investigations.
7. SUMMARY AND CONCLUSIONS
To study the load deformation behavior, stiffness degradation, axial load ratio and
stiffness ratio, ultimate load, energy absorption and shortening index experimental
investigation has been carried out on intermediate RC columns. Summary and
conclusions are outlined below.
The mix proportion for NSC (M30) was obtained from the IS 10262-2009. Also
slump test was followed as per IS 1199-1959 and the average slump value was
found to be 85 mm.
The mix proportion for SCC (M30) was obtained as per Nan Su method [16] and
flow properties observed were within the limit.
For every mix three companion cubes were cast for both NSC and SCC and an
average 28 days cube compressive strength was found to be 37.52 MPa for NSC
and 44.29 MPa for SCC respectively.
The cross sections of all the columns were 125mm X125 mm. The height of the
column was fixed as 1.5m and the Slenderness ratios of intermediate column was
maintained as 12.

Experimental Investigations On Compression Behavior Parameters of NSC and SCC
Intermediate RC Columns
http://www.iaeme.com/IJCIET/index.asp 115 [email protected]
The varied percentage of steel in each column was 2.09%, 2.89% and 5.15%.
It was found that, with increase in steel percentage for same cross sectional area
of column, the load carrying capacity increased and ultimate deflection reduced.
From the experiment it was found that, intermediate columns failed due to
crushing and no buckling was observed.
Load carrying capacity for SCC/12/2.09 was 1.01% lesser and SCC/12/5.15 was
12.05% higher compared to NSC/12/2.09 and NSC/12/5.15 columns respectively.
But, the load carrying capacity for SCC/12/2.89 and NSC/12/2.89 was
approximately equal.
Axial deformation for SCC/12/2.09 was 6.71% lesser and SCC/12/2.89 was
21.35% higher compared to NSC/12/2.09 and NSC/12/2.89 columns respectively.
But, the axial deformation for SCC/12/5.15 and NSC/12/5.15 was approximately
equal.
Shortening index for SCC/12/2.09 was 8.19% lesser, SCC/12/2.89 was 18.03%
higher compared to NSC/12/2.09, NSC/12/2.89 columns respectively. But,
SCC/12/5.15 and NSC/12/5.15 columns showed equal shortening index
In case of intermediate columns, energy absorption was found to be greater for
SCC/12/5.15 column whereas NSC/12/2.09 column showed least value.
Energy absorption for NSC/12/2.01 was 36.72% lesser, NSC/12/2.89 was 10.67%
higher and NSC/12/5.15 was 20.33% lesser compared to SCC/12/2.09,
SCC/12/2.89 and SCC/12/5.15 column respectively
It was observed that axial load applied was directly proportional to stiffness ratio
and axial load ratio.
It was reported from the results that higher the stiffness value, lower will be the
stiffness ratio and axial load ratio
Axial load ratio at ultimate load for SCC/12/2.09 was 11.38% lesser,
SCC/12/2.89 was 10.07% lesser and SCC/12/5.15 was 2.54% higher compared to
NSC/12/2.09, NSC/12/2.89 and NSC/12/5.15 columns respectively.
Stiffness at ultimate load for SCC/12/2.09 was 6.78% higher and SCC/12/2.89
was 13.54% lesser and SCC/12/5.15 was 12.13% higher compared to
NSC/12/2.09 and NSC/12/2.89 and NSC/12/5.15 columns respectively
Stiffness ratio at ultimate load for SCC/12/2.09 was 14.24% lesser, SCC/12/2.89
was 12.79% lesser and SCC/12/5.15 was 3.34% higher compared to
NSC/12/2.09, NSC/12/2.89 and NSC/12/5.15 columns respectively.
REFERENCES
[1] Stephen T. Rutledge; Mervyn J. Kowalsky,P.E; Rudolf Seracino, James M.
Nau.“Repair of RC bridge columns containing buckle and fractured
reinforcement by plastic hinge relocation”(2013), journal of bridge engineering,
ASCE, 1SSN 1084-0702/a4013oo1(10), DOI:10.1061/(ASCE)BE.1943-
5592.0000492
[2] Ramesh Kumar, Paolo Gardoni. Modelling of structural degradation of RC bridge
columns subjected to earthquake and their fragility estimates, Journal Of
Structural Engineering, 138(1), 2012 DOI: 10.1061/ (ASCE)ST. 1943-
541X.0000450.
[3] Viorel Popa. Dragos Cotofana. Radu Vacareanu. Effective stiffness and
displacement capacity of short reinforced columns with low concrete quality bull
earthquake engineering (2014) 12:2705-2721 DOI: 10.1007/S 10518-014-9618-9,
2014.

Prabhakara R, Chethankumar N E, Atul Gopinath and Sanjith J
http://www.iaeme.com/IJCIET/index.asp 116 [email protected]
[4] Pin-qi xia and James M. W. Brownjohn Residual stiffness assessment of
structurally failed reinforced concrete structures by dynamic testing and finite
element model updating, 43(4) Dec 2003
[5] X. Zeng, B. Xu, X. Z. Zhang. Experimental study on axial compression
behaviour of RC columns under rapid loading, 15WCEE, LISBOA 2012, Hunan
410082, P.R.China.
[6] Hugo Rodrigues, Humberto Varum1, Antonio Arêde and Aníbal G Costa1,
Behavior of reinforced concrete column under biaxial cyclic loading—state of the
art”, International journal of Advanced Structural Engineering 5:4. 2013
[7] A.Bourouz, N .Chikh, R Benzaid, A .Laraba Confinement of high strength
concrete columns with CFRP sheets, Proceedings of the World Congress on
Engineering, VOL II, July 2-4, 2014, London, UK.
[8] Bing li, Initial stiffness of reinforced concrete columns and walls, 15 WCEE
lisboa 2012.
[9] Jia Jinquing, Jiang Rui (2007) Dynamic analysis of steel reinforced super high
strength concrete columns. Archit.civ.eng.china, 1 (2):240-246. DOI 10.1007/s
11709-007-0030-2
[10] Biswajit Basu. Identification of stiffness degradation in structures using wavelet
analysis, construction and building materials 19 pp. 713-721, 2005,
doi:10.1016/J.Conbuildmat.2005.02.018
[11] M. Hajsadeghi, F.J. Alaee Numerical analysis of rectangular reinforced concrete
columns confined with FRP jacket under eccentric loading, CICE 2010- The 5th
International conference on FRP composites in civil engineering, September 27-
29,2010, Beijing, china.
[12] R. Jansson, l. Bostrom Factor influencing fire spalling of self-compacting
concrete, materials and structures , 46:1683-1694, DOI 10.1617/s 11527-012-
0007-z. 2013
[13] Yishuo Ma, Yuanfeng Wang. Parametric analysis for creep of high strength
concrete columns confined by AFRP, 2010, CICE 2010- The 5th International
conference on FRP composites in civil engineering, September 27-29, 2010,
Beijing, china.
[14] Jiaquan Zhong, S.M. ASCE, Paolo Gardoni, M.ASCE, David Rosowsky
“Stiffness degradation and time cracking of cover concrete in reinforced concrete
structures subject to corrosion, 2010, DOI :10.1061/(ASCE) em.1943-
7889.0000074. 136(2).
[15] K.J. Elwood and M.O. Eberhard, Effective Stiffness of Reinforced Columns,
Research digest No. 2006-1, pp 1-5, 2006.
[16] Nansu, kung chung hsu and his-Wen chai, Asimple mix design method of self-
compacting concrete, cement and concrete research, 2001, 31, pp. 1799-1807.
[17] M. Neville, Properties of Concrete, Fourth Edition, Longman Group Limited.
1995, pp. 757-758.
[18] IS 456:2000, [Reaffirmed 2005], Plain and Reinforced Concrete – Code of
Practice, Fourth Revision, Bureau of Indian Standards, New Delhi, India.
[19] IS 10262:2009, Standards Concrete Mix Proportioning Guidelines, First
Revision, Bureau of Indian Standards, New Delhi, India.
[20] IS 383:1970, [Reaffirmed in 2002], Specifications for Coarse & Fine Aggregates
from Natural Sources for Concrete, Bureau of Indian Standards, New Delhi,
India.
[21] IS 2386 (Part I):1963, [Reaffirmed in 2011], Methods of Tests for Aggregates for
Concrete”, Bureau of Indian Standards, New Delhi, India.

Experimental Investigations On Compression Behavior Parameters of NSC and SCC
Intermediate RC Columns
http://www.iaeme.com/IJCIET/index.asp 117 [email protected]
[22] IS 516:1959, [Reaffirmed 1999], Edition 1.2, Methods of Tests for Strength of
Concrete, Bureau of Indian Standards, New Delhi, India.
[23] IS: 1199- 1959, [Reaffirmed 2004], Methods of Sampling and Analysis of
Concrete, Bureau of Indian Standards, New Delhi, India.
[24] BS EN 12350-2: 2000, Testing fresh concrete, slump test, January 2000.
[25] MasterGlenium 8233 (formerly Glenium B233) a BASF company, BASF India
Limited.
[26] Master Matrix 2 (formerly Glenium Stream 2) a BASF company, BASF India
Limited.
[27] ISO 1920-2:2005, Testing of concrete Part 2: Properties of fresh concrete
published on 2005-04-15.
[28] IS 10510, Specification for Vee-Bee Consistometer, 1983
BIOGRAPHIES
Name: Dr. R.PRABHAKARA
Designation: Professor and Head
Qualification: M. Tech (Construction Technology)
Ph.D (Civil Engineering)
Research Area: Materials and Structures
Name: CHETHANKUMAR N E
Qualification: M-Tech (Structural Engineering)
Research area: Material behaviour
Name: ATUL GOPINATH
Qualification: ME
Ph.D (Civil Engineering)
Research area: Material behavior
Name: SANJITH J
Designation: Assistant Professor
Qualification: M. Tech (Structural Engineering)
Research Area: Materials and Structures