experimental study of filter cake … study of filter cake cracking during deliquoring by ashok...
TRANSCRIPT

EXPERIMENTAL STUDY OF FILTER CAKE CRACKING
DURING DELIQUORING
By
Ashok Barua
A thesis presented for the degree of Doctor of Philosophy
Department of Chemical Engineering & Chemical Technology
Imperial College of Science, Technology and Medicine,
London, SW7 2AZ
May 2014
i
The copyright of this thesis rests with the author and is made available under a Creative Commons
Attribution Non-Commercial No Derivatives licence. Researchers are free to copy, distribute or
transmit the thesis on the condition that they attribute it, that they do not use it for commercial
purposes and that they do not alter, transform or build upon it. For any reuse or redistribution,
researchers must make clear to others the licence terms of this work.

ii
For my Ma, Dad, Didima & Sis

iii
Acknowledgements
I would like to acknowledge and thank the following people who have helped make this thesis
possible:
Dr Jerry Heng for his supervision and guidance
Professor Nilay Shah, Professor Yun Xu, Professor Jeff Magee, Dr Frantisek Stepanek, Professor
Sergei Kazarian, Dr Marcos Millan-Agorio, Dr Umang Shah, Kalaivani Thuvaragan, Aleksandra
Szymanska, Tingting Wu, Anusha Sri-Pathmanathan, Professor Alexander Bismarck, Dr Edo Boek,
Edyta Lam, Jing Li, Yan Wang, Susi Underwood, Dr Manel Torres, Mila Svechtarova, George Wang,
Rajagopal Vellingiri, Peter Yatsyshin & others for their help and support.
Dr Francois Ricard, Dr Warren Eagles and Dr Giovanni Giorgio from GlaxoSmithKline (GSK),
Stevenage.
Engineering and Physical Sciences Research Council (EPSRC).
Longcliffe Quarries for supplying the calcium carbonate used in this study.

iv
Declaration
This thesis is a description of the work carried out at Imperial College London for this PhD. The work
presented here is the original work of the author and where sources of information have been used,
they have been referenced accordingly. No part of this thesis has been submitted for a degree at this
or any other university.

v
Abstract
Shrinkage cracking is an undesired phenomenon that is encountered frequently during the filtration
of fine particulate filter cakes. Once a cake has cracked, a channel is formed and gas permeability
increases significantly as the gas passes preferentially through the crack rather than the pores in the
filter cake. This leads to an exposition of the filtration area, which results in a higher gas
consumption, a decrease in filtration pressure and a higher residual moisture content. The objective
of this research is to gain a better understanding of shrinkage cracking by identifying key parameters
and exploring how changes to these parameters affect the occurrence and extent of filter cake
cracking.
In this thesis the results of an experimental parametric study on filter cake cracking are presented.
They show that crucial output parameters such as residual moisture content and permeability ratio
can be reduced, and that filter cake cracking can be influenced and ultimately eliminated through
careful control of key input parameters.
The parameters were studied at a laboratory scale using a Nutsche filter, and a model system of
calcium carbonate in deionised water was used, occasionally with additions of ethanol, polyethylene
glycol or surfactants. The results of these investigations into the effects of particle size distribution
(PSD), filter cake depth, filtration pressure, initial concentration of slurry, settling time, temperature,
surface tension and viscosity of the suspending liquid are presented as part of this doctoral thesis. It
can be shown that the possibility exists to eliminate filter cake cracking with correct material
selection and process conditions. This research dispels any notion of the stochastic nature of filter
cake cracking, displaying the trends observed, the repeatability and the general predictability of the
likelihood and degree of filter cake cracking.
vi
Contents
1 Filtration ......................................................................................................................................................... 1
1.1 Filtration overview ................................................................................................................................ 2
1.2 Steps of filtration ................................................................................................................................... 9
1.3 Flow through porous media ................................................................................................................ 11
1.4 Filtration Theory .................................................................................................................................. 15
1.5 Cake structure ..................................................................................................................................... 36
1.6 Immiscible fluid displacement in porous media ................................................................................. 67
1.7 Stresses and strains in wet granular media ........................................................................................ 75
2 Literature review on cracking ...................................................................................................................... 87
2.1 Cracking in filter cakes ........................................................................................................................ 87
2.2 Cracking in other contexts .................................................................................................................. 97
2.3 Summary and focus of this research ................................................................................................. 119
3 Experimental methodology ....................................................................................................................... 121
3.1 Filtration process set-up ................................................................................................................... 121
3.2 Materials used ................................................................................................................................... 122
3.3 Preparation of materials ................................................................................................................... 128
3.4 Filtration experiments ....................................................................................................................... 129
3.5 Determination of key output parameters ......................................................................................... 130
3.6 Analytical techniques ........................................................................................................................ 132
4 Results: Macroscopic level ......................................................................................................................... 136
4.1 Effects of settling time, concentration and mass fraction of fines on filter cake cracking ............... 136
4.2 Effect of filter cake height on cake cracking ..................................................................................... 156
4.3 Effect of filtration pressure on cake cracking.................................................................................... 165

vii
5 Results: Material properties ...................................................................................................................... 169
5.1 Effect of viscosity on pre-formed filter cakes ................................................................................... 169
5.2 Effect of solvent on cake cracking ..................................................................................................... 177
6 Results: Molecular level ............................................................................................................................. 182
6.1 Effect of surfactant addition on cake cracking .................................................................................. 182
6.2 Effect of surface tension on pre-formed filter cakes ........................................................................ 196
6.3 Effect of temperature on filter cake cracking ................................................................................... 198
7 Crack formation ......................................................................................................................................... 201
7.1 Crack patterns in detail ..................................................................................................................... 204
8 Conclusions and future work ..................................................................................................................... 212
8.1 Conclusions ....................................................................................................................................... 212
8.2 Future work ....................................................................................................................................... 216
References .......................................................................................................................................................... 217

viii
List of figures
Figure 1: Photographs of cracking in filter cakes on a) the underside of a cake adjacent to the medium b) the side of a filter
cake 1
Figure 2: Stages of solid-liquid separation (Reference 1) 2
Figure 3: Schematic diagram of a filtration system (Reference 2) 5
Figure 4: The main stages of filtration (Reference 40) 9
Figure 5: Typical deviations from linearity (Reference 2) 17
Figure 6: Hydraulic pressure and solids pressure as a function of filter cake height (Reference 2) 24
Figure 7: Stern’s model (Reference 5) 29
Figure 8: Graph to show relationship between interaction energy and separation upon electrolyte addition (Reference 72)
31
Figure 9: Graph of zeta potential as a function of pH for anatase in distilled water (Reference 73) 33
Figure 10: Particle volume density as a function of the composition of the binary mixture where x2 is the fraction of small
particles (Reference 83) 37
Figure 11: Random packing density of bidisperse particles (Reference 85) 38
Figure 12: Distribution of the number of contacts on small spheres Csmall and big spheres Cbig for a) x2 = 0.024, b) x2 = 0.273,
c) x2 = 0.852 (Reference 83) 39
Figure 13: Fraction of non-caged spheres as a function of the composition x2, together with the fraction of small spheres as
a function of composition x2 (Reference 83) 41
Figure 14: Permeability k versus the fraction of small particles (x2) for a) Mixture 1 (R1/R2 = 1.4) and b) Mixture 2 (R1/R2 =
2.6) (Reference 83) 41
Figure 15: Packing structures of particles of different sizes and under different filtration rates (Reference 90) 42
Figure 16: Filtration of wastewater solid suspensions at 1 bar (Reference 96) 47
Figure 17: Filtration-permeation of 1wt% solids wt CaCO3 suspension at 0.5 atm (Graphs constructed from data taken from
reference 92) 50
Figure 18: Filtration-permeation of sediment (48.8% solids wt CaCO3) prepared with a suspension of 17.6% solids wt initial
concentration (Graphs constructed from data taken from reference 92) 51
Figure 19: Filtration-permeation of 4, 8 & 15% solids wt CaCO3 suspension at 0.5 atm (Graphs constructed from data taken
from reference 92) 53
Figure 20: Forces exerted on two touching particles (Reference 91) 58
Figure 21: Fractional distance vs normalised pressure (Reference 106) 60

ix
Figure 22: Diagram to illustrate location of Gibbs Dividing Plane (Reference 112) 64
Figure 23: Diagram of a capillary pressure curve for imbibition and deliquoring (Reference 2) 68
Figure 24: Relative permeability as a function of saturation (Reference 2) 69
Figure 25: Capillary pressure curves for varying pore size distribution (Reference 116) 73
Figure 26: Liquid bonding between particles (Reference 128) 75
Figure 27: Diagram of liquid bridge geometry (Reference 136) 77
Figure 28: Values of relative volume of liquid as a function of dimensionless distances for which Fc = 0, at different wetting
angles ϴ (Reference 136) 79
Figure 29: Total capillary force for a range of liquid bridge volumes as a function of separation distance between two
spheres where the ratios of radii are a) 1, b) 2/3, c) 1/ 2 and d) 0. (Reference 139) 81
Figure 30: Dependence of porosity on liquid addition (Reference 142) 82
Figure 31: Fc/Fg vs β for different distances between glass beads 1) s/R = 0; 2) s/R=5 x 10-4
; 3) s/R = 5 x 10⁻³
; 4) s/R = 5 x 10-
2 ; 5) s/R = 5 x 10
-1 ; R = 100 µm (Reference 140) 83
Figure 32: Schubert’s tensile strength-saturation diagram (Reference 146) 85
Figure 33: Adhesion number as a function of distance ratio for liquid bridges between equal spheres. The parameter is the
liquid volume related to the volume of the spheres. (Reference 145) 86
Figure 34: Photographs of cracked filter cakes (top, side, bottom) 87
Figure 35: Characteristic shrinkage curve showing normal, residual and zero shrinkage sections (Reference 152) 90
Figure 36: Influence of compressive pressure on shrinkage process (Reference 152) 91
Figure 37: Shrinkage potential as a function of compressive pressure (Reference 152) 92
Figure 38: Shrinkage potential as a function of compressive pressure for different materials (Reference 152) 93
Figure 39: Cumulative mass distributions for different materials (Reference 152) 93
Figure 40: Effect of variation of surface tension on shrinkage potential and minimum compressive pressure (Reference 152)
94
Figure 41: The drying stress evolution of CaCO3 particles as a function of time for a calcium carbonate film (Reference 161)
102
Figure 42: Drying stress evolution as a function of drying time for ternary films containing calcium carbonate and glycerol
(Reference 162) 104
Figure 43: Drying stress evolution as a function of drying time for ternary films containing calcium carbonate and SDS
surfactant (Reference 162) 105
Figure 44: Krischer’s curves showing influence of air velocity (Reference 164) 107
Figure 45: Variation of CIF with time for 3 soils during the compaction-drying and wet dry cycles (Reference 176) 116

x
Figure 46: Variation of CIF with time for 3 soils during the compaction-drying and wet dry cycles (Reference 177) 118
Figure 47: a) Laboratory scale Nutsche filter used for the experimental study; b) schematic diagram of the experimental
setup (1 – filtration rig, 2 – balance, 3 – PC, 4 – nitrogen cylinder, 5 – pressure regulator, 6 – flowmeter) 122
Figure 48: PSD analysis a) Longcliffe L15 (Batch 2); b) Longcliffe L200 limestone (Batch 2); c) Longcliffe L15 (Batch 3); d)
Longcliffe L200 limestone (Batch 3); e) Longcliffe L15 (Batch 4); f) Longcliffe L200 limestone (Batch 4) 123
Figure 49: SEM scans of Longcliffe L15 (a and b) and Longcliffe L200 (c and d) calcium carbonate particles used in the study
(Batch 3) 124
Figure 50: Molecular diagrams of SDS surfactant (Reference 109) 125
Figure 51: Molecular diagrams of CTAB surfactant (Reference 109) 125
Figure 52: Molecular diagrams of Tween surfactant (Reference 109) 126
Figure 53: a) Permeability ratio and b) Residual moisture for 100 g filter cakes / 600 ml DI / zero and full settling / 2.5 bar
applied pressure. ∆ denotes that deliquoring without cracking occurred. denotes that the event of filter cake
cracking occurred 137
Figure 54: Photographs showing segregation of the filter cake into two layers (600 ml DI, zero settling) 138
Figure 55: PSD profiles for 20% L15 / 2.5 bar / 600 ml DI / zero settling. a) top of the upper fines layer b) bottom of the
upper fines layer c) top of the lower coarse layer d) bottom of the lower coarse layer 139
Figure 56: PSD profiles for 20% L15 / 2.5 bar / 600 ml DI / Overnight settling: a) top of the filter cake b) bottom of the filter
cake 140
Figure 57: a) Permeability ratio and b) Residual moisture for 100 g filter cakes / 100 ml DI / zero and full settling / 2.5 bar
applied pressure. ∆ denotes that deliquoring without cracking occurred. denotes that the event of filter cake
cracking occurred 142
Figure 58: t/V vs V graphs for 20% L15 / 100 g filter cakes / 100 and 600 ml DI / zero and full settling / 2.5 bar applied
pressure 143
Figure 59: Diagram to illustrate shielding of flocs in a segregated coarse layer, and contacting of flocs with fine particle
networks 146
Figure 60: Graph to show changes in terminal velocity for increasing particle size and concentration (% solids wt) 149
Figure 61: Permeability ratio and residual moisture content for 100 g filter cakes / 600 ml DI / 20% L15 / 2.5 bar applied
pressure / variable settling time (zero to overnight). ∆ denotes that deliquoring without cracking occurred. denotes
that the event of filter cake cracking occurred 152
Figure 62: Permeability ratio and residual moisture content for 100 g filter cakes / zero settling / 20% L15 / 2.5 bar applied
pressure / variable DI volume (100 ml to 600 ml). ∆ denotes that deliquoring without cracking occurred. denotes
that the event of filter cake cracking occurred 153

xi
Figure 63: Illustration of cubic and hexagonal packing arrangements for different size ratios (Reference 186) 154
Figure 64: a) Permeability ratio and b) Residual moisture for 60-100% L15 / 20-100 g filter cakes (constant slurry
concentration of 14.3% solids wt, using 120-600 ml DI) / zero settling / 2.5 bar applied pressure. ∆ denotes that
deliquoring without cracking occurred. denotes that the event of filter cake cracking occurred 156
Figure 65: X-ray tomographic image showing the pattern of cracking (left) and shear stress distribution (right) showing a
shear band from the top edge towards a lower point approaching the central axis (Reference 185) 158
Figure 66: X-ray computed tomographic images of ejected tablets and shear stress distribution profile (Reference 188) 159
Figure 67: Photographs of broken tablets due to capping (Reference 190) 160
Figure 68: Permeability ratio and residual moisture content for 100 – 400 g filter cakes / constant slurry concentration of
50% solids wt / zero settling for a,b) 1.5 bar; c,d) 2 bar; e,f) 2.5 bar. ∆ denotes that deliquoring without cracking
occurred. denotes that the event of filter cake cracking occurred 162
Figure 69: Permeability ratio and residual moisture content for 100 – 400 g filter cakes / constant slurry concentration of
50% solids wt / zero settling / 0-40% L15 for a,b) 2 bar; c,d) 2.5 bar. ∆ denotes that deliquoring without cracking
occurred. denotes that the event of filter cake cracking occurred 163
Figure 70: Photographs to show filter cake cracks of tall cakes: 400 g calcium carbonate / 400 ml DI / 1.5 bar / Zero settling
163
Figure 71: Permeability ratio and residual moisture for 80% L15 / 80 g filter cakes / 480 ml DI / zero settling / 1.75 – 3 bar. ∆
denotes that deliquoring without cracking occurred. denotes that the event of filter cake cracking occurred 165
Figure 72: Permeability ratio and residual moisture content for filter cakes / applied pressure 1.5 – 2.5 bar / zero settling /
constant slurry concentration of 50% solids wt for a,b) 100 g calcium carbonate; c,d) 200 g calcium carbonate; e,f)
400 g calcium carbonate. ∆ denotes that deliquoring without cracking occurred. denotes that the event of filter
cake cracking occurred 168
Figure 73: Permeability ratio and residual moisture content for 200g pre-formed filter cakes / 300ml PEG 400 + DI / Zero
settling / 20% L15 / 2.5 bar / 300 ml DI added / changing mass fraction of PEG 400. ∆ denotes that deliquoring
without cracking occurred. denotes that the event of filter cake cracking occurred 170
Figure 74: Surface tension and viscosity data for increasing mass fractions of PEG 400 in DI 172
Figure 75: TGA charts to show water and PEG 400 content for a) 35% PEG 400 (top of cake); b) 35% PEG 400 (bottom of
cake); c) 75% PEG 400 (top of cake); d) 75% PEG 400 (bottom of cake) 173
Figure 76: Permeability ratio and residual moisture content for 200 g pre-formed filter cakes / 300 ml PEG 400 + DI / 50%
PEG 400 / zero settling / 0-60% L15 / 2.5 bar / 300 ml DI added. ∆ denotes that deliquoring without cracking
occurred. denotes that the event of filter cake cracking occurred 176
xii
Figure 77: a) Permeability ratio and b) Residual moisture for 100 g filter cakes / 100 ml DI or ethanol / zero and full settling
(ethanol only) / 2.5 bar applied pressure. ∆ denotes that deliquoring without cracking occurred. denotes that the
event of filter cake cracking occurred 177
Figure 78: Average specific resistance for 100 g filter cakes / 100 ml DI and ethanol/ Zero and full settling / 2.5 bar. ∆
denotes that deliquoring without cracking occurred. denotes that the event of filter cake cracking occurred 179
Figure 79: Residual moisture and permeability ratio for 100 g filter cakes / 100 ml ethanol – DI mix / Zero settling time /
20% L15 / 2.5 bar. ∆ denotes that deliquoring without cracking occurred. denotes that the event of filter cake
cracking occurred 180
Figure 80: Surface tension and viscosity against mass fraction of ethanol in water. Data taken from references 183 & 184
181
Figure 81: Photographs of filter cakes formed with a) SDS, b) CTAB, c) Tween 80 184
Figure 82: Graphs to show surface tension and viscosity data of SDS additions to 100 ml deionised water 185
Figure 83: Photographs of filter cakes formed with SDS surfactant (5 g/l) 185
Figure 84: Photographs of filter cakes formed with SDS surfactant (1.05 g/l) 186
Figure 85: Photograph of filter cake formed with SDS surfactant (0.31 g/l) 187
Figure 86: Graphs to show surface tension and viscosity data for CTAB additions to 100 ml deionised water 188
Figure 87: Photograph of filter cakes formed with CTAB surfactant (2.10 g/l) 189
Figure 88: Photograph of filter cakes formed with CTAB surfactant (0.64 g/l) 189
Figure 89: Photographs of 100 g calcium carbonate in a solution of 210 mg CTAB in 100 ml deionised water following full
settling 191
Figure 90: Photographs of 100 g calcium carbonate in a solution of 210 mg CTAB in 100 ml deionised water following full
settling (top view) 191
Figure 91: Photographs of a) 64 mg CTAB filtrate and 210 mg CTAB per 100 ml filtrate; b) SDS, CTAB and Tween 80 filtrate
192
Figure 92: Photograph of filter cake formed with CTAB surfactant (0.16 g/l) 194
Figure 93: Photograph of filter cakes formed with Tween 80 surfactant a) 0.29 g/l; b) 5.12 g/l; c) 14.30 g/l 195
Figure 94: Graphs to show surface tension and viscosity data for Tween 80 additions to 100 ml deionised water 195
Figure 95: Permeability ratio and residual moisture content for 100 g filter cakes / 100% L200 / 100 ml DI / Zero settling /
2.5 bar / with changing temperature (5 to 50 °C). ∆ denotes that deliquoring without cracking occurred. denotes
that the event of filter cake cracking occurred 198
Figure 96: Photographs of cracking at the surface and underside for 80% L15 / 100 g calcium carbonate / 600 ml DI / Full
settling / 2.5 bar for repeated runs 205
xiii
Figure 97: Photographs of cracking at the surface and underside for 80% L15 / 100 g calcium carbonate / 100 ml DI / No
settling / 2.5 bar for repeated runs 206
Figure 98: Photographs of cracking at the surface for 100% L15 / 100 g calcium carbonate / 100 ml DI / Full settling / 2.5 bar
for repeated runs 207
Figure 99: Photographs of cracking at the surface for 80% L15 / 80 g calcium carbonate / 80 ml DI / Zero settling / 2.5 bar
for repeated runs 209

xiv
List of tables
Table 1: Average specific resistance for calcium carbonate suspensions for various initial concentrations (Data from
reference 92) 54
Table 2: Summary of what has been published in the study of filter cake cracking 95
Table 3: Overview of the important parameters that have yet to be studied comprehensively in filter cake cracking 96
Table 4: Table to show mean particle sizes of batches of Longcliffe calcium carbonate used & experimental studies 123
Table 5: Table of properties of the materials used as part of this study 127
Table 6: Analytical techniques and equipment used as part of this study 132
Table 7: Table of results for 200 g filter cakes / 20% L15 / pre-formed in 300 ml PEG 400 + DI / No settling / 2.5 bar / 300
ml DI added / changing mass fraction of PEG 400 169
Table 8: Table to show PEG 400 & water content of residual solvent from samples taken from the top and bottom of filter
cakes pre-formed with 35% and 75% PEG 400 solvents (content calculated from data in Figure 75) 173
Table 9: Table of results for 100 g filter cakes / 20% L15 / 100 ml DI + surfactant / No settling / 2.5 bar 183
Table 10: Table of results for 200 g filter cakes / 20% L15 / pre-formed in 300 ml DI / No settling / 2.5 bar / 300 ml
additional solvent added to supernatant 196
Table 11: Table of results for 100 g filter cakes / 100% L200 / 100 ml DI / No settling / 2.5 bar / with changing temperature
198
Table 12: Photographs of cracked filter cakes (top surface) from experiments conducted in Section 4.1 (Settling and
concentration with increasing mass fraction of L15) 202
Table 13: Photographs of cracked filter cakes (bottom surface) from experiments conducted in Section 4.1 (Settling and
concentration with increasing mass fraction of L15) 203

xv
Nomenclature
𝒜 Hamaker constant J
α Half filling angle °
α f Filtration average specific resistance /m2
α p Permeation average specific resistance /m2
β Filling angle °
Γ Surface excess mol/m2
Ɛ Permittivity F/m
ζ Zeta potential V
θ Contact angle °
θc Critical angle °
к Debye-Huckel parameter /m
λ Pore distribution index -
µ Viscosity Pas
µi Chemical potential J/mol
ρ Principal radius of liquid meniscus m
ρl Density of liquid kg/m3
ρs Density of solid kg/m3
σ Gibbs convention -
σs Cumulative drag stress N/m2
σt Tensile strength N/m2

xvi
Nomenclature cont’d
Ƴ Surface tension N/m
Ƴs Size ratio between spheres -
Φ Particle volume density -
ϕ Moisture content -
ψd Stern potential V
Øs Shape factor -

xvii
Nomenclature cont’d
A Filtration area m2
Ai Area of adsorption interface m2
ai Activity of component i mol/m3
B Permeability m2
Bl Liquid permeability m2
Bg Gas permeability m2
C Solid concentration -
CD Drag coefficient -
Ci Surfactant concentration of component i mol/m3
d Particle diameter m
dm Mean particle diameter m
e Porosity -
eo Porosity of dry spheres -
eav Average porosity -
esph Porosity of spherical particulate bed -
F Total force on particle N
FH Adhesion number -
Fc Capillary force N
Fg Gravity force on a particle N
F* Mean adhesion force transmitted at a contact point N

xviii
Nomenclature cont’d
f Activity coefficient -
H Surface to surface separation between particles connected by a capillary bridge
m
Hs Separation between particle surfaces in a dispersion m
j Variable dependent on Re -
k’’ Kozeny constant -
L Meniscus radius m
l Filter cake height m
M Liquid content -
Mp Parking number -
m Compressibility index -
mcake Mass of wet cake kg
msolids Mass of solids kg
mwater Mass of water in cake kg
Nc Capillary number -
n Number of moles -
ni ions per unit volume /m3
PM Applied mechanical pressure N/m2
PT Transmitted pressure N/m2
Pc Capillary pressure N/m2

xix
Nomenclature cont’d
Pe Capillary entry pressure N/m2
Pl Liquid pressure N/m2
Pnw Non-wetting phase pressure N/m2
Ps Solid pressure N/m2
Pw Wetting phase pressure N/m2
ΔP Pressure differential N/m2
ΔPc Cake pressure drop N/m2
ΔPm Medium pressure drop N/m2
Re Reynolds number -
R’ Resistance per unit projected area of particle N/m2
RF Force ratio -
Rc Cake resistance /m
Rl Moisture ratio -
Rm Medium resistance /m
Rv Void ratio -
ΔRv, max Shrinkage potential -
r Particle radius m
rc Capillary radius m
rs Sauter diameter m

xx
Nomenclature cont’d
S Specific surface area /m
SR Reduced saturation -
Sl Liquid saturation -
Sr Equilibrium saturation -
S∞ Irreducible saturation -
s Cake solidosity -
T Temperature K
t Time s
uc Average velocity of fluid flow through bed m/s
uo Settling velocity m/s
ut Free settling velocity m/s
V Volume of filtrate m3
VA van der Waals attraction energy J
VR Electrical repulsion energy J
VT Total potential energy of interaction J
xxi
Nomenclature cont’d
Vc Volume of capillary bridge m3
Vg Volumetric flowrate of gas m3/s
Vl Volumetric flowrate of liquid m3/s
Vrel Relative volume of capillary bridge m3
v Volume of cake deposited per unit volume of filtrate -
x2 Mass fraction of small particles -
Z Valency -
Note: When alternative units are used, these will be stated

1
1 Filtration
Shrinkage and cracking during the deliquoring of compressible filter cakes by means of differential
gas pressure is an undesired occurrence of great practical importance to the pharmaceutical
industry. It is highly unfavourable to the deliquoring process, ending it swiftly and prematurely.
When a crack forms, it can propagate through the body of the filter cake, towards the filter medium
(sometimes branching into numerous cracks). When a crack reaches the filter medium, it can lead to
an exposition of the filtration area, resulting in a channelling effect whereby the gas flows
preferentially through the network of cracks rather than displacing the interstitial liquid. This
reduces the effectiveness of the deliquoring process, the economic consequences being an
increased gas consumption, as well as a higher residual moisture content (which leads to an
increased thermal energy input in the later drying stages). Figure 1 shows two examples of calcium
carbonate filter cakes with cracks, illustrating the damaging effect that cracking can have on the
filtration process.
Figure 1: Photographs of cracking in filter cakes on a) the underside of a cake adjacent to the medium b) the side of a filter cake
In order to understand the mechanisms behind filter cake cracking, an understanding of filtration
theory is paramount. From the interparticle forces at play during slurry addition, the particle size
profile that develops during filtration, through to the capillary forces induced between particles
upon depletion of the supernatant, all aspects are of great significance.

2
1.1 Filtration overview
Filtration can be defined as the separation of solids from a suspension by means of a porous medium
which retains the solids and allows the passing of the liquid. In ancient times the process was carried
out using felts, and the word ‘filter’ shares a common etymology with this word. The liquid collected
is referred to as the filtrate, and the solids are retained as the filter cake. Filtration is a long standing
engineering practice, and its underlying principles can be traced back to the ancient practice of
squeezing juice through a cloth in the manufacture of sugar. Application of filtration can be found in
many industries, including pharmaceutical, paper, beverage and waste water. In the entire solid–
liquid separation process, filtration is a very important step. Solid-liquid separation can be broken
down into four main stages; Pre-treatment, Solids concentration, Solids separation and Post
treatment1. These are summarised in the diagram below:
Figure 2: Stages of solid-liquid separation (Reference 1)

3
Pre-treatment: this stage is mainly for increasing particle size, reduction of viscosity, etc.
Flocculation can be induced by means of chemical additives to increase particle size. Solvent
dilution can be used for reduction of viscosity.
Solids concentration: this is mainly to reduce the volume of material that is to be processed.
It can be by simple means of gravity sedimentation, or cyclone thickening.
Solids separation: this stage is for separation of solids from liquid, to produce a liquid with
minimum particulate content and a cake with low moisture content.
Post treatment: this is to further remove moisture and prepare material for downstream
processing.
In the pharmaceutical industry, solid-liquid separation processes generally follow the reaction,
precipitation and crystallisation stages, later followed by thermal drying. There are two main types
of filtration; cake filtration and depth filtration. In cake filtration, particles are deposited in layers on
the filter medium, and as the layers build up, smaller passages and openings are created which
remove even smaller particles from the flowing fluid. A filter cake is thus formed, and this in turn
acts as a medium for the subsequent deposition of particles from the suspension, which becomes
the true filter medium. Due to the continuous deposition of solids, the filter cake steadily increases
in thickness, and if the filtration pressure is constant, the flowrate diminishes as the resistance to
flow progressively increases. In depth filtration, deposition of the particles occurs inside a deep filter
layer where they are retained. Separation is effected throughout the entire depth of the filter
medium. The particles to be collected are smaller than the openings, and they proceed through
deep, tortuous pore networks where they are collected in the interstices through electrostatic
forces. It is the study of cake filtration that will form the basis of this thesis. Cake filtration has a
greater application than depth filtration, in particular with the chemical and pharmaceutical
industries. Surface filters tend to be used with high concentrations of solids, the cut off point being
nominally around 1% solids volume.
4
The concept of filtration is very simple, and ideally all of the particles will be removed and the filtrate
will be clear. However, in practice full separation does not happen, as the medium permits the
passing through of a small proportion of particles resulting in some small solids collected in the
filtrate; this is termed ‘turbidity’. Conversely, there will always be some liquid retained in the filter
cake as discrete lenses of liquid bound to the particles in the filter cake. It is the latter which is
generally the greater concern of the two. With the former, the pores of the medium are
theoretically smaller than the particles that contact it, and this prevents them from passing through.
In practice however, wide size distributions are employed and the pores of the medium are larger
than most particles, but with a sufficiently high solid concentration in the suspension, solids will
bridge over the pores of the filter medium.
The process of filtration can be simple, such as gravity straining, or it can be a complex separation
governed by the physical properties of the suspension components and the process conditions used.
It is a mechanical operation with energy requirements much lower than those of thermal drying,
where the high latent heat of the liquid warrants a much greater energy input. The energy required
to mechanically remove liquid from a filter cake is negligible compared to the heat required in the
later thermal drying stages. In order to obtain a fluid flow through the filter cake and medium, a
pressure differential is needed, and such a driving force is usually effected by means of vacuum,
pressure application or centrifugal force2-5.

5
Figure 3: Schematic diagram of a filtration system (Reference 2)
The means of achieving a pressure differential is immaterial, however limitations do exist. With
vacuum systems the pressure differential achievable is limited, and these systems are only effective
up to around 0.8 atm. In addition, such systems cannot handle solvents with high vapour pressure.
With centrifugal systems however, maximum separating forces are attained, and with higher
centrifuge speeds, denser packings are achieved6.
Equations for the flow of a fluid through a bed of granular material are well established and can be
applied to filtrate flow through a filter cake, however differences can be expected as these
equations are relevant to fixed beds with a relative uniformity throughout, whereas in filtration the
cakes are rarely homogeneous and are steadily growing. At the start of the filtration process, the
whole pressure drop available is across the filter medium. As the particles are deposited and the
cake grows, a larger proportion of the pressure drop is gradually taken up by the filter cake. The
classic two resistance model is an important basis in establishing constitutive relationships regarding
filter cake formation above a medium. With frequently used filtration models, the assumption is that
solids are deposited on the filter medium as a homogeneous porous layer, with a constant
permeability and a linear pressure drop that is proportional to the quantity of solid deposited.

6
Modern filtration theory is based on Darcy’s law7, an empirical equation describing fluid flow
through porous media that is uniform, and it has been developed for over a century by numerous
workers. B.F. Ruth is commonly held as an important early pioneer of modern cake filtration, and the
foundation he laid has been built upon by subsequent researchers such as Carman8,9, Grace10,11 &
Tiller12-24 amongst many others. The body of knowledge yielded, commonly known as ‘Conventional
theory of cake filtration’, allows for a simplified analysis of filtration and prediction of process
performance.
In the early 1930’s, Ruth’s series of groundbreaking papers titled ‘Studies in filtration’ 25-28 provided
an overview of what had been published by fellow investigators, whilst also progressing the then
new concepts of medium resistance contribution, parabolic relationships of flow and linearized
plots; concepts still widely applied today. The body of work prior to Ruth’s publications gave
filtration relationships based on those of Almy and Lewis29, and Sperry30-31. The interpretation by
Almy and Lewis of their experimental results concluded that filtrate flowrate was a power function
of both pressure and filtrate volume. Sperry’s work deduced from the theoretical, built on the basis
of Poisseuille’s Law being used as the basic law of filtration, with provision made for the effect of
medium resistance. Baker’s later work32 was in accordance with Almy and Lewis, whilst Sperry’s
assertions were bolstered by Hinchley et al.33 and others with the belief that medium resistance
must be an integral part of the filtration equation, thus introducing the analogy of specific cake
resistance with electrical resistance34. It was Ruth26 who demonstrated a parabolic relationship
between filtrate volume and time for a wide range of material, independent of the degree of
compressibility. It was on this, plus the corralling of theories from numerous researchers of the time
that he devised his empirical generalisation termed ‘Fundamental axiom of constant pressure
filtration’27,28. Sperry had noted parabolic behaviour in 1916, but this was for incompressible
material30. Ruth went on to derive the theories upon which modern filtration is based. This
foundation was further built on by workers such as Grace, and later the theoretical concepts of
porous media were put forward by Kozeny and Carman. In the 1950’s, another breakthrough

7
occurred when Tiller published the first in his series of papers titled ‘The role of porosity in
filtration’12-24. In a body of work that spanned decades, he looked at certain approximations made
with the Ruth equation, which he believed may be invalid under certain circumstances, and showed
amongst other things that specific resistance, mass ratio of wet cake to dry cake, and flowrate
(dV/dt) could not be taken as had been assumed15. In a paper with Shirato, he introduced a
correction term to Ruth’s average specific resistance17. He later investigated porosity variation
within a filter cake, and was one of the first to report on bulk hydraulic pressure loss being
concentrated in the thin layer closest to the medium with fine particles16,20. Further papers in a body
of work stretching over fifty years looked at sidewall friction, effects of sedimentation, and
assumptions of point contact between particles, in an esteemed career that challenged and tested
the assumptions on which modern filtration is based.
The foundation of this entire body of work started with a series of differential equations aimed at a
more detailed understanding of the motion of fluids through the porous structure under an applied
pressure differential. Due to particle rearrangement and changes in pore structure, the porosity and
flow behaviour within the filter cake are affected, and these structural changes are caused by
transmission of stresses at point contact. It is the introduction of these complexities that to this day
still challenges researchers around the world. The basis of conventional theory is a number of
assumptions, and although the validity of some of these assumptions has been called into question,
conventional theory is still widely accepted. Key features of the dynamic behaviour of the filtration
process include the evolution of the cake structure and the filtrate volume and rate collected for
specified operating parameters, giving the filtration theory developed the capability of making
practical predictions. The assumptions include the following: i) solid phase velocity is negligible; ii) at
any instant the fluid velocity is constant across the cake; iii) cake properties such as solidosity,
permeability and specific resistance are functions of compressive stress only; iv) the relationship
between solid and liquid pressure is: 35.

8
Tiller and Cooper15 pointed out further assumptions that served as the basis for the conventional
equations employed in constant pressure filtration that were in error. In constant pressure
filtrations, the ratio of wet cake mass to dry cake mass was assumed to be constant, and that at any
instant the rate of flow was constant throughout the filter cake i.e. independent of distance through
the filter bed. These are in error. Following Tiller and Shirato’s17 defining of a new average filtration
resistance accounting for internal variation of flowrate and porosity throughout the filter cake,
Shirato et al.36 modified this to take into account variation in solid velocity, as solid movement is
such that it cannot always be assumed to have a value of zero. Under certain conditions, such as
short filtration times or high concentration, it can be comparable to that of liquids. Sedimentation
effects, blinding, pressure variation at the cake medium interface and interparticle forces are other
factors that conventional filtration does not take into consideration. Rigorous analysis and testing of
these assumptions has been attempted, and though the above questioning of base assumptions are
still echoed, the conventional method of determining properties of a filter cake is still to this day
based on a linearized plot of t/V vs V. A lot of the complexities encountered with cake filtration stem
from the compressible behaviour of the filter cakes formed. For given conditions, the extent of
compression endured is determined by the compressive stress resulting from the drag forces acting
on the particles that make up the filter cake.
Though conventional filtration theory is out of its infancy, it is still an evolving theory, with
numerous interesting branches. Novel studies have been conducted looking at the unconventional,
though these are still rooted in the fundamentals of filtration theory. These include the use of
ultrasonic technology37, the use of electric and acoustic fields38 and also the method of deliberately
damaging a filter cake39 in order to improve dewatering and lowering final residual moisture
contents.
9
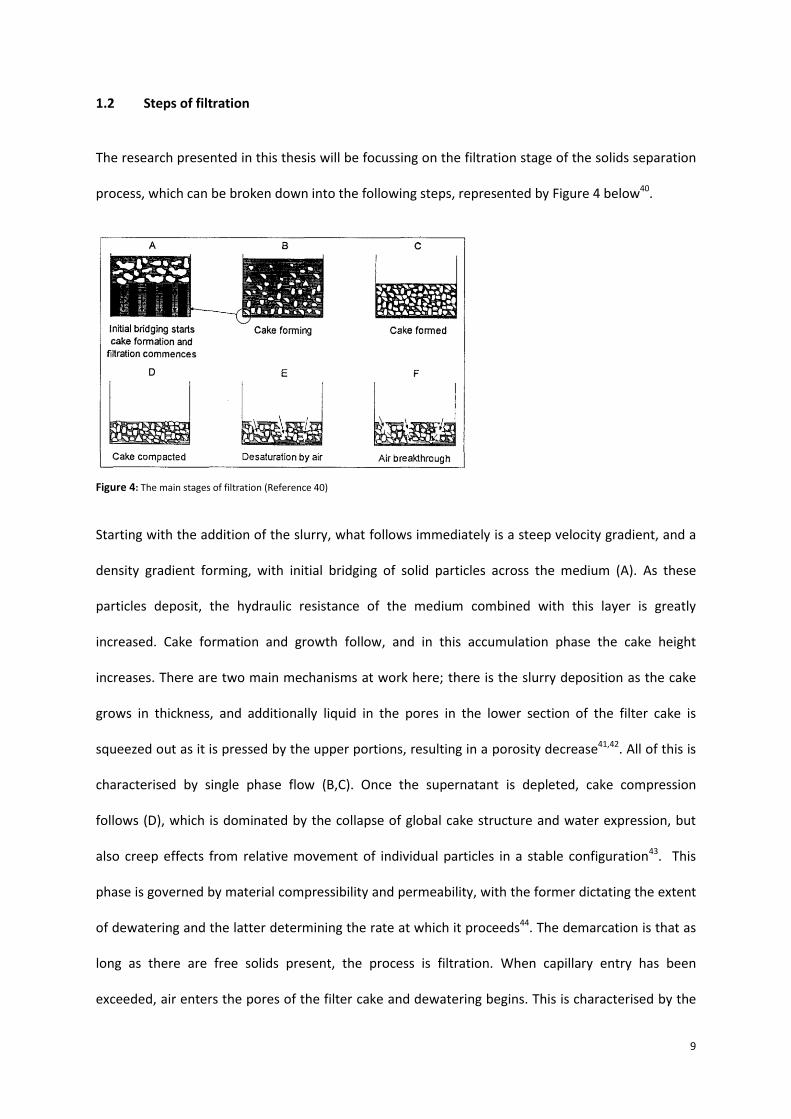
1.2 Steps of filtration
The research presented in this thesis will be focussing on the filtration stage of the solids separation
process, which can be broken down into the following steps, represented by Figure 4 below40.
Figure 4: The main stages of filtration (Reference 40)
Starting with the addition of the slurry, what follows immediately is a steep velocity gradient, and a
density gradient forming, with initial bridging of solid particles across the medium (A). As these
particles deposit, the hydraulic resistance of the medium combined with this layer is greatly
increased. Cake formation and growth follow, and in this accumulation phase the cake height
increases. There are two main mechanisms at work here; there is the slurry deposition as the cake
grows in thickness, and additionally liquid in the pores in the lower section of the filter cake is
squeezed out as it is pressed by the upper portions, resulting in a porosity decrease41,42. All of this is
characterised by single phase flow (B,C). Once the supernatant is depleted, cake compression
follows (D), which is dominated by the collapse of global cake structure and water expression, but
also creep effects from relative movement of individual particles in a stable configuration43. This
phase is governed by material compressibility and permeability, with the former dictating the extent
of dewatering and the latter determining the rate at which it proceeds44. The demarcation is that as
long as there are free solids present, the process is filtration. When capillary entry has been
exceeded, air enters the pores of the filter cake and dewatering begins. This is characterised by the

10
flow of two phases through the filter cake (E). Air breakthrough at the filter medium follows (F), and
equilibrium saturation is later reached 40.

11
1.3 Flow through porous media
The mechanism of flow through a porous matrix and the filter medium that supports it forms the
basis for the modelling of the filtration process. Though fluid flow through beds of stationary
granular particles is a common occurrence in numerous operations, filtration is a unique case in that
it is subject to a continuous deposition of solids and a progressively increasing resistance to flow.
The origin of modern filtration theory can be traced back to Henry Darcy7 who in 1830’s Dijon
studied water flow from local fountains through beds of sand. He found that the average velocity
was directly proportional to the driving pressure and inversely proportional to the thickness of the
bed.
This relationship is termed ‘Darcy’s Law’, and is as follows:
( )
1
uc is the average velocity of flow through the bed, l is thickness, –ΔP is the pressure drop across the bed, K is a constant
The linear relationship between flowrate and pressure difference indicates that the flow is
streamline, which is to be expected as the Reynolds number for flow through pore spaces in granular
material is small due to low velocity and channel widths being narrow. The resistance to flow is then
mainly due to viscous drag.
The Darcy relationship is then expressed as:
( )
2
B is the permeability coefficient for the bed, µ is the fluid viscosity.
Packing properties are influenced by the geometry of the void space within the porous medium,
which depends upon particle shape, size distribution and the type of packing. It is of great practical
importance to identify the properties of a packing that are uniquely defined by geometry, and do not
depend on the nature of the fluids contained within the spaces. Of these macroscopic structure
12
parameters, one of the most readily measurable is the porosity, e. Porosity is the fraction of the
volume of the bed that is not occupied by solid material. It is common practice to use it as an
independent parameter, separated from particle shape and size distribution, even though it depends
on these more fundamental factors45. Another important parameter is the specific surface area, S,
which is independent of the type of packing and mean voidage, and is determined by the shape and
size distribution. Specific surface area of the particles is the surface area of a particle divided by its
volume. It is assumed that point contact occurs, meaning that an insignificant fraction of surface
area is lost due to overlapping. Specific surface area can be determined by methods such as BET (N2
adsorption) and Rhodamine B adsorption46. Methods to measure porosity include mercury
porisometry47. The specific surface area and the porosity of the bed, e, then characterise the
structure of the particle bed.
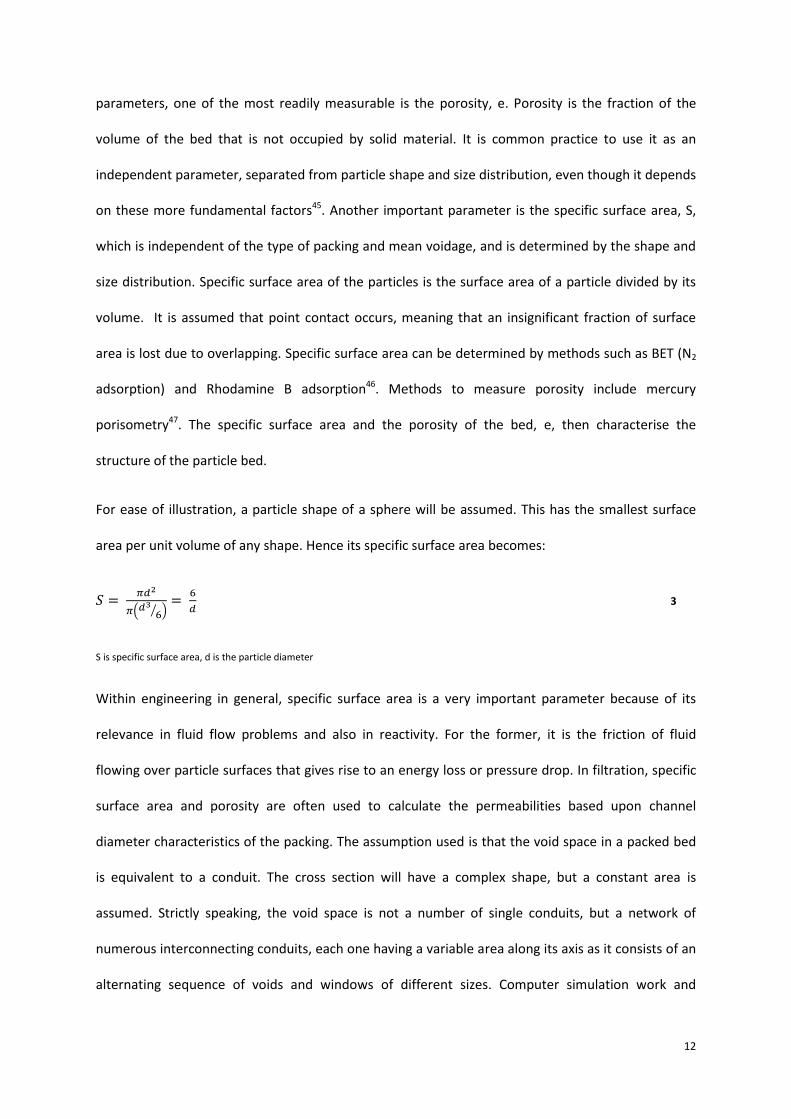
For ease of illustration, a particle shape of a sphere will be assumed. This has the smallest surface
area per unit volume of any shape. Hence its specific surface area becomes:
(
⁄ )
3
S is specific surface area, d is the particle diameter
Within engineering in general, specific surface area is a very important parameter because of its
relevance in fluid flow problems and also in reactivity. For the former, it is the friction of fluid
flowing over particle surfaces that gives rise to an energy loss or pressure drop. In filtration, specific
surface area and porosity are often used to calculate the permeabilities based upon channel
diameter characteristics of the packing. The assumption used is that the void space in a packed bed
is equivalent to a conduit. The cross section will have a complex shape, but a constant area is
assumed. Strictly speaking, the void space is not a number of single conduits, but a network of
numerous interconnecting conduits, each one having a variable area along its axis as it consists of an
alternating sequence of voids and windows of different sizes. Computer simulation work and

13
experimental analysis of pore structure using X-ray microtomographic techniques by Lin et al.
showed that more than 99% of the pore space is part of a well-connected pore system48,49.
It is a fundamental flaw of all simple models of pore structure that they do not account for this fact
when dealing with permeable porous media. The pores and conduits formed are interconnected and
what results is this continuum of a network of pores. Shortcomings notwithstanding, the hydraulic
radius theory used in Carmen Kozeny has been very useful in the case of random packings of
spherical particles of a narrow size distribution. Most of the voids and windows are contained in a
narrow size range and the shapes of these conduits are not significantly different from each other. It
was Blake50 who first put it that a packed bed can be defined in terms of a single pipe of a
complicated cross section. The analogy then between streamline flow through a tube and flow
through the pores in a particulate bed is used as a starting point in deriving a general expression,
with a basis in the assumption that pore space is a series of tortuous channels with a common
hydraulic radius and representative shape of pore cross section. Porosity is then assumed to be an
isotropic property, and the packed bed is then defined by the pores between a solid particulate
phase within some form of containment. So although the resistance to fluid flow through the porous
medium is related to the amount of particles that are present i.e. solids fraction, it is conventional to
work in terms of the porosity of the bed. General expressions for pressure drop51 and mean velocity
for flow through packings in terms of porosity and specific surface are often used, as these
quantities are often known or can be measured.
The superficial velocity of the filtrate can be represented at any instant by:
( ) ( )
4
k’’ is the Kozeny constant, e is porosity
As can be seen, important factors on rate of filtration include the filtration area, viscosity and the
pressure drop across the filter cake. When comparing the Darcy equation with the Kozeny equation,

14
it can be concluded that the Kozeny equation is a subset of Darcy’s equation, with an analytical
expression for permeability given by the following:
( ) 5
Permeability is an indication of the ease with which a fluid will flow through a bed of particles5. It is
dependent on bed porosity and specific surface area, which is logical when thought of as being
inverse to the resistance to fluid flow, as the higher the surface area exposed to the fluid in the
porous medium results in a greater viscous drag of the fluid. It is the friction of this fluid flow over
the exposed surface of the particles that results in a pressure drop. With finer particles, a higher
surface area results, and therefore a higher flow resistance.

15
1.4 Filtration Theory
There are a number of assumptions with specific filtration resistance, an important one being that it
is solely a function of cumulative drag stress. The linearized version of the parabolic volume time
discharge curve was put by Ruth27 as being able to ‘describe the constant pressure behaviour of a
wide range of materials, independently of their degree of compressibility’, and that the cumulative
drag stress on the solids is equal to the cake pressure drop. The fluid motion due to the hydraulic
pressure gradient leads to an interfacial momentum transfer at the interface between solid particles
and the liquid.
A force balance is generally taken in the form of:
6
σs is the cumulative drag stress, and ΔPc is the filter cake pressure drop
The theoretical development and experimental results of Willis et al.52 indicated that the ratio of
cumulative drag stress to filter cake pressure drop is actually closely correlated with cake porosity,
and that:
7
Though the comment above ascribed to Ruth is a valid observation, and a large amount of
experimental data indicate this to be true, Ruth at the time was unable to describe the internal
mechanism of filtration. It was generally assumed that specific resistance was constant, as was the
ratio of wet cake to dry cake and the flowrate throughout the filter cake at any instant. It was from
this that Ruth derived the parabolic relation between filtrate volume and time.
In the subsequent years, filtration theory has advanced greatly, indicating the assumption used by
Ruth may not always be valid. With compressible materials, local resistance varies throughout,
average cake resistance may not be constant during filtration, and liquid flowrate changes as it
16
passes through the filter cake. Yet this filtration relationship built on incomplete assumptions is seen
to be valid for a wide range of materials41. The concept of parabolic filtration is based on the
experimental observation that filtrate discharge is usually a parabolic function of time at constant
pressure. The linearized parabolic correlation, first presented by Sperry30,53, is of the form t/V = aV +
b, and the linear characteristics yield average specific resistance and medium resistance from the
gradient and the intercept respectively. Though no incompressible cake truly exists, those tagged
incompressible exhibit linear pressure distribution. However, with compressible filter cakes, non-
linear distributions are exhibited. Incompressible filter cakes are rare, and cakes with linear or non-
linear distributions can be described by the parabolic correlation sufficiently, thus confirming Ruth’s
observation27. This is not to be misconstrued that all filtration must follow this correlation, rather
that deviations from it must be attributed to causes other than non-linear pressure distribution.
Starting with the Kozeny equation of the form:
( )
( )
8
A is the cross-sectional area of the bed, V is volume of filtrate, and t is time
which is often abbreviated to
( )
9
where
( )
10
αf is the average specific cake resistance
The relationship between thickness of the filter cake and the volume of filtrate collected is
11
v is the volume of cake deposited by unit volume of filtrate

17
Substituting equation 11 into equation 9
( )
12
For filtration at constant pressure
∫ ∫ ( )
13
( ) 14
Though t/V vs V plots are useful in calculating average filter cake resistance and medium resistance,
experimental data often deviate from the linear characteristics seen in typical illustrations of these
charts. Some examples of these deviations are shown in Figure 5, and they help understand the build
up and structure of the filter cakes formed.
Figure 5: Typical deviations from linearity (Reference 2)
The type of deviation achieved will indicate the nature and causation of secondary effects. They are
as follows2 : a) this is the theoretical linear ‘curve’ without secondary effects; b) in this case, some
solids have settled before filtration has started, apparently increasing the resistance of the filter
medium; c) in this case, turbidity has occurred at the start of filtration. The solids loss diminishes the
amount of cake, apparently indicating a negative medium resistance. Alternative scenarios are the

18
case where no turbidity is found in the filtrate, and then the solids may have accumulated inside the
filter medium (blinding), or the solids float and clear liquid is initially filtered; d) the solids settle out
completely, increasing the speed of growth of the filter cake. Towards the end of the filtration
process, clear liquid flows through a cake of constant resistance (permeation); e) in this scenario
only coarse particles settle, and after some time only the remaining fine particles are filtered and the
filter cake resistance progressively increases; f) one possible explanation for this is that fine particles
trickle through the cake and block the pores of the cake or medium.
Whilst most filtration theory is developed on incompressible filter cakes, the slurries of practical
interest are the compressible cakes, these being cakes where resistance is sensitive to changes in
applied pressure. Local pressure drop varies from a null value at the interface with the slurry, up to a
maximum at the filter medium. The local porosity decreases and the local specific resistance
increases in the direction of flow, which leads to the concept of average specific resistance54.
Carman reasoned that average specific resistance is constant during filtration as filtration data with
compressible suspensions fit the standard model for incompressible suspensions i.e. t/V vs V plots
produced straight lines8. The apparent constancy seen with average cake resistance during pressure
filtration was established through demonstrating the parabolic relationship of filtrate volume
collected with time, in accordance with the theoretical prediction by Ruth. It was Ruth who put it
that this parabolic form be accepted as an axiom on which filtration relationships be derived. It was
later that Tiller theoretically showed that these filtrate volume vs time curves were not perfect
parabolas. The initial period, when the pressure drop is mainly across the medium, means a
substantial pressure loss across the filter cake17. So, the assumption that the pressure difference
across the cake is constant during filtration is erroneous, as it actually increases from zero at the
start of the filtration process (when all of the pressure drop is across the filter medium) to almost
the full applied pressure by the end. As specific resistance of a compressible material is a function of
this pressure, it must increase from start to finish i.e. it is a variable rather than a constant. It should
19
be noted however that with most slurries, the pressure across the cake increases quickly from zero
to the nominal full amount with the deposition of only a small amount of cake.
Willis et al.55,56 would later postulate that it is the septum permeability that determines non-
parabolic behaviour and its extent of deviation; the greater the degree of blinding, the larger the
deviation. Tiller et al.57 proposed a revised theory whereby the average filter cake resistance was
multiplied by an exponential function to take into consideration the effects of blinding of the cake
and medium. As shown however in Figure 5, non-linear data can be found in a lot of filtration plots,
often concave or S shaped. Christensen et al.54 believed that non-linear data was associated with
filtration runs that involved filtration with simultaneous sedimentation. This will be discussed in
more detail in Section 1.5.2. Despite the errors highlighted, the conventional method of determining
average specific resistance values is still based on the linear slopes of t/V vs V plots.
Looking at the initial period of filtration in more detail, from conventional cake filtration theory the
value of average specific resistance remains constant during the entire filtration. The main filtration
equations do not consider the initial period of filtration and the shared pressure differential with the
medium. It makes no differentiation between cake at the initial period and that of the later period,
even though the ratio of cake resistance and filter medium resistance is very different as the
pressure drop over the medium diminishes towards zero.
Tiller et al. 15 reasoned that the average cake resistance at the initial period of filtration was smaller
than at the latter period. He theorised that initially the pressure drop across the cake is small due to
pressure distribution with the medium, and this phenomena of the sharing of applied pressure can
cause a reduction in the cake resistance. Tiller concluded that the average cake resistance during this
initial period is a lot smaller than at the end. Yim et al.58,59 disagreed, postulating that the fast
flowrate which is inevitable at the start of filtration gives greater drag to the particles in these initial
layers. This drag force compresses the cake, enlarging the cake resistance to a great extent. They
characterised this period with large flux due to fast flowrate and its rapid change. Their measured

20
cake resistances of thin cakes which were taken to represent resistances from the initial period were
very large compared to the overall average specific cake resistance. They concluded that the average
specific resistance during this initial period can have large values in comparison to the overall value.
In conventional filtration, the filter medium resistance tends to be ignored as the cake resistance is
much larger than the medium resistance for most of the filtration process, but with some small cake
masses it is not possible to ignore this resistance.
As covered earlier with the electrical resistance analogy, in most cake filtration models the
assumption is that Darcy’s law can be applied to both the slowly forming cake and the filter medium,
such that there are two resistances to fluid flow, and their resulting pressure drops can be added
together3.
15
∆Pc is the pressure drop over the filter cake, ∆Pm is the pressure drop over the medium
The medium resistance term is taken to be constant, but the cake resistance term increases as
deposition of particles proceeds and cake height increases. The sum of the two resistance terms is
the total resistance. Though Rm is usually considered constant and not considered significant in
comparison to Rc, the assumption is erroneous as Rm can increase with blinding of the medium.
( ) 16
Rc is the filter cake resistance, Rm is the filter medium resistance
As cake height increases, Rc will vary. And as shown earlier, for incompressible cake filtration it is
taken that there will be a constant volume of cake deposited per unit volume of filtrate, hence
assumed the relationship between l and V.

21
During filtration at constant feed concentration, specific resistance and cake mass per unit volume
are taken to be constants, hence cake resistance varies proportionally with filtrate volume, which
leads to:
17
which is known as the ‘General filtration equation’. Time, volume and pressure drop are the
variables, and the remainder are assumed constant for filtration of a specific material with the
assumption of a homogenous slurry. With constant pressure filtration, it can be integrated from time
zero to time t, and the volume of filtrate changes from zero to V (i.e. the total volume at time t).
Integrating and rearranging this equation between these limits gives:
18
which is the equation of a straight line of the form t/V = aV + b. The gradient of this line can be used
to calculate the average specific resistance, and the intercept value can be used to calculate the
resistance of the filter medium. This method has been widely used to calculate filter medium
resistance for many years. As covered earlier, medium resistance calculations can lead to errors.
Filter medium pore size are often larger than the particles themselves, and turbidity is an
inevitability as particles pass through the pores during the initial period leading to a negative
intercept, and larger pores permitting the passing of particles is what was found by Yim et al.60 They
also determined that small particles blocking up the pores falsely increase the apparent medium
resistance, as well as the average cake resistance. It is thought that small particles migrate through
the filter cake down towards the filter medium30. This will be covered in greater detail in later
sections.

22
1.4.1 Incompressible and compressible cake filtration
Filter cakes are generally classed as compressible or incompressible. With an incompressible filter
cake, the resistance to flow is not appreciably affected by increases in pressure. However, with a
compressible filter cake, the resistance increases as pressure increases. When axial pressure
measurements are plotted against position in the cake in dimensionless form, for incompressible
filter cakes a linear distribution is displayed. For compressible filter cakes, curved lines are displayed
as demonstrated in Figure 6, and the more compressible the cake, the greater the deviation from
the straight line of incompressibility.
Compressibility can be thought of as the specific resistance’s sensitivity to changes in pressure. The
flow of fluid causes a viscous drag at the particle-particle interface, and this sometimes collapses the
particulate structure. The local solids content increases, displacing liquid. It defines the degree of
structural collapse brought on by solids compressive stress. The internal mechanisms that govern
the flow of fluid through a filter cake and its compressibility are controlled by frictional drag forces
and the structural changes that result. This coupled action affects the local porosity and liquid
permeability21. Compression of a filter cake is the result of the compressive stress on the solids. The
loss in liquid pressure translates into solids pressure, the sum of both assumed constant.
19
20
Pl is the local liquid pressure (hydraulic pressure), PS the solids compressive pressure
The frictional drop of the liquid pressure is offset by a corresponding increase in the solids
pressure12. The former is the accumulative frictional drag on the particles that make up the
particulate bed between a point in the filter cake and the surface. The hydraulic pressure enters the
Darcy equation and the solids compressive pressure determines the degree and state of structural
collapse, and this is reflected in the local values of permeability and porosity.

23
A cake’s compressibility is of great importance to filtration. The most commonly used relation is the
power law expression:
21
a is a constant, and m is the compressibility index
A value of zero for m denotes an incompressible filter cake, and as the value of m increases, so too
does the cake compressibility61. When m > 1, the material is considered to be highly compressible,
and as m becomes larger, filtration pressure has a decreasing effect on flowrate and average
porosity during the filtration process22. The properties of a compressible filter cake can be
determined by the nature of the initial sediment in an unstressed state, in particular null stress
solidosity and the change to the structure as stress is applied to it, resulting in a decrease in porosity
and an increase in cake resistance. The initial particle arrangement and the local value of effective
pressure that arises from the viscous drag on the particles determine the structure of the
compressible bed. One important assumption is that particles are in point contact and the internal
stress is passed down through these contact points. The layer of particles adjacent to the filter
medium is exposed to the highest compressive drag, subjecting it to the greatest deformation, and
as a result a porosity profile develops.

24
Figure 6: Hydraulic pressure and solids pressure as a function of filter cake height (Reference 2)
The pressure-distance curves in Figure 6 illustrate the translation of solids pressure into liquid
pressure throughout the height of the filter cake. A skeletal stress develops early in the filtration
process62, and as cake formation progresses, most pore liquid pressure loss will occur close to the
medium where solids concentration is greatest. As filtrate flows through a filter cake, a drag force is
exerted on the particles that form the cake, and it is transmitted through successive layers of
particles, its magnitude increasing progressively in the direction of flow. At any point this force is
equal to the summation of the forces on all particles up to that point30. With compressible cakes, a
porosity profile develops, decreasing as the filter medium is approached. As the pressure gradient in
the fluid causes the viscous drag at the particle fluid interface, if the packing structure cannot sustain
this drag without deformation, a new, more stable structure is formed. These changes in particulate
structure invariably result in changes to flow pattern and permeability. With incompressible filter
cakes, the drag forces will not alter the structure of the filter cake, and the pressure gradient will be
uniform throughout the body of the cake. Most filter cakes are compressible to some degree,
however in some cases the change in resistance is by such a small extent that the cake can be
regarded as being incompressible. With filtration of powder suspensions, the cakes provided are
generally inelastic, and an increase in pressure drop across a filter cake results in a greater resistance
25
caused by a more compact packing of the particles forming the cake. Even if this high pressure
difference is only briefly maintained, once the working pressure is reduced, the specific resistance
will correspond to that achieved at the higher pressure63. In contrast, with microbial filtration,
compression tends to be reversible61.
Viscous interphase momentum transport occurs only under the condition that there is relative
motion between the solid and the fluid. So, as expected, particles in the suspension phase do not
experience this drag, and consequently it is zero at the interface between the filter cake and
suspension. It is at a maximum at the interface between the medium and the filter cake. The
particles here experience interfacial momentum transport with the fluid that surrounds it, and also
the cumulative drag force of the contacting particles above50. The relationship between compressive
stress and liquid pressure taken to be is one of the main assumptions of
conventional filtration theory, and these assumptions are held up to further investigation. The origin
of compressive stress can be found with Walker et al.64 who determined that the flowing liquid
imparts a fluid drag on the particles that constitute a filter cake, and as the particles are contiguous,
the forces experienced by individual particles are transmitted and accumulated in the direction of
liquid flow. A compressive stress in the solids phase results. Ruth27 proposed the above relationship
between pore liquid pressure and compressive stress.
Numerous investigators65,66 have considered other relationships, the following are two of several
that have been advanced, obtained by Willis et al.52 and Rietema67.
( ) 22
( ) 23
s is cake solidosity
The conventional parabolic law of filtration at constant pressure is still generally based on a Pl – Ps
relationship where their sum is a constant. As stated earlier, conventional theory is constantly

26
evolving, and there is much discussion around many of the assumptions made. Comparisons from C-
P cell measurements on various Pl – Ps relationships by Tien et al.65 found that the relationship
which yielded the best comparison was in fact system specific and dependent on filter cake
compressibility.
27
1.4.2 Surface charge
When brought into contact with a polar medium, most particles acquire a surface electric charge
which influences the distribution of ions in the bulk dispersant. Counter-ions are attracted towards
the particle surface, and co-ions are repelled away. Together with the mixing tendency due to
thermal motion, an electrical double layer is formed, comprising the charged surface and a
neutralising excess of counter-ions over co-ions distributed in the dispersion. When this occurs,
behaviour of fine particles in particular is influenced greatly by flocculation tendency. When
flocculation occurs, it results in the agglomeration of elementary particles that are effectively
enlarged particles that are easily distorted. Particles in a dispersion collide due to their relative
motion, and the dispersion stability is determined by the interaction between particles during these
collisions. The forces between colloidal particles are attractive van der Waals forces and repulsive
interactions between similarly charged electrical double layers, the latter conferring stability. The
interaction between the forces changes, depending on the conditions of the system. With coarse
particles there is a lower specific surface area compared to fine particle systems, and as a result the
surface forces and electrical interactions between particles are of a much lower significance and it is
less marked with coarse particles5.
Flocculants are organic, water soluble, long chain polymers with a high molecular weight. They
aggregate fine particles into larger flocs and are often used as dewatering aids. This increases
apparent particle size and hence capillary radius in the Young Laplace equation, enhancing liquid
removal during the later stages of filtration68. Numerous mechanisms of the action of flocculants
have been identified. The most significant being polymer bridging and charge neutralisation69. The
occurrence of polymer bridging happens when parts of a polymer adsorb on multiple particles
simultaneously, forming a link between them. Charge neutralisation happens when oppositely
charged polymers are used. They adsorb onto the particle surface, thus reducing the repulsive force.

28
With the formation of the double layer around a particle, it is necessary to understand the
distribution of ions adjacent to a surface in an electrolyte solution. Derjaguin, Landau, Verwey and
Overbeek studied the stability of colloidal systems in the 1940’s, and the theory named after them –
DLVO theory - considers the potential energy of interaction between a pair of particles consisting of
two components, these being the repulsion due to the electrical double layers and van der Waals
attraction. This theory deals with the distribution of ions, and therefore the magnitude of the
electric potentials in the locality of the charged surface. In Stern’s model, the double layer is divided
into two parts separated by the Stern plane. The potential decreases in the Stern layer from the
surface potential to the Stern potential, and then decays to zero in the diffuse layer. In the Stern
layer (the inner region) the ions are firmly bound, and in the diffuse region they are not. Within this
diffuse layer a boundary exists, and inside this boundary the ions and particles form a stable entity.
When a particle moves, the ions within this boundary move with it, whereas the ions outside this
boundary stay in the bulk dispersant. It is essentially a thin layer of liquid a few molecules thick and
this hydrodynamic boundary is a slipping plane inside the solution, the potential at the slipping plane
being the zeta potential70,71.
Possible mechanisms for the surface charge are ionisation, ion adsorption, and ion dissolution. i)
Ionisation; dissociation of acidic groups on the particle surface leads to a negative charged surface,
and dissociation of basic groups on the surface will lead to a positively charged surface. The
magnitude of this charge will depend on the strengths of the surface groups, and is strongly
dependent on the pH of the solution. The charge on the particle surface can be reduced to zero
through changing of the pH in order to suppress the surface ionisation. For negatively charged
particles, the pH can be decreased. For positively charged particles, the pH can be increased. At
some point the net charge will be zero, and the pH at this point is the isoelectric point. ii) Ion
adsorption; unequal adsorption of oppositely charged ions can lead to a net surface charge. Charged
species such as surfactant ions may be adsorbed onto particle surfaces; cationic surfactants onto a
positively charged surface and anionic surfactants to a negatively charged surface. iii) Ion

29
dissolution; a surface charge can be acquired from the unequal dissolution of the oppositely charged
ions of which they are composed. If equal amounts of both positive and negative ions were to
dissolve, the surface would be uncharged, but if the positive ions were to dissolve preferentially, a
negatively charged surface would result71.
The diagram below illustrates Stern’s model
Figure 7: Stern’s model (Reference 5)
Zeta potential indicates the stability of a colloidal system. With a large zeta potential, be it positive
or negative, particles will tend to repel each other, and the system will be deemed stable and
agglomeration avoided. If the particles have a low zeta potential, there is minimal force to prevent
particles coming together. Van der Waal attraction will overcome the repulsive forces and the
particles will flocculate. The stability of a colloidal system is determined by the sum of these forces
that exist between particles as they approach each other. An energy barrier results from the
repulsive forces, preventing particles from adhering or even approaching, but if they collide with
sufficient energy to overcome that barrier, they can come into contact and adhere. However, with
sufficiently high repulsion, the dispersion will resist flocculation and the system will be stable.
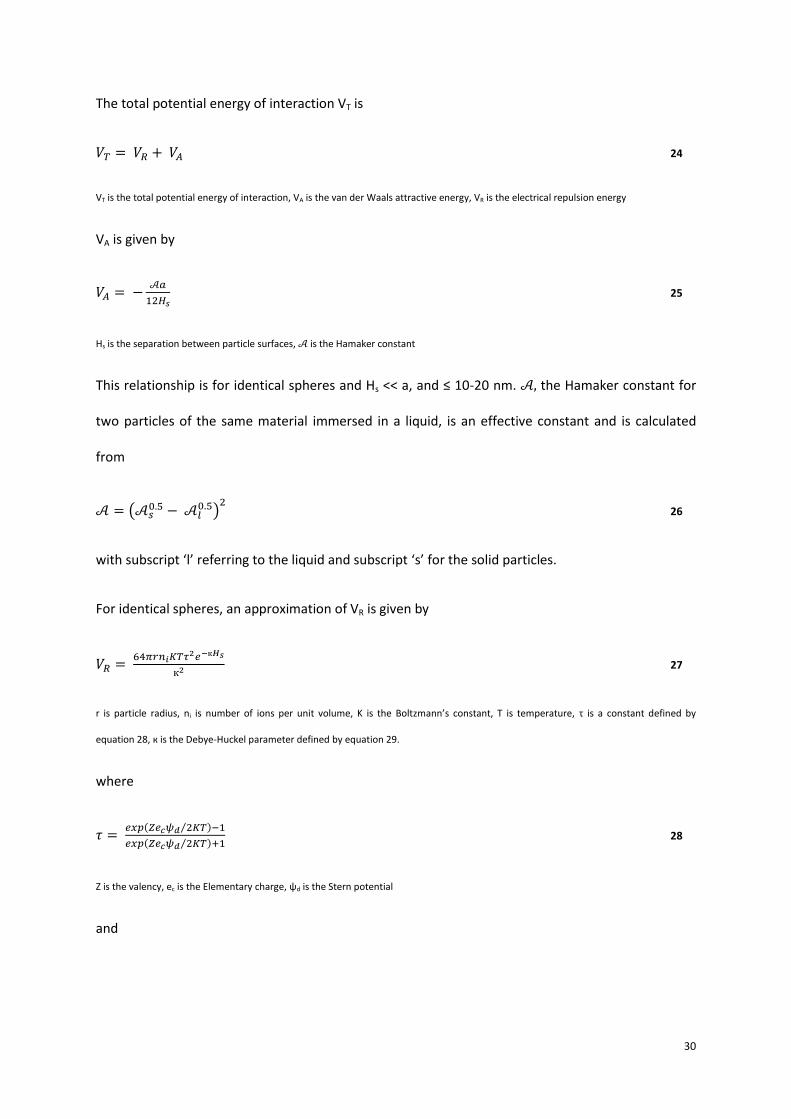
30
The total potential energy of interaction VT is
24
VT is the total potential energy of interaction, VA is the van der Waals attractive energy, VR is the electrical repulsion energy
VA is given by
𝒜
25
Hs is the separation between particle surfaces, 𝒜 is the Hamaker constant
This relationship is for identical spheres and Hs << a, and ≤ 10-20 nm. 𝒜, the Hamaker constant for
two particles of the same material immersed in a liquid, is an effective constant and is calculated
from
𝒜 (𝒜 𝒜
)
26
with subscript ‘l’ referring to the liquid and subscript ‘s’ for the solid particles.
For identical spheres, an approximation of VR is given by
27
r is particle radius, ni is number of ions per unit volume, K is the Boltzmann’s constant, T is temperature, τ is a constant defined by
equation 28, к is the Debye-Huckel parameter defined by equation 29.
where
( ⁄ )
( ⁄ ) 28
Z is the valency, ec is the Elementary charge, ψd is the Stern potential
and
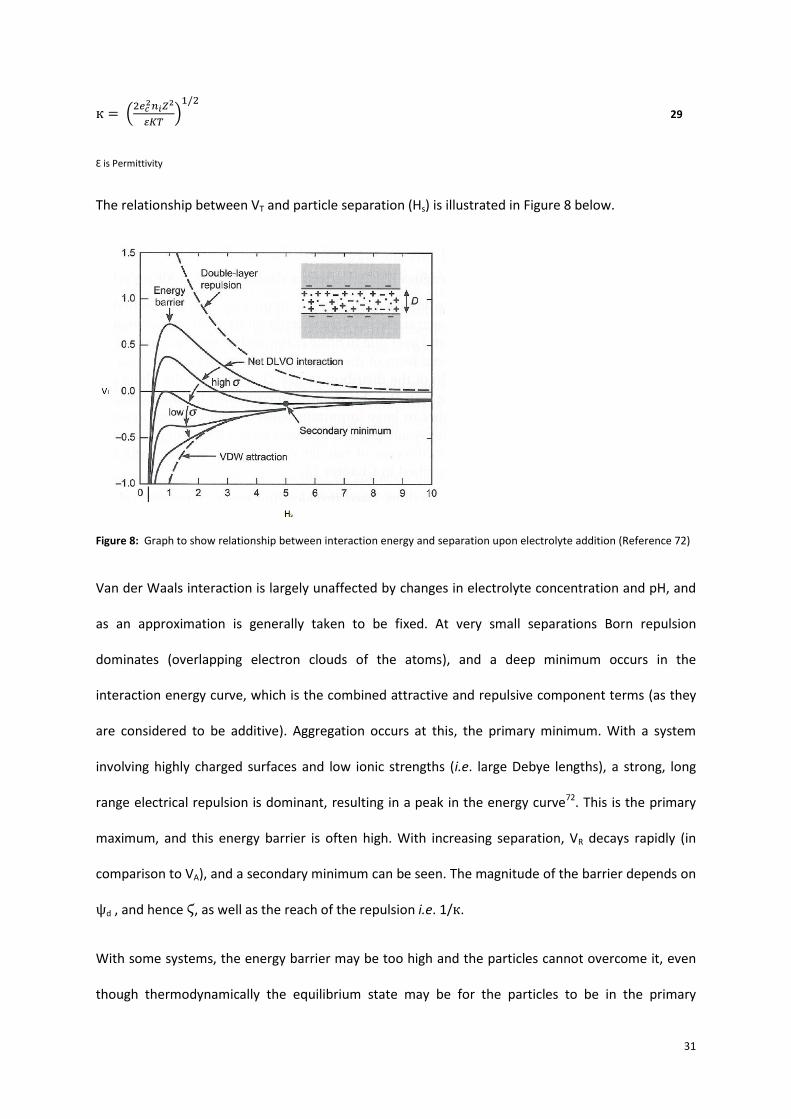
31
(
)
29
Ɛ is Permittivity
The relationship between VT and particle separation (Hs) is illustrated in Figure 8 below.
Figure 8: Graph to show relationship between interaction energy and separation upon electrolyte addition (Reference 72)
Van der Waals interaction is largely unaffected by changes in electrolyte concentration and pH, and
as an approximation is generally taken to be fixed. At very small separations Born repulsion
dominates (overlapping electron clouds of the atoms), and a deep minimum occurs in the
interaction energy curve, which is the combined attractive and repulsive component terms (as they
are considered to be additive). Aggregation occurs at this, the primary minimum. With a system
involving highly charged surfaces and low ionic strengths (i.e. large Debye lengths), a strong, long
range electrical repulsion is dominant, resulting in a peak in the energy curve72. This is the primary
maximum, and this energy barrier is often high. With increasing separation, VR decays rapidly (in
comparison to VA), and a secondary minimum can be seen. The magnitude of the barrier depends on
ψd , and hence Ϛ, as well as the reach of the repulsion i.e. 1/ .
With some systems, the energy barrier may be too high and the particles cannot overcome it, even
though thermodynamically the equilibrium state may be for the particles to be in the primary

32
minimum and in contact. In this occurrence, the particles will either remain dispersed in the medium
or in a weak secondary minimum. For the former, the system is deemed kinetically stable rather
than thermodynamically stable. If the secondary minimum is considerable in magnitude, a loose
easily reversible aggregation should be formed. For particles with low surface charge density, the
energy barrier will be lower, and below a specific surface charge or with sufficient electrolyte
concentration (the critical coagulation concentration), the energy barrier disappears below the
repulsion range i.e. its peak is at VT < 0, the particles coagulate, and the system is considered
unstable. When the surface charge is at its lowest, and approaches zero, the net DLVO interaction
curve approaches that of the van der Waal attraction curve, and the particles are strongly attractive
at all separations. In order to induce contact at a primary minimum, two approaches can be taken;
the surface charge can be lowered through variation of the pH or an increase in the double layer
screening can be effected through increasing the electrolyte concentration. With the latter, if
sufficient screening is not achieved and the energy barrier remains high, adhesion is still achievable,
but it will be in the secondary minimum.
The critical coagulation concentration is the electrolyte concentration required to effect coagulation,
reducing the peak of the energy barrier to zero. This is seen in Figure 8, where the primary maximum
is reduced upon increasing electrolyte addition. An increase in the ionic strength of the solution
achieves this, as it increases , thus reducing VR, as seen in equation 27. A more effective method
that builds on this is the use of multivalent ions. An ion such as Al3+ or Fe3+ will mean a larger charge
number Z in equation 29, an increased , and a reduction in VR. Using the Schulze Hardy rule, with
electrolytes of counter-ion valencies of the order 1, 2 & 3, the coagulation concentrations should be
in the ratio 100: 1.6: 0.13 5.
The pH of the system is one of the most important factors affecting zeta potential. A high pH means
a high concentration of hydroxyl ions, and these can be adsorbed to create a negative charge on the
surface of the particle. A low pH means a high concentration of hydrogen ions, meaning a positive

33
surface charge. With particles in a suspension with a negative zeta potential, if more alkali is added,
then the particles will tend to acquire a more negative charge. However if acid is added, then a point
will be reached where a neutralised charge will be achieved, and further additions will increase the
positive charge. Plots of zeta potential versus pH tend to show a positive zeta potential at low pH,
and a lower zeta potential as pH increases. In the cases where higher pH results in a negative zeta
potential, the point where the zero zeta potential is passed is the isoelectric point, and it is at this
point that the colloidal system is at its least stable2. When this point is encountered, there is no force
to prevent particles coming together, which is why flocculation results at or around the isoelectric
point73. This can be seen in Figure 9 .
Figure 9: Graph of zeta potential as a function of pH for anatase in distilled water (Reference 73)
The magnitude of the surface charge typically ranges from -120 mV to +120 mV. The charge can
reach relatively far into the suspending liquid, and this charge is characterised by the Debye length.
In their study of pre-aggregated latex and silica dispersions, Cabane et al.74 found an intense
densification when filtering particles. The mechanism for this involves small motions of particles in
contact. The deformations from these slight changes cause some interparticle bonds to break. The
authors concluded that the yield stress of these specific bonds are low when compared to the forces
applied during the packing of the aggregates in the cake.

34
Zeta potential is also affected by temperature, and its behaviour can be understood through careful
analysis of the species involved. Rodriguez et al.75 studied the effects of temperature on the zeta
potential of reservoir minerals and it was found that it decreased with temperature at a rate specific
to each mineral. With calcite for example, the sign of zeta potential is dependent on the number of
Ca2+ and CO32- ions available in solution. As temperature increases, the solubility of Ca2+ ions
increases. This allows the ions to preferentially leave the particle structure, leaving the surface with
a negative charge. Hulston et al.76 in the study of hematite at elevated temperatures found that at
75 oC, faster rates of dewatering were achieved, as was a greater network strength. A possible
explanation put forward was that of a change in interparticle interactions, in particular a reduction
of the double layer repulsion with increasing temperature for that specific system.
Interparticle forces such as van der Waal’s attraction and electrostatic repulsion are of great
relevance in determining the particulate matrix of the filter cake, but they rarely enter directly into
constitutive equations, whereas the internal mechanisms governed by the accumulative viscous drag
and collapse of the cake particulate structure are taken into consideration.
When the solids compressive pressure is smaller than a critical value, an equilibrium distance
between neighbouring particles exists, and this is due to electrostatic repulsive forces. When it
exceeds this value, then this repulsive barrier can be overcome and the particles can come into
contact with their neighbours. As the lower layers are subjected to a greater viscous drag, the filter
cake near the medium has a compact structure, and the upper parts of the cake have a high
porosity, which is partly due to separation of the particles. Filtrate flowing through a filter cake
generates frictional drag on the deposited particles, and this drag is transmitted through contact
points. It is accumulated as solids compressive force, and in the cases where the net interparticle
force is repulsive, the viscous drag causes the particles to come closer. If the solids compressive
force exceeds the maximum repulsive interparticle force, the particles come into contact with each
other. When this repulsive barrier is exceeded, the particles touch their neighbours, and a sudden

35
drop in porosity can sometimes be observed77. In the section of filter cake near the medium, the
particles come into contact due to a greater local solid compressive pressure. In some cases the
distribution of local properties can be separated into two regions depending on whether this critical
value was exceeded or not. This results in a delicate balance between the compressive pressure and
the repulsive forces at play, the most important aspect being whether or not the particles come into
contact, a requirement for transmission of solids compressive forces78. The electrostatic forces are
governed by particle size and zeta potential amongst other parameters. Bowen et al.79,80 rightly
recognised double layer interaction as a key constitutive parameter in the filtration process for dead
end and cross flow filtration. Their model - based on descriptions of particle-particle interactions,
which they saw responsible for controlling permeation rates - highlighted the importance of taking
these interactions into account.
As mentioned previously, the relationship between pore liquid pressure and the cake compressive
stress is taken to be , and this assumption has been used in most filtration studies.
Other possibilities put forward incorporate a porosity term, and it was found that the relationship is
system specific. A thorough approach to the study of particle-particle interaction and its effect in
filtration warrants an understanding and analysis of fluid-particle and particle-particle interaction66.
The latter are due mainly to double layer forces, van der Waal’s and possibly hydration forces.
Bowen et al.79 put it that the sum of all three forces determines the compressive stress, whereas
Koenders and Wakeman62,81 assumed it to be double layer forces only. Tien66 postulated that it
should be possible in principle to determine the compressive stress as a function of average particle-
particle separation for a given system.

36
1.5 Cake structure
In this section, simulation and experimental work on aspects of filtration that were touched on in
earlier sections are investigated. These include material properties (particle size and shape) as well
as process parameters (settling time and concentration).
1.5.1 Particle packing
The small particles in a dispersion control many aspects of the filtration cycle, as it is these that
bleed through the filter medium in the initial stages of filtration, later accumulating in the cake.
These particles contribute most to the specific surface of the particles (and therefore to the specific
resistance of the filter cake) and they interact most strongly with ions in the dispersion82. Specific
resistance is inversely related to the square of the particle size, and as particle size decreases, the
resistance of the filter cake increases as the drag force resisting fluid flow through the cake is
proportional to the surface area of the particles in the cake. Porosity is a function of particle size
distribution, and with a wide distribution the particles are able to pack more tightly to form a cake.
This can be visualised as the smaller particles occupying spaces between the larger particles. This has
been investigated by Lange Kristiansen et al.83 who studied simulations of random packings of binary
spheres by mechanical contraction. Small spheres fill the empty spaces between larger spheres,
making the structure denser. With a size ratio of 2.6, comparisons with experimental data were
achieved84. Figure 10 below shows packing volume density as mass fraction of smaller particles
increases.

37
Figure 10: Particle volume density as a function of the composition of the binary mixture where x2 is the fraction of small particles
(Reference 83)
As can be seen, a characteristic triangle shape is seen with all lines, and with the simulation a
maximum is seen at x2 = 0.275, where x2 is the fraction of small particles. This trend is also found
with binary mixture experiments with different size ratios. The experimental data seen in Figure 10
was taken from an investigation by Thies-Weesie et al.83 of cyclohexane flow through binary
mixtures of silica spheres with a size ratio of 2.6. Additional experiments with a size ratio of 1.4 were
also conducted. Similar trends were achieved, with a close coinciding of a maximum packing density
for different size ratios, with a higher packing density achieved with a larger size ratio.
He et al.85 conducted a Monte Carlo simulation for random packing of unequal spherical particles for
size ratios 1.5 and 2.0, and as can be seen in Figure 11, a maximum packing density was found at
volume fractions of large particles of around 0.7, which is equivalent to an x2 of around 0.30. This is
in agreement with Lange Kristiansen et al.83 and Thies-Weesie et al.84 As with the latter, it was found
that a larger size ratio resulted in a higher packing density.

38
Figure 11: Random packing density of bidisperse particles (Reference 85)
For a dense system of randomly packed particles, almost every sphere is connected to the
percolating cluster of contacting spheres, and for a stable configuration it is a condition that each
sphere needs to contact four of its neighbouring spheres.
Figure 12 shows a separate graph each for three different values of x2, and a peak fraction of four
contacts is seen for small spheres, whilst the average number of contacts on small spheres
continually increases until the monodisperse case is reached.

39
Figure 12: Distribution of the number of contacts on small spheres Csmall and big spheres Cbig for a) x2 = 0.024, b) x2 = 0.273, c) x2 = 0.852
(Reference 83)
The theoretical number of contacts on a small sphere is 12, and as can be seen in Figure 12 c, for a
large fraction of small particles the maximum number of contacts is 10, and for a low fraction of
small spheres (see Figure 12 a) the number of contacts on big spheres is also constrained by this
limit. Contacts on a big sphere will exceed this limit, and as x2 → 1, it can be visualised a large sphere
lying in a sea of small spheres. The average number of randomly placed small spheres on a large
sphere is the parking number86, given by:
( ) 30
MP is the parking number, KP is a constant (=2.187), ϒs is the size ratio between the spheres

40
At x2 = 0.024, a large fraction of small spheres have 4 contacts, but a significant fraction have no
contacts i.e. a lot of particles are ‘rattling around’. At an increased mass fraction of x2 = 0.273, few
small particles have no contacts, and a high fraction have around 5 contacts. This mass fraction
coincides with the peak in particle volume density seen in Figure 10. As the mass fraction of fines is
further increased to x2 = 0.852, all particles have greater than zero contacts, peaking at around 5
contacts again i.e. no particles ‘rattling around’, and all larger particles have at least 14 contacts,
compared to 7 or less for smaller mass fractions. The achievement of a system with particles
constrained such that they cannot move is an important concept in the formation of a porous body
and its effect on the collapse of local particulate structure.
The concept of caging is closely related to the coordination number, and a sphere is deemed ‘caged’
if it is surrounded by contacting spheres such that it cannot move. As seen in Figure 13, in the range
0 < x2 < 0.4 a significantly high number of spheres are non-caged, and thus able to move. This range
coincides with a shift towards an increased fraction of large spheres i.e. x2 → 0. The non-caging
spheres are dominated by small spheres, which are able to move within the construct of caged
particles, however as the fraction exceeds this range i.e. x2 > 0.4, the presence of non-caged particles
diminishes and is ultimately eliminated.
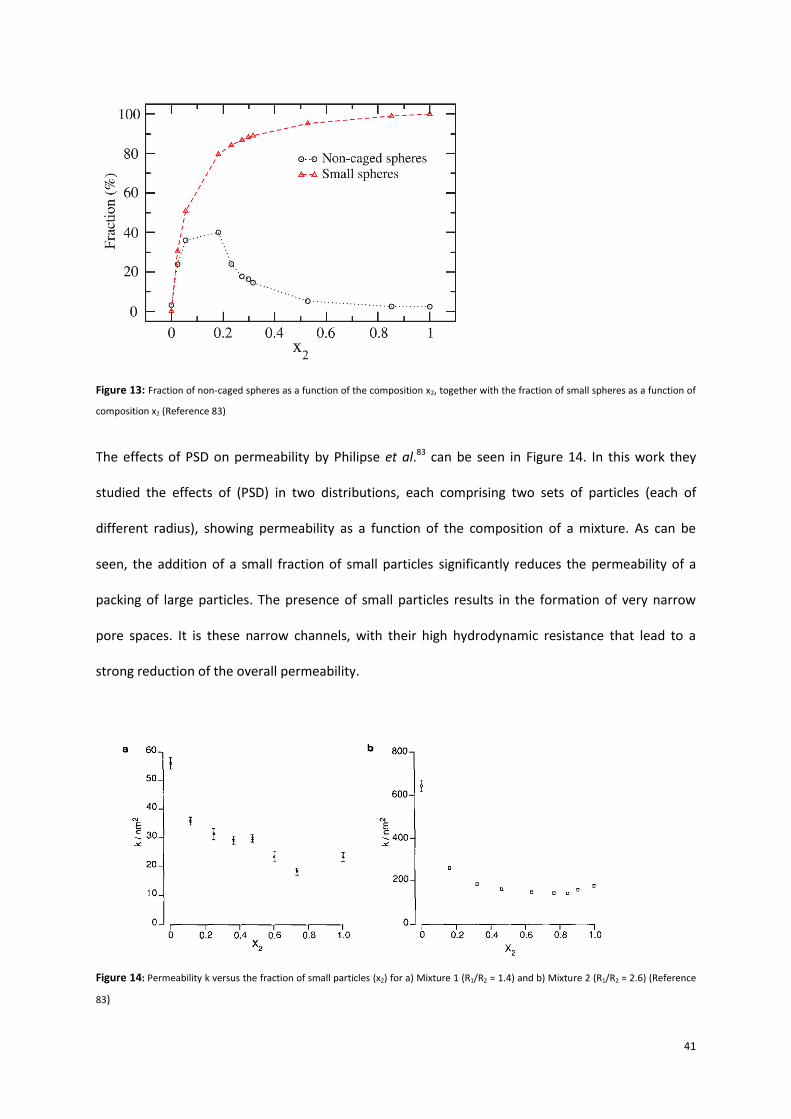
41
Figure 13: Fraction of non-caged spheres as a function of the composition x2, together with the fraction of small spheres as a function of
composition x2 (Reference 83)
The effects of PSD on permeability by Philipse et al.83 can be seen in Figure 14. In this work they
studied the effects of (PSD) in two distributions, each comprising two sets of particles (each of
different radius), showing permeability as a function of the composition of a mixture. As can be
seen, the addition of a small fraction of small particles significantly reduces the permeability of a
packing of large particles. The presence of small particles results in the formation of very narrow
pore spaces. It is these narrow channels, with their high hydrodynamic resistance that lead to a
strong reduction of the overall permeability.
Figure 14: Permeability k versus the fraction of small particles (x2) for a) Mixture 1 (R1/R2 = 1.4) and b) Mixture 2 (R1/R2 = 2.6) (Reference
83)

42
The distributions encountered in practice are typically not bimodal, and encompass wide ranges.
Particle size distribution is an important physical characteristic in terms of flow characteristics when
dealing with granular materials. Numerous models have been proposed to characterise these
distributions, one of the earliest and most frequently encountered of which is Rosin-Rammler87-89.
Lu et al.90 studied particle packing in the filtration of sub-micron particles, taking into account
Brownian force - a random force due to particle collisions with surrounding fluid molecules. Constant
pressure filtrations were carried out using two sizes of spherical particles, with average diameters of
0.6 and 1.6 µm, as well as simulation of cake properties. Figure 15 shows simulations of packing
structures for different particle sizes under different filtration conditions.
Figure 15: Packing structures of particles of different sizes and under different filtration rates (Reference 90)
The static force balance based around angle of friction proposed by Lu et al.91 was used to determine
the stability of particles touching the surface of the cake. For a particle size of 1.6 µm at a low
filtration rate, Brownian motion gives more opportunities for the particles to migrate within the
porous structure, and this results in a more compact filter cake, as seen in Figure 15 a and b. For a
given filtration rate (Figure 15 a and c), the filtering of smaller particles demonstrates a more
significant effect of Brownian motion and a more compact packing. Further studying the effect of

43
filtration rate, they found that for systems consisting only of sub-micron particles, the three major
factors that affected packing were frictional drag, Brownian forces and interparticle forces.

44
1.5.2 Sedimentation and Concentration
Sedimentation occurs in cake filtration, the formation of a solid blanket and the resulting
supernatant being evidence of this. The effects of sedimentation can result in errors of significant
magnitude when systems of low pressure and dilute systems are considered92. When differences in
density exist in an unstirred suspension, the solids settle under the effects of gravity. In a very dilute
system, particles settle independently, but as the slurry becomes more concentrated, the settling of
larger particles is retarded by the local presence of smaller particles, whilst the very small particles
will be dragged down and will have settled in a shorter time period than under free settling. If an
interface emerges between a settling suspension and the clear residual liquid above it, then this
evidences sedimentation, and the settling is within the hindered settling regime. The clear residual
liquid is termed the ‘supernatant’ and the assumption is that it is entirely free of solids.
The hindered settling velocity is a strong function of the particle concentration. At its highest
possible concentration, settling cannot occur, and in very dilute systems, particles will settle under
free settling conditions. In the hindered settling regime, the settling velocity will be between these3.
Hindered settling velocity can be considered a correction term to the free settling velocity, and one
of the most well known empirical relations between the two is the Richardson Zaki equation93 as
follows:
( ) 31
uo is the settling velocity, ut is the free settling velocity, C is the solid concentration by volume fraction, j is a variable dependent on the
particle Reynolds number
When a well-mixed suspension is placed in a vessel, the initial concentration Cf is uniformly
distributed, and as settling progresses, the layers of constant concentration are seemingly
propagating upwards towards the interface (though of course the solids are settling and regions of a
given solids concentration are shifting). There are nominally four zones in a settling suspension, and
these are: i) Supernatant; ii) Original concentration which is just below the interface; iii) Variable

45
concentration zone; iv) Fully settled sediment. The mathematical descriptions of the zone of variable
concentration were first published by Kynch94 in 1951, and he determined that a consequence of the
settling velocity being a unique function of local particle density is that so too will be the velocity of
the upward propagation of local concentration, and it will be constant. A critical point is reached
where all particles have identical velocities, and they settle as a zone. Eventually, the solids form a
cake that is capable of transmitting stresses through contact points. Compaction ensues, determined
by the accumulated stress in the particulate matrix.
Conventional filtration theory is based on a two resistance model, and its resulting equations have
been long held up as the fundamental formulae governing filtration, however it has been the subject
of much criticism due to its assumptions, one of which is the disregard of sedimentation effects.
Despite its deficiencies, as an empirical approximation it is still a very useful tool in analysis. The
main criticism is thus; in most filtration models, it is assumed that cake deposition is due only to
filtration, however the assumption is not valid when sedimentation occurs, as there is additional
deposition of solids due to gravitational effects. As a result, the assumption that the concentration
of slurry above the forming cake remains constant i.e. that there is no thickening and no
concentration gradient, is incorrect. Bockstal et al.95 found that with a low settling velocity on a
horizontal filter, sedimentation effects become negligible. But at high settling velocities,
sedimentation effects dominate, resulting in an increased cake resistance and a reduction of filtrate
flow. An overestimated resistance and a concave t/V vs V plot results.
Christensen and Dick54, investigating non-parabolic behaviour of filtration runs accompanied by
sedimentation, concurred that when the slurry interface with the supernatant decreases a
significant distance, the slurry sedimentation rate is comparable to its filtration rate, and because
filtration is concomitant with sedimentation, the initial decrease in filtrate collection is larger than if
filtration only was taking place. They noted that the S shaped curve of their t/V vs V plot indicated
the effects of sedimentation. What they viewed as non-parabolic filtration data, they attributed to

46
circumstances of sedimentation in concert with filtration. They reasoned that parabolic data can be
produced with immediate application of filtration pressure, and that sedimentation effects can be
ameliorated by an increase in concentration.
Sorensen et al.96 however determined that the concave behaviour of filtration plots of inverse
filtrate flux as a function of filtrate volume could be explained by migration of small scale solids into
the pores of the filter cake. The explanation of penetration and subsequent deposition of solids in
the filter cake and medium, thus blinding the porous structure, has also been noted by Novak et al.97
and Notebaert et al.98. Tiller et al.23 attributed concave filtration plots to both this and
sedimentation. Constant average specific resistances require the local flow resistances to be a
function of solid stress within the porous structure only, however with blinding, the local flow
resistance is also a function of the small scale solids deposited. As the amount of these solids
deposited increases, the value of the average specific resistance increases.
The contribution of Sorensen et al. was to derive an equation for characterising the influence of
blinding on filtration, and filtration of wastewater solids suspensions was investigated. Their
empirical approach in studying the concave behaviour systematically was to use a polynomial of
arbitrary order (n) of the form:
32
n is the order of the polynomial expression
They found that concave behaviour associated with wastewater filtration could be described by the
parabolic equation
33
They found that this relationship was similar to that supporting expression for concave behaviour
derived by Bockstal et al.95 due to sedimentation. However, with the onset of sedimentation, as a
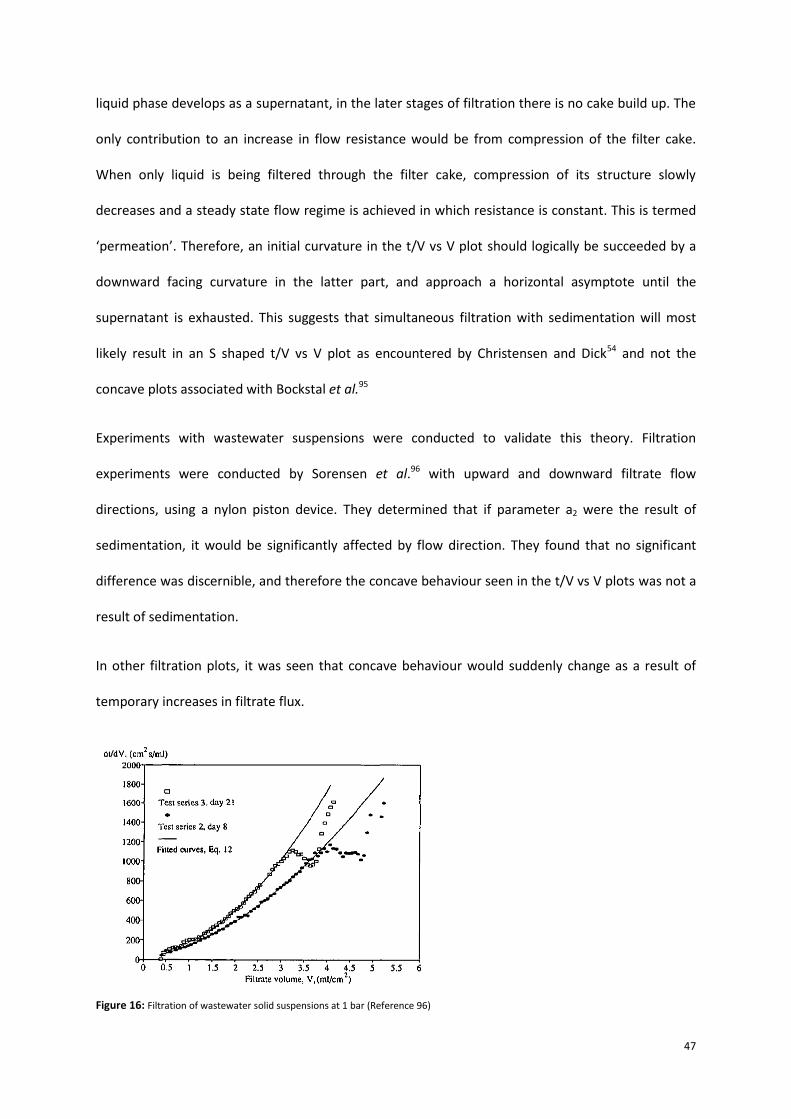
47
liquid phase develops as a supernatant, in the later stages of filtration there is no cake build up. The
only contribution to an increase in flow resistance would be from compression of the filter cake.
When only liquid is being filtered through the filter cake, compression of its structure slowly
decreases and a steady state flow regime is achieved in which resistance is constant. This is termed
‘permeation’. Therefore, an initial curvature in the t/V vs V plot should logically be succeeded by a
downward facing curvature in the latter part, and approach a horizontal asymptote until the
supernatant is exhausted. This suggests that simultaneous filtration with sedimentation will most
likely result in an S shaped t/V vs V plot as encountered by Christensen and Dick54 and not the
concave plots associated with Bockstal et al.95
Experiments with wastewater suspensions were conducted to validate this theory. Filtration
experiments were conducted by Sorensen et al.96 with upward and downward filtrate flow
directions, using a nylon piston device. They determined that if parameter a2 were the result of
sedimentation, it would be significantly affected by flow direction. They found that no significant
difference was discernible, and therefore the concave behaviour seen in the t/V vs V plots was not a
result of sedimentation.
In other filtration plots, it was seen that concave behaviour would suddenly change as a result of
temporary increases in filtrate flux.
Figure 16: Filtration of wastewater solid suspensions at 1 bar (Reference 96)

48
Filtrate turbidity was also analysed as a means of explaining this phenomenon. For blinding to occur,
the presence of solids in size ranges of significantly different orders of magnitude is required, which
is achievable in wastewater suspensions due to small scale solids in the form of free bacteria
released which can migrate into filter cakes primarily composed of larger scale solids. At the start of
the filtration process, a very thin filter cake was formed and a large amount of small scale solids
were able to penetrate the filter cake and medium. As filtration progressed, the cake became
thicker, and more small scale solids deposited, blinding the cake, and filtrate turbidity decreased.
Deposition of small scale solids may also occur as the filtrate passes through the medium, thus also
blinding the medium. Possible causes of the aforementioned changes in flux were investigated, such
as wall effects, sedimentation effects and blinding. It was the latter that best explained this
behaviour, as deposition of small particles within the structure leads to an increase in flow
resistance, and as a result the local effective pressure in the cake also increases. This pressure
increase causes a local porosity decrease due to the compressible behaviour of the solids, and a
further increase in flow resistance. In some parts of the filter cake, the hydraulic pressure gradient
may increase, such that it leads to an increase in the detaching shear force on the walls of the
channels within the porous structure of the filter cake. They determined that it is plausible that
increasing the hydraulic pressure gradients locally can cause an erosion and subsequent removal of
previously deposited small scale solids resulting in an increase in filtrate turbidity, and a temporary
reduction in flow resistance. They concluded that migration of small scale solids into the filter cake
and medium during filtration is responsible for the concave behaviour seen.
As seen earlier with Bockstal et al.95, material balances based solely on filtrate volume that do not
take into account sedimentation effects can lead to a potentially large underestimation of solids in
the filter cake and errors in the calculation of average specific resistance during filtration. This is
especially apparent in the experiments of Yim et al.92, whose filtration-permeations of low
concentration calcium carbonate suspensions showed significant variability. Again, it was noted that
the mass fraction of solids in the suspension entering the filter cake cannot be maintained at the

49
same initial value, and changes with sedimentation were encountered. Initially looking at filtration-
permeation of 1% calcium carbonate suspension and the sedimentation that is expected with such
dilute suspensions, the results were as follows.

50
Figure 17: Filtration-permeation of 1% solids wt CaCO3 suspension at 0.5 atm (Graphs constructed from data taken from reference 92)
Conventionally, the average specific resistance is calculated from this slope using the initial mass
fraction of solids in suspension, and αf was calculated to be 8.4 x 10¹⁰ m/kg. The permeation period
was prolonged with the addition of particle eliminated water, and αp was calculated to be 7.4 x 10¹⁰
m/kg. The thick straight line is a calculated result, representing the filtration process without
sedimentation. The slope based on experimental data that represents filtration with sedimentation
is a little steeper than the calculated line. The mass fraction of solids to be filtered increases when
sedimentation occurs during filtration, hence the steeper slope.
Further experiments looked at filtration of fully settled sediments of 17.6% calcium carbonate
suspensions. The results were as follows:
0
5
10
15
20
25
30
0 5 10 15 20 25 30 35
Δt
/ Δ
V (
s /
cm)
V (filtrate volume per unit filter area (cm3 / cm2))
Experimental
Theoretical

51
Figure 18: Filtration-permeation of sediment (48.8% solids wt CaCO3) prepared with a suspension of 17.6% solids wt initial concentration
(Graphs constructed from data taken from reference 92)
The formation of cake from sediment was not observed as there is no visual difference, but the
thickness of the sediment decreased as filtration progressed, and once all of the sediment had
changed into cake, the thickness did not change. The mass fraction of solids in sediment was
calculated as 48.8%, calculated from the thickness, 2.8 times the initial mass fraction of solids in
suspension. αf was calculated to be 7.23 x 10¹⁰ m/kg, and αp was calculated to be 7.28 x 10¹⁰ m/kg,
which coincide well. From this, Yim determined that if sediment was cake (as assumed by many
other researchers) then filtration here would not exist, and only permeation would be observed, but
as shown, filtration is seen at the beginning of the experiment. In short, cake is not only the
accumulation of particles, but the rearrangement of particles by filtration pressure. If the initial mass
fraction of solids was used, then αf would become be 4.03 x 10¹¹ m/kg, which could not be true as
the initial suspension had not related to the formation of the cake. So with filtration procedures that
go to permeation, the difference in the values between cake resistance during build up and
permeation was due to sedimentation effects, which is excluded during permeation. It is the
constant flowrates during permeation that show the structural properties of the cake are not
changing.
0
50
100
150
200
250
300
350
400
450
0 5 10 15 20 25 30 35 40
Δt
/ Δ
V (
s /
cm)
V (filtrate volume per unit filter area (cm3 / cm2))
Experimental
Theoretical

52
Separate to the concentration gradient that develops due to sedimentation, focus now shifts to the
effects of slurry concentration itself, which plays a large role in the formation of a filter cake, in
particular its packing structure. Two important aspects are the magnitude of the drag force exerted
on the deposited particles and also the number of particles instantaneously arriving at the surface of
the cake, affecting orientation and packing (the latter increasing with slurry concentration).
Particles in a concentrated system tend to distribute themselves fairly evenly as they deposit onto
the surface of the medium or filter cake, leading to a filter cake of lower resistance. This can be
thought of in terms of the time available for particle relaxation when the particles are deposited on
the top of the cake. Each particle is locked into position by other particles nearby, limiting its
capacity to roll down into open crevices in the sediment, which is something it would be able to do
in a more dilute system4,91. Therefore these filter cakes formed are more open and porous, and
hence have a lower resistance.
The effects of filtration rate and concentration on packing structure of a filter cake has one other
important aspect; the magnitude of the drag force that is exerted on the particles. Large drag can
lead to particles migrating more easily to lower positions within the cake structure, however this
may be impeded as there will be a growing number of particles arriving at the cake surface at the
same time, which may obstruct the migration99. Smaller average distances between particles in a
high concentration system also mean a smaller tendency for the particles to be drawn into a
slipstream towards the filter medium.
One further consideration of the effects of sedimentation is particle orientation. With filtration of
irregular shaped particles, most particles arriving at the filter cake surface will have the same
direction of the major axis, and a more regular packing will be achieved, resulting in a lower porosity
than that for a random packing settling under gravity. This phenomenon is very different to what is
achieved through gravity sedimentation alone99.

53
Yim et al.92 also investigated concentration of suspension on filtration with sedimentation. Calcium
carbonate suspensions of 4%, 8% & 15% dilution were investigated. The results were as follows:
Figure 19: Filtration-permeation of 4, 8 & 15% solids wt CaCO3 suspension at 0.5 atm (Graphs constructed from data taken from
reference 92)
0
10
20
30
40
50
60
70
80
90
100
0 5 10 15 20 25 30 35
Δt
/ Δ
V (
s /
cm)
V (filtrate volume per unit filter area (cm3 / cm2))
Experimental
Theoretical (filtration)
Theoretical (permeation)
0
20
40
60
80
100
120
140
160
180
0 5 10 15 20 25 30 35
Δt
/ Δ
V (
s /
cm)
V (filtrate volume per unit filter area (cm3 / cm2))
Experimental
Theoretical (filtration)
Theoretical (permeation)
0
50
100
150
200
250
300
350
400
0 5 10 15 20 25 30 35
Δt
/ Δ
V (
s /
cm)
V (filtrate volume per unit filter area (cm3 / cm2))
Experimental
Theoretical (filtration)
Theoretical (permeation)

54
Again, the theoretical calculated values without sedimentation are also shown. During permeation,
dt/dV remains almost constant, meaning that the cake structural properties do not change, and
permeation resistances were calculated. Conventional average specific resistances during filtration
were calculated using the initial solid mass fraction in suspension. These results are summarised in
Table 1.
Initial concentration of CaCO3
suspension
Average specific cake resistance by
filtration, αav,f (m/kg)
Average specific cake resistance by
permeation, αav,p (m/kg)
1 wt% 8.39 x 10¹⁰
7.44 x 10¹⁰
4 wt% 1.33 x 10¹¹
7.03 x 10¹⁰
8 wt% 1.64 x 10¹¹
6.93 x 10¹⁰
15 wt% 1.27 x 10¹¹
7.05 x 10¹⁰
Table 1: Average specific resistance for calcium carbonate suspensions for various initial concentrations (Data from reference 92)
As can be seen, the average specific resistance values during filtration give differences up to 95%.
These are calculated using initial mass fraction of solids in suspension. With the average specific
resistance values calculated during permeation, the differences are minimal. They determined from
the permeation results that the property of a filter cake composed of the same material is the same
regardless of initial mass fraction of solids in suspension. The change in αf with various initial
concentrations is assumed to be caused by the different sedimentation velocities, which change the
mass fraction of solids entering the filter cake. They concluded that the exact αf can be calculated
with filtration data if exact mass fraction of solids entering the filter cake is used. It should be noted
that these experiments with different initial suspension concentrations were within a narrow range:
1, 4, 8 & 15% solids.

55
To summarise, at the start of filtration the suspension concentration is the initial concentration,
which is taken as the value used in cake resistance calculations i.e. it is taken to be a constant. As the
filtration rate slows, sedimentation becomes more dominant, and the thick suspension that results
yields a greater amount of filter cake with a relatively small volume of suspension. As sedimentation
takes place on the cake surface, the concentration of suspension entering the filter cake is markedly
larger than that of the initial slurry concentration. The rate of the emergence of supernatant is an
indicator of the deviation from the initial slurry concentration that was not supplied to the filter
cake, more significantly so as the filtration proceeds. It is reasonable to conclude that sedimentation
during filtration thickens the suspension entering the filter cake, and its impact can be quite
significant. It can be concluded that due to effects of sedimentation and concentration on filtration,
average specific resistance values in particular are unreliable in dilute systems, however permeation
values are more reliable.

56
1.5.3 Particle shape and particle friction.
There exists a wide range of particle bed structures, at one end of the spectrum are beds containing
particles of different shapes and sizes, and these can be arranged in a variety of irregular
configurations. At the other end of the spectrum are the regular arrangements of monosized
spheres, these being distinguished by a perfect order17.
The role particle shape plays in the structure of a filter cake is an important one. Approaches have
been made to predict porosity from packings of irregular shaped particles by employing a shape
factor. This is used to understand volumetric ratio of particle packings constructed with spherical
and irregular shaped particles. The relationship is as follows91 :
34
Øs is the shape factor, esph is the porosity of the spherical particulate bed with the same hydrodynamic size distribution
Cake porosity is affected by particle shape, and Lu et al.91 found particles that had a larger shape
factor i.e. the shape of the particles is closer to that of a sphere, a denser filter cake resulted.
The packing of a filter cake affects many properties of the bed. Cake resistance plays an important
part in filtration performance, and it is determined by filter cake structure and PSD. Unique
structures of packing arise in the case of irregularly shaped particles such as platelets and needles.
They can be packed in a variety of ways depending on the method of settling, resulting in various
void fractions. With random orientations of particles, high void fractions result, and when the
particles are stacked with their axes aligned, low void fractions are achieved. With the latter
scenario, this is achieved when the particles in the slurry are being carried by the liquid towards the
filter medium, their direction of major axis is parallel to the direction of filtrate flow. The reason for
this is minimisation of drag force. Hwang et al.99, when looking at spheroids of increasing aspect
ratio found that with a particle that has a larger aspect ratio i.e. a longer major axis, the directions of
most particles will be similar to those in the dispersion and point towards the direction of filtration,

57
very different to a packing under conditions of gravity alone. They found that with spheroids, as the
shape factor moves closer towards being fully spherical, porosity decreases. This demonstrates that
a spheroidal particle will result in a looser construct than one that is actually spherical. It can be
summarised that as the particle shape departs from perfectly spherical, the filter cake becomes less
tightly packed.
Experimental studies by Wakeman et al.100 looked at the effects of particle shape on systems of
calcite and china clay. They compared calcite (at pH 11.8) with china clay (at pH 2.9), both at ξ
approximately 15 mV. The calcite (rhomboidal in shape) gives rise to a lower resistance. The authors
attributed this to the surface charge being uniformly distributed around the more regularly shaped
calcite particles, moreso than with the china clay particles (platelets) whose packing is said to
resemble a ‘house of cards’ structure, resulting in a higher resistance.
Another additional factor to consider is that of particle friction. Figure 20 shows the formation of a
filter cake. Particle B has deposited and is in a stable position. Particle A arrives at a point on the
particle B surface. The angle between the gravity line and the line that connects the centre of gravity
of each particle through the contact point is termed the ‘angle of friction’. When this angle is small, a
certain amount of friction between the particles will exist, enabling particle A to be stably deposited
on particle B at the point of contact. However, if the value is larger than a critical value, the friction
between the particles will be very small, leading to particle A slipping away from contact to a more
stable position91.

58
Figure 20: Forces exerted on two touching particles (Reference 91)
The value of the critical friction angle varies for different particulate materials, depending on particle
properties such as interparticulate forces, size distribution, particle shape, as well as filtration
conditions, the number of particles arriving at the surface of the filter cake being dependent on the
slurry concentration. When the friction between the two particles reaches a point where even with a
small decrease, particle A will roll down, the critical condition has been reached. When the value of
the critical angle ϴc is very small e.g. zero, stable deposition is an impossibility at location of contact.
The particles will roll down to the nearest position, lower in the packing, leading to a very dense
packing. A larger value of this critical angle results in particles sticking more easily at the contact
point, in some cases resulting in particles depositing stably where they touch, forming a more
porous filter cake.
59
1.5.4 Other factors
Side wall friction
The effect of side wall frictional losses in filtration is of great importance, as it affects stress
distribution and uniformity of the particle packing in a filter cake. A large portion of applied pressure
is absorbed in wall friction, introducing inhomogeneity, non-uniformity of stress distribution,
affecting porosity and permeability18,19,101,102. Structural uniformity is favoured by low coefficient of
friction between solids and the containment wall, and also a lower ratio of cake height to diameter.
Wall friction results in pressure not being transmitted uniformly down to the filter medium, the
taller the filter cake, the more non-uniform the vertical pressure distribution.
Lu et al.103 found that with the same material, the thicker the filter cake, the greater frictional force
results in less transmitted stress through the rest of the filter cake. Thinner cakes have a more
uniform axial stress distribution. They also found that filter cakes made of material of higher
compressibility had less friction along the wall, resulting in a more uniform stress distribution. Their
experiments with bentonite (n = 0.918) yielded a PT/PM ratio of 0.888 (where PT/PM Is the ratio of
transmitted pressure against applied mechanical pressure), whereas calcite (n = 0.403) yielded a
ratio of 0.775.
In the field of powder compaction Briscoe et al.104 found that high wall friction creates stress
gradients within the powder, resulting in sizeable density fluctuations. It was found that the higher
the wall friction, the more inhomogeneous the compact. They also found that low aspect ratio
compacts were fairly homogenous as the wall friction effects are negligible due to less contact area
with the containment wall for the frictional force to act on. For the smallest compacts, they found
that the ratio of applied stress to transmitted stress was close to unity, indicating a relative uniform
stress and density distribution. But as the height increased, this transmission ratio dropped to as low
as 0.302. They concluded that friction effects create adverse internal density distributions.

60
Skin
With some highly compressible materials, the occurrence of the so-called ‘skin effect’ is sometimes
encountered. This is the formation of a thin compressed cake layer adjacent to the filter medium. It
has a very high average specific resistance and a very low porosity, and a large portion of the applied
pressure is lost over this layer. An increase in pressure only increases the compressed layer and has
little effect on reduction of the average porosity of the filter cake105. It was a discovery of Tiller and
Green20. The flow of liquid through a filter cake causes a drag force on the particles, and it is the drag
imparted to the particles that results in the compaction process which causes the porosity to
decrease. It is the accumulation of this force throughout the cake that determines its structure, and
a porosity profile develops. In highly compressible cakes, the skin absorbs the majority of the
pressure drop. As little friction develops over a large fraction of the filter cake, there is little
compaction elsewhere, except in the skin. When the pressure is increased, most of the incremental
pressure is absorbed in this resistant layer, and average porosity is not appreciably affected24.
Figure 21: Fractional distance vs normalised pressure (Reference 106)

61
The shapes of the pressure-distance curves in Figure 21 give very useful insight into the cake
structures formed by different materials. The straight diagonal line that connects the upper limits of
each axis denotes incompressibility. The greater the deviation of the other curves from this line, the
greater the degree of compressibility. As can be seen, the curves for CaCO3 and CaSiO3 are both
symmetrical, however the curves for the lime muds are not. The heavy sagging towards the bottom
right corner of the graph indicates that a large portion of the pressure drop is located in this narrow
region, indicating the existence of a highly compacted, resistant skin106. As little friction develops
over the upper part of the filter cake, there is minimal compaction elsewhere except the skin. Whilst
the skin is dry and compressed, the upper parts of the filter cakes are porous and wet.
Le Heij et al.107 inserted probes into filter cakes at various depths and measured hydraulic pressure.
Little pressure was lost over 90-95% of the filter cakes i.e. the upper portions, thus suggesting the
existence of a skin. It is thought that the permeability of a resistant skin may be less than 1% of
regions closer to the surface of the filter cake. It is seen mostly for highly compressible filter cakes (n
>> 1), such as wastewater sludges. Increasing the pressure only increases the compressed layer
adjacent to the filter medium2.

62
Surfactants
As will be seen later in Sections 5.2 and 6.1, the influence of surface tension on filter cake cracking is
significant, and surfactants are often used to effect a change in this parameter. A surfactant, derived
from ‘surface active agent’, is a term to describe molecules that interact with an interface. A key
property is their tendency to move to an air-water interface and lower the surface tension. The
structure of a surfactant is made up of two components; a hydrophobic tail and a hydrophilic head.
The head may be ionic or non-ionic, and surfactants tend to be characterised by this. Ionic
surfactants are so called as they have an ionic hydrophilic head, and if this head group is negatively
charged, then it is termed ‘anionic’. If it is positively charged, then it is ‘cationic’. Zwitterionic
surfactants contain both charges in the head group. With non-ionic surfactants, the hydrophilic
group is usually a polyether chain attached to a hydrocarbon tail108.
When surfactants are dispensed in water, the molecules dissolve and the polar heads can take part
in the hydrogen bonding structure of the water. The tails cannot do this, and there is a discontinuity
in the structure of the water. When in solution, surfactants are controlled by their tendency for the
hydrophobic component to avoid contact with the water i.e. ‘the hydrophobic effect’, and following
adsorption onto the air-water interface, what can follow is the formation of micelles.
There are a variety of micelle structures, from simple spherical to more elongated structures, such as
ellipsoids or rod-like shapes. With micelles, the inner core comprises the hydrophobic tails, which
are shielded from the water by the arrangement of the hydrophilic heads. They are formed by
spontaneous self-assembly when surfactant concentration is sufficiently high i.e. above a critical
concentration known as the critical micelle concentration (CMC). This critical point is encountered
upon increasing surfactant concentration. It is defined by a sharp increase in the number of
molecules associated with micelle formation and unchanging surface tension behaviour. A number
of other properties change at this point, such as ionic conductivity and osmotic pressure, but the
most widely used technique of ascertaining its location is through surface tension measurements.

63
Upon increasing surfactant concentration, the surface tension decreases until the CMC is exceeded
and the surface tension remains constant at this minimum, almost independent of the
concentration109.
At the CMC, as the interface is saturated, the overall energy reduction of the system continues
through other mechanisms. Depending on the composition, this can include self-assembly into
micelles, liquid crystal phases, vesicle and bilayer formation. With surface adsorption and micelle
formation, they are both characteristic of the amphiphilic nature of surfactants, but they are distinct
processes and have different constants of equilibrium110. Below the CMC, micelle formation does not
occur and surface adsorption is the only equilibrium mechanism occurring (the Gibbs free energy of
surface adsorption is significantly more negative than that of micelle formation, being driven by both
the hydrophobic effect and the reduction of surface free energy). With adsorption of a component
at a phase boundary, the Gibbs adsorption isotherm is often used to relate concentration changes of
a component with surface tension changes. The concentration in an interfacial layer is different to
that in the adjoining bulk phase, and in the case of aqueous amphiphile solutions, a large surface
excess is encountered. The surface excess is defined as ‘the difference between the amount of a
component actually present in the system and that which would be present in a reference system if
the bulk in the adjoining phase were maintained up to the arbitrarily chosen, but precisely
determined in position dividing surface’111. Substances which result in a lower surface tension have
positive values of surface excess Γ, and are said to be surface active.
By dividing the system into two precise volumes, an imaginary system is created having the same
thermodynamic properties of the real system, but the two phases are separated by this
infinitesimally thin divide with constant properties up to this plane. The real system, it should be
noted, has a finite divide with properties constantly changing up to this plane. There are other
conventions, such as Guggenheim, however the Gibbs convention is commonly used as an idealised
model of a surface with zero thickness and volume. In this convention, the phases are separated by a

64
boundary layer called the ‘Gibbs Dividing Plane’ (GDP), and all excess is located here. The superscript
‘σ’ is universally accepted as denoting the Gibbs convention. The GDP is then positioned such that
adsorption of one component is zero112.
∑ 35
which for a simple system of solvent and solute becomes
36
Γ is the surface excess, and is the difference between the total number of moles of component i in a system, with that in a particular
phase, µi is the chemical potential of species i, and is a function of the activity which is the effective mol fraction of solute, σ denotes the
Gibbs convention
Figure 22: Diagram to illustrate location of Gibbs Dividing Plane (Reference 112)

65
Figure 22 illustrates the Gibbs model’s defining of the surface excess, the GDP positioned at the
point at which the solvent excess becomes zero, and the surface excess of the solute component
being the difference in the concentration of that component on either side of the divide.
Mathematically this works, however a real system of course is very different. When
thermodynamically applied to a real system, the correct location of the divide is paramount, and
should be positioned such that the adsorption of one component is zero. If positioned incorrectly, its
value may change considerably. However, if correctly positioned such that
37
then
38
The relationship between chemical potential and concentration of component i is as follows:
39
and
40
ai is the activity, fi is the activity coefficient, ci is the surfactant concentration, R is the ideal gas constant, T is the temperature
Upon differentiation, equation 39 becomes
41
substituting into equation 38
42
therefore
43
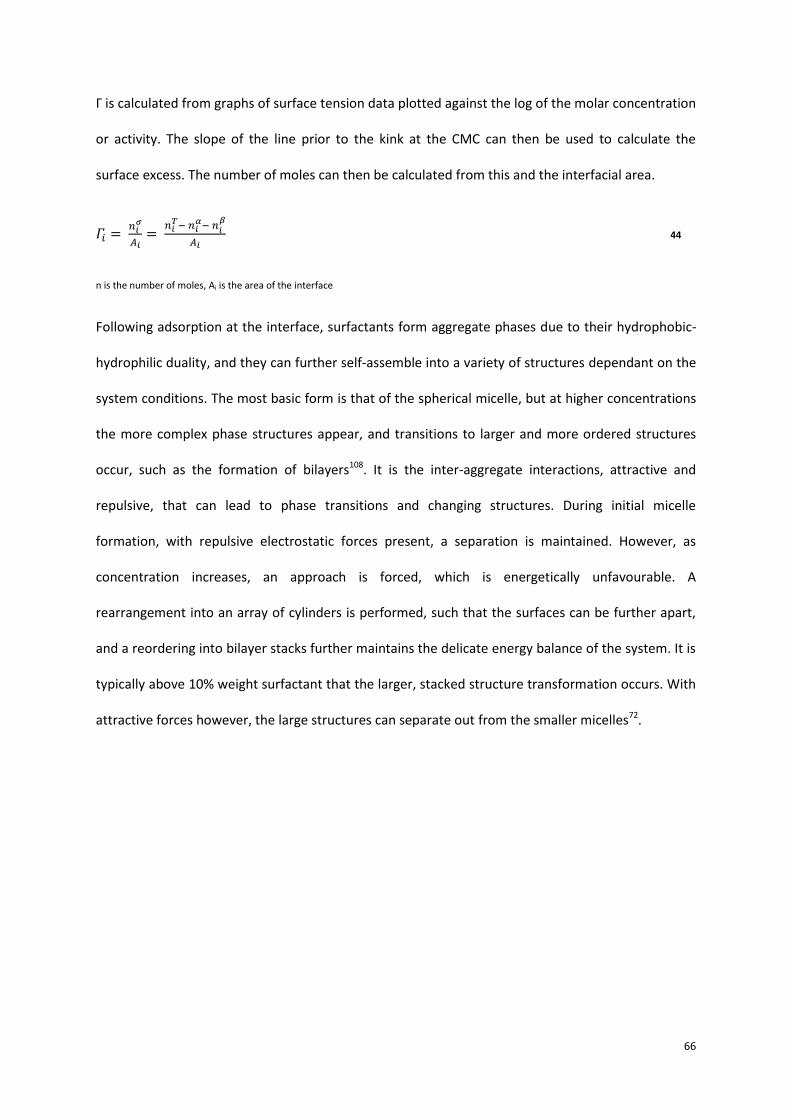
66
Γ is calculated from graphs of surface tension data plotted against the log of the molar concentration
or activity. The slope of the line prior to the kink at the CMC can then be used to calculate the
surface excess. The number of moles can then be calculated from this and the interfacial area.
44
n is the number of moles, Ai is the area of the interface
Following adsorption at the interface, surfactants form aggregate phases due to their hydrophobic-
hydrophilic duality, and they can further self-assemble into a variety of structures dependant on the
system conditions. The most basic form is that of the spherical micelle, but at higher concentrations
the more complex phase structures appear, and transitions to larger and more ordered structures
occur, such as the formation of bilayers108. It is the inter-aggregate interactions, attractive and
repulsive, that can lead to phase transitions and changing structures. During initial micelle
formation, with repulsive electrostatic forces present, a separation is maintained. However, as
concentration increases, an approach is forced, which is energetically unfavourable. A
rearrangement into an array of cylinders is performed, such that the surfaces can be further apart,
and a reordering into bilayer stacks further maintains the delicate energy balance of the system. It is
typically above 10% weight surfactant that the larger, stacked structure transformation occurs. With
attractive forces however, the large structures can separate out from the smaller micelles72.

67
1.6 Immiscible fluid displacement in porous media
The term ‘deliquoring’ is frequently applied to dewatering of a filter cake by means of gas pressure
differential in order to reduce moisture content in the pores of the cake. As deliquoring proceeds,
the liquid flows over the solid particulate surface and non-wetting air is prevented from contact with
the surface, and the flow channels encountered by each of the fluids will differ in shape. The concept
of Darcian flow, which describes the flow of a single phase that completely saturates the porous
matrix, can be extended to describe the flow of each fluid in concert. This extension results in the
introduction of a relative permeability for each fluid, which is a function of liquid saturation113.
Towards completion of the deliquoring process, the moisture content is reduced to an equilibrium
saturation, where liquid ceases to flow through the filter cake and only the applied gas flows through
the pores of the filter cake. Here the continuity of flow has now concluded, though there may still be
small movement of liquid locally. The residual saturation will approach a final equilibrium value, and
any further reduction in moisture will be through other mechanisms, such as evaporation. The
moisture content achieved once an equilibrium has been established is called ‘equilibrium
saturation’, and it is dependent on the characteristics of the filter cake and the pressure differential
applied1. A finite saturation value exists beyond which no further reduction in liquid content is
achievable, no matter how great a pressure differential is applied. This is known as ‘irreducible
saturation’. And the minimum pressure requirement in order to achieve an initial reduction in
saturation is called the ‘capillary entry pressure’114.
When pressure difference is plotted against saturation in an equilibrium state, the resulting graph is
called a capillary pressure curve115. A typical curve is shown below.
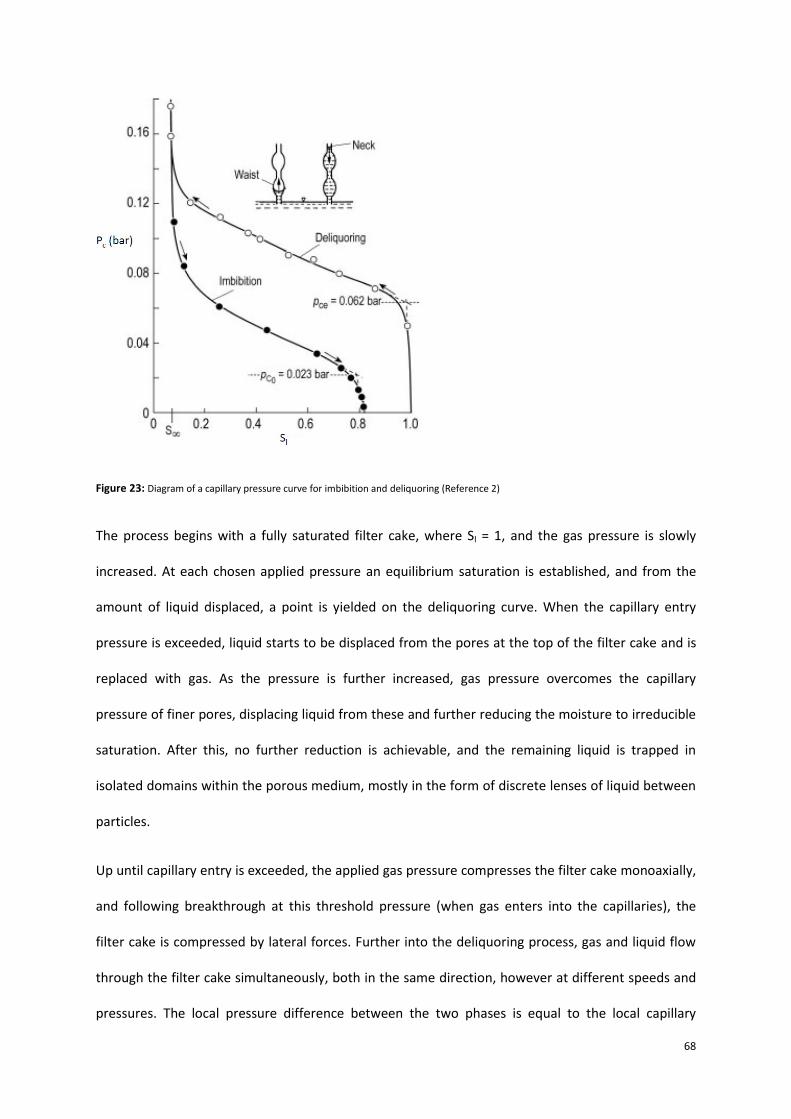
68
Figure 23: Diagram of a capillary pressure curve for imbibition and deliquoring (Reference 2)
The process begins with a fully saturated filter cake, where Sl = 1, and the gas pressure is slowly
increased. At each chosen applied pressure an equilibrium saturation is established, and from the
amount of liquid displaced, a point is yielded on the deliquoring curve. When the capillary entry
pressure is exceeded, liquid starts to be displaced from the pores at the top of the filter cake and is
replaced with gas. As the pressure is further increased, gas pressure overcomes the capillary
pressure of finer pores, displacing liquid from these and further reducing the moisture to irreducible
saturation. After this, no further reduction is achievable, and the remaining liquid is trapped in
isolated domains within the porous medium, mostly in the form of discrete lenses of liquid between
particles.
Up until capillary entry is exceeded, the applied gas pressure compresses the filter cake monoaxially,
and following breakthrough at this threshold pressure (when gas enters into the capillaries), the
filter cake is compressed by lateral forces. Further into the deliquoring process, gas and liquid flow
through the filter cake simultaneously, both in the same direction, however at different speeds and
pressures. The local pressure difference between the two phases is equal to the local capillary

69
pressure. For a completely saturated filter cake, be it liquid or gas flowing through the pores, the
permeability would be the same. However, when both gas and liquid are flowing simultaneously
through the filter cake, two separate capillary systems are formed, and each has a reduced
permeability. The local permeability of either phase, in relation to the permeability of a fully
saturated filter cake, is called a ‘relative permeability’. The diagram below illustrates the changes in
permeability of each phase with different saturation levels.
Figure 24: Relative permeability as a function of saturation (Reference 2)
For the liquid phase, the permeability declines to zero at a finite saturation, corresponding to
equilibrium saturation. Conversely, as saturation levels increase, the airflow decreases until it ceases
at a level that is noticeably lower than fully saturated. The situation arises that some of the voids are
partially filled with gas, with no appreciable flow. Liquid and gas flow through a filter cake obey
Darcy’s law, and the permeability term can be modified by a factor that is a function of the
saturation. Wakeman defines this in terms of pore size distribution index116,117.
Liquid removal during deliquoring can be broadly broken down into three mechanisms which
dominate; plug flow, displacement due to drag on liquid and evaporation116. When gas enters a
pore, it pushes liquid out in plug flow. Following this, gas flow in the centre of the pores pushes

70
liquid off the particle surface. Pendular moisture in the horizontal pores at contact points between
particles remain, which is later removed by evaporation. The first two mechanisms are characterised
by an equilibrium saturation which is achieved after a significant deliquoring time.
With deliquoring, the filter cakes start fully saturated with a wetting phase, and one face is
contacted with a non-wetting phase (such as air). At the other face a capillary barrier permits the
passage of liquid, but prevents the penetration of air due to its very fine pores. As the pressure
increases incrementally, there will be penetration into surface irregularities. Eventually the capillary
entry pressure is reached, which is high enough to force air through the largest neck at the surface
and into the voids below. With homogenous packings of monosize particles, this neck size is
repeated throughout the body of the porous medium. With these conditions, once capillary entry
has been exceeded, air penetrates all the way through to breakthrough at the medium. In general
systems encountered, somewhere along the route will be necks that are smaller than the entry
points, and further penetration ceases. The feed pressure should be sufficiently high such that it
permits penetration through small pores (not necessarily the smallest ones) in the packing and that
breakthrough at the medium is achievable. Pores are never completely emptied, as there is trapped
liquid between two touching particles and there are entire pores and systems of pores that may be
bypassed completely as they are protected by small necks around them17. Very high pressures
cannot reduce saturation below irreducible saturation.
Capillary pressure is an important concept in the understanding of the deliquoring process. When
there are two immiscible fluids occupying pores in a filter cake, one will wet the solid surface,
displacing the other fluid from the surface, and they will each have their own pressure. The forces
among the fluids and the solid are balanced in an equilibrium situation, resulting in a curved
interface between the two fluids, which is dependent on pore geometry and local saturation. This
curved interface indicates that a pressure difference exists across the interface, which is balanced by

71
the surface tension forces. This pressure difference is the capillary pressure, and at equilibrium it is
defined as118:
45
Pc is the capillary pressure, Pnw is the non-wetting phase pressure, Pw is the wetting phase pressure
i.e. it is the pressure difference between the wetting phase pressure and the non-wetting phase
pressure. With porous media where liquid is the wetting phase, liquid pressure is less than gas
pressure, and capillary pressure is positive119. Capillary pressure Pc can be related to the capillary
radius, interfacial tension and contact angle in the following form of the Laplace equation120.
( )
46
ϒ is the surface tension, θ is the contact angle, rc is the capillary radius
The contact angle is defined as the angle formed between the solid-liquid interface and the tangent
to the liquid-gas interface intersecting the three phase contact point, and it is a measure of the
affinity of the liquid to spread over the solid. It is a macroscopically measurable result of a
mechanical equilibrium between two interfacial tensions. If a contact angle of 90 o is achieved, then
according to equation 46 the pressure in the capillaries should be zero and the water should
spontaneously be expelled without a pressure application i.e. under these conditions the water
cannot stay in the capillaries120.
The prediction of capillary forces in a porous medium is important in the understanding of the
movement of fluids within these systems. The relationship between capillary pressure and
saturation exhibits a power law dependence of the form
(
)
47
is the moisture content, subscript ‘sat’ denotes saturation, and x is an empirically determined constant

72
It is determined on the assumption that both capillary pressure and pore volume are directly
proportional to pore radius121. However, recent work on microfluidic cells suggests that it is not so
much pore diameter, but fluid interfacial area that determines capillary pressure122.
Brooks et al.123 fitted this relationship between capillary pressure and saturation to:
(
)
48
Alternatively, Wakeman’s 116 correlation is of the form:
(
)
49
Pe is capillary entry pressure, Sr is equilibrium saturation, SR is reduced saturation, S∞ is irreducible saturation, and λ is the pore distribution
index
The pore distribution index is defined as the slope of the line fitted to the logarithmic plot of
reduced saturation as a function of pressure ratio124. It determines the slope of the curve, the larger
pores at capillary entry to the smallest pores at irreducible saturation. Values of pore size
distribution index range from 0.4 to 10, with lower numbers for smaller particle sizes40,116. Figure 25
illustrates a capillary pressure diagram with increasing values of pore size distribution index. As can
be seen, for an equivalent pressure, lower equilibrium saturation levels are achieved with systems
associated with larger pore size distribution indices. This is due to the lower applied pressures
required to empty larger pores.

73
Figure 25: Capillary pressure curves for varying pore size distribution (Reference 116)
Capillary entry pressure has been correlated by Wakeman116,124 as an extension of the Young Laplace
equation
( )
50
k is the entry pressure coefficient, dm is the mean particle size
Empirical correlations exist to predict residual saturations of filter cakes. The capillary number, a
dimensionless group put forward by Brownell and Katz 124,125, is a ratio of the forces driving liquid
from the pores and the capillary forces that retain liquid in the filter cake125.
( ) 51
Nc is the capillary number

74
Wakeman126 proposed the following correlation for prediction of residual saturation.
( ( ) ) 52
for
Hosten et al.124,127 proposed the following empirical equation to fit their residual saturation data.
( ) 53

75
1.7 Stresses and strains in wet granular media
1.7.1 Capillary bridges
The study of wet particles has great significance in many fields and there are numerous adhesion
mechanisms between surface-wet particles, including electrostatic & van der Waals forces and liquid
bridge forces, the latter usually being the more dominant. Depending on the proportion of liquid
present between groups of particles, four types of liquid states have been identified in the study of
forces due to liquid bridges128. These are:
Pendular Funicular
Capillary Slurry
Figure 26: Liquid bonding between particles (Reference 128)
In the pendular state, the liquid is held as a point contact in a bridge neck between particles and
these bridges are separate and independent of each other. The strong capillary forces draw the
particles together. As the proportion of liquid increases, the liquid is free to move, and the attractive
forces between the particles generally decrease upon increasing separation.
76
Capillary forces are defined as interactions between particles mediated by fluid interfaces. When a
liquid bridge forms between two particles, the capillary force is directed normally to the closest
contact points on the particle surfaces. Depending on the geometry of the bridge, the force can be
attractive or repulsive129. The capillary force is composed of two components: i) surface tension
force exerted around the annulus of the meniscus; ii) pressure difference across the curved
interface. The surface tension component acts at the wetting perimeter, at a tangent to the
meniscus at the 3 phase point and it is directed towards the liquid. The second component is the
Laplace hydrostatic pressure, and it comes from the pressure difference across the curved liquid-air
interface. The behaviour of the capillary forces is determined by the physical-chemical nature of the
particulate system, such as wettability of the particles, geometric configuration of the meniscus,
particle size and separation. It is the contact between the solid, liquid and gas phases which induces
the onset of these forces. Liquid menisci formed between two solid surfaces is of great academic
interest. Between two hydrophilic materials, capillary forces will usually dominate over other surface
forces. The majority of research has focussed mainly on spherical particles130-132 or sphere to
plane133-135, and numerous capillary force calculations with circular approximations for different
geometries have been determined.
Figure 27 illustrates the liquid bridge geometry formed between two spheres in the pendular region,
where the liquid phase is discontinuous. In this evaluation, as the particles are very small,
gravitational distortion of the meniscus can be ignored, and for simplicity, a meniscus profile
described by an arc of circumference is assumed.

77
Figure 27: Diagram of liquid bridge geometry (Reference 136)
In their study of concave liquid bridges, Alguacil et al.136 analysed numerous parameters governing
the liquid bridge, mapping out regions of existence (stability) and inexistence (instability),
discriminating conditions for which the force is attractive or repulsive.
They found that increasing particle separation (whilst keeping liquid volume constant) results in an
elongation of the bridge becoming longer, thinner and less concave. With a fixed interparticle
distance and wetting angle, increasing the liquid volume results in a thicker meniscus as expected,
and a reduction of meniscus curvature, which if sufficiently increased may cover the spheres, fully
immersing them in liquid, in which case the bridge no longer exists, and the liquid state becomes
funicular or even a bulk suspension. If particle separation is increased and all other parameters are
kept constant, as a bridge cannot be elongated indefinitely, a maximum distance exists, and beyond
this separation the bridge breaks136,137. Lian et al.138 proposed the following expression in the
determination of this maximum distance that leads to the rupturing of the liquid bridge:
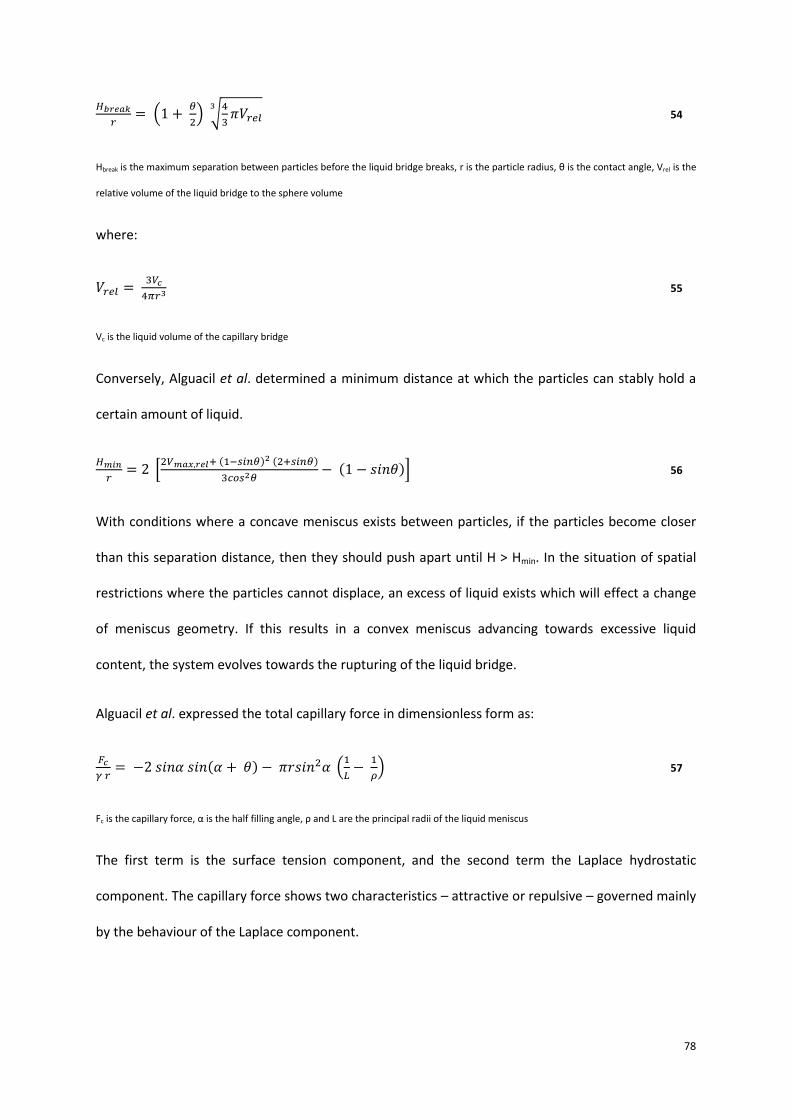
78
(
) √
54
Hbreak is the maximum separation between particles before the liquid bridge breaks, r is the particle radius, θ is the contact angle, Vrel is the
relative volume of the liquid bridge to the sphere volume
where:
55
Vc is the liquid volume of the capillary bridge
Conversely, Alguacil et al. determined a minimum distance at which the particles can stably hold a
certain amount of liquid.
[
( ) ( )
( )] 56
With conditions where a concave meniscus exists between particles, if the particles become closer
than this separation distance, then they should push apart until H > Hmin. In the situation of spatial
restrictions where the particles cannot displace, an excess of liquid exists which will effect a change
of meniscus geometry. If this results in a convex meniscus advancing towards excessive liquid
content, the system evolves towards the rupturing of the liquid bridge.
Alguacil et al. expressed the total capillary force in dimensionless form as:
( ) (
) 57
Fc is the capillary force, α is the half filling angle, ρ and L are the principal radii of the liquid meniscus
The first term is the surface tension component, and the second term the Laplace hydrostatic
component. The capillary force shows two characteristics – attractive or repulsive – governed mainly
by the behaviour of the Laplace component.

79
Alguacil et al.136 mapped out regions of attractive and repulsive capillary forces for certain values of
separation and particle size, wetting angle and liquid volume (relative to solid sphere volume). They
noted that repulsive capillary forces were observed only in a small region for very small relative
liquid volumes and with low contact angles i.e. conditions that lend themselves to a highly curved
meniscus. Under conditions of small separations and small liquid amounts, the Laplacian repulsion
can dominate over the surface tension wetting force which is always attractive. This behaviour
displayed is limited, and beyond a certain separation the capillary force becomes attractive again.
Regions of overall attractive capillary forces and regions of overall repulsive capillary forces are
mapped out in Figure 28 showing the separation distances for different wetting angles ϴ.
Figure 28: Values of relative volume of liquid as a function of dimensionless distances for which Fc = 0, at different wetting angles ϴ
(Reference 136)
80
An intermediate region exists where the following may happen: attraction at very short distances,
repulsion at intermediate distances, and attraction again for larger separations. If the ability exists
for the particles to move relative to each other, the whole system will shrink, then swell, then shrink
again. So, inside regions of existence of liquid bridges, areas exist where the capillary force can be
attractive, repulsive or zero i.e. the dominant Laplace component can be attractive or repulsive,
whilst the meniscus maintains its concave shape.
When large contact angles are encountered, a monotonic decay in capillary force is seen with
increasing separation. However, with small contact angles e.g. 10 °, a local minimum occurs that
approaches a capillary force of zero. This non-linear behaviour is due to the changing influence of
the Laplace component. When the liquid bridge volume is sufficiently reduced, the local minima in
capillary force approaches zero and surpasses it, and the result is that the capillary force becomes
repulsive (+ve). Upon further particle separation, the force becomes attractive (-ve) again.
Willet et al.139 measured the attractive force due to liquid bridges between different sized spheres,
and as seen in Figure 29 below, the capillary force decreases with increasing separation.

81
a) b)
c) d)
Figure 29: Total capillary force for a range of liquid bridge volumes as a function of separation distance between two spheres where the
ratios of radii are a) 1, b) 2/3, c) 1/ 2 and d) 0. (Reference 139)
Additional to this, as liquid volume increases, so too does the capillary force (see Figure 29).
According to Alguacil, this increase in attractive capillary force is due to an increase in contact area
between the liquid and the solid136.
The capillary force and van der Waals are important forces in engineering application. They are
generally cohesive in nature and they restrict the relative movement of the particles, affecting their
packing. Yu et al.140,141 investigated the packing of uniform spheres with increasing liquid content.
Three packing regimes are defined: i) the wetting regime, where porosity increases with liquid
addition to a maximum porosity at a critical liquid content; ii) the filling regime, where porosity is

82
almost independent of liquid content, until the maximum liquid that can be held by the particles is
reached; iii) the slurry regime, where porosity decreases with further increasing liquid content. This
is shown in Figure 30.
Figure 30: Dependence of porosity on liquid addition (Reference 142)
The addition of liquid and the subsequent formation of capillary bridges and generation of a capillary
force restricts motion between particles when a packing is formed, giving a high porosity142. The
increasing liquid content wets the particles, increasing the magnitude of the capillary force, resulting
in an increased porosity. After the critical point, further liquid additions will not appreciably affect
either porosity or capillary force until the maximum liquid content is reached. After this, the capillary
force will decrease or vanish. Porosity will further decrease with additional liquid.

83
Figure 31: Fc/Fg vs β for different distances between glass beads 1) s/R = 0; 2) s/R=5 x 10-4 ; 3) s/R = 5 x 10⁻³ ; 4) s/R = 5 x 10⁻² ; 5) s/R = 5 x
10-1 ; R = 100 µm (Reference 140)
Figure 31 shows variation of RF, the ratio between capillary force of a liquid bridge and the gravity
force on a particle. For a given separation, capillary force increases to a maximum and then
decreases. For a given filling angle, a large separation corresponds to a small capillary force. Filling
angle can be related to liquid content, and as such it seems to suggest that porosity is related to
liquid content. It is hard however to quantify the relationship between porosity and interparticle
forces, as both terms depend on many variables. Feng and Yu140 suggest the relationship can be
described by the following:
58
eo is the porosity of dry spheres, RF is the ratio of capillary force to gravitational force
The interparticle forces covered so far involve the interparticle force acting on a particle interacting
with one neighbour. Obviously though, many neighbours must exist in order for there to be a stable
packing, resulting in many bridges and capillary forces acting on one particle. Though these forces
will act in different directions, for spheres it can be considered that they point to the centre of the
particle. The sum of these forces can be averaged for the total force on a particle, and it is a function
of these forces and the mean coordination number140.

84
1.7.2 Tensile strength
Tensile strength is an important parameter in the characterisation of the compacted material that
comprises a filter cake. It is possible to predict changes to this property from parameters such as
porosity and particle size, and several correlations exist allowing for the calculation of the tensile
strength of wet granular materials. These materials can be characterised by their degree of liquid
saturation. A small amount of liquid results in capillary bridges forming between individual particles
i.e. the pendular state. Further increases result in the funicular state, and the extreme capillary state
where all capillaries are completely filled with liquid, forming concave menisci at the pore ends. It is
these different liquid distributions that affect the strength of these wet materials143.
One of the most widely used formulae is that of Rumpf et al.144,145 which gives the tensile strength in
the pendular state to be:
59
e is porosity, F* is mean adhesion force transmitted at a contact point, rs is particle size as Sauter diameter
This model is based on several assumptions; the particles are monosized spheres distributed in the
packing, and the bonding forces are uniformly distributed over all directions around a mean value.
This corresponds to an isostatic stress in the particle. Heterogeneity of the packing is not integrated
into this model, so it does not account for the probability of particles of different size to be in
contact.
In the capillary state, the tensile strength is given by
60
Sl is the saturation
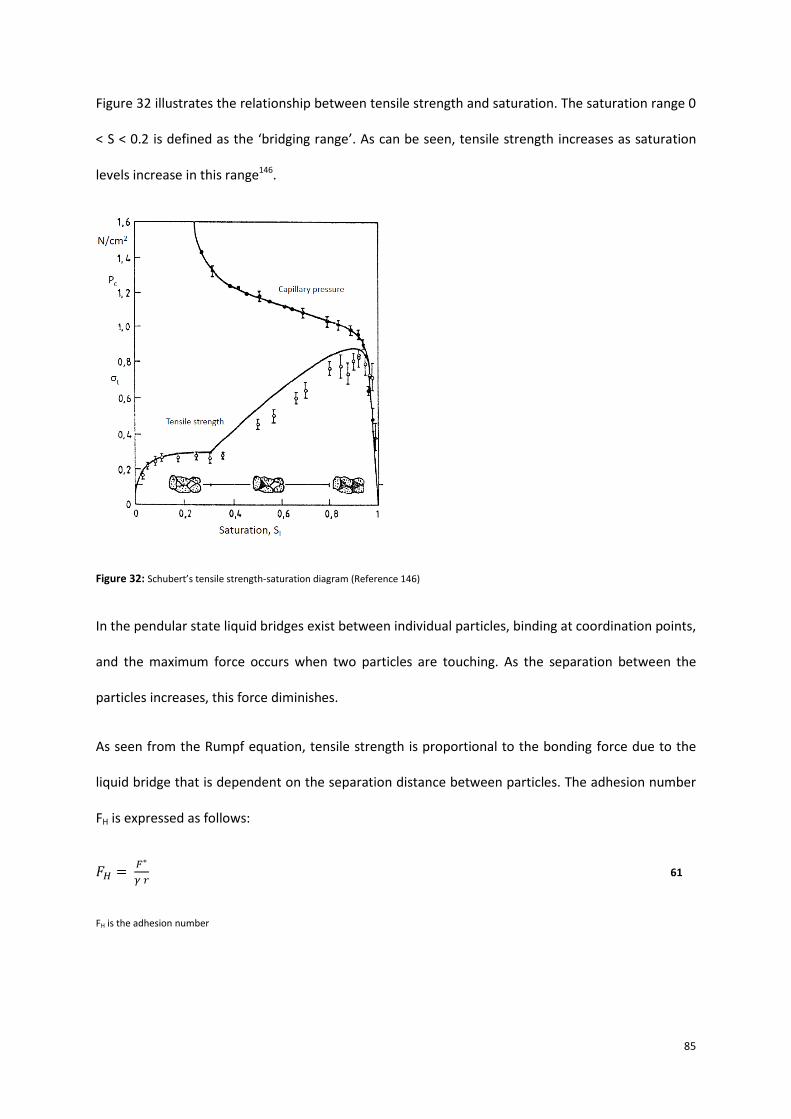
85
Figure 32 illustrates the relationship between tensile strength and saturation. The saturation range 0
< S < 0.2 is defined as the ‘bridging range’. As can be seen, tensile strength increases as saturation
levels increase in this range146.
Figure 32: Schubert’s tensile strength-saturation diagram (Reference 146)
In the pendular state liquid bridges exist between individual particles, binding at coordination points,
and the maximum force occurs when two particles are touching. As the separation between the
particles increases, this force diminishes.
As seen from the Rumpf equation, tensile strength is proportional to the bonding force due to the
liquid bridge that is dependent on the separation distance between particles. The adhesion number
FH is expressed as follows:
61
FH is the adhesion number

86
In Figure 33 this is plotted against the distance ratio H/r for complete wetting i.e. contact angle ϴ = 0
°. As can be seen, adhesion decreases as the distance grows between the two spheres. This adhesion
is at a maximum when the separation is minimal i.e. H → 0 and the spheres are close to touching.
Figure 33: Adhesion number as a function of distance ratio for liquid bridges between equal spheres. The parameter is the liquid volume
related to the volume of the spheres. (Reference 145)
The tensile strength of wet granular material is a strong function of packing density. Non-uniformity
is not considered in the Rumpf model, but it is the particles in the densest packing fraction that
make the largest contribution to the overall strength144.

87
2 Literature review on cracking
2.1 Cracking in filter cakes
During the deliquoring phase of the filtration process, shrinkage cracking is frequently encountered,
posing a restriction on further desaturation, and in extreme cases making this process impossible.
Filter cake cracking results in a distinct exposition of the filter medium, and the gas passes
preferentially through the cracks in the filter cake rather than removing liquid from the pores of the
cake. This results in a greater gas consumption, and a filter cake of higher moisture content, which
requires greater thermal energy input in the later drying stages.
Figure 34: Photographs of cracked filter cakes (top, side, bottom)
Figure 34 illustrates the occurrence of cracking in filter cakes, and as can be envisaged, its effect on
the deliquoring process can be hugely detrimental. The study of filter cake cracking has been
touched on only briefly in the past half century, with many industrial countermeasures being based
on anecdotal evidence. This phenomenological approach has resulted in ineffective treatments such
as the pausing of a filtration operation upon observation of a crack, so that the cracks can be
smoothed over with rollers. Such stop gap approaches are time consuming, costly and mostly
redundant as these steps will later need to be repeated. An understanding of the fundamentals of
filtration and the forces at play during the filtration and deliquoring processes are required for an
effective solution that is applicable across a wide range of operating parameters. Mechanisms put
forward involve movability of particles within the porous mass, and stresses generated by the

88
capillary forces encountered during dewatering, but so far the studies carried out have been limited
and not fully explored.
Shrinkage leading to cracking was noted by Rushton et al.147 in their study of concentration effects in
rotary vacuum filtration. They looked at porous cakes resulting from high concentration slurries and
stated that high filtration velocities produced high filterabilities since the fluid flow generates
stabilising forces within the porous mass, lending support to an open structure, and when something
reduces these forces, densification with concomitant cracking can result.
Lloyd et al.148, investigating liquid retention in filter cakes suggested that filter cake cracking may be
due to the emptying of a single large pore, resulting in high internal stress due to surface tension.
Many pores of smaller diameter branch into this large pore, and at each entrance the large capillary
pressure applies, placing the cake under great internal stress. Cracks then develop as a means of
reducing this stress. Therefore, cracking of filter cakes will be more frequent when the particle, and
therefore pore size, is small.
Wakeman149 further investigated internal stress developments in filter cakes. He ascribed the
prominence of cracking to the situation where the fluid in the pores is a mixture of air and liquid,
which has a compressibility approaching that of a gas, and also the presence of air and liquid
interfaces results in additional intergranular pressures, and it is the distribution of these interfaces
that determines the tendency of a cake to crack.
Anlauf et al.150 outlined the crack formation process through an understanding of the capillary forces
that arise during the deliquoring of a porous system. As fluid is removed, and liquid bridges form
between the particles, a capillary suction is built up in the liquid bridge, and tensile forces are
generated between the particles. When the tensile forces between two particles cannot be
transmitted anymore, the capillary bridge ruptures under stress reduction. Anlauf’s investigations
focussed on filtration area geometry and cake height. They found that with small circular filtration

89
areas (49 cm2), as cake height increased, cracking tendency diminished, until it was removed at 16
mm height. For larger filtration areas (300 cm2) all filter cakes cracked, covering all heights (up to 16
mm). Rectangular filter cakes were also investigated, and converse to what was found with circular
areas, with small rectangular areas (48.4 cm2), crack probability increased as filter cake height
increased. They concluded that the tensile stresses generated between particles can be partially
compensated by the cake shrinkage, but shrinkage is not to the same extent in all directions as
movement is restricted at the interface of the filter cake with the filter medium. As a result, a
shrinkage gradient develops over the height of the filter cake. They put it that the lower crack
probability that goes with smaller filtration areas can be utilised by subdividing the filtration area
into several smaller filter elements. A theoretical infinitely small area can be infinitely tall, as the
horizontal tensile stresses can be reduced by unrestricted shrinkage. With enlargement of the filter
area, a maximum cake height exists where the arising tensile stresses can be compensated by the
pre-stress, which is large enough to stabilise the particle structure.
For circular filtration areas with increasing cake height, crack formation diminishes due to the
decreasing effect of the medium - cake interface, and the tensile stresses can be compensated due
to a higher possible shrinkage.
The theory proposed of utilising smaller filtration areas was further tested by Gross et al.151, who in a
series of experiments divided the filtration area into many small areas, such that a honeycomb
matrix was achieved. A critical length of filtration area was used below which no cracks would
appear, and a honeycomb size corresponding to the diameter of a circle was determined.
Wiedemann and Stahl152 investigated shrinkage behaviour and the possibilities of influencing it.
Experiments were conducted using aluminium tailings, as well as other materials such as barite,
limestone, titanium dioxide, etc. Shrinkage curves were plotted showing void ratio Rv (pore volume /
solid volume) against moisture ratio Rl (liquid volume / solid volume), two parameters which are
connected by saturation Sl i.e. (Rl = Sl Rv).

90
Shrinkage curves are divided into three sections, and they are: Normal, Residual and Zero shrinkage,
and they are illustrated in Figure 35.
Figure 35: Characteristic shrinkage curve showing normal, residual and zero shrinkage sections (Reference 152)
Generally, ‘Normal shrinkage’ contributes most to shrinking, and it is characterised by the reduction
of total volume equalling the decrease in liquid volume i.e. the filter cake shrinks whilst still staying
fully saturated. When the capillary entry pressure is overcome and gas enters the pores, the
‘Residual shrinkage’ section is entered. This is characterised by a decrease in saturation, as well as a
decrease in void ratio. Later, in the ‘Zero shrinkage’ section, the filter cake achieves the highest
packing density that can be effected, and there is no more shrinkage. The void ratio remains
constant, and the decrease in liquid volume leads to a continued lowering of the cake saturation.
The maximum shrinkage for a given cake is called the ‘shrinkage potential’ (∆Rv,max), and it is the
difference between the void ratio at the end of compression (Rv,EOC) and that at the end of shrinkage
(Rv,EOS). The character and extent of the shrinkage process is influenced by the applied pressure, as
illustrated in Figure 36.

91
Figure 36: Influence of compressive pressure on shrinkage process (Reference 152)
As can be seen, increasing the compressive pressure results in a reduction of the shrinkage potential.
It is a function of the decrease in void ratio at the end of compression. Figure 37 shows the
corresponding illustration of the results, plotting shrinkage potential against log compressive
pressure.

92
Figure 37: Shrinkage potential as a function of compressive pressure (Reference 152)
The fitting curves lead to a straight line which could be extrapolated to higher compressive
pressures, and the intersection with the y axis yields the minimum compressive pressure PC Min which
is necessary to avoid shrinkage. As can be seen in Figure 36, decreasing shrinkage potentials cause a
contraction of the normal shrinkage range. With application of higher pressures, the shrinkage
process starts directly in the residual shrinkage section i.e. decreasing saturation immediately. When
the applied pressure exceeds the minimum compressive pressure, the whole process is close to a
horizontal line.
Figure 38 shows the minimum compressive pressures extrapolated for different materials. The
product specific shrinkage behaviour, characterised by the slope and the intersection with the
abscissa, is dependent on a number of complex parameters such as size distribution, particle shape
and zeta potential. A general trend seen here is that as the mean particle size decreases, there is a
tendency towards higher shrinkage potentials and higher minimum compressive pressures.

93
Figure 38: Shrinkage potential as a function of compressive pressure for different materials (Reference 152)
The cumulative mass distributions for the materials used are shown in Figure 39 below.
Figure 39: Cumulative mass distributions for different materials (Reference 152)
The influence of surface tension was also investigated, in order to see how shrinkage behaviour is
affected by variation of the capillary forces. Surface tension was reduced through addition of a non-
ionic surfactant. As can be seen in Figure 40, the shrinkage potentials as well as the minimum
compressive pressures are lowered when surface tension is decreased.

94
Figure 40: Effect of variation of surface tension on shrinkage potential and minimum compressive pressure (Reference 152)
To conclude, despite the advent of shrinkage, even with an application of compressive pressure that
is less than the minimum compressive pressure, crack formation can already be stopped. Filter cakes
can endure some deformation without resulting in cracking. So, if a critical shrinkage potential
specific to the material is not exceeded, cracking can be avoided.

95
Parameter Findings
Compressive pressure Higher pressures applied result in a reduction of shrinkage potential.
Surface tension With a reduction of surface tension, the shrinkage potentials and the
minimum compressive pressure are lowered.
Particle size With decreasing mean particle size, there is a tendency to higher
shrinkage potentials and higher minimum compressive pressuresa.
Filtration height and
area
For small circular areas, with increasing cake height, cracking likelihood
diminishes. For increasing filtration area of circular cloths, cracking
likelihood increasesb.
Table 2: Summary of what has been published in the study of filter cake cracking
a - It should be noted that these specific experiments were conducted with different materials (Titanium dioxide, Barite, Aluminium tailing,
etc.) with different cumulative mass distributions around these mean sizes.
b - It should be noted that although the filtration areas were large (49 to 300 cm2), the heights of the filter cakes were very small (6 to 16
mm) i.e. the aspect ratios were << 1

96
Parameter Reason
Compressive pressure Investigations into linear behaviour and degree of cracking have not
been conducted, nor the outcome on residual saturation.
Filter cake height Investigations into tall filter cakes with aspect ratios > 1 would be of
interest as the influence of pressure sharing between the medium and
the filter cake would be diminished.
Settling time Settling affects the particle arrangement during filter cake build up and
the particle size profile that develops
Concentration Concentration is closely tied to sedimentation, but again affects the
way that particles pack together during filtration.
Surface tension With previous studies, absolute results were defined. Investigations
into linear behaviour and degree of cracking have not been conducted.
Viscosity Viscosity determines drag forces on particles and the effect on porosity
and packing have not been thoroughly investigated.
Temperature Temperature has effects on numerous parameters, such as surface
tension, viscosity, solubility and particle surface charge.
Table 3: Overview of the important parameters that have yet to be studied comprehensively in filter cake cracking

97
2.2 Cracking in other contexts
2.2.1 Colloidal films
When a colloidal suspension is spread over a substrate and the liquid content evaporated, a colloidal
film is formed. This process has applications in many diverse fields such as inks, paper coatings and
ceramics, however there are limitations as stresses and strains build up during drying, and these lead
to distortion and cracking153.
An unconstrained droplet of colloidal dispersion undergoing drying has particles that initially are
freely dispersed in the liquid. Repulsive electrostatic forces between the particles ensure that
agglomeration does not occur. As the liquid evaporates, particle separation diminishes such that
solid particle surface will not be exposed, which would result in an increase in the overall surface
energy. A force acts on the particles in the liquid that serves to push them closer together against
the repulsive colloidal forces, the particles pressing into contact with each other once sufficient
liquid has evaporated. The stresses in the particles become compressive, with the liquid menisci
pushing the particles at the outer edge of the droplet inwards. When the volume of liquid has been
sufficiently reduced by evaporation, the capillary forces push the particles together until a network is
formed. A critical point is then reached when the menisci move into the particle network. Liquid is
retained in the pores between the particles, which empty as further evaporation takes place. The
actual formation of the network and the emptying of the pores taking place at fronts that move from
the outer edges of the film is known as ‘lateral drying’. It can be described by the following regions:
i) supersaturated region at the centre, where the colloid remains fluid; ii) saturated region which
surrounds the supersaturated region and is a compacted body where the pores are filled with liquid;
iii) empty pore region which can be a number of distinct separate regions outside the saturated
region, where the pores have been drained of fluids. The boundary between the supersaturated and
the saturated regions is the ‘packing front’, and the boundary between the saturated region and the
empty pore region is the ‘pore emptying front’.

98
If evaporation of liquid from the pores were to lead to the exposition of the solid phase, a solid-
liquid interface would be replaced by a more energetic solid-vapour interface and an increase in
energy of the system154. In order to prevent this, liquid tends to spread from the saturated interior of
the body in order to cover the interface. With colloidal films, evaporated water from the outer
regions is replenished by water flowing from the central supersaturated region at the interior. The
driving force for this is a gradient in capillary pressure through the saturated region. Liquid
distribution is the combined effect of drying from the outer edges and capillary suction from the
supersaturated region (which acts as a reservoir). In studies by Holmes et al.153, the wet region
disappears before the pore emptying front moves in from the edges. In this situation, when the
packing front reaches the centre, further evaporation requires that the pore emptying front moves
inwards from the sides and top surface, and it is when this occurs that cracking and warping is seen.
It is observed that this cracking is often initiated at the central dimple. However, development of
stress can occur in the outer regions whilst the centre of the film is still fluid, resulting in the
situation where the empty pore region appears before the supersaturated region has disappeared,
and cracks start to grow inwards from the drying edges into the saturated region. Cima et al.155
found that for films cast on a large substrate, liquid replenishment from the supersaturated region
to the outer region ends before the interior region is extinct i.e. once the pores at the outer edge
have emptied, stresses can develop here whilst the central reservoir is still fluid. For smaller
substrates however, there was no development of stress until the packing front disappeared and the
supersaturated region was extinct. For a crack pattern of this form, the film must be in tension at
some stage during drying.
When the saturated portion of the film dries, the shrinkage that occurs suggests that initially the
particles remain separated in the saturated state, and the separation itself is thought to be around
the thickness of the electrostatic repulsive layer. At the moment the supersaturated region becomes
extinct, the particles in the film are still separated by electrostatic repulsion, and upon further
drying, the stresses that have developed around the fine capillaries draw the particles together. The

99
observed strains are thought to be due to the capillary forces which collapse the electrostatic
repulsive layer. Shrinkage occurs when the repulsive layer is removed during the drying process, and
its degree can be estimated from the differences between the saturated and dry packing density.
Goehring et al.156 investigated drying of colloidal dispersions of silica and noted the process of
solidification occurring in two stages; the solidification of particles into a non-touching network and
later the collapse of that network. The transitions between these two stages were seen to propagate
as distinct fronts along the drying layer. These were observed as changing transparency and colour.
The dynamics of these fronts they concluded arose from a delicate balance between the
electrostatic interplay described by DLVO theory and compressive capillary forces.
Shrinkage occurs in the thickness direction, since the film is constrained horizontally by the
substrate. During the drying of a film, a biaxial stress can develop in a number of ways. Differential
shrinkage between the top and the bottom of a film can produce stress, the result of a moisture
gradient across the thickness of the film. Additionally a tensile stress also develops in the drying film
due to capillary tension in the pore liquid.
Cima et al.155 also demonstrated the importance of the substrate in the cause of cracking. They
found that colloidal films cast on a bed of liquid mercury would not crack, whereas films cast on a
conventional Teflon substrate would warp157. Their stress history curves showed a maximum stress
reached early during the drying process, decreasing monotonically thereafter. Further, the maximum
stresses encountered were inversely proportional to the particle size of the granular film. This is
consistent with the theory that capillary pressure is the origin of the stress, as a film stress can be
decreased with increasing particle size and pore size. This capillary pressure would cause shrinkage
in the plane of the film if it weren’t constrained by the substrate157. In the monoaxial direction
towards the substrate, particle rearrangement does accommodate some strain. The substrate
imposes a constraint which prevents complete relaxation of the stress. When the development of
stress during drying is attributed to the moisture gradient that builds up, a steep moisture gradient is

100
accompanied by differential shrinkage between the dry surface and the saturated regions found at
the centre of the films. Yow et al.158, in their study of drying latex films, also commented on crack
formation lying with the restriction of the film shrinkage from binding on the substrate, generating a
tensile in-plane stress. The scale over which these changes occur is largely governed by the free
surface evaporation rate and the ability of the body to redistribute liquid internally. When
comparable rates are achieved between redistribution of liquid to the surface and evaporation, then
the moisture gradient will be less concerning. However, if the rate of replenishment is slow in
comparison to evaporation, then a sharp moisture gradient can develop. The driving force for liquid
redistribution during drying is a result of capillary pressure gradients, which are governed by the
pore size in the porous structure.
Like other researchers, Carreras et al.159 reported on tensile stress development at the surface of a
drying body due to the constraint of the drying shrinkage by the interior of the body. The controlling
factor in the development of stresses being the rate of evaporation relative to the rate of transport
of liquid to the surface of the body, the former controlled by temperature, vapour pressure of the
liquid and ambient pressure, the latter by Darcy’s Law relating flowrate to pressure gradient. When
the evaporation rate is lower than the rate of liquid flow through the body i.e. slow drying, the rate
of which is lower than the Darcian replenishment, then the shrinkage of an unconstrained body is
uniform. If the evaporation rate is fast relative to the transport of liquid to the surface i.e. fast
drying, then a pressure gradient and a moisture gradient will develop, resulting in a non-uniform
shrinkage. The surface (which is the low moisture region) will try to shrink more than the interior of
the body, which constrains the exterior dry layer. This constraint of shrinkage will result in tensile
stresses at the surface. In the case of a colloidal dispersion on a rigid substrate, the body cannot
shrink uniformly and isotropically, even during slow drying. The substrate, as it is rigid, constrains the
shrinkage in the surface plane. However, normal to the surface, the shrinkage is unconstrained. As is
known, a peak stress occurs at the end of the constant rate drying period, and Carreras et al. found
that cracking typically coincides with this peak. They summarised that cracking of a film can be

101
avoided by keeping the stresses low (i.e. aforementioned slow drying or reducing the surface
tension) or by increasing the mechanical properties of the drying compact, and an increase in CCT is
a result of higher packing density. A high solid concentration results in a greater number of particle -
particle interactions, and the film can withstand higher stresses159.
The argument however for generation of differential stress due to the moisture gradient has been
called into question. With the cracking of thin films when the thickness is larger than a critical value,
this critical thickness is academically significant, as a film with a value below this thickness means
that no cracking will occur160. This parameter is called the ‘critical cracking thickness’ (CCT). Cima et
al.157 asserted that if moisture gradients were important, the drying rate would be seen to have an
influence on observed CCT, which was not the case in their findings. A moisture gradient in a film
they claimed should be a self-constrained situation, so cracking should be equally likely to occur
regardless of whether a solid substrate or a pool of mercury was used. Systems cast on mercury
beds have extremely high CCT, which to them suggests that stress is related to the constraint on the
solid substrate157.
The capillary tension in a film might be reduced by allowing particles to change their neighbours,
which allows a change in the shape of the network, as well as decreasing the free volume, and for
the onset of cracking to occur, there should be no further density increase. In a touching network,
the existence of the strains that develop requires that the increase in volume fraction occurs by this
mechanism of particles changing neighbours, which reduces any misfit strains153. So, a biaxial stress
that develops in a drying film can cause cracking even if a moisture gradient is not likely to exist
across the thickness of the film, according to the researchers. The stress in a drying film they
postulate is due to the capillary pressure in the pore liquid, and the critical thickness depends mainly
on the magnitude of the capillary stress. Drying rate does not affect the magnitude of capillary
pressure, so the CCT should remain unaffected by this, and for Cima et al. it was. As CCT is a function
of drying stress and fracture resistance of the film, they concluded that the stress arises due to the
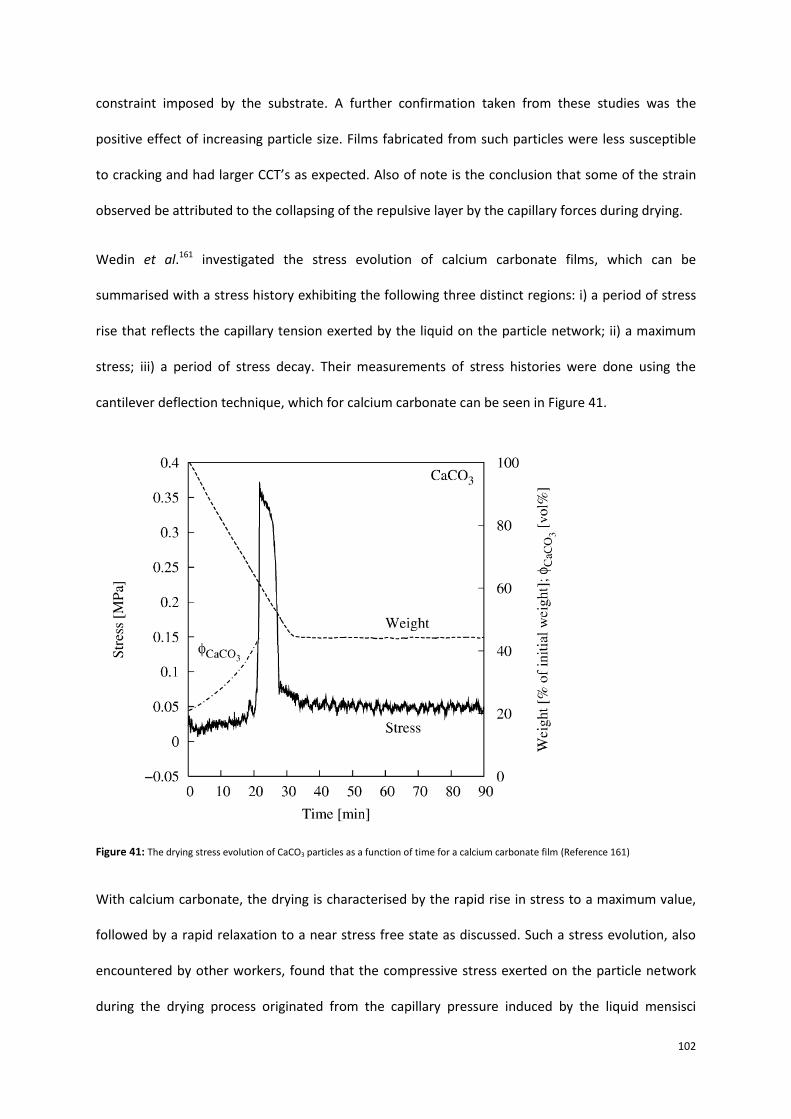
102
constraint imposed by the substrate. A further confirmation taken from these studies was the
positive effect of increasing particle size. Films fabricated from such particles were less susceptible
to cracking and had larger CCT’s as expected. Also of note is the conclusion that some of the strain
observed be attributed to the collapsing of the repulsive layer by the capillary forces during drying.
Wedin et al.161 investigated the stress evolution of calcium carbonate films, which can be
summarised with a stress history exhibiting the following three distinct regions: i) a period of stress
rise that reflects the capillary tension exerted by the liquid on the particle network; ii) a maximum
stress; iii) a period of stress decay. Their measurements of stress histories were done using the
cantilever deflection technique, which for calcium carbonate can be seen in Figure 41.
Figure 41: The drying stress evolution of CaCO3 particles as a function of time for a calcium carbonate film (Reference 161)
With calcium carbonate, the drying is characterised by the rapid rise in stress to a maximum value,
followed by a rapid relaxation to a near stress free state as discussed. Such a stress evolution, also
encountered by other workers, found that the compressive stress exerted on the particle network
during the drying process originated from the capillary pressure induced by the liquid mensisci
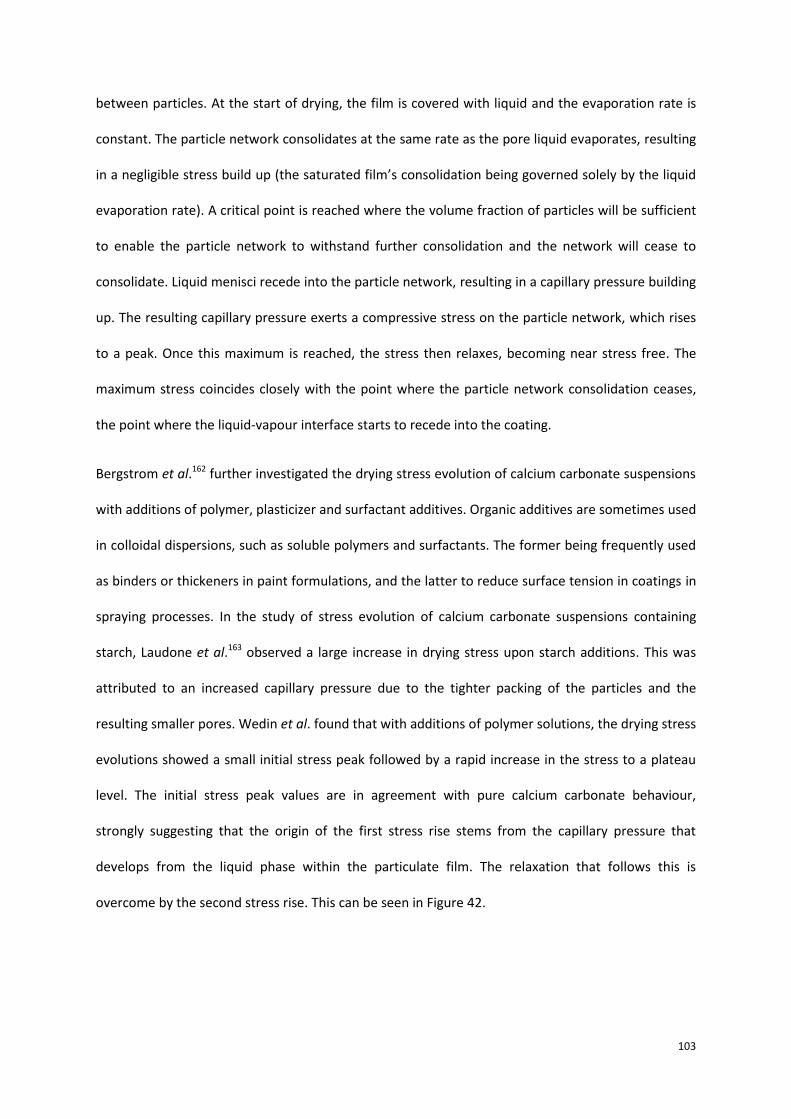
103
between particles. At the start of drying, the film is covered with liquid and the evaporation rate is
constant. The particle network consolidates at the same rate as the pore liquid evaporates, resulting
in a negligible stress build up (the saturated film’s consolidation being governed solely by the liquid
evaporation rate). A critical point is reached where the volume fraction of particles will be sufficient
to enable the particle network to withstand further consolidation and the network will cease to
consolidate. Liquid menisci recede into the particle network, resulting in a capillary pressure building
up. The resulting capillary pressure exerts a compressive stress on the particle network, which rises
to a peak. Once this maximum is reached, the stress then relaxes, becoming near stress free. The
maximum stress coincides closely with the point where the particle network consolidation ceases,
the point where the liquid-vapour interface starts to recede into the coating.
Bergstrom et al.162 further investigated the drying stress evolution of calcium carbonate suspensions
with additions of polymer, plasticizer and surfactant additives. Organic additives are sometimes used
in colloidal dispersions, such as soluble polymers and surfactants. The former being frequently used
as binders or thickeners in paint formulations, and the latter to reduce surface tension in coatings in
spraying processes. In the study of stress evolution of calcium carbonate suspensions containing
starch, Laudone et al.163 observed a large increase in drying stress upon starch additions. This was
attributed to an increased capillary pressure due to the tighter packing of the particles and the
resulting smaller pores. Wedin et al. found that with additions of polymer solutions, the drying stress
evolutions showed a small initial stress peak followed by a rapid increase in the stress to a plateau
level. The initial stress peak values are in agreement with pure calcium carbonate behaviour,
strongly suggesting that the origin of the first stress rise stems from the capillary pressure that
develops from the liquid phase within the particulate film. The relaxation that follows this is
overcome by the second stress rise. This can be seen in Figure 42.
104
Figure 42: Drying stress evolution as a function of drying time for ternary films containing calcium carbonate and glycerol (Reference 162)
The maximum values of the second stress rise follow the same order of those achieved with pure
polymer films, suggesting that the second rise is specific to polymeric species. It should be noted
that this second peak occurs when 90% of the initial water content has evaporated, which is
significantly beyond the critical point where liquid has receded into the particle network and
maximum capillary forces are exerted. Therefore the interpretation proposed by Laudone163 that the
large increase in drying stress reflects an increase in the capillary pressure was strongly disagreed
with by Wedin et al.162 The initial stress peak - comparable to that seen with pure calcium carbonate
films - is a characteristic of granular films, consisting of the steep stress rise induced by capillary
forces which is then followed by a rapid stress relaxation. When a secondary evolution is seen i.e.
with the addition of a polymer, this larger stress rise they concluded is due to solidification and
shrinkage of polymer rich regions within the film. The nature of the secondary peak was further
verified with additions of SDS surfactant to films of calcium carbonate and CMC polymer. The SDS
films differed considerably to films containing glycerol, which exhibited a distinct capillary induced

105
stress peak during the initial stages of drying followed by the larger second peak. The films
containing surfactant displayed a smooth increase in the drying stress, all the way up to the plateau
stress values associated with the secondary peak. The surfactant reduces the surface tension of the
liquid phase, suppressing the initial stress rise that is related to the capillary pressure exerted on the
capillary network. This is seen in Figure 43 below:
Figure 43: Drying stress evolution as a function of drying time for ternary films containing calcium carbonate and SDS surfactant
(Reference 162)
Scherer154, focussing on drying of gels, looked at the interaction between liquid flow and pore
dilation in order to predict the stresses that develop during drying. As liquid moves from the interior
of the body to the exterior, the liquid goes into tension. Liquid flows from the interior along the
pressure gradient, as discussed, in accordance with Darcy’s Law, and the tension is balanced by
compressive stress in the network that causes shrinkage. With low permeability it is more difficult to
draw liquid from the reservoir at the interior of the body, and as a result a greater pressure gradient
develops. As the pressure gradient increases, the variation in free strain rate increases, with the

106
surface contracting faster than the interior of the body, and the differential strain produces stress.
So, with gels, cracking is more likely if the drying rate is high, and cracks generally appear at the
critical point where the shrinkage stops and the vapour liquid interface moves into the body of the
gel. Here, liquid is removed from the largest pores, and the tension in the neighbouring small pores
is thought to deform the pore wall which leads to cracking. In gel drying, the stresses result from a
gradient in pressure in the liquid that resides in the pores of the drying body, and the stresses
increase with drying rate. As before, the stresses are inversely related to the permeability of the
body. Although these findings are at odds with those of Cima et al.157 with respect to drying rates, it
should be noted that in Cima’s studies numerous parameters were varied simultaneously.

107
2.2.2 Carbon Xerogel monoliths
Leonard et al.164 looked at the effects of the drying parameters air temperature and velocity on pore
texture and shrinkage cracking of Resorcinol – Formaldehyde xerogels. When the mechanical
strength of a particle network is sufficient to withstand the capillary pressures that result from
evaporation of liquid in the pores, the collapse of the pore network can be avoided. With severe
conditions however, cracking occurs. Drying kinetics are related to the textural properties of the
material (e.g. pore size), and in their experiments the Resorcinol / Formaldehyde (R/C) ratio was
varied. As a rule, pore size and volume increase when R/C increases. As expected, it was observed
that drying is faster when pore size, temperature and air velocity increase, however monolithicity is
not always preserved.
Figure 44: Krischer’s curves showing influence of air velocity (Reference 164)
Krischer’s curves for RF xerogels synthesised with R/C of 500 are seen above. There is small period of
preheating, followed by a period that is characterised by a plateau of constant drying flux. During
the constant drying flux phase, corresponding to the shrinkage period, the transfers are controlled
by external limitations, such as temperature or air velocity. Increases to either invariably increase
the drying flux. During this stage, the external material surface stays fully wet. What follows is a long
decreasing drying flux period, and it can be seen that there is an increase of drying flux as air velocity
increases. Along the plateau the heat and mass transfer rates are controlled by extragranular

108
limitations only. The water diffusion is fast enough to ensure the replenishment of the surface with
water. In the study of xerogel monoliths, this is termed ‘internal transfer’. When the drying flux
decreases, it means that internal transfer limitations appear, and during the first decreasing zone,
moisture gradients develop. A long period of decreasing flux follows, due to growing internal
transfer limitations, at the start of which is a coexistence of both external and internal transfer
limitations. When the evaporation front moves into the solid, internal limitations control the drying
process fully. This final stage corresponds to pure internal transfer limitations. It is these diffusional
limitations that induce moisture gradients, and it is these that cause mechanical stresses. When the
stresses generated exceed the maximum breakage resistance of the material, cracks develop. The
internal water diffusion coefficient decreases as the pore size gets smaller and the permeability
decreases. So the moisture gradients, and resulting mechanical stresses, are significantly greater
when the monolith contains small pores. It follows then that cracking occurs with low R/C values i.e.
small pores.
Leonard et al.164 found that when R/C was low, it was difficult to preserve a monolithic structure
with fast drying. Temperature had to be lowered significantly to avoid cracking. Air velocity had little
effect on cracking of the sample, however temperature had a large influence. When monolithicity is
required, careful control of the drying flux is needed as cracks appear when conditions are too
severe. This is more marked at low R/C ratio i.e. small pore size.
In the agro-food industry, the use of air with high humidity during the drying process is sometimes
used as a way to avoid cracking. Again, the internal diffusional limitations induce moisture gradients,
and these are thought to cause the mechanical stresses that lead to cracking. Izumi et al.165
discussed the hygrostresses that form within foods due to non-uniform shrinkage, which can lead to
stress crack formation. They reasoned that a stress crack is formed at a location where a tensile
hygrostress exceeds a critical level. They found that in the early stages of drying, surface moisture

109
was reduced, but there was no moisture reduction in the interior, resulting in large tensile stress
formation.

110
2.2.3 Concrete
The formation and propagation of cracks play an important role in the performance of concrete
masses. There are many different types of concrete, with varying amounts of the principal
ingredients. These are; the cementitious phase, the aggregate phase and the water addition. When
the cementitious material is combined with water, it forms a paste through the process of hydration.
This paste bonds the aggregates together, filling the voids and forming a solid mass.
The main reaction is as follows:
2Ca3SiO5 + 7H2O → 3(CaO).2(SiO2).4(H20) + 3Ca(OH)2
Drying and shrinkage coupled with low tensile strength is a disadvantageous property of concrete
structures, and is a major cause of its deterioration. The contraction is normally hindered through
internal-external limitations and tensile stresses are induced. Local shrinkage is related to the
saturation of pores, and a shrinkage deformation exists throughout the drying process. When tensile
stresses are induced, if they exceed the tensile strength of the material, then this may lead to
cracking166. The tensile stresses generated result from the difference in pressure between the gas
and the liquid phase, and this stress acts on the walls of the pores, which results in shrinkage of the
concrete167.
Drying involves movement of water from the centre of the body towards the surface, yielding a
moisture gradient. The majority of water transported is at constant rate. When lower saturation
levels are reached, drying rates decrease with time. With the two porous components of the
aggregate and the cement paste in which the aggregates are embedded, large surface areas are
encountered. Due to these large specific areas internally, a significant amount of water exists in the
adsorbed state.
An interface exists between the aggregate particles and the cement paste, and this zone affects
particle properties and structure. It is a very thin layer of cement paste that is differentiated due to

111
significantly different characteristics from the bulk mixture. It ranges in thickness from 50 to 100 µm,
and is thought to be the result of the thin films of accumulated water at the surface of the
aggregate. This interfacial region has a high amount of large crystallised hydrates when compared
with the surrounding bulk phase, and it has a higher porosity and is considered to be the weakest
zone in terms of mechanical behaviour.
Great developments have been made in the field of modern concrete study, one of which is the use
of superplasticizers. These are used for rheological control and necessitate lower water volumes.
Another development is the inclusion of silica fumes, which enhances overall durability and strength.
Concrete structures are very complex systems of numerous solid phases, pore networks and a high
degree of heterogeneity. Tasdemir et al.168 compared normal strength concretes and high strength
concretes to determine the influences of specific components on the stress distributions at the
interface between aggregate and the bulk cement phase. They considered the concrete as a three
phase composite material; the continuous mortar matrix phase, aggregate, and the interfacial zone.
In an earlier study of normal concrete, Bremner et al.169 showed that the elastic mismatch between
the matrix and the aggregate results in stress concentrations when external loads are applied to the
composite. Since the interface between the cement paste and the aggregate is the weakest link, the
mechanical behaviour of the concrete is significantly affected by the properties here. Building on
this, the research of Tasdemir et al.168 focussed on high strength concrete with the inclusion of silica
fume and superplasticizers. The objective was to better understand the influence of the partial
replacement of cement with silica fume in the interfacial zone. In their study, SEM scans of normal
concrete, along with Energy Dispersive X-ray analyser (EDX) observations showed a profusion of
calcium hydroxide at the interface. Additional to this, monosulphate platelet crystals were also
found in this region. The calcium silicate hydrate was much less dense. The paste phase was porous,
with calcium hydroxide platelets found filling the voids. The same analysis of high performance
concrete showed the interfacial zone to be composed of dense calcium silicate hydrate. Where air

112
voids were found, they contained no deposits of calcium hydroxide crystals or other crystals. The
paste itself was dense, i.e. similar to that of the interfacial zone.
The interplanar compressive strength that is seen with normal concrete is very low, and under
uniaxial compression, fracture occurs in this weak interfacial zone. With high performance concrete
however, there is a strong bond between the aggregate and the cement paste at the interface, and
behaviour as a composite is observed.
The difference between the interfacial microstructure can be attributed to the pozzolanic reaction of
the silica fume which consumes the calcium hydroxide that is normally to be found in this area,
replacing it with dense calcium silicate hydrate. The filler effect is just as important as the pozzolanic,
and high performance concretes with both silica fume and superplasticizer are found to be stronger
and more dense than normal concrete168.
High performance concretes have the same base ingredients as regular concrete, but further to silica
fume addition, fly ash is sometimes used. The aggregate has a smaller maximum size than that seen
with regular concrete. With a smaller maximum size, the differential stresses at the interface
between the aggregate and the cement are smaller. Also, smaller aggregate particles are stronger
than larger ones, as comminution removes the largest flaws. Low water volumes in the cement mix
yield a stronger, more durable mass, although larger volumes of water result in better flow qualities.
With the hydration of cement, a great deal of heat is generated. And though the inclusion of fly ash
is often for economical reasons, these materials also hydrate later than the cement. Consequently
the development of the heat of hydration is slower, and the very early temperature rise of the
concrete is therefore lower. A small reduction in the maximum temperature is an important
consideration, as the temperature rise at the centre of a typically large section of concrete can be
quite large, sometimes up to 50 °C. It is not the maximum temperature as such, but the temperature
gradient between the centre and the more moderate temperature of the surface that is the issue. If

113
the temperature gradient is steep, then thermal cracking due to differential cooling is a further
complication170.
The addition of silica fume has numerous benefits further to those discussed earlier. It is a highly
pozzolanic material and it is a very fine powder, with particles significantly smaller than those of
cement (of the order 100 times). According to Neville et al.170, these silica fume particles pack
against the aggregate surface and between the cement particles, improving packing greatly. This
reduces the size and volume of the voids near the aggregate surface, and the interfacial zone has
improved properties with regards to crack development. The bond between the aggregate and the
paste is improved, resulting in better stress transfer in the aggregate.
It has been long known in the study of cement that the water / cement ratio is a controlling factor in
concrete strength. The relative volume of space that the water originally occupies determines the
volume fraction of solids in the hardened concrete, resulting in a higher compressive strength. Low
water / cement ratio necessitates the use of a superplasticizer, which must be specific and
compatible with the cement form. Superplasticizers are long heavy molecules that wrap around
cement particles giving a high negative charge. The resulting repulsion between these particles leads
to deflocculation and dispersion of the cement particles. The superplasticizers interact with the
tricalcium aluminate (C3A) in the cement, but the fundamental structure of the hydrated cement
paste is not affected.
Shrinkage of concrete can occur whilst still in the plastic state, the magnitude of shrinkage being
affected by the amount of water lost from the exposed surface. If this exceeds the amount brought
to the surface through the pore network, then plastic shrinkage occurs. With high performance
concrete, as there is a very low water content, the capillary pores that develop are very small. A
result of this is that there is a significantly lower outward flow from the central regions, which
consequently leads to plastic shrinkage. There is also drying shrinkage of hardened concrete, which
is caused by loss of water by evaporation to the outside of the concrete. In high performance
114
concrete, as the pores are so small, this is minimal. There is also autogeneous shrinkage, which is
due to the continuing hydration of cement, not just near the surface. It is encouraged by the low
water / cement ratios seen with high performance concrete. A consequence of this type of shrinkage
is the development of internal microcracks.

115
2.2.4 Soil
There are three relationships commonly used in understanding the behaviour of soil. They are
Darcy’s Law, Terzaghi’s effective stress principle and Fick’s Law. Darcy’s Law governs flow rate
through the soil, Terzaghi helps understand the load distribution between phases, and diffusion of
contaminants through soil is governed by Fick’s Law, which describes the diffusive nature of a
constituent, such as a nutrient or a contaminant in single phase flow171.
With low velocity fluid flowing through a non-swelling granular medium, these relationships are
applicable. Physico-chemical forces in swelling colloids are not taken into consideration, and swelling
clay particles are treated as a special case in that they consist of clusters of platelets with water in
the adsorbed state. They swell and shrink under conditions of imbibition and desiccation. It is due to
the shapes of these platelets and their large specific area that the effects of these forces are
magnified, hence their differing behaviour to other soils. The forces in question are van der Waal’s
attraction, electrostatic repulsion, and surface hydration forces, which are short range bonding
forces between mineral surfaces and water. These forces perturb the water that is in close proximity
to the platelets, meaning that in this region the behaviour is different to the bulk171. With regards to
load distribution, Terzaghi’s concept of an effective stress provides a satisfactory understanding of
the strength and deformation of saturated soils. It is defined as the difference between total applied
pressure and pore pressure172.
Effective stress has been an important tool in the development of soil mechanics, however the
forces at the surfaces of clay particles influence their behaviour and aggregation behaviour, and this
is generally not accounted for. Bolt173 took into consideration the long range forces between clay
particles when explaining the compressibility of clay. He concluded that the compressibility was
essentially a function of the double layer repulsive forces, dependent on the type of clay used.
Sridharan et al.172 recognised two distinct mechanisms controlling volume change behaviour of clays,
the first wherein the volume change is governed by shearing resistance at an interparticle level, and

116
the second which is primarily governed by double layer repulsive forces. It is because swelling clays
are so pervasive that the understanding of swelling soils affects all disciplines concerning naturally
occurring soils171.
With clays, these systems swell and shrink continuously in relation to saturation changes. This
swelling upon wetting, followed by isotropic shrinkage174 results in the opening and closing of cracks,
and the soil surface retaining its original position. This has important consequences, such as the
rapid transport of water through cracks, leaching of solutes to the subsoil and nutrient deficiency175.
Shrinkage characteristics define the relation between soil volume and water content, and one
frequently used form is the relation between moisture ratio and void ratio where;
62
63
The general form of a shrinkage characteristic curve is shown in Figure 45, and as can be seen is the
same as that later adopted by Wiedemann and Stahl152.
Figure 45: Variation of CIF with time for 3 soils during the compaction-drying and wet dry cycles (Reference 176)

117
In the ‘Normal shrinkage’ region, the volume decrease of the clay aggregates is due to water loss,
however full saturation remains. During ‘Residual shrinkage’ there is a further decrease in volume,
air enters the pores and saturation decreases. With ‘Zero shrinkage’, the particles have achieved
their densest configuration and the volume stays constant176.
Yesiller et al.177 found that the fines content of the soils increased the likelihood of cracking. When
there is a loss of water to the atmosphere, desiccation cracks form. The drying causes shrinkage and
subsequently cracking, and soils with high fines content are particularly affected by this. The extent
and rate of this are partly dependent on negative pore water pressures that develop as the process
progresses. Cycles of wetting and drying also affect cracking behaviour.
Capillary forces develop with moisture loss, causing the soil to shrink, and suction develops in the
soil, increasing the intergranular stresses in the soil177. The progression of cracking develops as the
suction increases, and with soils containing fines, the development of cracks is more prevalent due
to the presence of small pores, which lead to high suctions. They also found that the presence of clay
materials promoted formation of cracks.
Yesiller, looking at wetting and drying cycles - specifically a compaction dry cycle followed by either a
single wet-dry cycle or three wet-dry cycles - found that in the drying of a clay soil, shrinkage occurs
causing irreversible changes in the fabric of the soil structure. Yong et al.178 put it that particle bonds
may be broken, weakening the soil. Following subsequent wetting, the rearranged structure will be
further weakened. When drying resumes, shrinkage will occur and cracking will likely follow. For the
three soils that Yesiller investigated, high suctions and fast increases in suction were found for soils
with high fines contents. They also observed that the wetting period that follows the compaction-
drying periods experienced higher suctions. During the compaction-drying cycle, the shrinkage
results in a decreased pore volume, and this leads to increased suction in the subsequent wetting-
drying cycle. The crack intensity factor (CIF) was used to quantify the degree of cracking in soils, and
is based on surface dimensions. The fines fractions for the three soils tested were: Soil 1 (75%), soil 2

118
(81%) & soil 3 (32%). As can be seen in Figure 46, during the compaction-drying phase, soils 1 & 2
cracked, however soil 3 (which had a significantly lower fraction of fines) did not crack at all. During
the subsequent wet-dry cycle, the CIF for soils was significantly higher.
Figure 46: Variation of CIF with time for 3 soils during the compaction-drying and wet dry cycles (Reference 177)
The higher suction pressure and CIF values seen for the wet-drying phases were similar for the
second and third phases. When compaction-drying starts, the soil strength is close to its maximum,
there is a strong resistance to cracking, and the soil can resist the large tensile stresses that result
from the high values of suction pressure. Upon wetting, there is a decrease in soil strength, and the
drying that follows induces negative pore pressures, the stresses from which exceed the resistance
of the further weakened soil. They concluded that the extent of cracking is dependent on the suction
attained during the drying process, which is a function of the fine particulate content of the soil.

119
2.3 Summary and focus of this research
As illustrated in the preceding sub-chapters, cracking is a phenomenon encountered in many fields,
and these findings are relatable to pharmaceutical filtration. With colloidal films, many of the
dispersions cast on substrates are of the same materials often encountered in filtration experiments,
in particular calcium carbonate as used by Wedin et al.161,162. However, with colloidal films the
mechanism of solvent removal and eventual ingress into the particle network is through
evaporation, whereas with filtration a pressure differential forces the solvent through the porous
body. With all other contexts considered in addition to colloidal films (e.g. carbon xerogel monoliths,
concretes, soils, etc.), a persistent thread in all of these studies is that of Darcian replenishment. This
is where the saturated centre of the body acts as a reservoir, and as evaporation of the outer edges
proceeds, the rate of liquid transport to the surface is determined by Darcy’s law.
From the studies into filter cake cracking conducted so far, there exists some interesting literature to
build on. Although materials used, size distributions, filtration equipment, parameter sets and
process conditions are not directly comparable, replication of trends can be seen, such as those of
Wiedemann and Stahl’s152 avoidance of filter cake cracking through an increased pressure
application. And with the experiments of Anlauf et al.150, whilst aspect ratios were studied (theirs
being << 1), due to the setup and configuration of the experimental rig used for the research of this
thesis, larger aspect ratios were used (often > 1). Due to the disparities mentioned, the issue of
overlapping of work with other researchers is moot. When similar results were found, such as with
filtration pressure, it served to validate the theories specific to the parameter sets and experimental
ranges used in this research. When dissimilar trends were found, such as the experiments of Anlauf
et al.150 with aspect ratios, it served as a jumping off point towards other theories and mechanisms.
Furthermore, with all previous studies, outcomes were recorded with simply ‘crack’ or ‘no crack’ i.e.
likelihood of cracking only was recorded. With this study, additional to likelihood of cracking, the
degree of cracking was also recorded. This is defined by the permeability ratio, which is the

120
comparison of gas permeability after air breakthrough at the filter medium (when equilibrium
saturation is reached) and liquid permeability immediately prior to air breakthrough. Additional to
this, residual moisture content was also recorded to indicate the degree of deliquoring. With these
two key output parameters, it is possible to determine the degree of structural collapse of the pore
network and to analyse trends across select parameter sets in order to understand the reasons
behind filter cake cracking during the deliquoring phase of the filtration process.
The main objective of this research project is to present the results of a parametric study in order to
understand the occurrence of filter cake cracking in the context of pharmaceutical production, whilst
being firmly rooted in fundamental theory. It is to gain an understanding of the mechanisms that
initiate crack formation, and also to determine the true stochastic nature of this industrial problem.

121
3 Experimental methodology
3.1 Filtration process set-up
The study was performed at a laboratory scale using an Alconbury Weston Nutsche filtration rig
which can be seen in Figure 47a. The rig was made from 316L stainless steel with a glass reservoir for
visual monitoring of the formation and propagation of cracks. The filtration area was 0.002 m2, with
a working volume of 700 ml. The design pressure was -1 to 3.0 bar, and the filter was able to
withstand temperatures up to 150 oC. The rig stood above a Denver Instrument TP1502 electronic
balance with an RS232 connection that output to a PC, which recorded mass of filtrate every 2
seconds. The filtrate mass could be plotted for filtration rate curves and liquid permeability
calculations, as well as t/V vs. V plots. Nitrogen gas pressure differential was used as the filtration
driving force, and Influx flowmeters (0-0.75, 1-13 & 2-26 L/min) recorded the gas flowrate during
deliquoring and cracking so that gas permeability of the cake could be calculated. Poremet
(Switzerland) filter plates were used, with a nominal pore size of 10 µm. These filter plates were 5
layered and made from 316L stainless steel wire with a uniform distribution across the plate.

122
a) b)
Figure 47: a) Laboratory scale Nutsche filter used for the experimental study; b) schematic diagram of the experimental setup (1 –
filtration rig, 2 – balance, 3 – PC, 4 – nitrogen cylinder, 5 – pressure regulator, 6 – flowmeter)
3.2 Materials used
3.2.1 Calcium carbonate
Although this study is motivated by the filtration of pharmaceutical solids, the model system chosen
for these experiments was a suspension of high purity calcium carbonate (CaCO3) - batch codes
Superlon L15 & L200. It is a fine, off-white calcium carbonate powder produced from high purity
carboniferous limestone. Calcium carbonate is a commonly used material in the study of cake
filtration. It was used in the pioneering work of Ruth179, Grace10 and Tiller12, and high purity calcium
carbonate supplied by Longcliffe Quarries was used extensively in this research. Calcium carbonate
has a low surface charge density at room temperature, ξ ≈ -10 mV (25 oC). Its isoelectric point is
located at around pH 7.3180,181. It is nominally insoluble in water, and its solubility decreases as the
temperature is increased182. The mean particle sizes of these solids are shown in Table 4, each with a
relatively wide distribution around these points, as shown in Figure 48. L200 has a wider PSD range,
containing coarser particles. These were determined by light scattering (Mastersizer 2000, Malvern
instruments). The SEM scans in Figure 49 show the particles to be cubic and jagged in shape. In order

123
to investigate the influence of PSD on cake cracking, binary mixtures of L15 and L200 with
systematically increasing mass fraction of L15 at 20% increments were prepared.
a) b)
c) d)
e) f)
Figure 48: PSD analysis a) Longcliffe L15 (Batch 2); b) Longcliffe L200 limestone (Batch 2); c) Longcliffe L15 (Batch 3); d) Longcliffe L200
limestone (Batch 3); e) Longcliffe L15 (Batch 4); f) Longcliffe L200 limestone (Batch 4)
L15 d4,3
(µm)
L200 d4,3
(µm)
Investigated parameters
Batch 2 6.38 27.76 4.2*; 4.3
*
Batch 3 6.12 15.55 4.1; 4.2**
; 4.3**
Batch 4 5.77 12.97 5.1; 5.2; 6.1; 6.2; 6.3
Table 4: Table to show mean particle sizes of batches of Longcliffe calcium carbonate used & experimental studies
* denotes filter cake aspect ratios > 1; ** denotes filter cake aspect ratios < 1

124
a) b)
c) d)
Figure 49: SEM scans of Longcliffe L15 (a and b) and Longcliffe L200 (c and d) calcium carbonate particles used in the study (Batch 3)
3.2.2 Polyethylene Glycol 400 (PEG 400)
PEG 400 is a low molecular weight grade of polyethylene glycol. It was used in this study due to its
very high viscosity. Its viscosity at 25 °C is approximately 120 mPas. It is a clear colourless liquid that
is soluble in water. Its molecular formula is: C2nH4n+2On+1, n = 8.2 to 9.1. The PEG 400 used in this
study was supplied by VWR (VWR BDH Prolabo GPR Rectapur).
3.2.3 Ethanol
Ethanol is a volatile, colourless liquid, also known as ethyl alcohol. It is a 2 carbon alcohol with the
empirical formula C2H6O. It is a versatile solvent, miscible with water and with a surface tension
significantly lower than that of water (22 mN/m and 72 mN/m respectively). Mixtures of the two
components have a lower volume than the sum of the individual components at the given fractions,

125
and its mixing is exothermic. The ethanol used in this study was supplied by VWR (VWR BDH Prolabo
Technisolv ethanol denatured 95%).
3.2.4 Sodium Dodecyl sulphate (SDS)
Sodium dodecyl sulphate is an anionic surfactant with the formula CH3(CH2)11OSO3Na. It is a 12
carbon tail attached to a sulphate group. It has a molecular weight of 288.37 g/mol. It is a white
solid. The SDS used in this study was supplied by Fisher Scientific.
Figure 50: Molecular diagrams of SDS surfactant (Reference 109)
3.2.5 Cetyltrimethylammonium bromide (CTAB)
Cetyltrimethylammonium bromide is a cationic surfactant with the formula CH3(CH2)15N(CH3)3Br. It is
also known as hexadecyltrimethylammonium bromide. It has a molecular weight of 364.45 g/mol.
The CTAB used in this study was manufactured by Aldrich Chemicals and supplied by Fisher
Scientific.
Figure 51: Molecular diagrams of CTAB surfactant (Reference 109)

126
3.2.6 Tween 80
Polysorbate 80 (Polyoxyethylene sorbitan monooleate), also known as Tween 80 is a non-ionic
surfactant. The hydrophilic groups are polyethers (polyoxyethylene groups). It is a viscous, yellow
liquid that is water soluble. It has a molecular weight of 1,130 g/mol. The Tween used in this study
was manufactured by Sigma Aldrich and supplied by Fisher Scientific.
Figure 52: Molecular diagrams of Tween surfactant (Reference 109)

127
Material Molecular weight
(g/mol)
Surface tension
(mN/m)
Viscosity (mPas)
Water 18.02 71.97 1.00
Ethanol 46.07 21.82183 1.04184
Polyethylene Glycol (PEG) 400 400 43.8185
43.34 ± 0.05 from
tensiometer runs
112-124
122.38 ± 0.06 from viscometer
runs
Sodium Dodecyl Sulphate
(SDS)
288.37 37.29 ± 0.04 at CMC from
tensiometer runs
1.07 ± 0.02 from viscometer
runsa
Cetyl trimethylammonium
bromide
(CTAB)
364.45 39.70 ± 0.13 at CMC from
tensiometer runs
1.06 ± 0.01 from viscometer
runsa
Polysorbate 80
(Polyoxyethylene sorbitan
monooleate) (Tween 80)
1,130 49.80 ± 0.19 at CMC from
tensiometer runs
1.10 ± 0.01 from viscometer
runsa
Table 5: Table of properties of the materials used as part of this study
a - These values were from samples taken above and below the CMC. Viscosity measurements were relatively constant for all
concentrations. Ref Figure 82, Figure 86 and Figure 94
128
3.3 Preparation of materials
3.3.1 Deionised water
With initial experiments, calcium carbonate and deionised water (DI) were the only materials used.
The required mass of L15 and L200 calcium carbonate was weighed on a balance (Fisher Brand PF-
6001) with an accuracy of 0.1 g. The required mass of deionised water was poured into a measuring
cylinder placed on the weighing scale until the required mass was obtained. The calcium carbonate
was dispersed in the appropriate amount of DI at room temperature (25 °C) and gently stirred
periodically to ensure that the slurry was a well mixed homogeneous slurry and the particles
properly wetted. With temperature experiments, a Grant W14 water bath was used (up to 95 °C).
The water bath was set at the required temperature and the prepared slurry was placed in the
reservoir of the water bath in order to achieve the required temperature. Meanwhile, the water was
recirculated through the heat jacket of the filtration rig. Shortly before addition, the slurry was
stirred to a consistent homogeneity.
3.3.2 Polyethylene Glycol 400
With polyethylene glycol, the same method as deionised water was used. The pre-calculated
amounts of PEG 400 and deionised water were weighed and poured into a suitable container and
mixed vigorously. When satisfactory mixing had been achieved, the solution was allowed to cool.
The calcium carbonate was then dispersed in the solution and manually stirred.
3.3.3 Ethanol
When ethanol was used as a solvent, due to similarities in viscosity with deionised water, the volume
of liquid was kept constant. As above, the same method for dispersion in deionised water was used,
however due to the volatility of the solvent used, the slurries were prepared very shortly before the
experiments were carried out. For mixtures of ethanol and deionised water, each concentration was
prepared in bulk as there is a loss in volume when mixing the two components. The solution was

129
then allowed to settle to room temperature due to the exothermic nature of the mixing. The
required amount was then weighed out, and the calcium carbonate added.
3.3.4 Surfactants
Sodium dodecyl sulphate was weighed out on a scale (Sartorius MC1) with an accuracy of 0.00001 g,
and then dissolved in deionised water of the desired solution volume. The solution was agitated in
an ultrasonic bath (Sono Swiss SW6H) to aid dissolution, its duration dependent on amphiphile
addition. Upon visual confirmation of surfactant dissolution, the solution was removed and allowed
to reach room temperature. The calcium carbonate was then dispersed in the prepared solution. As
with SDS, CTAB was prepared with the same procedure. With Tween however, as the surfactant is a
liquid, ultrasonic application was not required.
3.4 Filtration experiments
The preparation of the calcium carbonate suspensions and subsequent filtration was carried out as
follows: (i) calcium carbonate was dispersed in the appropriate amount of deionised water at room
temperature and gently stirred periodically over a minimum 1 hour duration, to ensure that the
slurry was well mixed and the particles properly wetted; (ii) the required volume of the slurry was
poured into the filtration rig; (iii) the filtrate mass was recorded by the electronic balance for the
duration of the filtration experiment and the feed and vessel pressures constantly monitored; (iv)
when deliquoring or cracking occurred, the gas flowrate was measured via the inline flowmeters.
The filtrate flow was used to calculate the average specific resistance of the filter cake and liquid
permeability before breakthrough at the filter medium. The gas flowrate was used to calculate gas
permeability. The number of experiments for each main parameter set varied between 2 and 7 for
statistical analysis, determined by the behaviour of the filter cake and in some cases the number of
samples to be taken for further analysis. Where repeat experiments were executed, averages and
standard deviations were calculated and used in the graphical representations as error bars.

130
3.5 Determination of key output parameters
Characterisation of each filtration process was from the calculation of two key output parameters; i)
Permeability Ratio (PR) and ii) Residual Moisture content (RM). Additional to this, a qualitative visual
assessment was also used to reconcile the event of crack occurrence and the degree of cracking.
Permeability ratio is the ratio of gas permeability at equilibrium saturation and liquid permeability
prior to gas breakthrough at the filter medium. The liquid permeability was calculated from:
64
Bl is the liquid permeability, Vl is the volumetric flowrate of liquid, µl is the liquid viscosity, A is filtration area
Similarly, the gas permeability was calculated from:
65
Bg is the gas permeability, Vg is the volumetric flowrate of gas, µg is the gas viscosity, A is filtration area
Vl is calculated from the mass flow determined from the mass balance and the density of the liquid,
and Vg is the volumetric gas flowrate as recorded by the inline gas flowmeter.
The permeability ratio is then simply defined as:
66
The presence of cracks, even if not immediately visible, manifests itself in a larger than expected gas
permeability of the filter cake during deliquoring. Thus the permeability ratio is a good gauge of the
degree of cracking; unity is expected when deliquoring without cracking occurs. If the cake structure
remains intact and the pores emptied, then the permeability should remain constant. The
permeability ratio is therefore a measure of the structural change of the filter cake. It is a means of
having a quantitative and objectively measured way of expressing the extent of cracking.

131
Residual moisture content is another key output parameter. It is a means of determining the extent
of deliquoring. The objective of the filtration process is to bring the moisture content to its lowest
achievable, as the following stage (drying) requires a large thermal energy input. A high moisture
content will require an excessive energy cost. The final residual moisture content can be thought of
as a way of determining the success of the filtration process. Residual moisture content is defined
by:
67
mwater is the mass of water in the cake at the very end of the experiment, mcake is the total mass of the cake
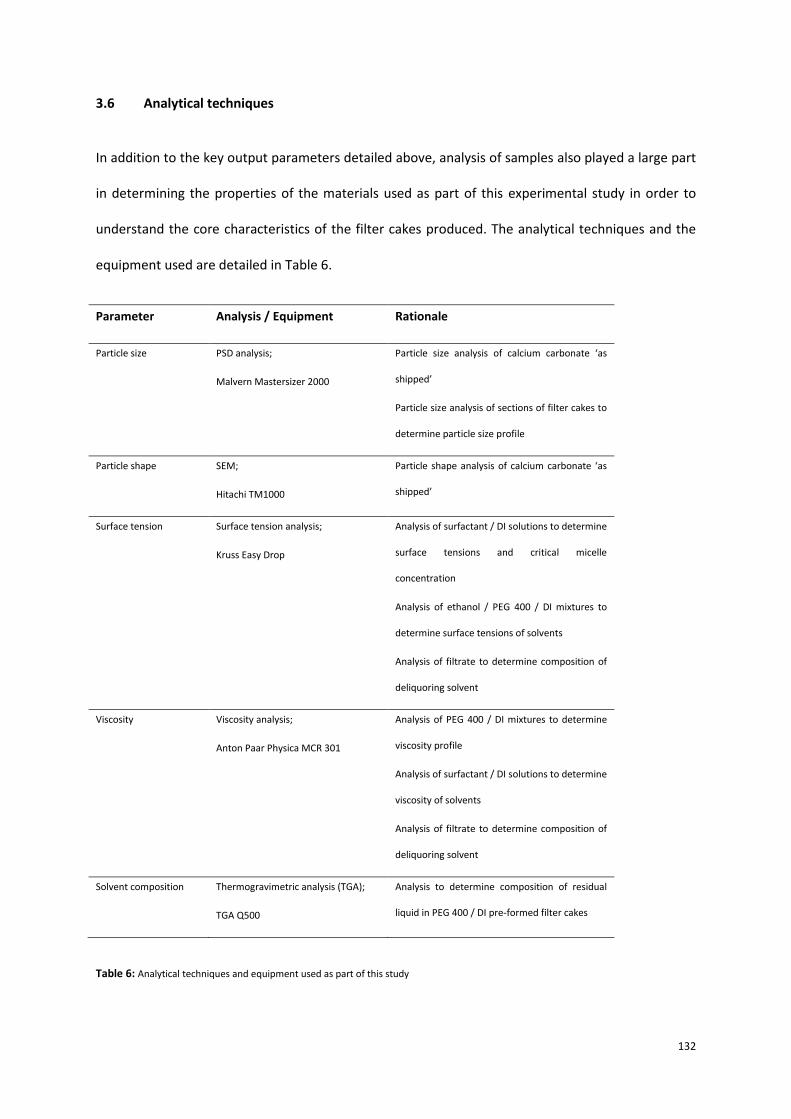
132
3.6 Analytical techniques
In addition to the key output parameters detailed above, analysis of samples also played a large part
in determining the properties of the materials used as part of this experimental study in order to
understand the core characteristics of the filter cakes produced. The analytical techniques and the
equipment used are detailed in Table 6.
Parameter Analysis / Equipment Rationale
Particle size PSD analysis;
Malvern Mastersizer 2000
Particle size analysis of calcium carbonate ‘as
shipped’
Particle size analysis of sections of filter cakes to
determine particle size profile
Particle shape SEM;
Hitachi TM1000
Particle shape analysis of calcium carbonate ‘as
shipped’
Surface tension Surface tension analysis;
Kruss Easy Drop
Analysis of surfactant / DI solutions to determine
surface tensions and critical micelle
concentration
Analysis of ethanol / PEG 400 / DI mixtures to
determine surface tensions of solvents
Analysis of filtrate to determine composition of
deliquoring solvent
Viscosity Viscosity analysis;
Anton Paar Physica MCR 301
Analysis of PEG 400 / DI mixtures to determine
viscosity profile
Analysis of surfactant / DI solutions to determine
viscosity of solvents
Analysis of filtrate to determine composition of
deliquoring solvent
Solvent composition Thermogravimetric analysis (TGA);
TGA Q500
Analysis to determine composition of residual
liquid in PEG 400 / DI pre-formed filter cakes
Table 6: Analytical techniques and equipment used as part of this study

133
3.6.1 PSD analysis
The procedure for PSD analysis was performed using a Malvern Mastersizer 2000. PSD analysis is a
procedure that uses laser diffraction, whereby a laser beam is passed through a dispersed sample of
particles. The intensity of light scattered is measured by a series of detectors, and the size of the
particles that created the scattering patterns can be determined. Samples of calcium carbonate
(either from specific locations in a filter cake or raw ‘as shipped’ material) were dispensed in
deionised water and stirred until a homogenous slurry was achieved. Following flushing of the
Mastersizer, an alignment was performed, followed by a background measurement scan. When the
system was ready, the dispersion was stirred and then a representative sample was added to the
reservoir using a pipette. A 3 cycle measurement was performed for each sample.
3.6.2 SEM analysis
The procedure for SEM analysis was performed using an Hitachi TM1000. Due to the size of the
particles used in this study (from sub-micron to over 150 µm) an imaging platform with high
magnification was required. With SEM magnification (up to 10,000 x), sample surface morphology of
high resolution was attained. Small samples were placed in the chamber, target field view was
selected, focus and brightness were adjusted, and morphological images were taken.
3.6.3 Surface tension analysis
The surface tension measurements were made using a Kruss Easy Drop tensiometer. This equipment
is used for measurement of surface tension of liquids or measurement of the contact angle between
a liquid and a solid. For this research, it is the former that is of most interest, and the pendant drop
technique was used. The drop is illuminated on one side and its image is captured by a camera which
outputs via an RS232 connection to a computer with DSA1 software which analyses the image and
calculates surface tension. A manual single dosing system was used comprising a syringe support
holding an inverted syringe containing the solvent under analysis. Once the needle is positioned at

134
the top of the image, a drop as large as possible is produced at the tip of the needle. The
illumination is corrected, and the zoom and focus are manually adjusted. The recording and
evaluation of the image then follow.
3.6.4 Viscosity analysis
Viscosity measurements were made using an Anton Paar Physica MCR 301 rheometer. The working
principle of such a rheometer is that the torque required to rotate an object in a fluid is a function of
the fluid’s viscosity. The measurements were made at 25 °C utilising a Huber Minichiller
thermostatic bath. The procedure involves 12 ml of solution (test sample or filtrate) which is poured
into the reservoir. The Rheoplus software is started, the temperature is set and the normal force is
reset. The analysis then proceeds. Following completion of a run, viscosity charts and data tables are
produced.
3.6.5 Thermogravimetric analysis (TGA)
Thermogravimetric analysis is a technique that is used for material characterisation. It is a method of
analysis in which changes in the mass of a sample as a function of increasing temperature (or as a
function of time at constant temperature) can give information about its physical and chemical
properties. Selected characteristics of materials that exhibit mass loss due to loss of volatiles or
decomposition can be determined. Its performance is rooted in a heavy reliance on high precision
measurements of mass change, temperature and temperature change. For the experiments in this
thesis where TGA analysis was required, substance mass as a function of temperature was
monitored. The filter cake sample was subjected to a controlled temperature procedure, where
upon the application of heat, the changes in mass were determined. The sample environment was
controlled by issuance of a purge gas. As the difference in boiling point between water (100 oC) and
polyethylene glycol 400 (≈220 oC) is very large, composition of liquid bridges can be ascertained. For
each experiment, two samples were taken from the filter cakes; one from the top (below the
135
surface) and one from the bottom. Only one sample was analysed at a time, with the portion of the
filter cake dissected and the sample removed immediately prior to analysis. The pan was first tared,
and the sample was then taken from the filter cake and placed on the pan. The pre-configured
method file was then executed. With all of these analyses, the temperature was ramped up to 120
oC, and then kept at a constant temperature for a set period. It was then ramped up again to 240 oC,
and then kept constant for another set duration. The temperature was then brought down to
ambient. The temperatures chosen were based on the boiling points of water and PEG 400, and also
the decomposition temperature of calcium carbonate (above 840 oC). The time periods were
changed depending on the initial PEG 400 content used in the dispersion for filter cake formation.

136
4 Results: Macroscopic level
4.1 Effects of settling time, concentration and mass fraction of fines on filter cake cracking
The three parameters that were investigated first were particle size distribution, slurry
concentration and settling time. Particle size distribution is one of the most frequently varying
parameters when switching from one product to another, and settling time and concentration are
parameters that affect the packing structure during the build up of a filter cake, and can be
controlled with relative ease. Due to batch scheduling constraints in industrial filtration, the slurry is
sometimes charged into the filter and left standing for some time before the actual filtration is
started. Hence, the duration of the settling period was one of the investigated parameters. The
effects of initial slurry concentration were investigated with slurries of 100 ml and 600 ml deionised
water containing 100 g of solids in each case. Runs were initially executed with zero settling time and
with overnight (full) settling.

137
a)
b)
Figure 53: a) Permeability ratio and b) Residual moisture for 100 g filter cakes / 600 ml DI / zero and full settling / 2.5 bar applied
pressure. ∆ denotes that deliquoring without cracking occurred. denotes that the event of filter cake cracking occurred
Figure 53 shows the effect of filter cake cracking with increasing mass fraction of fine particles in a
dilute system (14.28% solids wt) with zero and overnight settling. The results show that increasing
the proportion of fine particles in the slurry increases the likelihood of cracking, as does allowing full
settling. It also reveals that the permeability ratio is a good indication of cracking, as those cases that
deliquored only (i.e. no cracking, indicated by triangles in the graphs) reveal a consistently low value
of permeability ratio close to 1, whereas the cases that cracked have a permeability ratio of at least
5. However, it is interesting to note in Figure 53b that although there was a clear difference between
the cracked and deliquored cases in terms of the permeability ratio, the residual moisture content
does not actually show any statistically significant difference.
0
5
10
15
20
25
30
35
40
45
0 20 40 60 80 100
Perm
eab
ilit
y r
ati
o [
-]
Mass fraction L15 [%]
Nosettling
Fullsettling
0.2
0.25
0.3
0 20 40 60 80 100
Resid
ual
mo
istu
re [
-]
Mass fraction L15 [%]
Nosettling
Fullsettling

138
In these experiments (dilute slurry, 14.28% solids wt) free settling is approached, and what is seen
with zero settling time is a filter cake that deliquored only (with low mass fractions of L15). In these
cases a separation of the filter cake into two distinct layers was achieved; a thin coarse layer at the
bottom of the filter cake near the medium, and above this a large filter cake made up of mainly
fines. The photographs in Figure 54 show this separation.
a) b)
Figure 54: Photographs showing segregation of the filter cake into two layers (600 ml DI, zero settling)

139
a)
b)
c)
d)
Figure 55: PSD profiles for 20% L15 / 2.5 bar / 600 ml DI / zero settling. a) top of the upper fines layer b) bottom of the upper fines layer
c) top of the lower coarse layer d) bottom of the lower coarse layer
The PSD charts in Figure 55 show the make-up of the layers of a filter cake that segregated into two
parts. As can be seen, for these cakes that separate (zero settling), the lower layer (c,d) is composed
of coarse particles with some fines mixed in. The top and bottom of this coarse layer have very
similar PSD profiles, with the largest particles at the bottom, as expected. The top, more substantial
layer (a,b) is composed of mainly fines, and a notable PSD profile did not develop in this section,
with the composition being similar to that of ‘as shipped’ L15 at the top and the bottom of this layer
(cf. Figure 48).

140
As can be seen in Figure 56, with overnight settling, stratification occurs. With these filter cakes,
there was no segregation into two layers. The coarse particles settle at the bottom of the filter cake,
and the upper part of the filter cake is composed mainly of fine particles, but monolithicity - in this
context defined as the retaining of a non-segregated, singular structure, regardless of status of
cracking - is preserved. All of these filter cakes with overnight settling resulted in cracking.
a)
b)
Figure 56: PSD profiles for 20% L15 / 2.5 bar / 600 ml DI / Overnight settling: a) top of the filter cake b) bottom of the filter cake

141
Similar experiments to those described above, that instead use slurries of high concentration (100 ml
DI, 50% solids wt) are now considered. In all of these cases, there was no segregation into two
layers. As can be seen in Figure 57, an increase in the concentration of the slurry leads to an increase
in the probability and degree of cracking; the cakes cracked even for those parameter combinations
where deliquoring was observed in the diluted case reported above (cf. Figure 53). With these high
concentration slurries, hindered settling takes place, and with the parameter sets investigated, no
distinct separation of the filter cake was seen, and cake cracking resulted in all cases. In such slurries
(100 ml DI), there is a lower particle relaxation time and each particle deposited is locked into
position by other particles before it can roll and fill open crevices. This leads to the formation of a
cake with larger void spaces between the particles and a lower specific resistance.
It should also be noted that with higher concentration dispersions, flocculation is more marked due
to closer particle proximity, which again lends itself to more open filter cakes and the attendant high
filterabilities that come with this. It also introduces the notion of floc breakage being a possible
initiator of crack formation.

142
a)
b)
Figure 57: a) Permeability ratio and b) Residual moisture for 100 g filter cakes / 100 ml DI / zero and full settling / 2.5 bar applied
pressure. ∆ denotes that deliquoring without cracking occurred. denotes that the event of filter cake cracking occurred
The graphs in Figure 53 & Figure 57 also show that as the mass fraction of fine particles in the slurry
is increased, both the degree of cracking (as expressed by the permeability ratio) and the residual
moisture content increase. This is also noted from visual observation, as an increase in number and
size of cracks is seen. The increase in the residual moisture content mirrors the degree of cracking.
With more fines in the filter cake, the resulting smaller pores require higher pressures to remove
liquid from these pores. This, along with higher degrees of cracking associated with increased mass
fraction of fines, leads to higher residual moisture contents.
0
5
10
15
20
25
30
35
40
45
50
0 20 40 60 80 100
Pe
rme
ab
ilit
y r
ati
o [
-]
Mass fraction L15 [%]
No settling
Fullsettling
0.1
0.15
0.2
0.25
0.3
0 20 40 60 80 100
Re
sid
ua
l m
ois
ture
[-]
Mass fraction L15 [%]
Nosettling
Fullsettling

143
When the residual moisture contents of the filter cakes from dilute dispersions (14.28% solids wt)
and concentrated dispersions (50% solids wt) are compared (Figure 53b and Figure 57b respectively),
it can be seen that filter cakes formed from dilute slurries have higher residual moisture contents
than their directly comparable equivalents of higher concentration, even when cracking was
avoided. The decreased particle relaxation times that are encountered with hindered settling and
the resulting formation of filter cakes with large void spaces partly explain this outcome. These large
pores are emptied with relative ease when compared to the smaller pores attendant with more
dilute systems. So, although cracking is avoided with these parameter sets, higher residual moisture
contents are encountered.
Figure 58: t/V vs V graphs for 20% L15 / 100 g filter cakes / 100 ml and 600 ml DI / zero and full settling / 2.5 bar applied pressure
Figure 58 shows the t/V vs V charts for settling and concentration experiments at 20% fines. When
looking at the zero settling experiments with 100 ml DI (which cracked), the classic straight line is
seen. However, with its 600 ml DI equivalent (which did not crack), it is seen that the line is not
straight, but it curves in places. This curved shape is indicative of a filter cake where the coarse
particles have settled out, and the fine particles are essentially being filtered through a bed of coarse
particles (cf. Figure 5). This is in agreement with what was observed with the filter cakes separating
into two layers; coarse and fines.
0
1
2
3
4
5
6
0 100 200 300 400 500 600 700
t/V
(
s/m
3)
V (ml)
600ml - Full settling
600ml - No settling
100ml - Full settling
100ml - No settling

144
With experiments concerning settling and concentration, the cases seen where cracking was avoided
were the systems where segregation into 2 layers occurred. The conditions for achieving this were a
dilute system with a minimised settling time. This separation is a combined result of free settling,
convective transport and a significantly shortened time allowed for particles to settle (when
compared to overnight settling). When the particles in a slurry comprise a significantly wide
distribution, stratification can occur, with the coarser particles forming a bed near the filter medium,
and the finer particles settling on top of this. However, when there is a sharp cut in size fractions, as
seen with the distributions used in this study, segregation can in some cases be distinct, with what is
essentially a number of filter cakes forming on top of each other.

145
One possible explanation for segregation resulting in the avoidance of cake cracking is that of
particle agglomeration. From literature, it is known that calcium carbonate in water has a low zeta
potential at room temperature180,181 (approximately -10 mV), suggesting that agglomeration is likely.
When these agglomerated particles settle, in accordance with Stokes Law the enlarged apparent
particle sizes will result in larger terminal velocities (for conditions approaching free settling), and it
can be expected that agglomerated particles will be present in the lower coarse layers.
This suggests the following theory for the dilute systems seen where the filter cake separates into
two layers: due to agglomeration of fine particles, and their increased apparent size, the larger
particles associated with flocculation will settle quickly and become a part of the coarse layer,
resulting in a separate upper layer of mainly singular fine particles. Following cake formation,
compression and deliquoring, if and when these flocs break, they will be surrounded by coarse
particles, where the breaking of weak bonds will not have a significant impact as they are not part of
a contiguous mass (i.e. flocs in the coarse layer may be less subjected to caging). When contacting
coarse particles only, the breaking of these flocs will be of little consequence to any particle
rearrangement. In the cases where segregation into 2 layers is not achieved (i.e. concentrated
systems or systems with full settling), although a stratification is achieved, the agglomerated particle
clusters will be contacting interconnecting fine particle networks. Here, the breaking of weak flocs
will likely result in a sudden deformation, an intense densification, and the initiation of a crack
network. It can be thought of as a delicately balanced ‘house of cards’ construct, where the breaking
of flocs will result in a collapse of the local particle structure. This strongly suggests that one
important mechanism of filter cake cracking is the breaking of weak flocs and the effect of these
events on the particles in their immediate vicinity. With full settling / concentrated systems, where
segregation does not occur, most cakes crack. It would seem that stratification (i.e. the development
of a PSD profile) is not always sufficient. With hindered settling, as the settling of larger flocs is
retarded, this leads to their retention in the upper portions of the filter cake, and a higher degree of
caging. Complete segregation however ensures the shielding of flocs by large particles, such that if
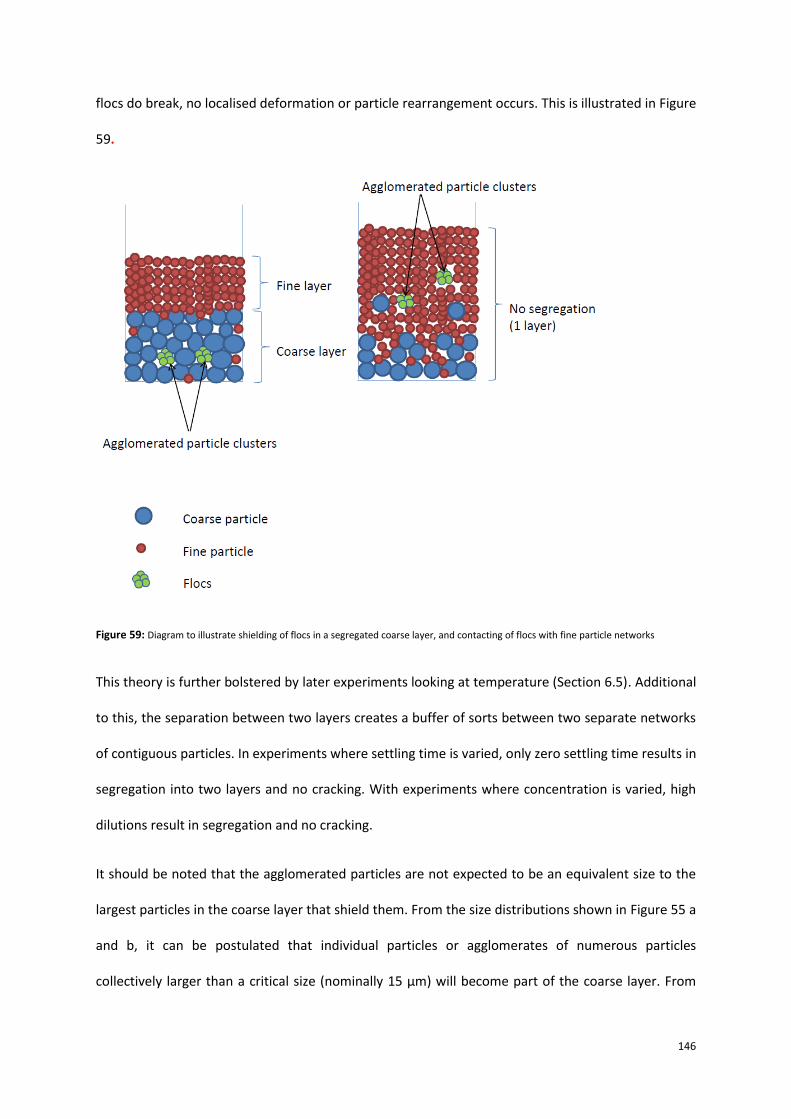
146
flocs do break, no localised deformation or particle rearrangement occurs. This is illustrated in Figure
59.
Figure 59: Diagram to illustrate shielding of flocs in a segregated coarse layer, and contacting of flocs with fine particle networks
This theory is further bolstered by later experiments looking at temperature (Section 6.5). Additional
to this, the separation between two layers creates a buffer of sorts between two separate networks
of contiguous particles. In experiments where settling time is varied, only zero settling time results in
segregation into two layers and no cracking. With experiments where concentration is varied, high
dilutions result in segregation and no cracking.
It should be noted that the agglomerated particles are not expected to be an equivalent size to the
largest particles in the coarse layer that shield them. From the size distributions shown in Figure 55 a
and b, it can be postulated that individual particles or agglomerates of numerous particles
collectively larger than a critical size (nominally 15 µm) will become part of the coarse layer. From

147
this, it should be emphasised that it cannot be assumed that all flocs that are formed will be
segregated and brought to the coarse layer; only those larger than this critical value. Smaller flocs
will reside in the upper fine layer, and the breaking of these will be less significant when considering
the collapse of local particulate structure. The fracturing of large flocs will be more calamitous in this
respect.
The stratification and segregation seen can be explained in terms of sedimentation and hydraulic
transport. When particles are submerged in a solvent, they are subject to a buoyancy force, and in a
flowing fluid there is an additional force comprising skin friction (due to viscous drag) and form drag
(due to pressure distribution). When the flowrates are low, there is no separation of the boundary
layer. As velocity increases, the onset of separation occurs, with the viscous drag component
becoming a decreasing proportion.
Flow is characterised by the Reynolds number:
68
Re is the Reynolds number, u is the velocity of the fluid relative to the particle, d is the sphere diameter,
As Re increases, the viscous drag component becomes proportionally less. The relationship between
drag force and velocity is represented plotting Re and the drag coefficient, CD. In the region Re < 0.2,
known as the Stoke’s law region, the relationship is linear, given by:
69
CD is the drag coefficient, R’ is the resistance per unit projected area of particle
In this region, the force on a spherical particle may be expressed as:
148
70
In the region 0.2 < Re < 500 - 1000, known as the ‘transition zone’, the slope of the curve changes
progressively and CD consists of two components, one from the Stoke’s law contribution and an
additional component, a constant due to non-viscous effects.
( ) 71
In this region, the force on a spherical particle will be:
( ) 72
There are two further regions noted in literature, these being Newtonian drag zone (500-1000 < Re <
ca. 2x10⁵) and a further region (Re > ca. 2x10⁵) where the flow in the boundary layer becomes
turbulent and separation takes place near to the rear of the sphere. These are beyond the scope of
the parameter sets studied, as such high Reynolds numbers will not be encountered.
Focussing on the Stokes law and transitional regimes, terminal velocities can be calculated, using the
condition that resistance force is exactly balanced by the acceleration force i.e.
( ) 73
uo is the terminal falling velocity of a particle, ρs is density of solid, ρl is density of liquid, g is acceleration due to gravity
for Stokes law region.
The assumptions are of free settling conditions, no appreciable retarding effects from the
containment walls, and that the fluid can be considered as a continuous medium. The terminal
velocities were calculated, and using the Richardson Zaki equation (Equation 31) terminal velocities
were also calculated for increasing concentration to take into account hindered settling. The
following charts were plotted.

149
Figure 60: Graph to show changes in terminal velocity for increasing particle size and concentration (% solids wt)
As can be seen for particle sizes in these experimental ranges, for free settling these systems only
exist in the Stokes and early transition region, with a cut off at around 50 µm. For free settling, there
is a large difference between the terminal velocities for small particles and large particles. For very
concentrated systems (50% solids wt), the difference is minimal. However for 14.28% solids wt, the
system is closer to free settling, with significantly higher terminal velocities achieved for coarse
particles.
From the filtration data that yielded the PSD profiles shown in Figure 55, the rate of decrease in
height of suspension was calculated to be approximately 0.00282 m/s, which according to Figure 60
corresponds to an equivalent point between 75 and 100 µm (for 14.28% concentration). This
reconciles with the profiles shown in Figure 55, where the larger particles have completely
segregated from the secondary cake that has formed above the coarse layer.
0
0.005
0.01
0.015
0.02
0.025
0 20 40 60 80 100 120 140 160 180 200
Term
inal
ve
loci
ty U
o (
m/s
)
Particle size (um)
Free settling
14.28%
50%

150
A parallel field of study is that of the stresses and strains that develop during the drying of colloidal
films, which lead to distortion and cracking of the film. It was found experimentally that colloidal
films cast on a solid immovable substrate would crack, however those cast on beds of liquid mercury
did not crack157. The finding that the liquid mercury absorbed some of the stresses generated during
drying such that the film did not crack is somewhat analogous to what was found in the filtration
experiments of this thesis where segregation occurred. It was concluded by Chiu et al.157 that the
existence of such stresses generated during drying requires that the increase in volume fraction
occurs by particles changing their neighbours, thus reducing any misfit strain.
It might be postulated that the foundation created by a coarse layer of particles above the filter
medium means that the subsequent formation and compression of a separate filter cake of mainly
fine particles can avoid cracking, due to the coarse layer absorbing the stresses generated, much like
the bed of liquid mercury. However it is unlikely that this is the actual mechanism for crack
avoidance. This theory was tested by pre-forming a coarse layer (i.e. mainly coarse particles in a
dilute system), partially compacting this layer, and then pausing the experiment to add a second
dispersion (of mainly fine particles with a similar makeup to the upper cake portion of the original
experiments) to the substantial supernatant. These experiments were a means of replicating the
original experiments, however all of the filter cakes cracked (permeability ratio 5.39 ± 0.63). When
viewing the problem of filter cake cracking whilst focussing on the theory of accelerated settling of
agglomerated particle clusters, the notion that the situation is analogous to colloidal films drying on
a substrate that absorbs the capillary stresses generated, is unlikely. Instead it further validates the
theory of agglomerated clusters of particles being shielded by large particles in the coarse layer
when segregation occurs. By pre-forming the coarse layer, the agglomerated particles that are
formed in the second addition of slurry can only reside in the upper portion of the filter cake, hence
the formation of cracks.
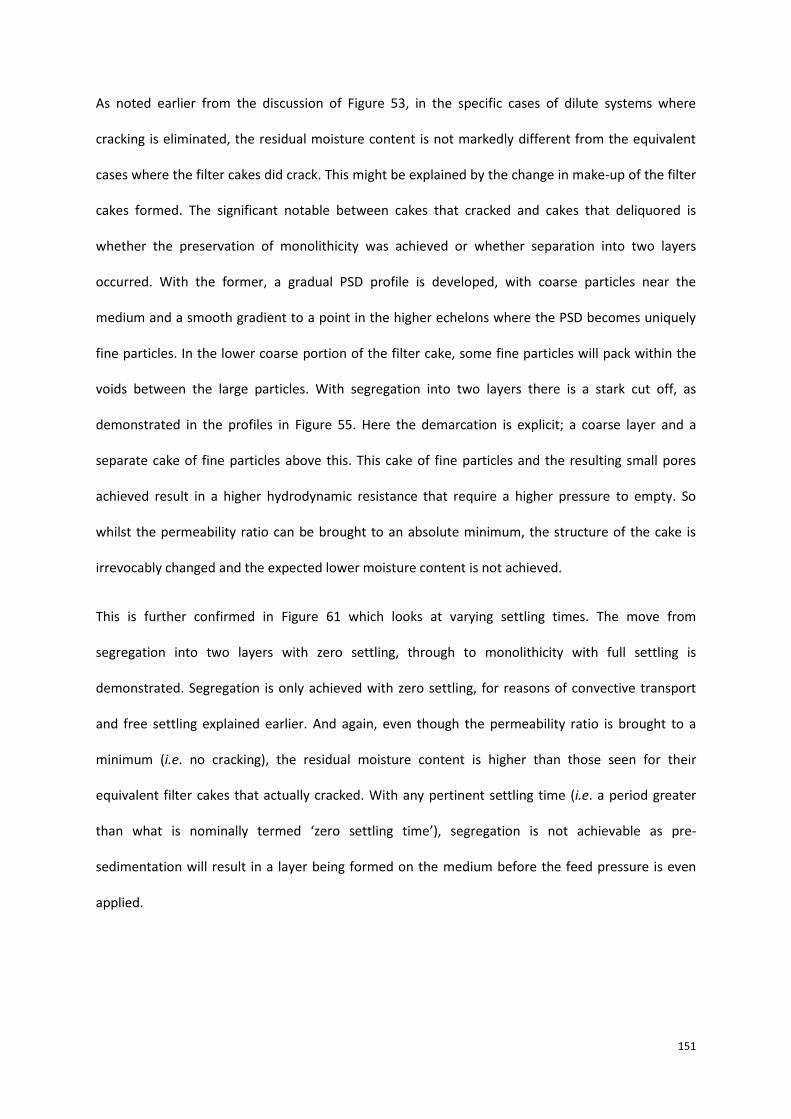
151
As noted earlier from the discussion of Figure 53, in the specific cases of dilute systems where
cracking is eliminated, the residual moisture content is not markedly different from the equivalent
cases where the filter cakes did crack. This might be explained by the change in make-up of the filter
cakes formed. The significant notable between cakes that cracked and cakes that deliquored is
whether the preservation of monolithicity was achieved or whether separation into two layers
occurred. With the former, a gradual PSD profile is developed, with coarse particles near the
medium and a smooth gradient to a point in the higher echelons where the PSD becomes uniquely
fine particles. In the lower coarse portion of the filter cake, some fine particles will pack within the
voids between the large particles. With segregation into two layers there is a stark cut off, as
demonstrated in the profiles in Figure 55. Here the demarcation is explicit; a coarse layer and a
separate cake of fine particles above this. This cake of fine particles and the resulting small pores
achieved result in a higher hydrodynamic resistance that require a higher pressure to empty. So
whilst the permeability ratio can be brought to an absolute minimum, the structure of the cake is
irrevocably changed and the expected lower moisture content is not achieved.
This is further confirmed in Figure 61 which looks at varying settling times. The move from
segregation into two layers with zero settling, through to monolithicity with full settling is
demonstrated. Segregation is only achieved with zero settling, for reasons of convective transport
and free settling explained earlier. And again, even though the permeability ratio is brought to a
minimum (i.e. no cracking), the residual moisture content is higher than those seen for their
equivalent filter cakes that actually cracked. With any pertinent settling time (i.e. a period greater
than what is nominally termed ‘zero settling time’), segregation is not achievable as pre-
sedimentation will result in a layer being formed on the medium before the feed pressure is even
applied.
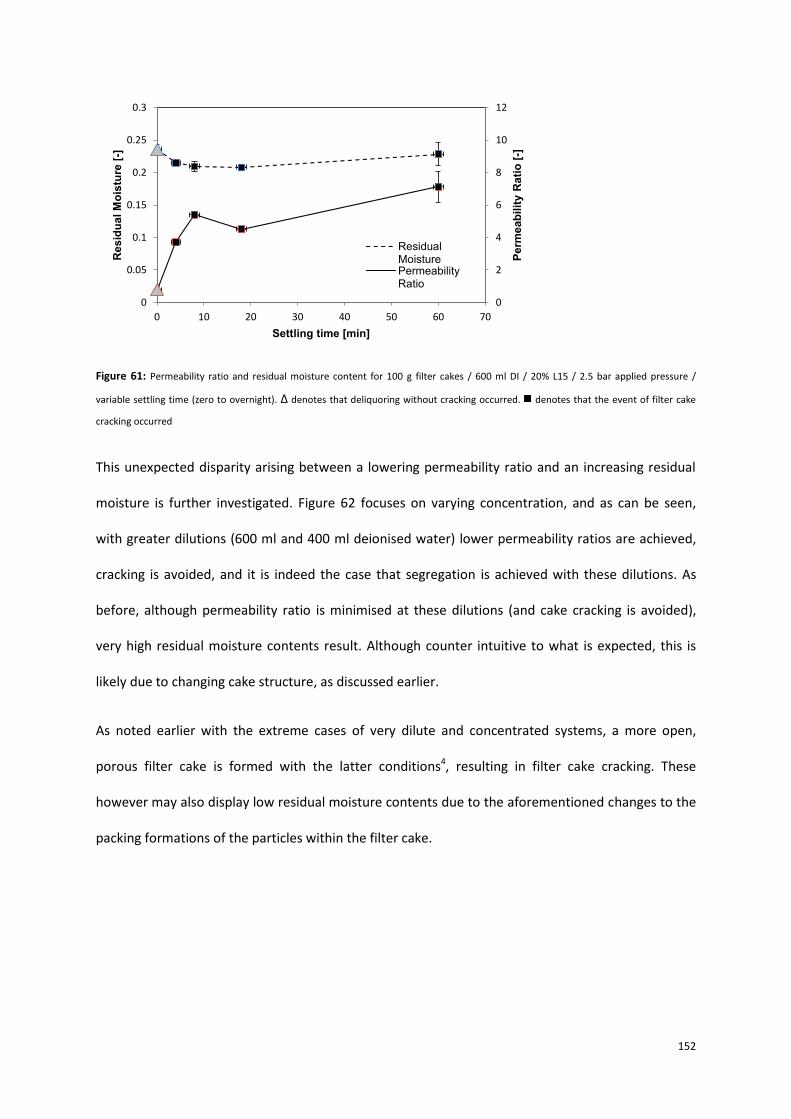
152
Figure 61: Permeability ratio and residual moisture content for 100 g filter cakes / 600 ml DI / 20% L15 / 2.5 bar applied pressure /
variable settling time (zero to overnight). ∆ denotes that deliquoring without cracking occurred. denotes that the event of filter cake
cracking occurred
This unexpected disparity arising between a lowering permeability ratio and an increasing residual
moisture is further investigated. Figure 62 focuses on varying concentration, and as can be seen,
with greater dilutions (600 ml and 400 ml deionised water) lower permeability ratios are achieved,
cracking is avoided, and it is indeed the case that segregation is achieved with these dilutions. As
before, although permeability ratio is minimised at these dilutions (and cake cracking is avoided),
very high residual moisture contents result. Although counter intuitive to what is expected, this is
likely due to changing cake structure, as discussed earlier.
As noted earlier with the extreme cases of very dilute and concentrated systems, a more open,
porous filter cake is formed with the latter conditions4, resulting in filter cake cracking. These
however may also display low residual moisture contents due to the aforementioned changes to the
packing formations of the particles within the filter cake.
0
2
4
6
8
10
12
0
0.05
0.1
0.15
0.2
0.25
0.3
0 10 20 30 40 50 60 70
Pe
rme
ab
ilit
y R
ati
o [
-]
Re
sid
ua
l M
ois
ture
[-]
Settling time [min]
ResidualMoisturePermeabilityRatio

153
Figure 62: Permeability ratio and residual moisture content for 100 g filter cakes / zero settling / 20% L15 / 2.5 bar applied pressure /
variable DI volume (100 ml to 600 ml). ∆ denotes that deliquoring without cracking occurred. denotes that the event of filter cake
cracking occurred
0
5
10
15
20
25
30
0
0.05
0.1
0.15
0.2
0.25
0 100 200 300 400 500 600
Pe
rme
ab
ilit
y R
ati
o [
-]
Re
sid
ua
l M
ois
ture
[-]
Mass DI [ml]
Residual Moisture
Permeability Ratio

154
As discussed earlier on the presence of fine particles in the coarse layer, it is something that is seen
in both the upper and lower sections of this layer, and is in agreement with the theory of fast
settling flocs taking residence in the lower (coarse) layer. However, it cannot be assumed that there
is an homogeneity or an isotropic packing throughout this layer, and it cannot be assumed that this
is the only mechanism for the presence of the primary peaks in Figure 55 c & d. The falling path may
play a role in the local particle structure, and it is defined as the path of fine particles through the
void space of a coarse particle bed186. As the size ratio increases, it is hypothesised that the falling
path is less tortuous, under the condition that the most dominant force is gravity. Additionally, the
falling velocity is higher due to the decrease in friction force and impact likelihood.
Figure 63: Illustration of cubic and hexagonal packing arrangements for different size ratios (Reference 186)
As illustrated in Figure 63, for a cubic packing with an 8:1 size ratio, eleven fine particles can pass
through the void space. However, when a hexagonal arrangement is accomplished, only one particle
can fit through. With smaller size ratios (4:1 & 3:1), a sufficiently large failure zone is not achieved,
and no fine particles can pass through. With decreasing size ratio, the falling path becomes more
affected by resistance forces - friction and impact – leading to shifting directions of the particles by
chance encounters, and the path becomes more tortuous.
Although the particles in the studies that form the body of this thesis are neither cubic nor
hexagonal, the principle remains the same. Following initial compression of the coarse bed, and the
attendant particle rearrangement and movement to a more closed packing, fewer particles can pass

155
through the shrinking void space. A shrinking window for particles to pass through presents itself as
the filtration process progresses. The fine particle current cannot be sustained, and at some point
blockage may occur in lower void entrances.
As seen in Figure 49, the coarse particles are quite jagged, and the frictional forces encountered will
be significant. The possibility of ‘ratholing’ appears, where non-flowing material consolidates
sufficiently around the sides, further narrowing the void space for fine particles to pass through. As
compression and particle rearrangement progress, cohesive arches may then form, where the bulk
of collected particles has enough strength to support itself. Analogous formations are found in bulk
solids handling, in particular hopper flow.
When comparing the mass fraction of fine particles at the bottom of a filter cake that has segregated
into two layers i.e. zero settling (cf. Figure 55 c & d) with that of a filter cake that has retained its
monolithicity i.e. overnight settling (cf. Figure 56 b), an expectation would be that the latter would
have a higher mass fraction of fine particles, when considering the falling path. This however is not
the case, and the profusion of fine particles in the coarse layer of a segregated filter cake suggests
another process which is dominant i.e. the fast settling of flocs due to their enhanced particle size.
Percolation effects also help explain the stark cut off into two distinct layers, whereby the
immediate application of filtration pressure effectively seals off the lower coarse layer, diminishing
the falling path potential. The percolation expected with overnight settling will be limited and
minimised when zero settling conditions are applied, and a buffer zone between the two parts of the
filter cake is created.
A Brownian diffusion force resulting from the bombardment of fluid molecules may also explain the
presence of fine particles in the coarse layer, as Figure 55 shows a profusion of sub-micron particles.
This force is a stochastic entity and it cannot be described deterministically1.
156
4.2 Effect of filter cake height on cake cracking
The next parameter investigated was the filter cake depth. This is an important parameter for scale-
up (e.g. different batch sizes). Initially small filter cakes were investigated, with aspect ratios below
unity.
a)
b)
Figure 64: a) Permeability ratio and b) Residual moisture for 60-100% L15 / 20-100 g filter cakes (constant slurry concentration of 14.3%
solids wt, using 120-600 ml DI) / zero settling / 2.5 bar applied pressure. ∆ denotes that deliquoring without cracking occurred. denotes
that the event of filter cake cracking occurred
As can be seen in the graphs in Figure 64, the relationship between cake mass and cracking is not
linear, and can be quite complex. The general trend is that as the mass of calcium carbonate is
increased, the likelihood and degree of cracking increases. With very small filter cakes (20 g) all mass
fractions studied resulted in deliquoring without cracking. However, there is a dip in permeability
0
5
10
15
20
25
30
35
40
20 30 40 50 60 70 80 90 100
Perm
eab
ilit
y r
ati
o [
-]
Mass of calcium carbonate (g)
60% L15
80% L15
100% L15
0.15
0.17
0.19
0.21
0.23
0.25
0.27
0.29
0.31
20 30 40 50 60 70 80 90 100
Resid
ual
mo
istu
re [
-]
Mass of calcium carbonate (g)
60% L15
80% L15
100% L15

157
ratio at 80 g calcium carbonate. Above and below this (60 g and 100 g) all filter cakes crack. This dip
is encountered for all three mass fractions studied and is fully reproducible. The parameter sets with
60% and 80% of the fine L15 particles deliquored without cracking, whilst the 100% L15 case
cracked. However, even in that case there is a local minimum (dip).
The general trend of increasing likelihood and degree of cracking with increasing cake height might
be explained by the greater losses due to friction. Small filter cakes experience greater homogeneity
due to a smaller contact area for the wall frictional forces to act upon. As the filter cake height
increases, the stress transmission decreases due to losses at the containment walls i.e. potentially
transmitted stresses are lost to the walls, resulting in a lower solids compressive pressure on the
particles that have settled.
The reason for the dip in permeability ratio at 80 g is difficult to elucidate with any degree of
certainty, however it is known that high wall friction leads to stress gradients, and these are
responsible for fluctuations in the internal density distributions within the filter cake104. Due to these
inhomogeneities introduced, the packing structure is affected adversely.
In the manufacturing of pharmaceutical tablets, non-uniformity of density distribution is found, and
the resulting areas of low density are prone to breakage in later processing, as well as exhibiting
increased dissolution rates upon contact with liquid, compared to the more compressed areas187. As
such, compaction of porous materials is an area of great academic interest. Wu et al.188, in their
study of pharmaceutical powder compaction noticed upon the examination of stress distribution
and its evolution that patterns of intense shear bands running from the top edge of the compact,
down towards the central axis (at a point lower in the filter cake) were formed. They proposed that
potential failure regions existed within this band. During the compression stage, the powder
experiences intense densification and an appreciable cohesive strength is achieved. Following this,
decompression takes place, during which the compaction pressure decreases quickly, and some of

158
the elastic strain induced is recovered. It is thought that controlling the rate of this recovery is
important, as failure modes are likely induced by too rapid an elastic recovery.
Finite Element Analysis (FEA) was used in their study to contour map density distributions of
compacts, and these show that density distributions are not uniform, even though the initial state is.
During the compression stage, high densities are found at the top edges, whilst low densities are
found at the bottom edges. It is thought that this non-uniformity is mainly induced by die wall
friction. Frictional conditions have a marked effect on density distribution throughout a compact,
and this friction inhibits movement of powder downwards, meaning that the top edges are highly
compacted and the lower parts near the wall are less compressed. During the decompression stage,
due to the resulting elastic strain recovery, the intensive shear band emerges. Within this band the
shear stress changes from positive to negative i.e. a change in direction of the shear stress. Shear
deformation consequently results in a relatively low strength in this zone.
From their X-ray Tomographic images of compaction of lactose powder, crack development is seen
from the top edges to the bottom centre, and these smaller crack patterns are very similar to the
intense shear bands encountered. These can be seen in Figure 66.
Figure 65: X-ray tomographic image showing the pattern of cracking (left) and shear stress distribution (right) showing a shear band from
the top edge towards a lower point approaching the central axis (Reference 185)

159
Figure 66: X-ray computed tomographic images of ejected tablets and shear stress distribution profile (Reference 188)

160
The X-ray Tomographic scans show cross sectional views at decreasing heights within the compacts,
and as can be seen the crack patterns are radially all-encompassing, running the circular periphery
all the way down to the centre. Photographs of broken compacts can be seen in Figure 67. This
process of a tablet being broken into two parts upon ejection is known as ‘capping’. The top part is
an upside down cone, and the bottom part is a base with a concave dip.
Figure 67: Photographs of broken tablets due to capping (Reference 190)
Wu et al. concluded that the failure patterns coincide, and that the diagonal shear band is
responsible for the occurrence of capping.
Han et al.189, when investigating the specific case of zero wall friction in their simulations found that
during compression and decompression, stress distributions and density distributions were uniform,
and it was only during the ejection phase that large shear stresses appeared due to radial elastic
recovery. Upon the introduction of wall friction, they found non-uniform stress distributions and a
density gradient during the initial stages too. Further studies by Wu et al.190 investigating frictional
effects concluded that the non-uniform density distributions and the same evolution of a shear
stress band were found with different die wall frictions, however high frictions amplify the density
gradients. They also investigated tablet thickness and found the same shear bands running from the
top edge to the mid-centre of the compact, with similar patterns repeated. Shear stress distributions
were also investigated for convex tablets as well as flat faced. Again, intensive shear bands were

161
found, however those determined for different surface curvatures were less oblique than those for
flat faced tablets. Han et al.189 found with curvature that high density regions were found near the
edges of a concave tablet, with low density at the apex. With flat faced tablets, the low density
regions were at the bottom edges, making them prone to edge chipping. Concave tablets were more
resistant to this, but in practical manufacturing they were more susceptible to capping. The failure
mechanisms Wu et al.190 encountered were during the decompression phase, confirming for them
that the shear bands formed during this phase are responsible for capping. They did conclude that
capping may be avoided if the interparticle cohesive strength of a compact is high enough to
withstand these stresses.
The non-uniformity of density gradients and stress distributions introduced and amplified by wall
friction may help to explain the dip in permeability seen in Figure 64. Though wall friction is an area
of great academic interest in the study of dry powder compaction, it is generally a minor concern in
wet filtration. However, as will be demonstrated later in Section 6.2, wall effects can be of great
significance and should not be disregarded. As seen with dry powders, changes in wall friction mean
that the radial displacement will assume a different course, and these conditions will have a
prominent influence on the final density distribution. This introduces a certain arbitrary nature,
which at low aspect ratios results in these dips in permeability. In the case of 100% L15, though
cracking was not eliminated, a dip was still encountered, indicating a change in density distribution
that is not in agreement with the linear trends seen with larger contact areas on containment walls.
It should be noted that with 100% L15 filter cakes, all of which cracked (with the exception of 20 g),
it was found that the filter plate was difficult to remove, as the cake had become firmly bonded to
the medium. This is in stark contrast with other filter cakes described in this thesis.
With all parameter sets, it is noted that the highest permeability ratios are seen with 100% L15 filter
cakes. With the addition of coarse material into the dispersion, a moveability at the filter medium is
introduced. It is postulated that the ability for particles to rearrange at this interface can be a
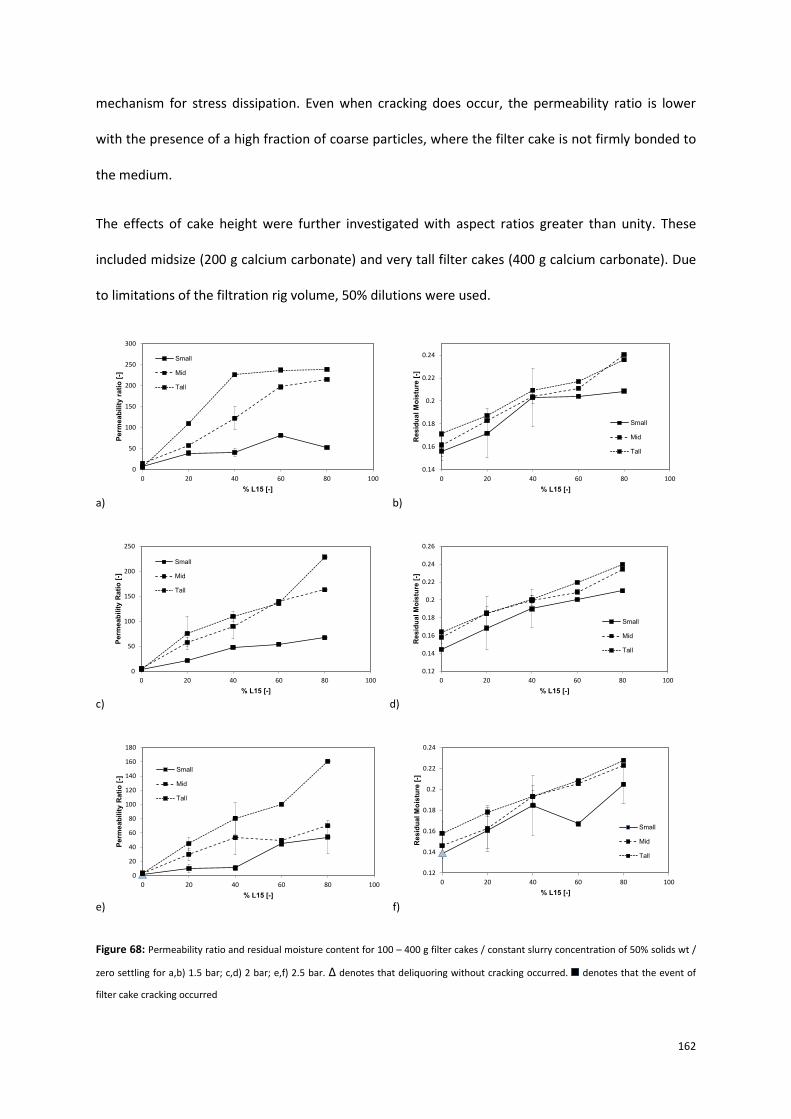
162
mechanism for stress dissipation. Even when cracking does occur, the permeability ratio is lower
with the presence of a high fraction of coarse particles, where the filter cake is not firmly bonded to
the medium.
The effects of cake height were further investigated with aspect ratios greater than unity. These
included midsize (200 g calcium carbonate) and very tall filter cakes (400 g calcium carbonate). Due
to limitations of the filtration rig volume, 50% dilutions were used.
a) b)
c) d)
e) f)
Figure 68: Permeability ratio and residual moisture content for 100 – 400 g filter cakes / constant slurry concentration of 50% solids wt /
zero settling for a,b) 1.5 bar; c,d) 2 bar; e,f) 2.5 bar. ∆ denotes that deliquoring without cracking occurred. denotes that the event of
filter cake cracking occurred
0
50
100
150
200
250
300
0 20 40 60 80 100
Pe
rme
ab
ilit
y r
ati
o [
-]
% L15 [-]
Small
Mid
Tall
0.14
0.16
0.18
0.2
0.22
0.24
0 20 40 60 80 100
Resid
ual
Mo
istu
re [
-]
% L15 [-]
Small
Mid
Tall
0
50
100
150
200
250
0 20 40 60 80 100
Perm
eab
ilit
y R
ati
o [
-]
% L15 [-]
Small
Mid
Tall
0.12
0.14
0.16
0.18
0.2
0.22
0.24
0.26
0 20 40 60 80 100
Resid
ual
Mo
istu
re [
-]
% L15 [-]
Small
Mid
Tall
0
20
40
60
80
100
120
140
160
180
0 20 40 60 80 100
Pe
rme
ab
ilit
y R
ati
o [
-]
% L15 [-]
Small
Mid
Tall
0.12
0.14
0.16
0.18
0.2
0.22
0.24
0 20 40 60 80 100
Resid
ual
Mo
istu
re [
-]
% L15 [-]
Small
Mid
Tall

163
a) b)
c) d)
Figure 69: Permeability ratio and residual moisture content for 100 – 400 g filter cakes / constant slurry concentration of 50% solids wt /
zero settling / 0-40% L15 for a,b) 2 bar; c,d) 2.5 bar. ∆ denotes that deliquoring without cracking occurred. denotes that the event of
filter cake cracking occurred
As can be seen from Figure 68 and Figure 69, as filter cake height increases, likelihood and degree of
cracking also increase, as does the residual moisture content. This further validates what was seen
previously. With these parameter sets, it can be seen that with tall cakes (400 g calcium carbonate)
incredibly large values of permeability ratio can be found, often greater than 200. This data
reconciles with the stark observation of numerous large cracks running down the sides of the filter
cake and across the filter cake surface interfacing the medium, illustrated in Figure 70.
Figure 70: Photographs to show filter cake cracks of tall cakes: 400 g calcium carbonate / 400 ml DI / 1.5 bar / Zero settling
0
20
40
60
80
100
120
140
100 200 300 400 500
Pe
rme
ab
ilit
y R
ati
o [
-]
Mass calcium carbonate [g]
0% L15
20% L15
40% L15
0.12
0.13
0.14
0.15
0.16
0.17
0.18
0.19
0.2
0.21
0.22
100 200 300 400 500
Resid
ual
Mo
istu
re [
-]
Mass calcium carbonate [g]
0% L15
20% L15
40% L15
0
20
40
60
80
100
120
100 200 300 400 500
Pe
rme
ab
ilit
y R
ati
o [
-]
Mass calcium carbonate [g]
0% L15
20% L15
40% L15
0.12
0.14
0.16
0.18
0.2
0.22
100 200 300 400 500
Resid
ual
Mo
istu
re [
-]
Mass calcium carbonate [g]
0% L15
20% L15
40% L15

164
These trends of increasing likelihood of cracking with increasing cake height do not agree fully with
those of Anlauf et al.150 whose results with a circular filtration area found that as the filter cake
height increased, there was a lesser chance of crack formation. They explained this as being due to a
decreasing influence of the filter medium interface. Their aspect ratios however were inverse to
those of this thesis, with very large filtration areas (up to 300 cm2), but very small filter cake heights
(up to 16 mm).
With tall filter cakes, the initiation and propagation of cracking could be observed. The crack tip
could be seen starting near the top surface, moving down the filter cake towards the medium,
coinciding with air breakthrough at the filter medium.
Wall effects result in a reduction in effective pressure across the whole filter cake, but it is
particularly marked near the walls96, possibly leading to a lower compaction and tensile strength
compared to other locations within the filter cake. This may help explain the high frequency of
cracking along the sides of filter cakes. Though not an exclusive mechanism of cracking - many filter
cakes were seen in these studies with cracks along the lower interface with the medium – a large
number of cracks associated with tall cakes were predominantly close to the sides of the filter cake.
As will be seen in the next section, the loss in effective pressure discussed will likely contribute to
filter cake cracking.

165
4.3 Effect of filtration pressure on cake cracking
The final parameter studied as part of this set was filtration pressure, as it is essentially the only
‘free’ operating parameter by which the deliquoring step can be controlled. The effect of applied
pressure was investigated using 80 g filter cakes, i.e. the parameter set in Section 4.2 that showed
the local minimum in permeability ratio.
Figure 71: Permeability ratio and residual moisture for 80% L15 / 80 g filter cakes / 480 ml DI / zero settling / 1.75 – 3 bar. ∆ denotes that
deliquoring without cracking occurred. denotes that the event of filter cake cracking occurred
It can be seen from Figure 71 that as the feed pressure is increased, the degree of cracking
decreases, and the likelihood of cracking is removed. The increasing pressure displaces liquid from
the smaller pores, reducing the residual moisture content towards irreducible saturation.
A possible mechanism for initiation of cracks builds on the theory that lateral compression is a
precursor to filter cake cracking. As shown by Wiedemann et al.152, higher pressures can result in a
reduction of the shrinkage potential, which corresponds to the movability of the particles in the filter
cake. If this capability can be eliminated - by means of increased pressure - then this increase in
pressure pushes the filter cake towards the highest packing density that can be effected by the
capillary forces. However in some cases, it is governed by changes in particle interaction forces.
When the solids compressive pressure is less than a critical value, there exists an equilibrium
distance between the particles making up the filter cake due to the electrostatic repulsive forces78.
0
0.05
0.1
0.15
0.2
0.25
0.3
0.35
0
1
2
3
4
5
6
7
8
9
1.5 2 2.5 3
Re
sid
ua
l M
ois
ture
[-]
Pe
rme
ab
ilit
y R
ati
o [-
]
Pressure (Bar)
Permeability ratio
Residual moisture
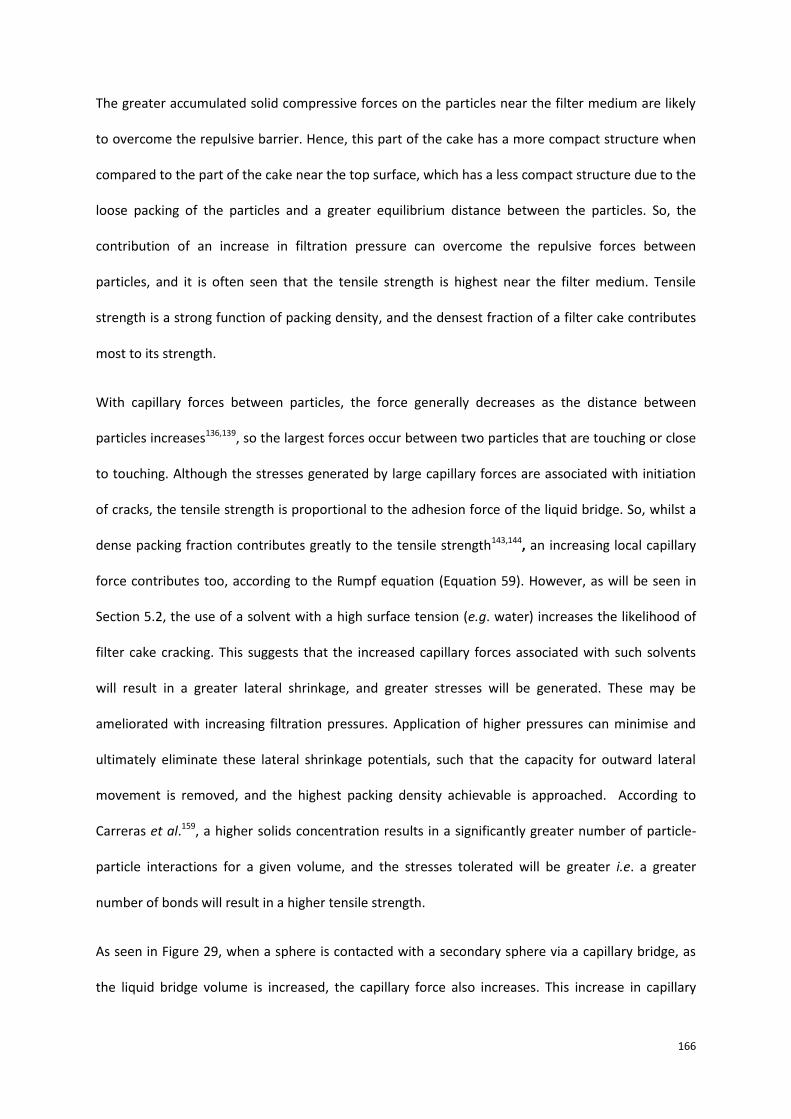
166
The greater accumulated solid compressive forces on the particles near the filter medium are likely
to overcome the repulsive barrier. Hence, this part of the cake has a more compact structure when
compared to the part of the cake near the top surface, which has a less compact structure due to the
loose packing of the particles and a greater equilibrium distance between the particles. So, the
contribution of an increase in filtration pressure can overcome the repulsive forces between
particles, and it is often seen that the tensile strength is highest near the filter medium. Tensile
strength is a strong function of packing density, and the densest fraction of a filter cake contributes
most to its strength.
With capillary forces between particles, the force generally decreases as the distance between
particles increases136,139, so the largest forces occur between two particles that are touching or close
to touching. Although the stresses generated by large capillary forces are associated with initiation
of cracks, the tensile strength is proportional to the adhesion force of the liquid bridge. So, whilst a
dense packing fraction contributes greatly to the tensile strength143,144, an increasing local capillary
force contributes too, according to the Rumpf equation (Equation 59). However, as will be seen in
Section 5.2, the use of a solvent with a high surface tension (e.g. water) increases the likelihood of
filter cake cracking. This suggests that the increased capillary forces associated with such solvents
will result in a greater lateral shrinkage, and greater stresses will be generated. These may be
ameliorated with increasing filtration pressures. Application of higher pressures can minimise and
ultimately eliminate these lateral shrinkage potentials, such that the capacity for outward lateral
movement is removed, and the highest packing density achievable is approached. According to
Carreras et al.159, a higher solids concentration results in a significantly greater number of particle-
particle interactions for a given volume, and the stresses tolerated will be greater i.e. a greater
number of bonds will result in a higher tensile strength.
As seen in Figure 29, when a sphere is contacted with a secondary sphere via a capillary bridge, as
the liquid bridge volume is increased, the capillary force also increases. This increase in capillary

167
force is due to an increase in contact area between the liquid and solid136. As the half filling angle
increases, the liquid bridge volume increases (for a given separation) and so too does the capillary
force, which contributes to a greater tensile strength144. It should be noted that as this angle
increases, the contributions of the surface tension component and the Laplace hydrostatic
component change, altering the total capillary force, and maxima are often seen.
The effect of pressure was further investigated, focussing on increasing pressure and increasing
mass fraction of fines for small filter cakes. As seen in Figure 72, these results further validate the
findings from earlier; as pressure increases, the likelihood and degree of cracking is reduced and in
some cases eliminated. And as the mass fraction of fine particles increases, so does likelihood and
degree of cracking. In both cases this is mirrored by the changes in residual moisture.
One further consideration is that during the stages of cake formation and any attendant monoaxial
compression that takes place, large flocs that form may - at higher pressures where the maximum
packing density is being approached – be broken down to their component particles prior to
capillary entry i.e. a pre-deformation whilst still in the fully saturated state.
This pre-deformation of flocs, the removal of the lateral shrinkage potential, as well as overcoming
repulsive forces to eliminate the equilibrium distance between particles such that a contiguous
network is formed, all help explain how the application of increased filtration pressures may reduce
and ultimately eliminate filter cake cracking. Additional to this, a compensation for frictional losses
to the walls is also achieved.

168
a) b)
c) d)
e) f)
Figure 72: Permeability ratio and residual moisture content for filter cakes / applied pressure 1.5 – 2.5 bar / zero settling / constant slurry
concentration of 50% solids wt for a,b) 100 g calcium carbonate; c,d) 200 g calcium carbonate; e,f) 400 g calcium carbonate. ∆ denotes
that deliquoring without cracking occurred. denotes that the event of filter cake cracking occurred
0
10
20
30
40
50
60
70
80
90
0 20 40 60 80 100
Perm
eab
ilit
y R
ati
o [
-]
% L15 [-]
1.5 Bar
2 Bar
2.5 Bar
0.12
0.14
0.16
0.18
0.2
0.22
0.24
0 20 40 60 80 100
Re
sid
ua
l M
ois
ture
[-]
% L15 [-]
1.5 Bar
2 Bar
2.5 Bar
0
50
100
150
200
250
0 20 40 60 80 100
Pe
rme
ab
ilit
y R
ati
o [
-]
% L15 [-]
1.5 Bar
2 Bar
2.5 Bar
0.1
0.12
0.14
0.16
0.18
0.2
0.22
0.24
0 20 40 60 80 100
Re
sid
ua
l M
ois
ture
[-]
% L15 [-]
1.5 Bar
2 Bar
2.5 Bar
0
50
100
150
200
250
300
0 20 40 60 80 100
Pe
rme
ab
ilit
y R
ati
o [
-]
% L15 [-]
1.5 Bar
2 Bar
2.5 Bar
0.14
0.16
0.18
0.2
0.22
0.24
0 20 40 60 80 100
Re
sid
ua
l M
ois
ture
[-]
% L15 [-]
1.5 Bar
2 Bar
2.5 Bar
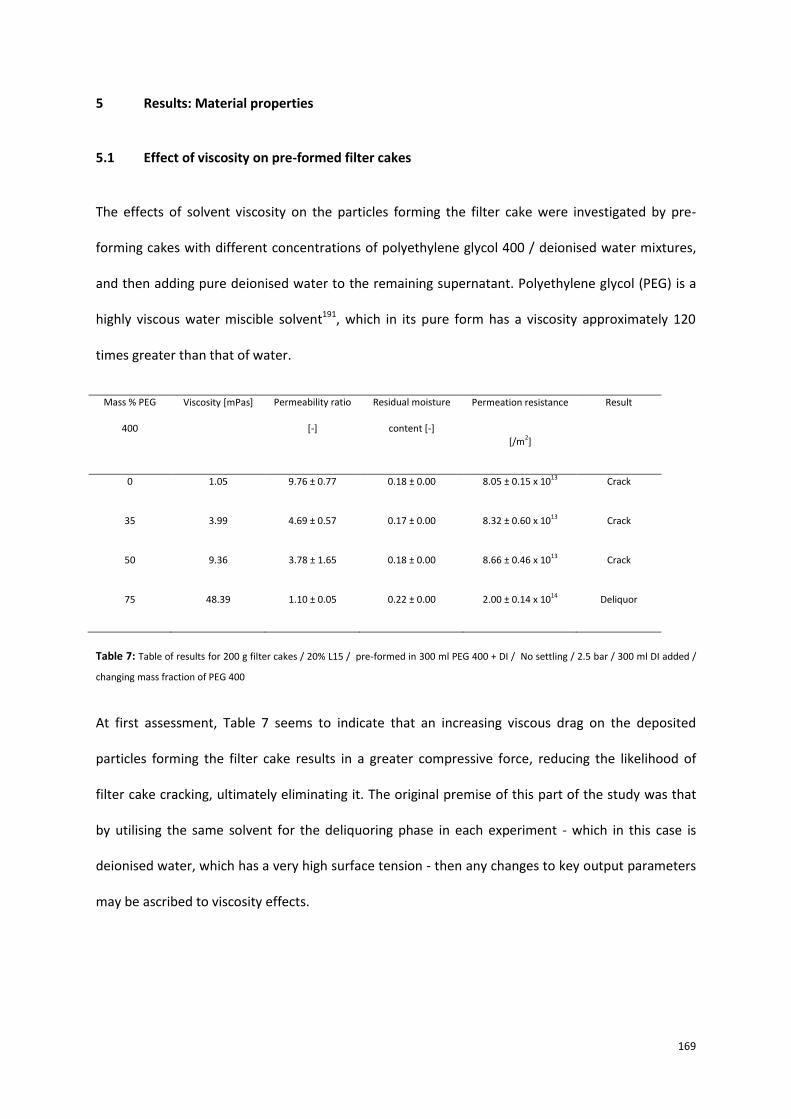
169
5 Results: Material properties
5.1 Effect of viscosity on pre-formed filter cakes
The effects of solvent viscosity on the particles forming the filter cake were investigated by pre-
forming cakes with different concentrations of polyethylene glycol 400 / deionised water mixtures,
and then adding pure deionised water to the remaining supernatant. Polyethylene glycol (PEG) is a
highly viscous water miscible solvent191, which in its pure form has a viscosity approximately 120
times greater than that of water.
Mass % PEG
400
Viscosity [mPas] Permeability ratio
[-]
Residual moisture
content [-]
Permeation resistance
[/m2]
Result
0 1.05 9.76 ± 0.77 0.18 ± 0.00 8.05 ± 0.15 x 10¹³ Crack
35 3.99 4.69 ± 0.57 0.17 ± 0.00 8.32 ± 0.60 x 10¹³ Crack
50 9.36 3.78 ± 1.65 0.18 ± 0.00 8.66 ± 0.46 x 10¹³ Crack
75 48.39 1.10 ± 0.05 0.22 ± 0.00 2.00 ± 0.14 x 10¹⁴ Deliquor
Table 7: Table of results for 200 g filter cakes / 20% L15 / pre-formed in 300 ml PEG 400 + DI / No settling / 2.5 bar / 300 ml DI added /
changing mass fraction of PEG 400
At first assessment, Table 7 seems to indicate that an increasing viscous drag on the deposited
particles forming the filter cake results in a greater compressive force, reducing the likelihood of
filter cake cracking, ultimately eliminating it. The original premise of this part of the study was that
by utilising the same solvent for the deliquoring phase in each experiment - which in this case is
deionised water, which has a very high surface tension - then any changes to key output parameters
may be ascribed to viscosity effects.

170
Figure 73: Permeability ratio and residual moisture content for 200g pre-formed filter cakes / 300ml PEG 400 + DI / Zero settling / 20%
L15 / 2.5 bar / 300 ml DI added / changing mass fraction of PEG 400. ∆ denotes that deliquoring without cracking occurred. denotes that
the event of filter cake cracking occurred
As seen in Figure 73, as the mass fraction of PEG 400 increases, the residual moisture content
increases too, even though cracking is eliminated at 75% PEG 400. One line of investigation is that
this may be due to the large hydrodynamic resistance of the fine pores formed from the very high
viscous drag forces achieved. As the mass fraction of PEG 400 was increased, a reduction in filter
cake height was observed, from 58 mm with pure deionised water to 56 mm with 75% PEG 400.
However, this theory of ultrafine pore formation is unlikely, as a 2 mm reduction will have little
effect on porosity.
Since
74
eav is the average porosity, msolids is the mass of solids, ρs is the solids density, A is filtration area, l is filter cake height
a 3.45% reduction of bulk volume will have a minimal impact. With all of these viscosity runs, filtrate
samples were taken at the end and analysed for viscosity and surface tension, and all results showed
the last remaining samples of filtrate to have values close to those of pure water. However, it cannot
0
2
4
6
8
10
12
0.16
0.17
0.18
0.19
0.20
0.21
0.22
0.23
0 20 40 60 80
Pe
rme
ab
ilit
y r
ati
o [
-]
Resid
ual
mo
istu
re [
-]
Mass of PEG400 in DI [%]
Residual Moisture
Permeability Ratio

171
be assumed that the surplus DI added to the supernatant will fully replace the PEG 400 / DI mixture
that initially pre-formed the filter cake. A phenomenon known as ‘channelling’ that is associated
with filter cake washing possibly occurs.
In cake washing itself, the purpose is to remove the initial solvent, which may be chemically
unacceptable, and replace it with another. The wash solvent is theoretically intended to drive the
initial solvent from the pores of the filter cake in plug flow, with an idealised full displacement taking
place. In the pores that are open to flow, the initial solvent is displaced at first, with a mixture of
both solvents later issued as filtrate. Longitudinal mixing does occur, however the initial solvent that
is held between particles is removed by more time consuming processes, such as mixing and
diffusion, which determine the rate and extent of displacement. Diffusion is an asymptotic process
and is dependent not on the volumes of secondary solvent used, but on time elapsed.
The process of adding DI following cake formation with PEG 400, though done for different reasons,
is similar to that of cake washing described. With lower mass fractions of PEG 400 in DI, where even
the addition of a small amount of PEG 400 results in large increases in viscosity, the passage of the
surplus DI addition is still a slow process and diffusion may be significant. However, with very high
mass fractions of PEG 400 (i.e. 75%) other mechanisms may be dominant, such as the
aforementioned channelling. With this process, if the viscosity of the second solvent is lower, it
tends to flow through the filter cake in streams, between isles of the viscous initial solvent, passing
preferentially through the channels that are formed. These become further enlarged as the process
continues.
172
This means that the additional DI supernatant does not move as a front, fully displacing the initial
PEG 400 / DI, and it is likely that the liquid bridges are still composed of a significant PEG 400
component. As seen in Figure 74, at 75% PEG 400 in DI, the viscosity increases significantly. This
coincides with the sharp increase in residual moisture content observed in Figure 73.
Figure 74: Surface tension and viscosity data for increasing mass fractions of PEG 400 in DI
Following from this, TGA analysis was conducted in order to ascertain which process was
dominating. As the difference in boiling point between water and PEG 400 is quite large (100 °C and
≈ 220 °C respectively), TGA is a useful tool to determine the composition of the residual solvent.
Samples were taken from experiments with 35% & 75% PEG 400 initial composition, and the results
are as follows:
0
20
40
60
80
100
120
140
30
35
40
45
50
55
60
65
70
75
0 20 40 60 80 100
Vis
co
sit
y (
mP
as)
Su
rface t
en
sio
n (
mN
/m)
Mass % PEG 400 in DI
Surface tension
Viscosity

173
a) c)
b) d)
Figure 75: TGA charts to show water and PEG 400 content for a) 35% PEG 400 (top of cake); b) 35% PEG 400 (bottom of cake); c) 75% PEG
400 (top of cake); d) 75% PEG 400 (bottom of cake)
35% PEG 400 filter cake 75% PEG 400 filter cake
Top PEG 400 content % 6.07
Top PEG 400 content % 53.71
Water content % 93.93 Water content % 46.29
Bottom PEG 400 content % 3.29
Bottom PEG 400 content % 6.57
Water content % 96.71 Water content % 93.43
Table 8: Table to show PEG 400 & water content of residual solvent from samples taken from the top and bottom of filter cakes pre-
formed with 35% and 75% PEG 400 solvents (content calculated from data in Figure 75)
For filter cakes pre-formed with 35% PEG 400, as can be seen in Figure 75 and Table 8, the PEG 400
composition of the capillary bridges formed are both quite low, at 6.07% & 3.29% for the top and
bottom of the filter cake respectively. This demonstrates plug flow, longitudinal mixing and a strong
dilution of the original solvent upon surplus addition of DI to the supernatant. However, for 75% PEG
400, capillary bridges formed had high PEG content at the end of permeation with 53.71% and 6.57%
PEG 400 for the top and bottom of the filter cake respectively, suggesting a form of channelling

174
taking place. Due to a particle size profile with coarser particles at the bottom of the filter cake, the
liquid bridges associated with finer particles at the top of the filter cake showed a higher retention of
the PEG 400 component. A 53.71% PEG 400 composition relates to a low surface tension of
approximately 52 mN/m, which will result in a reduced capillary pressure.
The attractive forces that develop between particles due to the liquid bridges formed have been
assumed to be capillary in nature i.e. static, and these forces tend to dominate when liquid exists as
discrete bridges between the particles that comprise the cake. However, these forces can be both
static and dynamic, the latter due to the liquid viscosity as the particles move relative to each other,
and the magnitude of this component is proportional to the separation velocity. These viscous forces
become significant not only with high interparticle velocities, but also with high liquid viscosities192.
In these cases, static analysis alone - which is independent of viscosity - may no longer be applicable,
and the dynamic adhesion forces developed may be many times higher than their static
counterparts due to the viscous dissipation of energy induced by relative particle motion193. Even
with a maximum packing density achieved and minimal interparticle velocities, viscosity effects
significantly affect the mechanical response of a capillary bridge in other ways. The rupture distance
is found to be significantly increased as liquid viscosity increases194. This suggests that during
deliquoring when the capillary forces come into play and shrinkage occurs, it is possible that during
particle rearrangement, capillary bridge rupture may occur. With highly viscous liquid bridges, there
will be a greater interparticle separation achievable before the capillary bridge ruptures.
Additionally, the greater adhesion forces associated result in a higher tensile strength due to a
greater adhesion per contact point. It should also be noted that the higher PEG 400 content capillary
bridges were seen at the top of the filter cake, where the PEG 400 content was 53.71%, which
correlates to a viscosity of approximately 21 mPas. However, lower in the filter cake (near the filter
medium), the PEG 400 content was an appreciably lower 6.57%. It has been observed experimentally
(in this thesis) that with tall filter cakes, crack initiation is seen to occur near the top surface of the
cake, propagating downwards towards the medium. This suggests that the propensity for crack

175
formation is determined more on the mechanical response of the properties near the site of
initiation at the top of the cake, rather than elsewhere lower in the filter cake, where the properties
are academically of lesser significance.
Additionally, it has been observed that with higher viscosity liquids, following rupture of the bridge,
the liquid volume remaining on the particle surface is significantly higher195. This may help further
explain the sharp increase in residual moisture content found when the PEG 400 content of the
initial dispersion was increased to 75%.
The experiments pre-forming a filter cake with the highly viscous solvent polyethylene glycol 400
demonstrate that increasing the PEG 400 content can reduce and eliminate the likelihood of filter
cake cracking. It was initially assumed that due to the highly viscous nature of PEG 400, the
subsequent large compressive forces would lead to a significantly more compressed and tightly
packed filter cake1, and that this outcome with regards to cracking was a result of the high tensile
strengths of the filter cakes formed. However, due to the absence of any significant reduction in
filter cake height, the high residual moisture content with 75% PEG 400, and the capillary bridge
component data following TGA analysis, it can be concluded that the absence of cracking is due to
the low surface tension of the liquid bridges formed during the 75% PEG 400 experiments and the
high dynamic adhesion forces associated with the PEG 400 retention. Effects of surface tension will
be explored in more detail in Section 5.2 and in Section 6.

176
Further viscosity experiments were conducted, keeping the concentration of PEG 400 in DI constant
at 50% and varying the mass fraction of L15. As before, 300 ml of deionised water was added to the
supernatant.
Figure 76: Permeability ratio and residual moisture content for 200 g pre-formed filter cakes / 300 ml PEG 400 + DI / 50% PEG 400 / zero
settling / 0-60% L15 / 2.5 bar / 300 ml DI added. ∆ denotes that deliquoring without cracking occurred. denotes that the event of filter
cake cracking occurred
As can be seen in Figure 76, with 0% L15 cracking can be eliminated. As the fraction of fines
increases, the degree of cracking increases, as does the residual moisture content. These trends
mirror those observed with DI systems, and reconcile well with the data on effects of pressure in
Section 4.3. It is a persistent thread that the presence of coarse particles reduces and eliminates
crack probability, and as mass fraction of fine particles increases, the likelihood and degree of
cracking increase too. This universal pattern indicates that the high capillary pressures associated
with systems of very fine pores may be an initiating cause of filter cake cracking.
0
5
10
15
20
25
30
35
40
0
0.05
0.1
0.15
0.2
0.25
0.3
0.35
0.4
0.45
0 20 40 60 80
Pe
rme
ab
ilit
y R
ati
o [
-]
Re
sid
ua
l M
ois
ture
[-]
% L15 [-]
Residual Moisture
Permeability Ratio
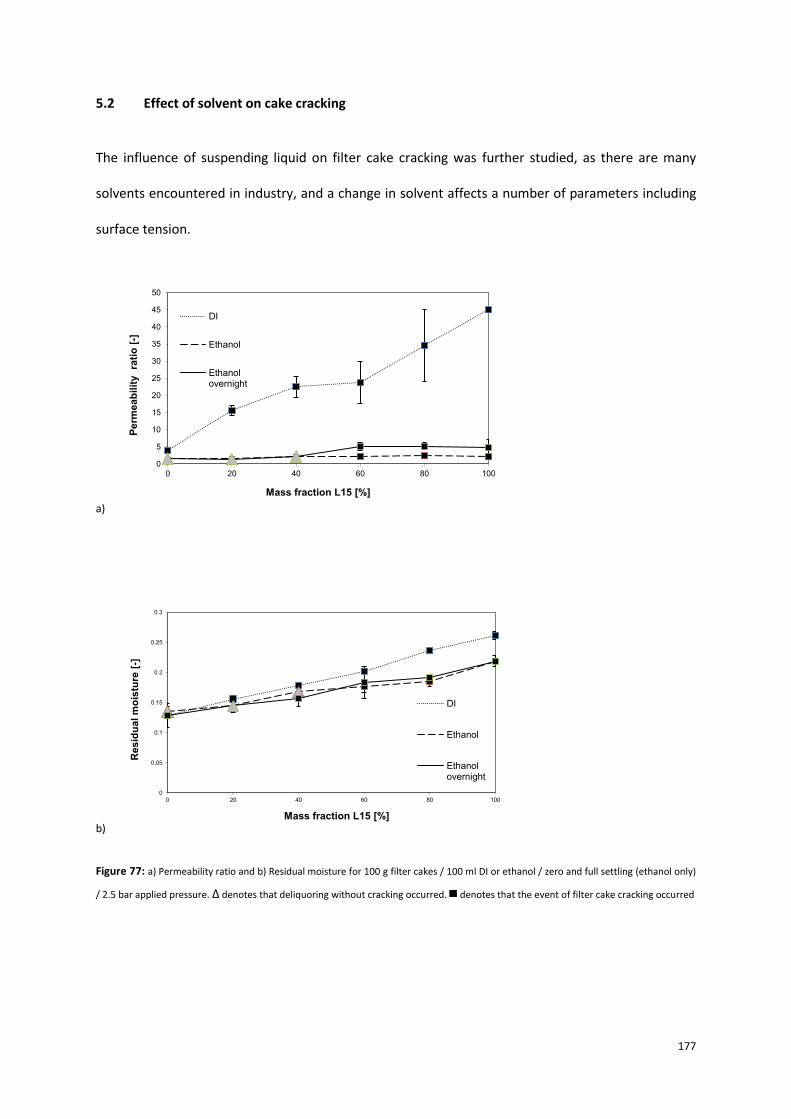
177
5.2 Effect of solvent on cake cracking
The influence of suspending liquid on filter cake cracking was further studied, as there are many
solvents encountered in industry, and a change in solvent affects a number of parameters including
surface tension.
a)
b)
Figure 77: a) Permeability ratio and b) Residual moisture for 100 g filter cakes / 100 ml DI or ethanol / zero and full settling (ethanol only)
/ 2.5 bar applied pressure. ∆ denotes that deliquoring without cracking occurred. denotes that the event of filter cake cracking occurred
0
5
10
15
20
25
30
35
40
45
50
0 20 40 60 80 100
Perm
eab
ilit
y
rati
o [
-]
Mass fraction L15 [%]
DI
Ethanol
Ethanolovernight
0
0.05
0.1
0.15
0.2
0.25
0.3
0 20 40 60 80 100
Re
sid
ua
l m
ois
ture
[-]
Mass fraction L15 [%]
DI
Ethanol
Ethanolovernight

178
As seen from literature, capillary force is proportional to the surface tension136, so with the lower
surface tension of ethanol (22 mN/m) when compared to water (72 mN/m) it is seen that the
likelihood and degree of cracking is reduced when using a solvent with a lower surface tension. The
only ethanol formed filter cakes that actually deliquored without cracking were those with zero
settling and 0 - 40% L15. For the majority of the ethanol-formed filter cakes that did crack, the cracks
did not propagate all the way down to the filter medium (hence the low permeability ratios seen).
With experiments looking at pure DI and ethanol systems, although the viscosities of each solvent
are close, there is a significant reduction in permeability ratio when using ethanol. This is likely due
to the reduction in surface tension between the two liquids (72 and 22 mN/m respectively).
Figure 78 shows changes in average specific resistance with increasing mass fraction of L15. As can
be seen, the values for ethanol and for deionised water mirror each other closely. The viscosity of
ethanol and of deionised water is close (approximately 1.02 & 1.18 mPas respectively), so settling
and PSD profile should not be significantly affected. However, the systems in ethanol are less likely
to crack when compared to those in deionised water. This suggests the strong influence of surface
tension.

179
Figure 78: Average specific resistance for 100 g filter cakes / 100 ml DI and ethanol/ Zero and full settling / 2.5 bar. ∆ denotes that
deliquoring without cracking occurred. denotes that the event of filter cake cracking occurred
The systems under study - pure water and ethanol - were chosen as their viscosities are similar. So,
at a constant volume of 100 ml, the effects on settling behaviour due to changes in viscosity were
minimal. This is reflected in Figure 78, where the average specific resistance values are very close.
Figure 79 looks specifically at 20% L15 filter cakes with different concentrations of ethanol mixed
with deionised water. The results further build on surface tension influences, as the gradual
reduction of surface tension mirrors the gradual reduction of permeability ratio (as the system
moves from cracking to non-cracking with increasing ethanol content). Cracking is eliminated at an
ethanol content greater than 35%.
0
5E+09
1E+10
1.5E+10
2E+10
2.5E+10
3E+10
3.5E+10
4E+10
4.5E+10
5E+10
0 20 40 60 80 100
Sp
ecif
ic r
esis
tan
ce (
/m2)
Mass fraction L15 [%]
DI
Ethanol

180
Figure 79: Residual moisture and permeability ratio for 100 g filter cakes / 100 ml ethanol – DI mix / Zero settling time / 20% L15 / 2.5
bar. ∆ denotes that deliquoring without cracking occurred. denotes that the event of filter cake cracking occurred
Although a small addition of ethanol to water reduces the surface tension significantly183, as can be
seen in Figure 80, at 10% ethanol there is an increase in viscosity. Although the viscosities of pure DI
and ethanol are similar, when the two miscible liquids are mixed, the viscosity relationship is not
linear; it is a local maximum relationship184, peaking with a relative viscosity of around 2.8 at 30%
ethanol.
0
2
4
6
8
10
12
14
16
18
0.12
0.13
0.14
0.15
0.16
0.17
0.18
0.19
0.2
0 20 40 60 80 100
Perm
eab
ilit
y r
ati
o [
-]
Resid
ual
mo
istu
re [
-]
Mass of ethanol in DI [%]
Residual Moisture
Permeability ratio
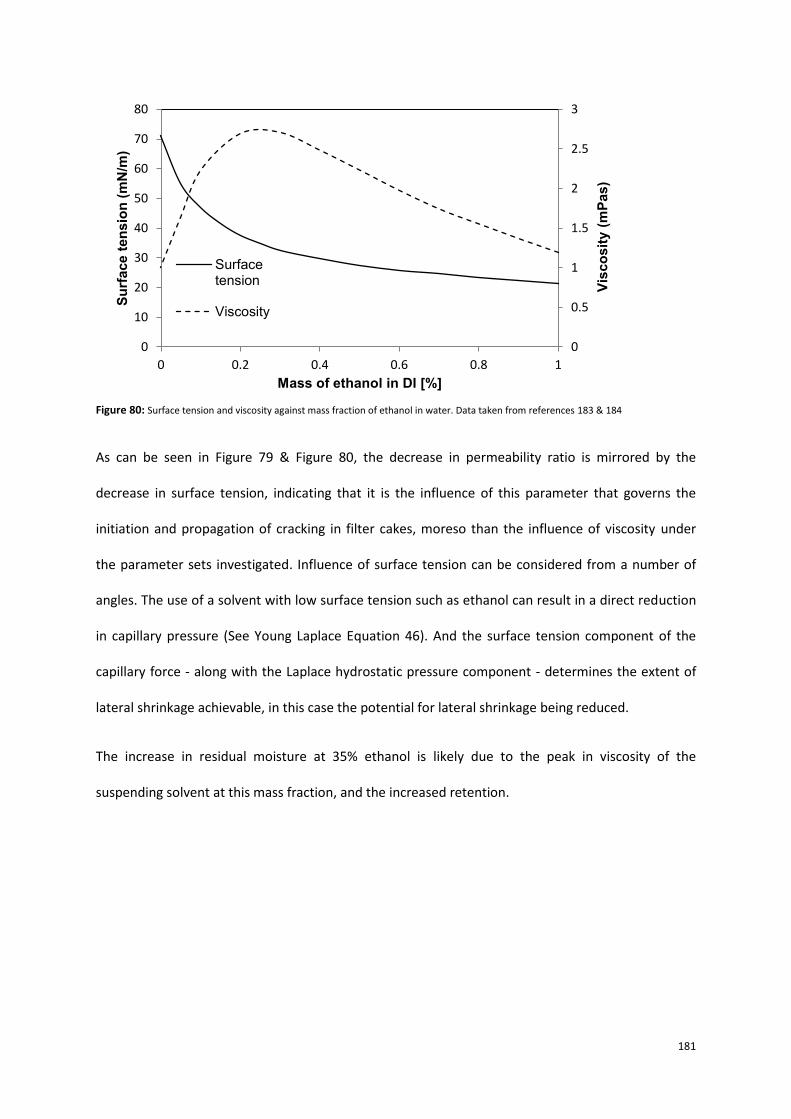
181
Figure 80: Surface tension and viscosity against mass fraction of ethanol in water. Data taken from references 183 & 184
As can be seen in Figure 79 & Figure 80, the decrease in permeability ratio is mirrored by the
decrease in surface tension, indicating that it is the influence of this parameter that governs the
initiation and propagation of cracking in filter cakes, moreso than the influence of viscosity under
the parameter sets investigated. Influence of surface tension can be considered from a number of
angles. The use of a solvent with low surface tension such as ethanol can result in a direct reduction
in capillary pressure (See Young Laplace Equation 46). And the surface tension component of the
capillary force - along with the Laplace hydrostatic pressure component - determines the extent of
lateral shrinkage achievable, in this case the potential for lateral shrinkage being reduced.
The increase in residual moisture at 35% ethanol is likely due to the peak in viscosity of the
suspending solvent at this mass fraction, and the increased retention.
0
0.5
1
1.5
2
2.5
3
0
10
20
30
40
50
60
70
80
0 0.2 0.4 0.6 0.8 1
Vis
co
sit
y (
mP
as)
Su
rface t
en
sio
n (
mN
/m)
Mass of ethanol in DI [%]
Surfacetension
Viscosity

182
6 Results: Molecular level
6.1 Effect of surfactant addition on cake cracking
The influence of surface tension of the suspending liquid was further investigated through the
addition of the following surfactants: (i) anionic (sodium dodecyl sulphate, SDS); (ii) cationic
(Cetyltrimethylammonium Bromide, CTAB); (iii) non-ionic (Polyoxyethylene sorbitan monooleate,
Tween 80). For the surfactant systems used in this study, surface excess was calculated to be the
following; 5.63 x 10⁻⁶ mol/m2 (SDS); 5.17 x 10⁻⁶ mol/m2 (CTAB); 7.40 x 10⁻⁷ mol/m2 (Tween 80).

183
Concentration of
surfactant (g/l)
Permeability ratio
[-]
Residual moisture
content [-]
Average specific
resistance [/m2]
Result
SDS
0.31 0.94 ± 0.16 0.15 ± 0.00 (8.96 ± 0.41) x 1013 Deliquor
1.05 n/a** 0.11 ± 0.00 (9.89 ± 0.96) x 1013 Deliquor
5.00* n/a** 0.11 ± 0.00 (1.88 ± 0.21) x 1014 Deliquor
CTAB
0.16 4.00 ± 0.90 0.17 ± 0.01 (6.29 ± 0.44) x 1013 Crack
0.64* 5.94 ± 1.05 0.15 ± 0.01 (6.64 ± 0.50) x 1013 Crack
2.10* n/a** 0.13 ± 0.00 (1.32 ± 0.04) x 1014 Deliquor
Tween 80
0.29 10.67 ± 0.57 0.14 ± 0.01 (8.49 ± 0.96) x 1013 Crack
5.12 1.83 ± 0.12 0.11 ± 0.01 (9.21 ± 0.51) x 1013 Crack
14.30* 2.12 ± 0.20 0.09 ± 0.00 (1.03 ± 0.04) x 1014 Crack
Table 9: Table of results for 100 g filter cakes / 20% L15 / 100 ml DI + surfactant / No settling / 2.5 bar
* denotes surface tension of solvent is nominally at CMC or above. ** with some filtration runs, at air breakthrough the gas flowrate was
barely registerable. Due to this a true permeability ratio could not be calculated. However from visual observation it was noted that the
cakes did not crack, and it can be taken that the permeability ratios were approximately unity.

184
The surface tensions at the CMC for SDS, CTAB and Tween 80 are 37.29, 39.70 and 49.80 mN/m
respectively. As can be seen from Table 9, as the mass of surfactant is increased, the degree and
likelihood of cracking diminishes. With Tween 80, although the trend of reducing permeability ratio
was observed, all filter cakes formed resulted in cracking, as the surface tensions achieved (even
above the CMC) were still significantly higher than those of other surfactants.
Figure 81: Photographs of filter cakes formed with a) SDS, b) CTAB, c) Tween 80
The experiments with ionic surfactants further validate this trend, however some curious behaviour
is observed. With anionic surfactants, such as SDS, it is known that the surfactant precipitates when
it comes into contact with bivalent cations such as Ca2+ 196. Although calcium carbonate is nominally
insoluble in water, ionisation does occur, and these ions can cause SDS to precipitate onto the
surface of the particle. With the filter cakes formed using SDS, from those with small additions of
surfactant, to ones with large doses that exceed the critical micelle concentration (CMC), it was
found that none of the filter cakes cracked. However, air breakthrough at the filter medium was so
small in some cases, it was not registerable on the inline gas flowmeter. Foam was observed seeping
out of the filtration rig outlet, and the resulting filter cakes were not a singular structure, but instead
comprised a series of many thin, curved sheets that were easily separated (see Figure 81a). It is
thought that the surfactant in this case lubricates the particles, and due to wall friction there is a
marked curvature across the filter cake. This results in a very high average specific resistance and
filter cakes that deliquor without cracking.

185
With the 3 additions of SDS surfactant, all of the filter cakes resulted in deliquoring only i.e. none
cracked. Figure 82 illustrates decreasing surface tension with increasing amphiphile addition of SDS,
and the surface tensions achieved at CMC. A constant viscosity is also seen, at or around values close
to that of DI.
Figure 82: Graphs to show surface tension and viscosity data of SDS additions to 100 ml deionised water
As can be seen, with 5 g/l addition of SDS, the concentration is above the CMC. Figure 83 shows that
the structure of the filter cakes are different to what was seen with other experiments.
Figure 83: Photographs of filter cakes formed with SDS surfactant (5 g/l)
0
0.2
0.4
0.6
0.8
1
1.2
1.4
30
40
50
60
70
80
90
100
0 100 200 300 400 500 600 700
Vis
co
sit
y (
mP
as
)
Su
rfa
ce
te
ns
ion
(m
N/m
)
Mass SDS (mg)
Surface Tension
Viscosity

186
From a side view of the cake, three distinct bands are formed. The bands become darker going down
the filter cake. This is not a reflection of saturation or extent of deliquoring as all portions were very
dry, with some of the lowest residual moisture contents seen (some as low as 0.11) and deliquoring
was performed until equilibrium saturation was reached.
These composites of dry brittle sheets were easily separated into component layers without
fracturing, and they were close fitting, with no macroscopic cavities or openings seen. Although the
layers formed distinct bands, it was not a case of segregation as seen in Section 4. From a top view
of a single filter cake, curvature of the surface is evident. When the filter cakes are split for
observation of the internal grain of the cake, the curvature becomes more apparent and can be seen
across all three bands. It is more marked within the top band, becoming less pronounced moving
downwards towards the filter medium (see Figure 83).
With 1.05 g/l addition of SDS surfactant, which is below the CMC for SDS, surface tension is reduced
to 50.57 mN/m. As can be seen in Figure 84, a slight separation and curvature is seen at the very top
of the filter cake. The lower sections of the filter cake retain the typical grain consistency.
Figure 84: Photographs of filter cakes formed with SDS surfactant (1.05 g/l)

187
With a small addition of SDS (0.31 g/l), the surface tension is reduced only slightly (65.70 mN/m),
such that it is still very close to that of DI. However, the cake did not crack. In this case, such a small
reduction is unlikely to assist Young Laplace capillary pressure reduction significantly, yet deliquoring
only occurred. It is more likely due to the precipitation onto the particle surface. As can be seen in
Figure 85, the filter cakes formed are of a regular grain consistency, and no curvature was seen.
Figure 85: Photograph of filter cake formed with SDS surfactant (0.31 g/l)
What is notable about these experiments with SDS surfactant is that in all cases the filter cakes did
not crack. Even with a very small amount of surfactant, and the attendant surface tension reduction
(in the latter case, minor), a stark reduction of permeability ratio was achieved when in direct
comparison with its equivalent system in pure DI (whose surface tension is 72 mN/m).
A separate study was conducted with a cationic surfactant (CTAB). Figure 86 demonstrates
decreasing surface tension with increasing amphiphile addition for CTAB and the surface tensions
achieved at CMC. A constant viscosity was again noted, at or around values close to that of DI.
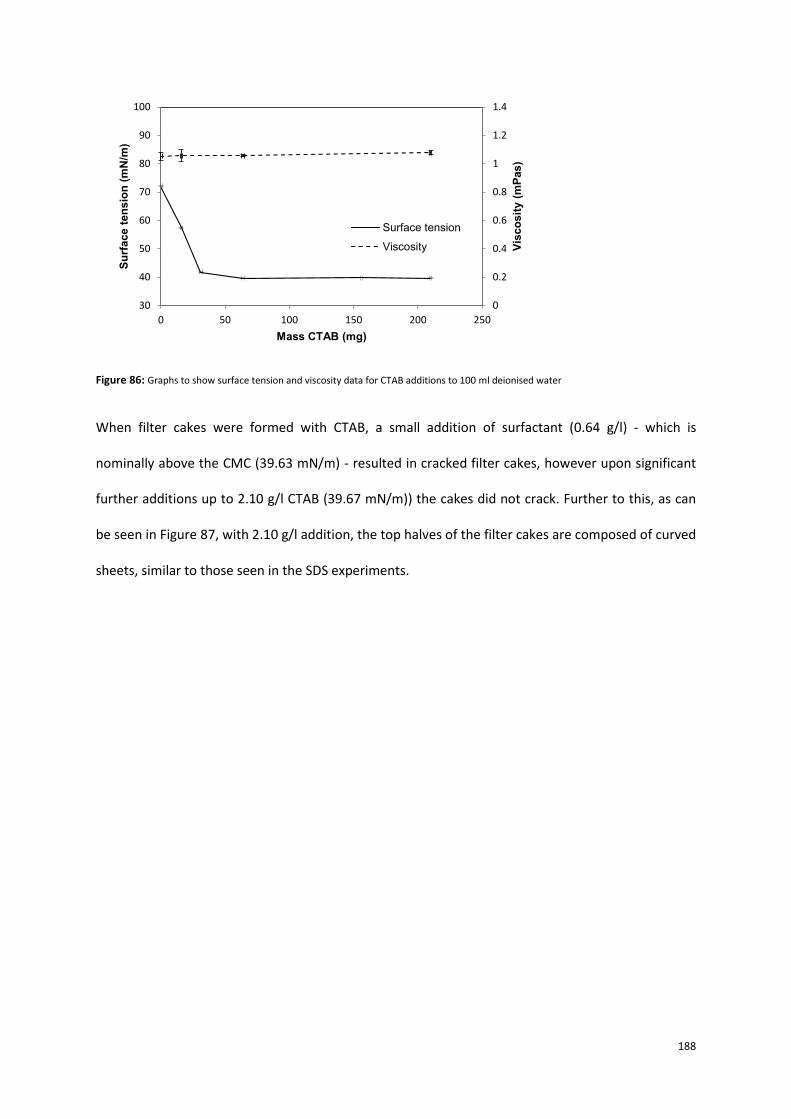
188
Figure 86: Graphs to show surface tension and viscosity data for CTAB additions to 100 ml deionised water
When filter cakes were formed with CTAB, a small addition of surfactant (0.64 g/l) - which is
nominally above the CMC (39.63 mN/m) - resulted in cracked filter cakes, however upon significant
further additions up to 2.10 g/l CTAB (39.67 mN/m)) the cakes did not crack. Further to this, as can
be seen in Figure 87, with 2.10 g/l addition, the top halves of the filter cakes are composed of curved
sheets, similar to those seen in the SDS experiments.
0
0.2
0.4
0.6
0.8
1
1.2
1.4
30
40
50
60
70
80
90
100
0 50 100 150 200 250
Vis
co
sit
y (
mP
as)
Su
rface t
en
sio
n (
mN
/m)
Mass CTAB (mg)
Surface tension
Viscosity
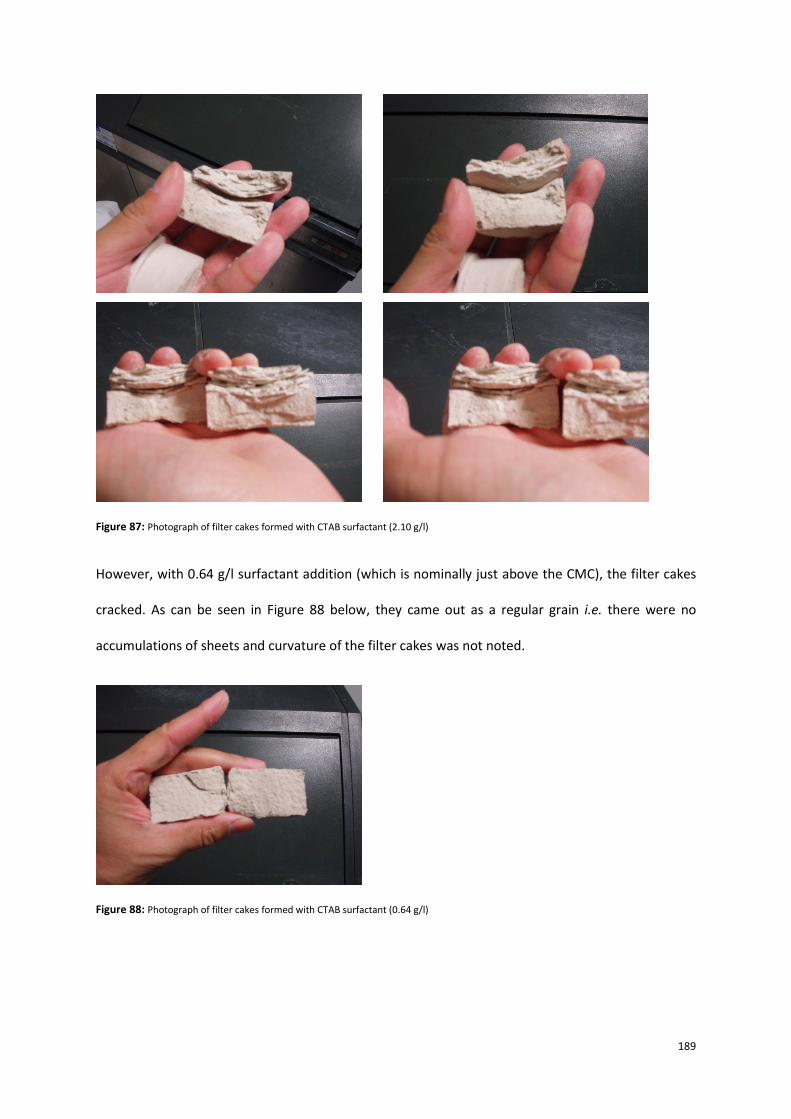
189
Figure 87: Photograph of filter cakes formed with CTAB surfactant (2.10 g/l)
However, with 0.64 g/l surfactant addition (which is nominally just above the CMC), the filter cakes
cracked. As can be seen in Figure 88 below, they came out as a regular grain i.e. there were no
accumulations of sheets and curvature of the filter cakes was not noted.
Figure 88: Photograph of filter cakes formed with CTAB surfactant (0.64 g/l)
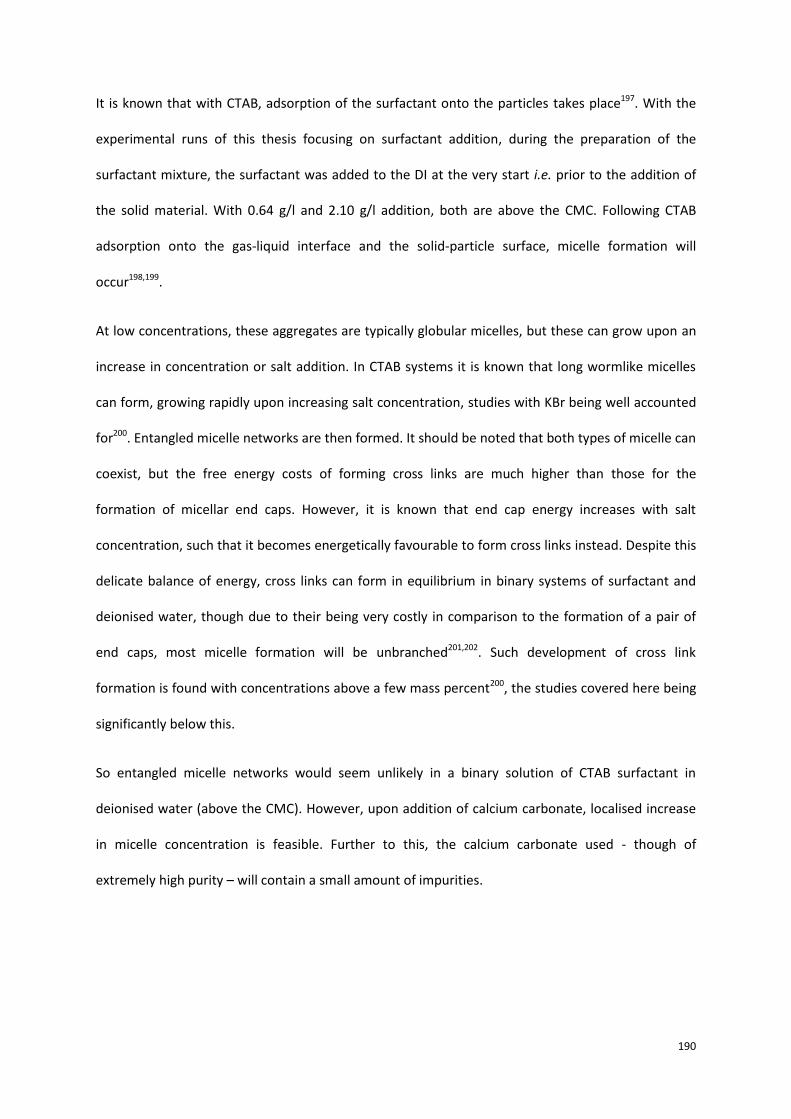
190
It is known that with CTAB, adsorption of the surfactant onto the particles takes place197. With the
experimental runs of this thesis focusing on surfactant addition, during the preparation of the
surfactant mixture, the surfactant was added to the DI at the very start i.e. prior to the addition of
the solid material. With 0.64 g/l and 2.10 g/l addition, both are above the CMC. Following CTAB
adsorption onto the gas-liquid interface and the solid-particle surface, micelle formation will
occur198,199.
At low concentrations, these aggregates are typically globular micelles, but these can grow upon an
increase in concentration or salt addition. In CTAB systems it is known that long wormlike micelles
can form, growing rapidly upon increasing salt concentration, studies with KBr being well accounted
for200. Entangled micelle networks are then formed. It should be noted that both types of micelle can
coexist, but the free energy costs of forming cross links are much higher than those for the
formation of micellar end caps. However, it is known that end cap energy increases with salt
concentration, such that it becomes energetically favourable to form cross links instead. Despite this
delicate balance of energy, cross links can form in equilibrium in binary systems of surfactant and
deionised water, though due to their being very costly in comparison to the formation of a pair of
end caps, most micelle formation will be unbranched201,202. Such development of cross link
formation is found with concentrations above a few mass percent200, the studies covered here being
significantly below this.
So entangled micelle networks would seem unlikely in a binary solution of CTAB surfactant in
deionised water (above the CMC). However, upon addition of calcium carbonate, localised increase
in micelle concentration is feasible. Further to this, the calcium carbonate used - though of
extremely high purity – will contain a small amount of impurities.

191
Above the CMC, when surfactant molecules self-assemble, the micelle formation is generally that of
globular aggregates. Aswal et al. in their study of CTAB systems with additions of sodium salicylate
(NaSal) found wormlike growth even at moderately low surfactant and salt concentrations, and
these systems would display strong viscoelastic behaviour203. When plotting viscosity against NaSal
concentrations, they noted that the micelles had achieved their maximal length at the first viscosity
maximum, and the entangled network had formed. Beyond this peak, the micelles behaved as living
polymers.
Figure 89: Photographs of 100 g calcium carbonate in a solution of 210 mg CTAB in 100 ml deionised water following full settling
Figure 89 above shows settled calcium carbonate in a solvent of 210 mg CTAB in 100 ml deionised
water. The solution is a gel-like substance, beige in colour, with particles of calcium carbonate
suspended across the phase. This is further illustrated in Figure 90 below.
Figure 90: Photographs of 100 g calcium carbonate in a solution of 210 mg CTAB in 100 ml deionised water following full settling (top
view)

192
Generally, surfactant solutions are optically isotropic and of low viscosity, however above the CMC
this is not necessarily the case. With the development of rod-like micelle networks, the solution rich
in these micelles can be highly viscoelastic (however a single phase character does not seem to be
the case here).
Figure 91: Photographs of a) 64 mg CTAB filtrate and 210 mg CTAB per 100 ml filtrate; b) SDS, CTAB and Tween 80 filtrate
Figure 91 a) shows filtrate from 64 mg and 210 mg CTAB in 100 ml solution, following filtration of
100 g calcium carbonate. Both are of different surface tension (54.82 and 38.43 mN/m respectively),
with 64 mg nominally at the CMC and 210 mg above the CMC, the filtrate collected in each case is
very different in appearance, with the latter being a rusty colour. Also, as seen in Figure 91 b), this
discolouration is only seen with CTAB, and not with SDS or Tween 80. This suggests that high
concentrations of CTAB result in a leaching of, and interaction with impurities from the calcium
carbonate addition. These impurities may lead to the formation of a 3 dimensional tangled network
due to the aforementioned entropic penalty of endcap formation. These networks are not
chemically bonded, they are temporary and are continuously broken and reformed. Upon the
breakdown of these networks, the viscoelastic properties disappear, and a normal Newtonian
behaviour emerges with a shear independent viscosity204. This is what was observed with the filtrate
from the 210 mg CTAB experiments, where the post filtration viscosity was similar to that of water,
suggesting the breaking of the network during the later stages of filtration, or the entrainment of the
entangled network within the porous matrix of calcium carbonate, leaving low micelle concentration
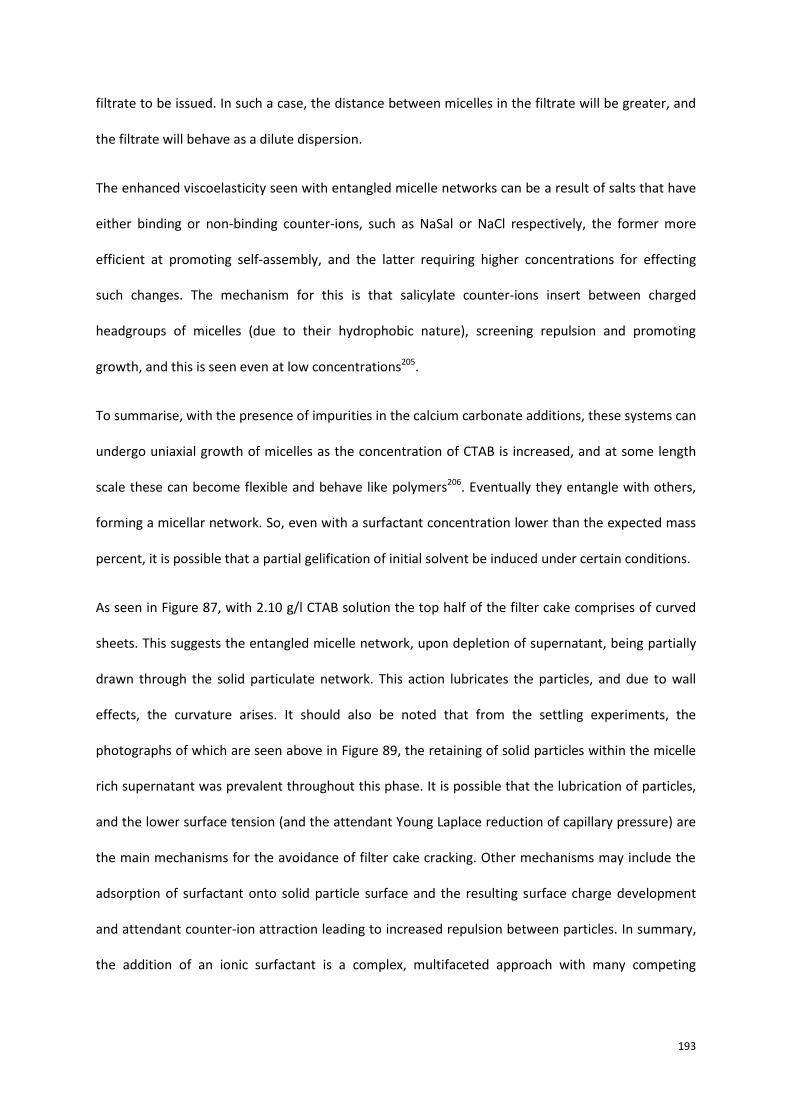
193
filtrate to be issued. In such a case, the distance between micelles in the filtrate will be greater, and
the filtrate will behave as a dilute dispersion.
The enhanced viscoelasticity seen with entangled micelle networks can be a result of salts that have
either binding or non-binding counter-ions, such as NaSal or NaCl respectively, the former more
efficient at promoting self-assembly, and the latter requiring higher concentrations for effecting
such changes. The mechanism for this is that salicylate counter-ions insert between charged
headgroups of micelles (due to their hydrophobic nature), screening repulsion and promoting
growth, and this is seen even at low concentrations205.
To summarise, with the presence of impurities in the calcium carbonate additions, these systems can
undergo uniaxial growth of micelles as the concentration of CTAB is increased, and at some length
scale these can become flexible and behave like polymers206. Eventually they entangle with others,
forming a micellar network. So, even with a surfactant concentration lower than the expected mass
percent, it is possible that a partial gelification of initial solvent be induced under certain conditions.
As seen in Figure 87, with 2.10 g/l CTAB solution the top half of the filter cake comprises of curved
sheets. This suggests the entangled micelle network, upon depletion of supernatant, being partially
drawn through the solid particulate network. This action lubricates the particles, and due to wall
effects, the curvature arises. It should also be noted that from the settling experiments, the
photographs of which are seen above in Figure 89, the retaining of solid particles within the micelle
rich supernatant was prevalent throughout this phase. It is possible that the lubrication of particles,
and the lower surface tension (and the attendant Young Laplace reduction of capillary pressure) are
the main mechanisms for the avoidance of filter cake cracking. Other mechanisms may include the
adsorption of surfactant onto solid particle surface and the resulting surface charge development
and attendant counter-ion attraction leading to increased repulsion between particles. In summary,
the addition of an ionic surfactant is a complex, multifaceted approach with many competing
194
mechanisms, and many unexplained phenomena (even in the field of surfactant and micelle study)
are introduced, some of which are beyond the scope of this thesis.
Additional tensiometer runs were performed on the filtrate collected. With 2.1 g/l CTAB, the filtrate
was still at its lowest surface tension (≈ 38.43 mN/m). Like equivalent SDS runs, the flowrate at air
breakthrough was very low, the filter cakes came out as curved sheets (see Figure 87) and very high
average specific resistances were achieved. With 0.64 g/l CTAB however, the surface tension values
were pulled back to 54.82 mN/m i.e. out of the CMC range.
Further experiments were conducted with 0.16 g/l surfactant addition – which is significantly lower
than the CMC - and the filter cakes cracked. As can be seen in Figure 92, there was no curvature of
the filter cakes, and they came out as regular grain composition.
Figure 92: Photograph of filter cake formed with CTAB surfactant (0.16 g/l)
What can be seen from the experiments with ionic surfactants is that curvature of the filter cakes is
seen at high concentrations. This may be partly explained by the precipitation of anionic surfactant
onto particle surface for the SDS enhanced dispersions. Though this precipitation of SDS cannot fully
explain the curvature seen, it is still a pertinent aspect (partly explaining the avoidance of cracking
even with a small addition of surfactant, well below the CMC). With cationic surfactants,
complications arise due to the formation of entangled micelle networks.

195
Further experiments were carried out with the non-ionic surfactant Tween 80.
a) b) c)
Figure 93: Photograph of filter cakes formed with Tween 80 surfactant a) 0.29 g/l; b) 5.12 g/l; c) 14.30 g/l
With these experiments, all filter cakes cracked, but the surface tension (even above the CMC) was
relatively high (49.75 mN/m). In these cases, the filter cakes did not come out as curved sheets, but
as singular constructs (see Figure 93) with a comparatively low average specific resistance. The trend
seen however is that even though the filter cakes cracked, permeability ratio decreased as surface
tension decreased, and lower residual moisture contents were achieved. Figure 94 demonstrates
decreasing surface tension with increasing amphiphile addition for Tween 80, and the surface
tensions achieved at CMC. A constancy of viscosity is again seen, at or around values close to that of
DI.
Figure 94: Graphs to show surface tension and viscosity data for Tween 80 additions to 100 ml deionised water
0
0.2
0.4
0.6
0.8
1
1.2
1.4
30
40
50
60
70
80
90
100
0 500 1000 1500 2000
Vis
co
sit
y (
mP
as
)
Su
rfa
ce
te
ns
ion
(m
N/m
)
Mass Tween 80 (mg)
Surface tension
Viscosity
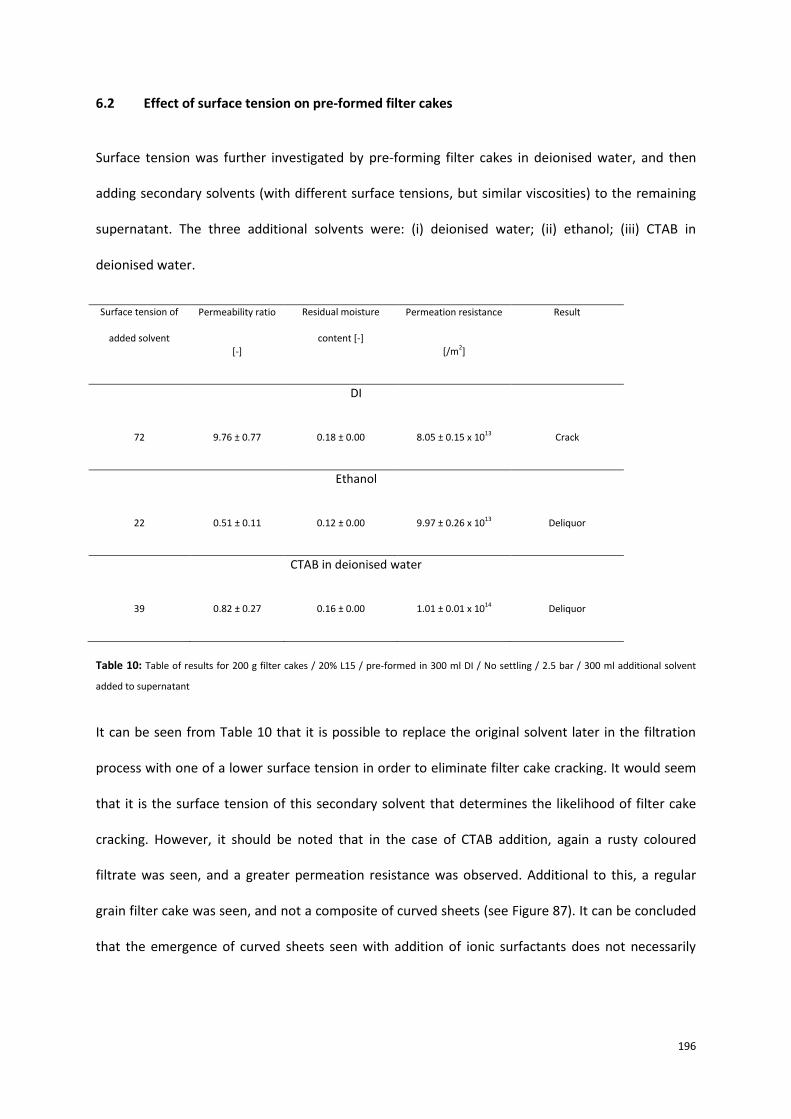
196
6.2 Effect of surface tension on pre-formed filter cakes
Surface tension was further investigated by pre-forming filter cakes in deionised water, and then
adding secondary solvents (with different surface tensions, but similar viscosities) to the remaining
supernatant. The three additional solvents were: (i) deionised water; (ii) ethanol; (iii) CTAB in
deionised water.
Surface tension of
added solvent
Permeability ratio
[-]
Residual moisture
content [-]
Permeation resistance
[/m2]
Result
DI
72 9.76 ± 0.77 0.18 ± 0.00 8.05 ± 0.15 x 10¹³ Crack
Ethanol
22 0.51 ± 0.11 0.12 ± 0.00 9.97 ± 0.26 x 10¹³ Deliquor
CTAB in deionised water
39 0.82 ± 0.27 0.16 ± 0.00 1.01 ± 0.01 x 10¹⁴ Deliquor
Table 10: Table of results for 200 g filter cakes / 20% L15 / pre-formed in 300 ml DI / No settling / 2.5 bar / 300 ml additional solvent
added to supernatant
It can be seen from Table 10 that it is possible to replace the original solvent later in the filtration
process with one of a lower surface tension in order to eliminate filter cake cracking. It would seem
that it is the surface tension of this secondary solvent that determines the likelihood of filter cake
cracking. However, it should be noted that in the case of CTAB addition, again a rusty coloured
filtrate was seen, and a greater permeation resistance was observed. Additional to this, a regular
grain filter cake was seen, and not a composite of curved sheets (see Figure 87). It can be concluded
that the emergence of curved sheets seen with addition of ionic surfactants does not necessarily

197
equate to a mechanism for avoidance of filter cake cracking. As with SDS, crack avoidance can be
achieved with or without inducing curvature.
With similar initial viscosities of the secondary solvent used, a replacing of the initial solvent would
be expected. With ethanol however, a higher permeation resistance was also seen. This may be due
to an ethanol concentration gradient developing, following addition to the deionised water
supernatant. One phase cross section of the ethanol enhanced supernatant will have a composition
approaching 30% ethanol i.e. maximum relative viscosity for an ethanol–water system (see Figure
80). An additional experiment was later performed, similar to those in Table 10, however ethanol
was used to pre-form the filter cake instead, and deionised water was the sole solvent added to the
supernatant i.e. a reversal of the experiment utilising ethanol in Table 10. The resulting filter cakes
cracked, with a permeability ratio of 6.71 ± 1.02 and a residual moisture content of 0.16 ± 0.01. This
strongly supports the earlier data on the influence of surface tension on capillary pressure as a
mechanism for crack avoidance.
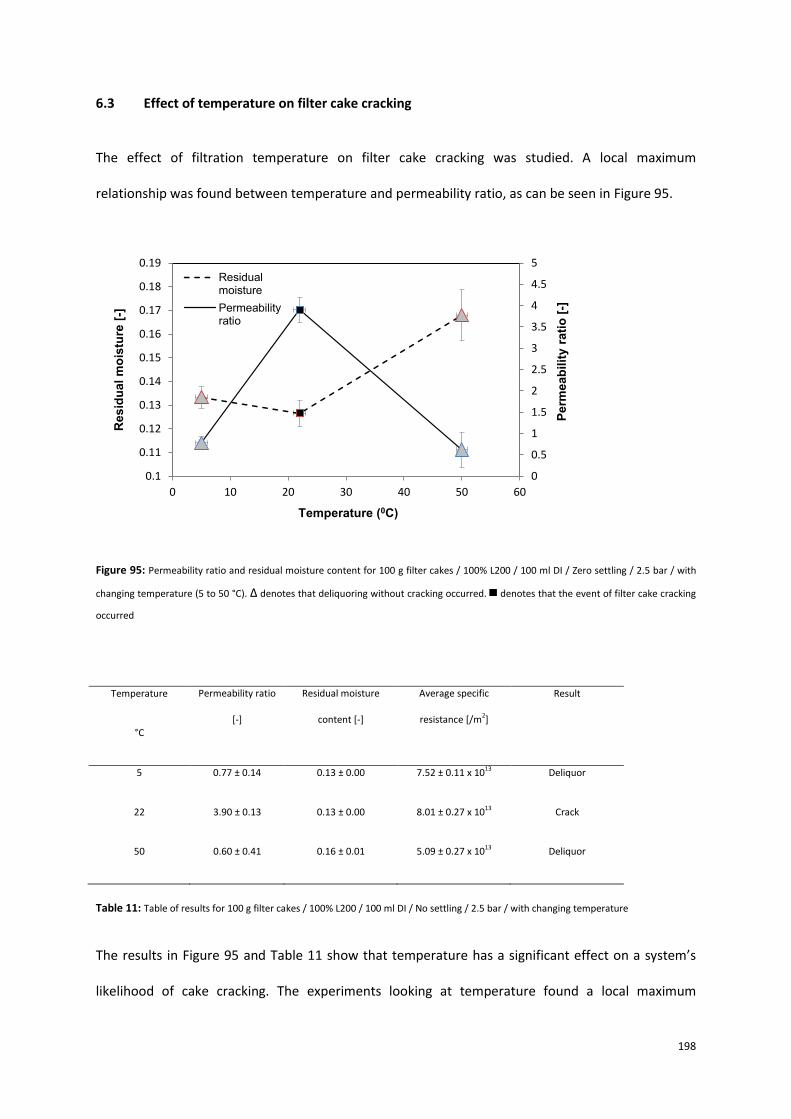
198
6.3 Effect of temperature on filter cake cracking
The effect of filtration temperature on filter cake cracking was studied. A local maximum
relationship was found between temperature and permeability ratio, as can be seen in Figure 95.
Figure 95: Permeability ratio and residual moisture content for 100 g filter cakes / 100% L200 / 100 ml DI / Zero settling / 2.5 bar / with
changing temperature (5 to 50 °C). ∆ denotes that deliquoring without cracking occurred. denotes that the event of filter cake cracking
occurred
Temperature
°C
Permeability ratio
[-]
Residual moisture
content [-]
Average specific
resistance [/m2]
Result
5 0.77 ± 0.14 0.13 ± 0.00 7.52 ± 0.11 x 10¹³ Deliquor
22 3.90 ± 0.13 0.13 ± 0.00 8.01 ± 0.27 x 10¹³ Crack
50 0.60 ± 0.41 0.16 ± 0.01 5.09 ± 0.27 x 10¹³ Deliquor
Table 11: Table of results for 100 g filter cakes / 100% L200 / 100 ml DI / No settling / 2.5 bar / with changing temperature
The results in Figure 95 and Table 11 show that temperature has a significant effect on a system’s
likelihood of cake cracking. The experiments looking at temperature found a local maximum
0
0.5
1
1.5
2
2.5
3
3.5
4
4.5
5
0.1
0.11
0.12
0.13
0.14
0.15
0.16
0.17
0.18
0.19
0 10 20 30 40 50 60
Perm
eab
ilit
y r
ati
o [
-]
Resid
ual
mo
istu
re [
-]
Temperature (0C)
Residualmoisture
Permeabilityratio

199
relationship between permeability ratio and temperature. At room temperature the filter cakes
cracked, however at both 5 °C and 50 °C it was found that the filter cakes deliquored only. It is
known that for calcium carbonate at room temperature, the zeta potential is low and flocculation
occurs 180, 181. Changes to the temperature of a system affect many parameters, from surface charge
density to material properties of the suspending liquid. It has been noted in literature that the point
of zero charge is shifted207, and flocculation effects are minimised or even removed75 when these
changes are made. Material properties such as surface tension, viscosity and solubility of calcium
carbonate182 are also changed in the wide temperature range used in this parametric study.
However, for surface tension and viscosity, these changes are not so significant as to effect change
of this magnitude i.e. they are not comparable to the high viscosities seen with the PEG 400
experiments or the very low surface tensions achieved with ethanol. Changes in surface charge
density (and hence flocculation tendency) due to shifting temperatures is the most likely possible
explanation of this local maximum relationship, and indicates that the previously mentioned
breaking of weak bonds formed during flocculation may be partly responsible for filter cake cracking.
Rodriguez et al.75 observed similar behaviour on zeta potential values of calcite with changing
temperature, and the behaviour was due to the changing solubilities of the ionic species involved.
The sign of zeta potential is dependent on the number of Ca2+ and CO32- ions available in solution. As
temperature increases, the solubility of Ca2+ ions increases. This allows the ions to preferentially
leave the particle structure, leaving the surface with a negative charge. There are numerous other
dissolved species active, and the true response is a combination of the behaviour of all species,
however the solubility of Ca2+ is the simplest plausible mechanism to explain this behaviour. In
general though, calcium carbonate in aqueous media displays complex behaviour.
Cima et al.155 in the study of colloidal films found that removing the electrostatic double layer
between particles results in a large increase in CCT. They concluded that a strain was caused due to
the collapse of the electrostatic double layer by capillary forces, and elimination of this layer avoids
cracking. In the experiments conducted as part of this thesis, there is an external force absent from

200
their colloidal film experiments. The flow of deliquoring gas and solvent, rather than being a
dissipative mechanism, instead acts as a driving force initiating the breaking of weak agglomeration
bonds.
One further influence to consider is that of temperature effect on capillary pressure. Generally the
assumption is that capillary pressure is a linear function of temperature. Further to the assertion
that changes in capillary pressure are due to changes in surface tension of water arising from
increasing temperature208, Grant et al.209, in the study of soils proposed four probable mechanisms
for discrepant values recorded; (i) expansion of water (ii) expansion of trapped air (iii) solute effects
on the surface tension of water (iv) temperature sensitive contact angles.

201
7 Crack formation
The crack patterns observed during these experimental runs were wide ranging in terms of size and
geometry. They varied from networks of straight cracks to curved cracks that would run the
perimeter of the inside edge of the filter cake surface. Table 12 and Table 13 show the changes in
crack pattern for the experimental runs looking at concentration and settling times for increasing
mass fraction of L15. Some trends are seen with increasing fraction of fines, such as 100 ml systems
with zero settling (row 3 of tables). In these cases all filter cakes cracked, and when the cracks are
visible on the top surface (20 - 80% L15), it is curved cracks that are seen. These cracks are partially
mirrored on the underside, where parts of the crack networks have propagated down through the
filter cake to the medium. With 0% L15, although the cakes cracked, these cracks were not visible at
the top surface of the filter cake. Instead the cracks formed less than 1 cm under the surface, and
then moved downwards. A crescent shaped crack was visible at the bottom of the filter cake (see
Table 13).
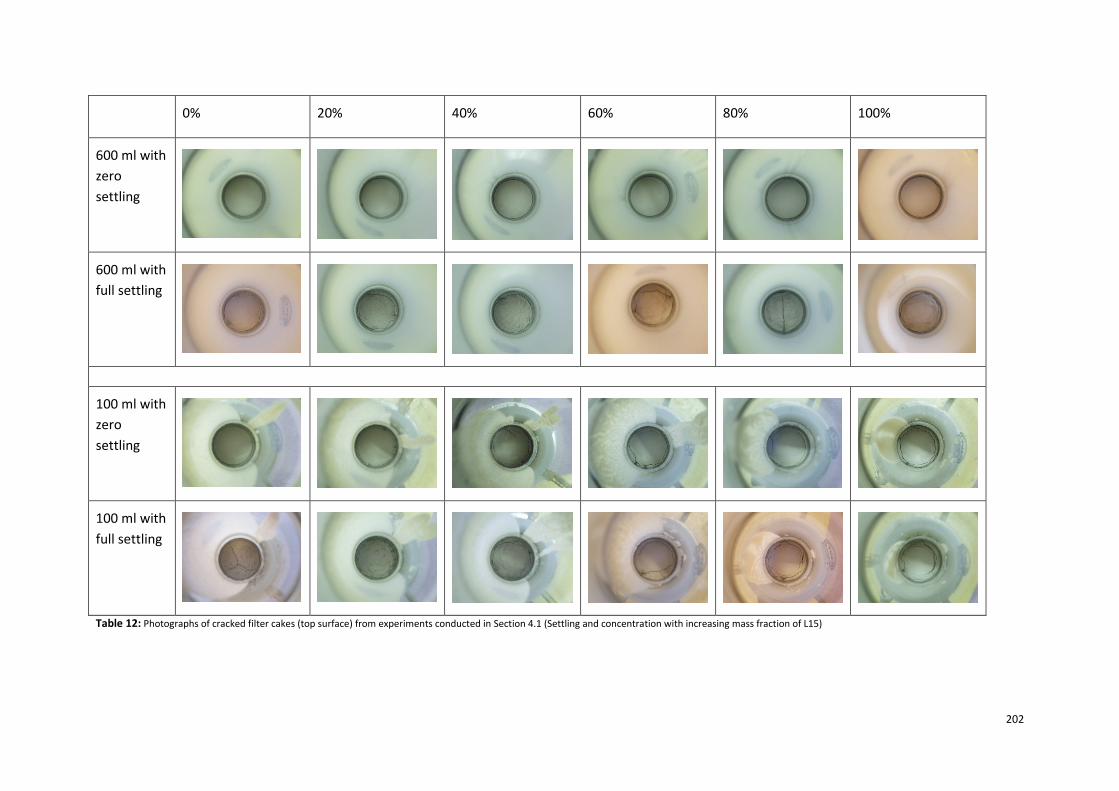
202
0% 20% 40% 60% 80% 100%
600 ml with
zero
settling
600 ml with
full settling
100 ml with
zero
settling
100 ml with
full settling
Table 12: Photographs of cracked filter cakes (top surface) from experiments conducted in Section 4.1 (Settling and concentration with increasing mass fraction of L15)

203
0% 20% 40% 60% 80% 100%
600 ml with
zero
settling
600 ml with
full settling
100 ml with
zero
settling
100 ml with
full settling
Table 13: Photographs of cracked filter cakes (bottom surface) from experiments conducted in Section 4.1 (Settling and concentration with increasing mass fraction of L15)
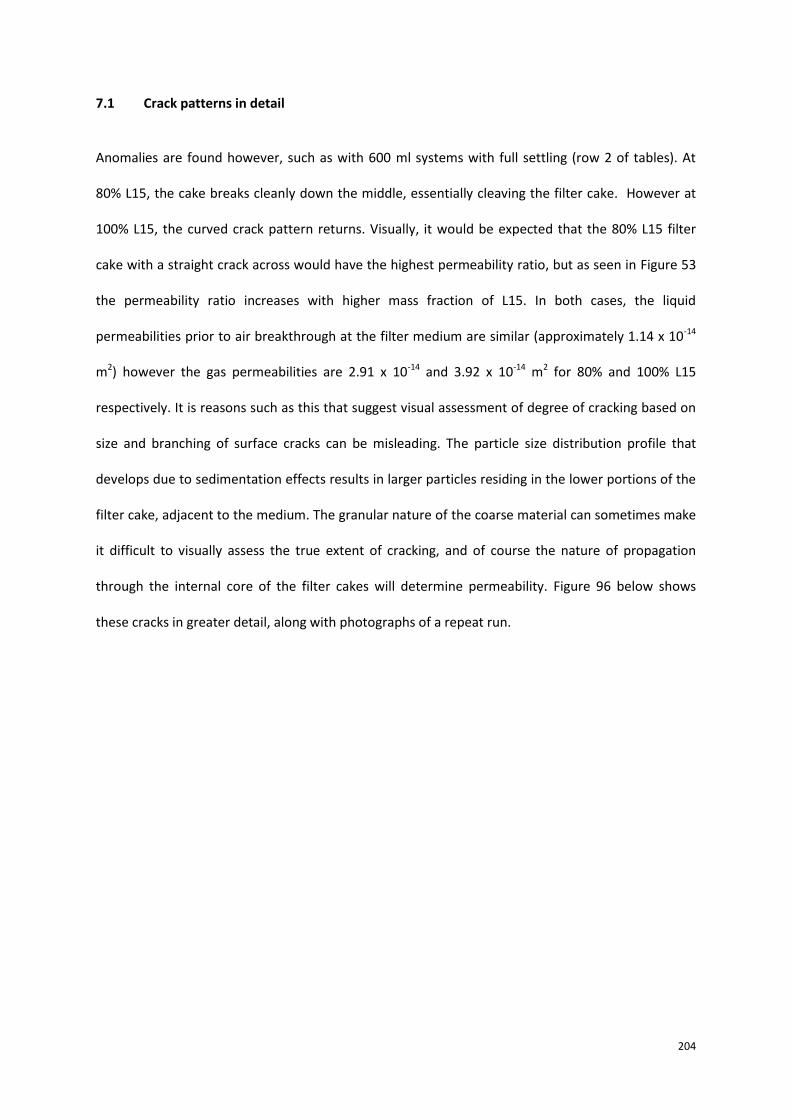
204
7.1 Crack patterns in detail
Anomalies are found however, such as with 600 ml systems with full settling (row 2 of tables). At
80% L15, the cake breaks cleanly down the middle, essentially cleaving the filter cake. However at
100% L15, the curved crack pattern returns. Visually, it would be expected that the 80% L15 filter
cake with a straight crack across would have the highest permeability ratio, but as seen in Figure 53
the permeability ratio increases with higher mass fraction of L15. In both cases, the liquid
permeabilities prior to air breakthrough at the filter medium are similar (approximately 1.14 x 10⁻¹⁴
m2) however the gas permeabilities are 2.91 x 10⁻¹⁴ and 3.92 x 10⁻¹⁴ m2 for 80% and 100% L15
respectively. It is reasons such as this that suggest visual assessment of degree of cracking based on
size and branching of surface cracks can be misleading. The particle size distribution profile that
develops due to sedimentation effects results in larger particles residing in the lower portions of the
filter cake, adjacent to the medium. The granular nature of the coarse material can sometimes make
it difficult to visually assess the true extent of cracking, and of course the nature of propagation
through the internal core of the filter cakes will determine permeability. Figure 96 below shows
these cracks in greater detail, along with photographs of a repeat run.

205
Figure 96: Photographs of cracking at the surface and underside for 80% L15 / 100 g calcium carbonate / 600 ml DI / Full settling / 2.5 bar
for repeated runs
As can be seen, repeatability can be very good and the same geometry of crack formation is often
repeated, in this case propagating in a near identical form down to the filter medium.
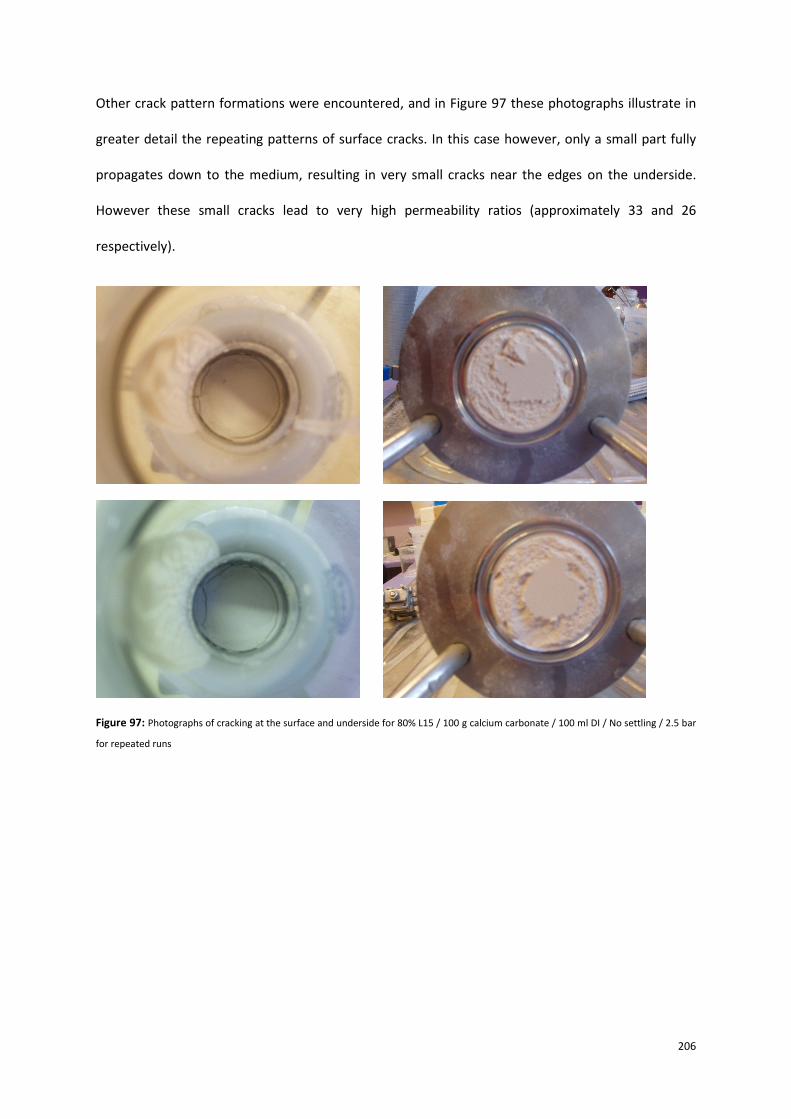
206
Other crack pattern formations were encountered, and in Figure 97 these photographs illustrate in
greater detail the repeating patterns of surface cracks. In this case however, only a small part fully
propagates down to the medium, resulting in very small cracks near the edges on the underside.
However these small cracks lead to very high permeability ratios (approximately 33 and 26
respectively).
Figure 97: Photographs of cracking at the surface and underside for 80% L15 / 100 g calcium carbonate / 100 ml DI / No settling / 2.5 bar
for repeated runs

207
Figure 98: Photographs of cracking at the surface for 100% L15 / 100 g calcium carbonate / 100 ml DI / Full settling / 2.5 bar for repeated
runs
Figure 98 illustrates a type of crack sometimes encountered, where a ‘bullethole’ type mark is seen
at the top surface, near the containment wall. These are typically seen with a high mass fraction of
L15 and high concentration systems, and are associated with curved cracks that run close to the
perimeter of the top surface. They are seen with both overnight settling and zero settling, and
indicate an intense densification resulting from a local structural collapse. In this example the
collapse is explicit, it being on the surface of the filter cake itself. It is seen with high concentration
systems, which are associated with lower particle relaxation time and a looser packing. Here, the
breaking of flocs will be more calamitous, as the maximum potential change to volume fraction will
be larger.

208
The mechanisms and dynamics of crack propagation in other contexts are of great interest in the
understanding of filter cake cracking. Due to the configuration of the filtration rig used for the
experiments of this thesis, crack tip tracking was not possible for small and midsize cakes. However,
for tall filter cakes it was possible to view the movements of a crack through the glass containment
walls. Typically these would start a few millimetres below the top surface of the filter cake coinciding
with air breakthrough at the filter medium, and propagate downwards uninterrupted. Due to the
limitations described above, it cannot be confirmed how lower surface crack patterns were formed.
‘En passant’ crack patterns are formed through the interaction between two approaching cracks210.
They have been found in numerous contexts, from dental enamel to geological faults, where the
complex curvature and stress geometries result in these characteristic fracture paths. In the studies
by Fender et al.210, the cracks track in approximately parallel opposing paths, and following the
passing of the crack tips along a theoretical perpendicular line, each leading point moves towards
the other path’s trail, carving out a lenticular fragment. Though a universal occurrence, this curved
fragmentation seen in other contexts was not seen to be a failure mode of any of the parameter sets
studied as part of this thesis. Figure 99 illustrates cracks propagating outwardly, perpendicular to a
mainline crack.

209
Figure 99: Photographs of cracking at the surface for 80% L15 / 80 g calcium carbonate / 80 ml DI / Zero settling / 2.5 bar for repeated
runs
There have been numerous studies in crack spacing between cracks, with the frequent assumption
of a balance between elastic energy released and the energy required to create new surface, one
resulting prediction being that crack spacing scales with film thickness. Lee et al.211, in their study of
drying dispersions, postulated a scale relating to the distance a solvent can flow in order to relieve
capillary stress as film failure occurs. With drying dispersions, the meniscus of the interface between
particles gives a capillary pressure in the fluid below atmospheric. Atmospheric pressure pushing on
the surface places the film in compression. They postulated that once a material yields, the capillary
pressure is eliminated in the vicinity of the crack, causing a flow of solvent towards regions of lower
pressure within the bulk. It is the distance of this flow that determines crack spacing. The capillary
pressure - which is negative - acts on the face of the crack, pulling it apart. The capillary stress
approaches zero on the crack face as it opens up, but it is large and negative in the bulk, hence fluid
flow from the crack to the inner region. The distance the fluid can flow sets the crack spacing212 .

210
Dragnevski et al.213, studying drying dispersions of polymer particles, found from their ESEM images
that a crack did not propagate in a straight line, instead following a path of defects within the
particle packing. This was further investigated with the rewetting and healing of the crack, and upon
re-drying, the same crack patterns formed, indicating that defects within the packing are retained.
Their crack tip imaging showed film rupture occurring at the surface, and propagating towards the
substrate as the crack moved forwards. Also noted were some small interrupted cracks that ran
parallel to the main crack.
Numerous crack modes have been encountered in colloidal drying studies, two of interest being
‘jumping cracks’ and ‘mud cracks’. The former are seen in consolidated regions where the centre is
still saturated, and the latter occur when the entire film is consolidated. In the early drying stages,
the compressive stress on the network of particles at the edges is determined by solvent flow
through these particles, and hence is dependent on the permeability of this array. A balance
between compression and film strength, the latter derived from interparticle interactions, will
determine the likelihood of jumping cracks. The flow of solvent through the packed region is to
provide solvent to the film surface where evaporation is taking place. Continued evaporation draws
liquid from the bulk solution (which acts as a reservoir), in what can be thought of as Darcian
replenishment. This outward flux brings particles to the consolidated region, and there is a pressure
drop associated with this flow, its magnitude dependent on the permeability of the compacted
region (itself determined by particle size and packing). As such there will be a critical stress at which
cracking will occur. When pressure generated by the flow is sufficient to cause cracking, jumping
cracks may be found, liberating water and relieving pressure. Upon further evaporation, capillary
pressure will rise again, and further jumps will occur. As the excess solvent liberated by the crack
flows into the bulk, there is an associated time period, hence the stagewise nature of these jumps.
Conversely, if the pressure generated is insufficient, jumping cracks will not occur. However, once
the entire film has been compacted and the supersaturated region extinct, horizontal drying will

211
cease. Evaporation will cause a spatially uniform capillary pressure and if this reaches a critical value,
non-intermittent cracks will propagate throughout the film, and these are mud cracks.
From the experimental results of this thesis, coupled with an understanding of the development of a
shrinkage profile due to the constraining of the filter cake at the medium and the PSD profile that
develops due to sedimentation effects, it can be reasoned that crack spacing is determined by the
degree of shrinkage. Hence, with larger fractions of L15, and the associated increase in particle
movability and shrinkage at the top of the filter cake, there is greater potential for outward
movement towards the containment walls upon the elastic energy release from crack formation. As
seen in the experiments in Section 4.3 focussing on the effects of filtration pressure, with increased
pressure application and the achievement of a maximum packing density, this potential for outward
lateral motion is minimised or removed.
The reason for the site of crack initiation often being near the top of the filter cake may be explained
by the theory regarding failure of flocs discussed in Section 4.1. With the development of a porosity
profile due to compressibility effects, the expectation is that the finer pores formed will be in the
lower reaches of the filter cake, with the smallest pores being adjacent to the filter medium.
However, these theoretical illustrations do not consider wide particle size distributions, where
sedimentation effects will be significant. In the practical dispersions used, coarse particles will settle
to the bottom of the filter cake, and the smaller particles of the dispersion will be higher in the body
of the filter cake. The large capillary pressures associated with these fine pores near the surface may
lead to the initiation of a crack network.

212
8 Conclusions and future work
8.1 Conclusions
The research of this thesis investigating the occurrence of filter cake cracking shows that it can be
influenced and in some cases eliminated through careful control of key input parameters, such as
initial slurry concentration, settling time, filter cake aspect ratio, fine particulate content, filtration
pressure, temperature, surfactant addition, surface tension and viscosity of the suspending solvent.
Historically this phenomenon has been managed in industry as an undesired occurrence that is
stochastic in nature, its understanding being rooted in a heavy reliance on anecdotal evidence. This
perceived randomness in particular has been burdensome to the understanding of this problem,
with some even postulating contamination by foreign material being the cause on each occasion.
The insight acquired from the research conducted as part of this thesis shows that filter cracking is
actually a result of specific repeatable mechanisms. Trends are seen, and whilst most trends
regarding permeability ratio were linear, even when anomalies were seen (such as the dips seen in
Figure 64), these same patterns were repeated across different mass fractions of fine particles i.e.
these dips were reproducible trends, not outliers. Additional to this, repeatability is very good, and it
is shown that the event of crack occurrence and the degree of cracking may even be predicted.
Whilst not an absolute constancy, crack patterns seen were also reproducible, giving further insight
into the mechanisms of crack formation.
From the experiments based on aqueous systems, it can be seen that concentration and settling
times play a large role in filter cake cracking. If carefully controlled such that segregation into two
layers occurs, then the separation and shielding of flocs within a coarse layer can avoid the structural
collapse of local particle networks that results in cracking.
Filter cake height is also found to influence the occurrence of filter cake cracking. This is mainly due
to sidewall friction effects, which result in losses in transmitted pressure, whilst introducing density

213
fluctuations and inhomogeneity. Though rarely unity due to frictional losses at the containment
walls, transmitted pressure losses can sometimes be compensated by an increased applied pressure.
Ultimately, filter cake cracking can be minimised and eliminated with an increase in filtration
pressure, the effect being that this increased pressure application can push towards a maximum
packing density and a greater tensile strength. An additional mechanism introduced with an increase
in pressure is that of a pre-deformation of flocs whilst still in a fully saturated state, and further to
this a reduction of lateral shrinkage potential is also achieved.
Dispersion and filtration temperature are seen to have an influence on surface charge density, which
affects flocculation tendency and the likelihood of filter cake cracking. It is a non-linear relationship
due to the complex nature of the ionic species involved, specific to each suspension. It was noted
from these experiments that cracking was observed at room temperature, where zeta potential is at
its lowest and agglomeration most likely, reinforcing the theory that in some cases it is the breaking
of the weak bonds associated with flocs that results in filter cake cracking. This delicate balance
between compressive forces and surface charge density points to further areas of investigation
around the optimum stability of electrostatic repulsive interactions and the mediation of these
forces.
The experiments focusing on material properties centred on those of the suspending liquid. The
utilisation of a solvent with a lower surface tension reduces cracking likelihood, which reconciles
with a reduction in capillary pressure. When solvents with high surface tensions are utilised, larger
capillary forces are generated, and the resulting stresses i.e. the internal forces exerted on a particle
by neighbouring particles, can lead to cracking. This does not fully reconcile with the notion that the
increased tensile strength that accompanies such large capillary forces can lead to the reduction and
elimination of filter cake cracking. This is only permissible if the increase in tensile strength is
achieved through other mechanisms, such as a greater applied filtration pressure where the particle
structure approaches a maximum packing density. It instead suggests that the surface tension
214
influence relates more directly to the Laplace hydrostatic pressure component. The direct influence
of surface tension is further evidenced from studies where filter cakes were pre-formed with an
initial solvent and deliquored with a secondary solvent. The properties of the latter were seen to be
academically of greater significance, the disparities being ascribed to surface tension changes.
A solvent of increased viscosity results in the formation of liquid bridges that retain the viscous
component, resulting in a dynamic contribution to the capillary bridge force. This may reduce or
even remove the likelihood of filter cake cracking, however even following liquid bridge rupture,
solvent is retained on the particle surface, resulting in a high residual moisture content.
The main finding from the studies of solutions of DI with surfactant addition is that it further
reinforces the assertion of a reduced cracking probability due to a surface tension influence.
However, this is complicated by numerous ancillary effects such as surfactant precipitation and the
influence of micelle formation, resulting in an accumulation of curved sheets with some parameter
sets.
An important finding from this research is that filter cake cracking is not a stochastic process, as
historically and anecdotally thought. Trends are seen and repeatability is very good. It is found that
the newly defined parameter of ‘Permeability ratio’ is an excellent indicator of the occurrence (or
non-occurrence) of the event of filter cake cracking, as well as defining the degree of cracking when
it does occur.
What determines the extent of filter cake cracking is difficult to elucidate due to the degree of
branching and the fragmentary nature of the cracks that form, however it seems to be governed by
two distinct parameters; the maximum potential for outward lateral motion (bounded by the
containment walls) and the maximum collapsibility of the large flocs in a dispersion. The former is
determined by the lateral shrinkage potential, and the latter by the size of the flocs and their
proximity to the surface of the filter cake.
215
It is the corralling of information and trends observed from such disparate disciplines as powder
compaction and colloidal films that help bolster the understanding of the nature and causation of
filter cake cracking.

216
8.2 Future work
Further research is required to build on the foundation laid by this study and the research that has
come before it, to provide a fuller and more robust understanding of filter cake cracking. Based on
the findings of this thesis, the following areas are recommended for future research.
Further investigation into the repulsive behaviour between particles i.e. the balance between a
repulsion great enough to avoid flocculation and a repulsion small enough such that the applied
pressure can overcome this barrier to push the particles together and form a contiguous network
capable of transmitting stresses.
The study of the formation of a skin at the filter medium when using materials of high
compressibility is an interesting area of research in itself. The additional challenges that will be
encountered, with regards to pressure distribution and the stark contrast between the degree of
particle compression near the filter medium and near the filter cake surface, may give additional
insight into the event of filter cake cracking.
Investigation into the use of different filter media will be an interesting area of research. The size of
the pores of the filter medium will affect convective transport, becoming a determining factor as to
whether or not segregation will occur when filtering dilute systems.
Finally, the investigation of filter cake cracking using other solid materials is recommended. Each
material will bring changes in particle shape, surface charge density and surface terrain. For the
former, unique shapes such as platelets and needles can give further insight into the structure of a
filter cake and its ability to withstand filter cake cracking. Particle shape in particular will be affected
by the mode of sedimentation i.e. settling in a moving body or a static body of fluid, as the drag
forces will influence the alignment of the particles.
217
References
1 Tien C. Introduction to Cake Filtration – Analyses, Experiments and Applications. New York: Elsevier B.V;
2006.
2 Ullmann’s Encyclopaedia of Industrial Chemistry. Weinheim: Wiley-VCH; 2009.
3 Holdich RG. Fundamentals of Particle Technology. Shepshed: Midlands Information Technology and
Publishing; 2002.
4 Svarovsky L. Solid-Liquid Separation. Fourth edition. London: Butterworth Heinemann; 2000.
5 Coulson JM, Harker JH, Backhurst, JR. Coulson & Richardson’s Chemical Engineering Vol 2. Particle
Technology & Separation Processes. Fifth edition. Oxford: Butterworth Heinemann; 2002.
6 Friedmann T, Lustenberger C, Windhab EJ. Filtration experiments with compressible filter cakes in centrifugal
fields with superimposed static pressure. International Journal of Mineral Processing. 2004; 73: 261-267.
7 Darcy H. Les fontaines publiques de la ville de Dijon. Exposition et application des principes a suivre et des
formules a employer dans les questions de distribution d’eau ouvrage termine par un appendice relative aux
fournitures d’eau de plusieurs villes au filtrage des eaux et al la fabricacion des tuyaux de fonte, de plomb, de
tole et de bitumen. Paris: 1856.
8 Carman PC. Fundamental principles of industrial filtration (a critical review of present knowledge)
Transactions of the Institute of Chemical Engineers. 1938; 16: 168-188.
9 Carman PC. Fluid flow through granular beds. Transactions of the Institute of Chemical Engineers. 1937; 15:
150-166.
10 Grace HP. Resistance and compressibility of filter cakes Pt I. Chemical Engineering Progress. 1953; 49 (6):
303-318.
11 Grace HP. Resistance and compressibility of filter cakes Pt II: Under conditions of pressure filtration.
Chemical Engineering Progress. 1953; 49 (7): 367-377.
12 Tiller FM. The role of porosity in filtration I: numerical methods for constant rate and constant pressure
filtration based on Kozeny’s law. Chemical Engineering Progress. 1953; 49: 467-479.
218
13 Tiller FM. The role of porosity in filtration Part 2: Analytical equations for constant rate filtration. Chemical
Engineering Progress. 1955; 51 (6): 282 -290.
14 Tiller FM. The role of porosity in filtration Part 3: Variable pressure – Variable rate filtration. American
Institute of Chemical Engineers. 1958; 4(2): 170-174.
15 Tiller FM, Cooper HR. The role of porosity in filtration: IV Constant pressure filtration. American Institute of
Chemical Engineers. 1960; 6 (4): 595-601.
16 Tiller FM, Cooper H. The role of porosity in filtration: Part V. Porosity variation in filter cakes. American
Institute of Chemical Engineers. 1962; 8 (4): 445-449.
17 Tiller FM, Shirato M. The role of porosity in filtration: VI. New definition of filtration resistance. American
Institute of Chemical Engineers. 1964; 10 (1): 61-67.
18 Tiller FM, Haynes Jr S, Lu WM. The role of porosity in filtration: Part VII. Effect of side wall friction in
compressibility-permeability cells. American Institute of Chemical Engineers. 1972; 18 (1): 13-20.
19 Tiller FM, Lu WM. The role of porosity in filtration: Part VIII. Cake non-uniformity in compression-
permeability cells. American Institute of Chemical Engineers. 1972; 18 (3): 569-572.
20 Tiller FM, Green TC. Role of porosity in filtration IX. Skin effect with highly compressible materials. American
Institute of Chemical Engineers Journal. 1973; 19 (6): 1266-1269.
21 Tiller FM, Yeh CS. The role of porosity in filtration Part X: deposition of compressible cakes on external
radial surfaces. American Institute of Chemical Engineers Journal. 1985; 31 (8): 1241–1248.
22 Tiller FM, Yeh CS. The role of porosity in filtration Part XI: Filtration followed by expression. American
Institute of Chemical Engineers Journal. 1987; 33 (8): 1241–1256.
23 Tiller FM, Hsyung NB, Cong DZ. Role of porosity in filtration: XII. Filtration with sedimentation. American
Institute of Chemical Engineers Journal. 1995; 41 (5): 1153-1164.
24 Tiller FM, Kwon JH. Role of porosity in filtration: XIII. Behaviour of highly compactible cakes. American
Institute of Chemical Engineers Journal. 1998; 44 (10): 2159-2167.
219
25 Ruth BF, Montillon GH, Montanna RE. Studies in filtration Part I: Critical analysis of filtration theory.
Industrial and Engineering Chemistry. 1933; 25 (1): 76-82.
26 Ruth BF, Montillon GH, Montanna RE. Studies in filtration II – Fundamental axiom of constant pressure
filtration. Industrial and Engineering Chemistry. 1933; 25 (2): 153-161.
27 Ruth BF. Studies in filtration III. Derivation of general filtration equations. Industrial and Engineering
Chemistry. 1935; 27 (6): 708-723.
28 Ruth BF. Studies in filtration Part IV: Nature of fluid flow through filter septa and its importance in the
filtration equation. Industrial and Engineering Chemistry. 1935; 27 (7): 806-816.
29 Almy C, Lewis WKJ. Factors determining the capacity of a filter press. The Journal of Industrial and
Engineering Chemistry. 1912; 4: 528-532.
30 Sperry DR. The principles of filtration. Metallurgical and Chemical Engineering. 1916; 15 (4): 198-203.
31 Sperry DR. Principles of filtration II. Metallurgical and Chemical Engineering. 1917; 17: 161-165.
32 Baker FP. A study of the fundamental laws of filtration using plant scale equipment. The Journal of Industrial
and Engineering Chemistry. 1921; 13 (7): 610-612.
33 Hinchley JW, Ure SGM, Clarke BW. Studies in filtration. Transactions of the Institute of Chemical Engineers.
1925; 3: 24-38.
34 Vorobiev E. Derivation of filtration equations incorporating the effect of pressure redistribution on the cake
medium interface: A constant pressure filtration. Chemical Engineering Science. 2006; 61: 3686-3697.
35 Tien C, Bai R. An assessment of the conventional cake filtration theory. Chemical Engineering Science. 2003;
58: 1323-1336.
36 Shirato M, Sambuichi M, Kato H, Aragaki T. Internal flow mechanism in filter cakes. American Institute of
Chemical Engineers. 1969; 15 (3): 405-409.
37 Gallego-Juarez J.A, Elvira-Segura L, Rodriguez-Corral G. A power ultrasonic technology for deliquoring.
Ultrasonics. 2003; 41: 255-259.
220
38 Wakeman RJ, Smythe MC. Clarifying filtration of fine particle suspensions aided by electrical and acoustic
fields. Transactions of the Institution of Chemical Engineers. 2000; 78 (Part A): 125-135.
39 Le Roux M, Campbell QP, Watermeyer MS, de Oliviera S. The optimization of an improved method of fine
coal dewatering. Minerals Engineering. 2005; 18: 931-934.
40 Condie, D.J; Hinkel, M; Veal, C.J. Modelling the vacuum filtration of fine coal. Filtration and separation.
(October 1996) 825-834
41 Wu Y. An analysis of constant pressure filtration. Chemical Engineering Science. 1994; 49 (6): 831-836.
42 Koenders MA, Wakeman RJ. The initial stages of compact formation from suspensions by filtration.
Chemical Engineering Science. 1996; 51 (16): 3897-3908.
43 Christensen ML, Hinge M. The influence of creep on cake solid volume fraction during filtration of core-shell
particles. Colloids and Surfaces A: Physicochemical and Engineering aspects. 2008; 320: 227-232.
44 Konnur R. Methods for the rapid characterisation of dewaterability of particulate suspensions. International
Journal of Mineral Processing. 2006; 80: 79-87.
45 Fayed ME, Otten L. Handbook of Powder Science and Technology. Second edition. New York: Chapman and
Hall; 1997.
46 Sorensen BL, Wakeman RJ. Filtration characterisation and specific area measurement of activated sludge by
Rhodamine B adsorption. Water Research. 1995; 30 (1): 115-121.
47 Van Brakel J, Van Rooijen PH. Prediction of the air consumption when dewatering a filter cake obtained by
pressure filtration. Powder Technology. 1984; 40: 235-246.
48 Lin CL, Miller JD. Pore structure and network analysis of filter cake. Chemical Engineering Journal. 2000; 80:
221-231.
49 Lin CL, Miller JD. Network analysis of filter cake pore structure by high resolution X-ray microtomography.
Chemical Engineering Journal. 2000; 77: 79-86.
50 Blake FC. The resistance of packing to fluid flow. Transactions of the American Institute of Chemical
Engineers. 1922; 14: 415-421.

221
51 Poiseuille JL. Recherches experimentales sur le movement des liquids dans les tubes de tres petits
diametres. Comptes Rendus de l’Academie des Sciences. 1840; 11.
52 Willis MS, Shen M, Gray KJ. Investigation of the fundamental assumptions relating compression
permeability data with filtration. The Canadian Journal of Chemical Engineering. 1974; 52: 331-337.
53 Willis MS, Tosun I. A rigorous cake filtration theory. Chemical Engineering Science. 1980; 35: 2427-2438.
54 Christensen GL, Dick RI. Specific resistance measurements: Non-parabolic data. Journal of Environmental
Engineering. 1985; 111 (3): 243-257.
55 Chase GG, Willis MS. Compressive cake filtration. Chemical Engineering Science. 1992; 47 (6): 1373-1381.
56 Willis MS, Collins RM, Bridges WG. Complete analysis of non-parabolic filtration behaviour. Chemical
Engineering Research and Design. 1983; 61: 96-109.
57 Tiller FM, Chow R, Weber W, Davies O. Clogging phenomena in the filtration of liquefied coal. Chemical
Engineering Progress. 1981; 77: 61-68.
58 Yim S-S, Kwon Y-D. A unified theory on solid-solid separation: Filtration, expression, sedimentation,
filtration by centrifugal force, and cross flow filtration. Korean Journal of Chemical Engineering. 1997; 14 (5):
354-358.
59 Yim S-S, Kim J-H. An experimental and theoretical study on the initial period of cake filtration. Korean
Journal of Chemical Engineering. 2000; 17 (4): 393-400.
60 Yim S-S, Kwon Y-D, Kim H-I. Effects of pore size, suspension concentration, and pre-sedimentation on the
measurement of filter medium resistance in cake filtration. Korean Journal of Chemical Engineering. 2001; 18
(5): 741-749.
61 Foley G. A review of factors affecting filter cake properties in dead end microfiltration of microbial
suspensions. Journal of Membrane Science. 2006; 274: 38-46.
62 Koenders MA, Wakeman RJ. Filter cake formation from structured suspensions. Transactions of the
Institution of Chemical Engineers. 1997; 75 (Part A): 309-320.

222
63 Underwood AJV. A critical review of published experiments on filtration. Jubilee Supplement –Transactions
of the Institution of Chemical Engineers. 1997; 75: S9-S31.
64 Walker WH, Lewis WK, McAdams WH, Gilliland ER. Principles of Chemical Engineering. New York: McGraw-
Hill; 1924.
65 Tien C, Teoh SK, Tan RBH. Cake filtration analysis – the effect of the relationship between the pore liquid
pressure and the cake compressive stress. Chemical Engineering Science. 2001; 56: 5361-5369.
66 Tien C. Cake filtration research – a personal view. Powder Technology. 2002; 127: 1-8.
67 Rietema K. Science and technology of dispersed two-phase systems I and II. Chemical Engineering Science.
1982; 37: 1125-1150.
68 Besra L, Singh BP, Reddy PSR, Sengupta DK. Influence of surfactants on filter cake parameters during
vacuum filtration of flocculated iron ore sludge. Powder Technology. 1998; 96: 240-247.
69 Gregory J. The action of polymeric flocculants. Flocculation, sedimentation and consolidation. National
Science Foundation. 1985; 125-137.
70 Everett DH. Basic Principles of Colloid Science. Cambridge: Royal society of chemistry; 1992.
71 Shaw DJ. Introduction to Colloid and Surface Chemistry. Fourth edition. Oxford: Butterworth Heinemann;
1992.
72 Israelachvili, J. Intermolecular and Surface Forces. Third edition. Burlington: Elsevier Academic Press; 2011.
73 Koenders MA, Reymann S, Wakeman RJ. The intermediate stage of the dead-end filtration process.
Chemical Engineering Science. 2000; 55: 3715-3728.
74 Cabane B, Meireles M, Aimar P. Cake collapse in frontal filtration of colloidal aggregates: mechanisms and
consequences. Desalination. 2002; 146: 155-161.
75 Rodriguez R, Araujo M. Temperature and pressure effects on zeta potential values of reservoir minerals.
Journal of Colloid and Interface Science. 2006; 300: 788-794.

223
76 Hulston J, de Kretser RG, Scales PJ. Effect of temperature on the dewaterability of hematite suspensions.
International Journal of Mineral Processing. 2004; 73: 269-279.
77 Hwang K-J, Liu H-C, Lu W-M. Local properties of cake in cross-flow microfiltration of submicron particles.
Journal of Membrane Science. 1998; 138: 181-192.
78 McDonogh RM, Welsch K, Fane AG, Fell CJD. Incorporation of the cake pressure profiles in the calculation of
the effect of particle charge on the permeability of filter cakes obtained in the filtration of colloids and
particulates. Journal of Membrane Science. 1992; 72: 197-204.
79 Bowen WR, Jenner F. Dynamic ultrafiltration model for charged colloidal dispersions: a Wigner-Seitz cell
approach. Chemical Engineering Science. 1993; 50: 1707-1736.
80 Bowen WR, Mongruel A, Williams PM. Prediction of the rate of cross-flow membrane ultrafiltration: a
colloidal interaction approach. Chemical Engineering Science. 1996; 51 (18): 4321-4333.
81 Koenders MA, Wakeman RJ. Initial deposition of interacting particles by filtration of dilute suspensions.
American Institute of Chemical Engineers. 1997; 43: 946-958.
82 Wakeman R. The influence of particle properties on filtration. Separation and Purification Technology. 2007;
58: 234-241.
83 Lange-Kristiansen K, Wouterse A, Philipse A. Simulation of random packing of binary sphere mixtures by
mechanical contraction. Physica A. 2005; 358: 249-262.
84 Thies-Weesie DME, Philipse AP. Liquid permeation of bidisperse colloidal hard-sphere packings and the
Kozeny-Carman scaling relation. Journal of Colloid and Interface Science. 1994; 162: 470-480.
85 He D, Ekere NN, Cai L. Computer simulation of random packing of unequal particles. Physical Review E.
1999; 60 (6): 7098-7104.
86 Mansfield ML, Rakesh L, Tomalia DA. The random packing of spheres on spheres. Journal of Chemical
Physics. 1996; 105: 3245-3249.
87 Gonzalez-Tello P, Camacho F, Vicaria JM, Gonzalez PA. A modified Nukiyama-Tanasawa distribution function
and a Rosin-Rammler model for the particle size distribution analysis. Powder Technology. 2008; 186: 278-281.

224
88 Ramakrishnan KN. Modified Rosin-Rammler equation for describing particle size distribution of milled
powders. Journal of Materials Science Letters. 2000; 19: 1903-1906.
89 Rosin P, Rammler E J. The laws governing the fineness of powdered coal. Institute Fuel. 1933; 7: 29-36.
90 Lu W-M, Lai C-C, Hwang K-J. Constant pressure filtration of submicron particles. Separation Technology.
1995; 5: 45-53.
91 Lu W-M, Hwang K-J. Mechanism of cake formation in constant pressure filtrations. Separation Technology.
1993; 3: 122-132.
92 Yim S. A theoretical and experimental study on cake filtration with sedimentation. Korean Journal of
Chemical Engineering. 1999; 16: 308-315.
93 Richardson JF, Zaki WN. The sedimentation of a suspension of uniform spheres under conditions of viscous
flow. Chemical Engineering Science. 1954; 8: 65-78.
94 Kynch GJ. A theory of sedimentation. Membrane Processes. 1951; 166-176.
95 Bockstal F, Fouarge L, Hermia J, Rahier G. Constant pressure cake filtration with simultaneous
sedimentation. Filtration & Separation. 1985; July/August: 255-257.
96 Sorensen PB, Christensen JR, Bruus JH. Effect of small scale solids migration in filter cakes during filtration of
wastewater solids suspensions. Water Environment Research. 1995; 67 (1): 25-32.
97 Novak JT, Goodman G, Pairoo A, Huang J-C. The blinding of sludges during filtration. Journal Water Pollution
Control Federation. 1988; 60 (2): 206-214.
98 Notebaert FF, Wilms DA, Van Haute AA. A new deduction with a larger application of specific resistance to
filtration of sludges. Water Research. 1973; 9: 667-673.
99 Hwang K-J, Wu Y-S, Lu W-M. The surface structure of cake formed by uniform-sized rigid spheroids in cake
filtration. Powder Technology. 1996; 87: 161-168.
100 Wakeman RJ, Sabri MN, Tarleton ES. Factors affecting the formation and properties of wet compacts.
Powder Technology. 1991; 65: 283-292.

225
101 Shirato M, Aragaki T, Mori R, Sawamoto K. Predictions of constant pressure and constant rate filtrations
based upon an approximate correction for sidewall friction in compression-permeability cell data. Journal of
Chemical Engineering of Japan. 1968; 1 (1): 86-90.
102 Shirato M, Aragaki T, Ichimura K, Ootsuji N. Porosity variation in filter cake under constant pressure
filtration. Journal of Chemical Engineering of Japan. 1971; 4 (2): 172-177.
103 Lu WM, Huang Y-P, Hwang K-J. Stress distribution in a confined wet cake in the compression-permeability
cell and its application. Powder Technology. 1998; 97: 16-25.
104 Briscoe BJ, Rough SL. The effects of wall friction in powder compaction. Colloids and Surfaces A:
Physicochemical and Engineering Aspects. 1998; 137: 103-116.
105 Sorensen PB, Moldrup P, Hansen JAA. Filtration and expression of compressible cakes. Chemical
Engineering Science. 1996; 51 (6): 967-979.
106 Fathi-Najafi M, Theliander H. Determination of local filtration properties at constant pressure. Separations
Technology. 1995; 5: 165-178.
107 La Heij EJ, Kerkhof PJAM, Herwijn AJM, Coumans WJ. Fundamental aspects of sludge filtration and
expression. Water Research. 1996; 30 (3): 697-703.
108 Hamley IW. Introduction to Soft Matter. Chichester: Wiley; 2000.
109 Goodwin J. Colloids and Interfaces with Surfactants and Polymers: An Introduction. Chichester: Wiley;
2004.
110 Bresler MR, Hagen JP. Surfactant adsorption: A revised physical chemistry lab. Journal of Chemical
Education. 2008; 85 (2): 269-271.
111 Mitropoulos. What is surface excess? Journal of Engineering Science and Technology Review. 2008; 1-3.
112 Cosgrove T. Colloid Science: Principles, Methods and Applications. Second edition. Hoboken: Wiley; 2010.
113 Wakeman RJ, Tarleton TS. Filtration: Equipment selection modelling and process simulation. Burlington:
Elsevier Science; 1998.

226
114 Nenniger E, Storrow JA. Drainage of packed beds in gravitational and centrifugal force fields. American
Institute of Chemical Engineering Journal. 1958; 4 (3): 305-316.
115 Kool JB, Parker JC, Van Genuchten MT. Parameter estimation for unsaturated flow and transport models –
review. Journal of Hydrology. 1987; 91: 255-293.
116 Wakeman RJ. Vacuum dewatering and residual saturation of incompressible filter cakes. International
Journal of Mineral Processing. 1976; 3: 193-206.
117 Carleton AJ, Salway AG. Dewatering of cakes. Filtration & Separation. 1993; November: 641-646.
118 Pyarak-Nolte LJ, Nolte DD, Chen D, Giordano NJ. Relating capillary pressure to interfacial areas. Water
Resources Research. 2008; 44: 1-14.
119 Ho CK, Webb SW. Theory and Applications of Transport in Porous Media: Gas Transport in Porous Media.
New York: Springer; 2006.
120 Asmatulu R. Improving the dewetability characteristics of hydrophobic fine particles by air bubble
entrapments. Powder Technology. 2008; 186: 184-188.
121 Deinert MR, Dathe A, Parlange J-Y, Cady KB. Capillary pressure in a porous medium with distinct pore
surface and pore volume fractal dimensions. Physical Review. 2008; 77: 1-3.
122 Cheng J-T, Pyarak-Nolte LJ, Nolte DD, Giordano NJ. Linking pressure and saturation through interfacial
areas in porous media. Geophysical Research Letters. 2004; 31: 1-4.
123 Brooks RH, Corey AT. Hydraulic Properties of Porous Media. Hydrology paper No 3. Colorado: Colorado
state university; 1964.
124 Hosten C, San O. Reassessment of correlations for the dewatering characteristics of filter cakes. Minerals
Engineering. 2002; 15: 347-353.
125 Brownell LE, Katz DL. Flow of fluids through porous media: I. Single homogeneous fluids. Chemical
Engineering Progress. 1947; 43: 537-548.
126 Wakeman RJ. The performance of filtration post treatment processes. 1: The prediction and calculation of
cake dewatering characteristics. Filtration & Separation. 1979; 16: 655-669.
227
127 Hosten C, Sastry KVS. Empirical correlations for the prediction of cake dewatering characteristics. Minerals
Engineering. 1989; 2: 111-119.
128 Rhodes M. Introduction to Particle Technology. Second edition. Hoboken: Wiley; 2008.
129 Kralchevsky PA, Denkov ND. Capillary forces and structuring in layers of colloid particles. Current Opinion
in Colloid and Interface Science. 2001; 6: 383-401.
130 Butt H-J, Kappl M. Normal capillary forces. Advances in Colloid and Interface Science. 2009; 146: 48-60.
131 Saez AE, Carbonell RG. The equilibrium and stability of menisci between touching spheres under the effect
of gravity. Journal of Colloid and Interface Science. 1990; 140 (2): 408-418.
132 Sirghi L, Nakagiri N, Sugisaki K, Sugimara H, Takai O. Effect of sample topography on adhesive force in
atomic force spectroscopy measurements in air. Langmuir. 2000; 16: 7796-7800.
133 Marmur A. Tip-surface capillary interactions. Langmuir. 1993; 9: 1922-1926.
134 de Lazzer A, Dreyer M, Rath HJ. Particle-surface capillary forces. Langmuir. 1999; 15: 4551-4559.
135 Stifter T, Marti O, Bhushan B. Theoretical investigation of the distance dependence of capillary and Van
der Waals forces in scanning force microscopy. Physical Review B. 2000; 62 (20): 667-673.
136 Megias-Alguacil D, Gauckler LJ. Capillary forces between two solid spheres linked by a concave liquid
bridge: Regions of existence and forces mapping. American Institute of Chemical Engineers Journal. 2009; 55:
1103-1109.
137 Mu F, Su X. Analysis of liquid bridge between spherical particles. China Particuology. 2007; 5: 420-424.
138 Lian GP, Thornton C, Adams MJ. A theoretical study of the liquid bridge forces between two rigid spherical
bodies. Journal of Colloid and Interface Science. 1993; 161: 138-147.
139 Willett CD, Adams MJ, Johnson SA, Seville JPK. Capillary bridges between two spherical bodies. Langmuir.
2000; 16: 9396-9405.
228
140 Yu AB, Feng CL, Zou RP, Yang RY. On the relationship between porosity and interparticle forces. Powder
Technology. 2003; 130: 70-76.
141 Feng CL, Yu AB. Effect of liquid addition on the packing of mono-sized coarse spheres. Powder Technology.
1998; 99: 22-38.
142 Feng CL, Yu AB. Quantification of the relationship between porosity and interparticle forces for the
packing of wet uniform spheres. Journal of Colloid and Interface Science. 2000; 231: 136-142.
143 Pietsch W, Hoffman E, Rumpf H. Tensile strength of moist agglomerates. I&EC Product Research and
Development. 1969; 8 (1): 58-62.
144 Pierrat P, Caram HS. Tensile strength of wet granular materials. Powder Technology. 1997; 91: 83-93.
145 Schubert H, Herrmann W, Rumpf H. Deformation behaviour of agglomerates under tensile stress. Powder
Technology. 1975; 11: 121-131.
146 Ozcan O, Ruhland M, Stahl W. The effect of pressure, particle size and particle shape on the shear strength
of very fine mineral filter cakes. International Journal of Mineral Processing. 2000; 59: 185-193.
147 Rushton A, Hameed MS. The effect of concentration in rotary vacuum filtration. Filtration & Separation.
1969; 6: 136-139.
148 Lloyd PJ, Dodds JA. Liquid retention in filter cakes. Filtration & Separation. 1972; Jan/Feb: 91-96.
149 Wakeman RJ. The role of internal stresses in filter cake cracking. Filtration & Separation. 1974; Jul/Aug:
357-360.
150 Anlauf H, Bott R, Stahl W, Krebber A. The formation of shrinkage cracks in filter cakes during dewatering of
fine sized ores. Aufbereitungs Technik. 1985; 26 (4): 188-196.
151 Gross H, Stahl W, Mueller H. The utilization of the matrix-filter-cloth for avoiding shrinkage cracks in filter
cakes. Filtech 89 conference; 1989: 502-509.
152 Wiedemann T, Stahl W. Experimental investigation of the shrinkage and cracking behaviour of fine
particulate filter cakes. Chemical Engineering and Processing. 1996; 35: 35-42.

229
153 Holmes DM, Tegeler F, Clegg WJ. Stresses and strains in colloidal films during lateral drying. Journal of the
European Ceramic Society. 2008; 28: 1381-1387.
154 Scherer GW. Theory of drying. Journal of the American Ceramic Society. 1990; 73: 3-14.
155 Chiu RC, Cima MJ. Drying of granular ceramic films: II, drying stress and saturation uniformity. Journal of
the American Ceramic Society. 1993; 76: 2769-2777.
156 Goehring L, Clegg WJ, Routh AF. Solidification and ordering during directional drying of a colloidal
dispersion. Langmuir. 2010; 26 (12): 9269-9275.
157 Chiu RC, Garino TJ, Cima MJ. Drying of granular ceramic films: I, effect of processing variables on cracking
behaviour. Journal of the American Ceramic Society. 1993; 76: 2257-2264.
158 Yow HN, Goikoetxea M, Goehring L, Routh AF. Effect of film thickness and particle size on cracking stresses
in drying latex films. Journal of Colloidal and Interface Science. 2010; 352: 542-548.
159 Carreras ES, Chabert F, Dunstan DE, Franks GV. Avoiding ‘mud’ cracks during drying of thin films from
aqueous colloidal suspensions. Journal of Colloid and Interface Science. 2007; 313: 160-168.
160 Zhao M-H, Fu R, Lu D, Zhang T-Y. Critical thickness of cracking of Pb(Zr0.53Ti0.47)O3 thin films deposited on
Pt/Ti/Si(100) substrates. Acta Materialia. 2002; 50: 4241-4254.
161 Wedin P, Martinez CJ, Lewis JA, Daicic J, Bergstrom L. Stress development during drying of calcium
carbonate suspensions containing carboxymethylcellulose and latex particles. Journal of Colloid and Interface
Science. 2004; 272: 1-9.
162 Wedin P, Lewis JA, Bergstrom L. Soluble organic additive effects on stress development during drying of
calcium carbonate suspensions. Journal of Colloid and Interface Science. 2005; 290: 134-144.
163 Laudone GM, Matthews GP, Gane PAC. Observation of shrinkage during evaporative drying of water-based
paper coatings. Industrial and Engineering Chemistry Research. 2004; 43: 712-719.
164 Job N, Sabatier F, Pirard J-P, Crine M, Leonard A. Towards the production of carbon xerogel monoliths by
optimizing convective drying conditions. Carbon. 2006; 44: 2534-2542.
230
165 Izumi M, Hayakawa K-I. Heat and moisture transfer and hygrostress crack formation and propagation in
cylindrical, elastoplastic food. International Journal of Heat and Mass Transfer. 1995; 38 (6): 1033-1041.
166 Bissonnette B, Pierre P, Pigeon M. Influence of key parameters on drying shrinkage of cementitious
materials. Cement and Concrete Research. 1999; 29: 1655-1662.
167 Yuan Y, Wan ZL. Prediction of cracking within early-age concrete due to thermal drying and creep
behaviour. Cement and Concrete Research. 2002; 32: 1053-1059.
168 Tasdemir MA, Tasdemir C, Akyuz S, Jefferson AD, Lydon FD, Barr BIG. Evaluation of strains at peak stresses
in concrete: A three-phase composite model approach. Cement and Concrete Composites. 1998; 20: 301-318.
169 Bremner TW. Influence of aggregate structure on low density concrete. PhD thesis. Imperial College of
science and technology, London; 1981.
170 Neville A, Aitcin P-C. High performance concrete – an overview. Materials and Structures / Materiaux et
constructions. 1998; 31: 111-117.
171 Schreyer Bennethum L, Murad MA, Cushman JH. Modified Darcy’s law, Terzaghi’s effective stress principle
and Fick’s law for swelling clay soils. Computers and Geotechnics. 1997; 20 (3 / 4): 245-266.
172 Sridharan A, Venkatappa Rao G. Mechanisms controlling volume change of saturated clays and the role of
the effective stress concept. Geotechnique. 1973; 23 (3): 359-382.
173 Bolt GH. Physico-chemical analysis of the compressibility of pure clays. Geotechnique. 1956; 6 (2): 86-93.
174 Bronswijk JJB. Prediction of actual cracking and subsidence in clay soils. Soil Science. 1989; 148 (2): 87-93.
175 Bronswijk JJB. Shrinkage geometry of a heavy clay soil at various stresses. Soil Science Society of America
Journal. 1990; 54: 1500-1502.
176 Bronswijk JJB. Modelling of water balance, cracking and subsidence of clay soils. Journal of Hydrology.
1988; 97: 199-212.
177 Yesiller N, Miller CJ, Inci G, Yaldo K. Desiccation and cracking behaviour of three compacted landfill liner
soils. Engineering Geology. 2000; 57: 105-121.

231
178 Yong RN, Warkentin BP. Soil Properties and Behaviour. Amsterdam: Elsevier; 1975.
179 Ruth BF. Correlating filtration theory with industrial practice. Industrial and Engineering Chemistry. 1946;
38 (6): 564-571.
180 Tari G, Ferreira JMF. Colloidal processing of calcium carbonate. Ceramics International. 1998; 24: 527-532.
181 Moulin P, Roques H. Zeta potential measurement of calcium carbonate. Journal of Colloid and Interface
Science. 2003; 261: 115-126.
182 Gal J-Y, Bollinger J-C, Tolosa H, Gache N. Calcium Carbonate solubility: a reappraisal of scale formation and
inhibition. Talanta. 1996; 43: 1497-1509.
183 Vazquez G, Alvarez A, Navaza JM. Surface tension of alcohol + water from 20 to 50 °C. Journal of Chemical
Engineering Data. 1995; 40: 611-614.
184 Gonzalez B, Calvar N, Gomez E, Dominguez A. Density, dynamic viscosity, and derived properties of binary
mixtures of methanol or ethanol with water, ethyl acetate, and methyl acetate at T = (293.15, 298.15, and
303.15) K Journal of Chemical Thermodynamics. 2007; 39: 1578-1588.
185 Wu T-Y, Chen BK, Hao L, Peng YC, Sun IW. Effect of temperature on the physico-chemical properties of a
room temperature ionic liquid (1-methyl-3-pentylimidazolium Hexafluorophosphate) with Polyethylene Glycol
oligomer. International Journal of Molecular Sciences. 2011; 12: 2598-2617.
186 Tang P, Puri VM. Percolation segregation model for similar and differing constituents. Particulate Science
and Technology. 2010; 28: 287-297.
187 Sinka IC, Cunningham JC, Zavaliangos A. The effect of wall friction in the compaction of pharmaceutical
tablets with curved faces: a validation study of the Drucker-Prager Cap model. Powder Technology. 2003; 133:
33-43.
188 Wu C-Y, Ruddy OM, Bentham AC, Hancock BC, Best SM, Elliott JA. Modelling of the mechanical behaviour
of pharmaceutical powders during compaction. Powder Technology. 2005; 152: 107-117.
189 Han LH, Elliott JA, Bentham AC, Mills A, Amidon GE, Hancock BC. A modified Drucker-Prager Cap model for
die compaction simulation of pharmaceutical powders. International Journal of Solids and Structures. 2008; 45:
3088-3106.
232
190 Wu C-Y, Hancock BC, Mills A, Bentham AC, Best SM, Elliott JA. Numerical and experimental investigation of
capping mechanisms during pharmaceutical tablet compaction. Powder Technology. 2008; 181: 121-129.
191 Derkaoui N, Said S, Grohens Y, Olier R, Privat M. PEG400 novel phase description in water. Journal of
Colloid and Interface Science. 2007; 305: 330-338.
192 Simons SJR, Seville JPK, Adams MJ. An analysis of the rupture energy of pendular liquid bridges. Chemical
Engineering Science. 1994; 49 (14): 2331-2339.
193 Ennis BJ, Li J, Tardos GI, Pfeffer R. The influence of viscosity on the strength of an axially strained pendular
liquid bridge. Chemical Engineering Science. 1990; 45 (10): 3071-3088.
194 Pitois O, Moucheront P, Chateau X. Liquid bridge between two moving spheres: An experimental study of
viscous effects. Journal of Colloid and Interface Science. 2000; 231: 26-31.
195 Vagharchakian L, Restagno F, Leger L. Capillary bridge formation and breakage: A test to characterize
antiadhesive surfaces. Journal of Physical Chemistry B. 2009; 113: 3769-3775.
196 Soontravanich S, Scamehorn JF. Relation of supersaturation ratio in mixed anionic surfactant solutions to
kinetics of precipitation with calcium. Journal of Surfactants and Detergents. 2010; 13: 1-11.
197 Zhang R, Somasundaran P. Advances in adsorption of surfactants and their mixtures at solid/solution
interfaces. Advances in Colloid and Interface Science. 2006; 123-126: 213-229.
198 Adamson AW, Gast AP. Physical Chemistry of Surfaces. Sixth edition. New York: Wiley; 1997.
199 Hunter RJ. Foundations of Colloid Science. Second edition. Oxford: Oxford University press; 2001.
200 Khatory A, Kern F, Lequeux F, Appell J, Porte G, Morie N, Ott A, Urbach W. Entangled versus multi-
connected network of wormlike micelles. Langmuir. 1993; 9: 933-939.
201 Lin Z. Branched wormlike micelles and their networks. Langmuir. 1996; 12: 1729-1737.
202 Drye TJ, Cates ME. Living networks: The roles of cross-links in entangled surfactant solutions. Journal of
Chemical Physics. 1992; 96 (2): 1367-1375.

233
203 Aswal VK, Goyal PS, Thiyagarajan P. Small Angle Neutron Scanning and viscosity studies of CTAB/NaSal
viscoelastic micellar solutions. Journal of Physical Chemistry B. 1998; 102: 2469-2473.
204 Hoffmann H, Ebert G. Surfactants, micelles and fascinating phenomena. Angnewandtde Chemie
International Edition in English. 1988; 27: 902-912.
205 Raghavan SR, Kaler EW. Highly viscoelastic wormlike micellar solutions formed by cationic surfactants with
long unsaturated tails. Langmuir. 2001; 17: 300-306.
206 Cates ME, Candau SJ. Statics and dynamics of worm-like surfactant micelles. Journal of Physics: Condensed
Matter. 1990; 2: 6869-6892.
207 Akratopulu KC, Kordulis C, Lycourghiotis A. Effect of temperature on the point of zero charge and surface
charge of TiO2. Journal of the Chemical Society, Faraday Transactions. 1990; 86 (20): 3437-3440.
208 Philip JR, de Vries DA. Moisture movement in porous materials under temperature gradients. Transactions
of the American Geophysical Union. 1957; 38: 222-232.
209 Grant SA, Bachmann J. Effect of temperature on capillary pressure. In Smiles: Heat and mass transfer in
the natural environment – a tribute to J.R. Philip. American Geophysical Society. Washington D.C; 2002.
210 Fender ML, Lechenault F, Daniels KE. Universal shapes formed by two interacting cracks. American
Physical Society. 2010; 105: 125505(1) – 125505(4).
211 Lee WP, Routh AF. Why do drying films crack? American Chemical Society Journal of Surfaces and Colloids.
2004; 20 (23): 9885-9888.
212 Lee WP, Routh AF. Temperature dependence of crack spacing in drying latex films. Industrial and
Engineering Chemistry Research. 2006; 45: 6996-7001.
213 Dragnevski KI, Routh AF, Murray MW, Donald AM. Cracking of drying latex films: An ESEM experiment.
Langmuir. 2010; 26 (11): 7747-7751.