experimental study of residual tensile strength of … glass or carbon fibers have got wide use in...
TRANSCRIPT
Experimental Study of Residual Tensile Strength of Drilled Composite
Girish D. Pandit*, Kaushal Prasad
Finolex Academy of Management and Technology, Ratnagiri, Maharashtra, 415612 Indian. *Corresponding author. Tel.: +917066128592; email: [email protected] Manuscript submitted January 4, 2017; accepted March 27, 2017. doi: 10.17706/ijmse.2017.5.1.35-46
Abstract: The work presented in this paper mainly focuses on machining of composites. In composite
materials, two or more constituents are combined at microscopic level to achieve required properties. The
constituents in composites are softer matrix and high strength fibers. The study for manufacturing
processes of composites is necessary because mechanical properties are dependent on these processes.
The machining process like drilling has effect on mechanical properties of composite materials. Though
curing process residual stresses are getting induced in the composite materials during their fabrication,
these stresses are not considered in this study. In this paper, the optimization of drilling parameters
(Cutting speed, Feed rate, Drill point angle, Chisel edge width) in drilling of CFRP composite specimen is
done using Taguchi method. The effect of variation of these parameters on residual tensile strength of
specimen and surface roughness of drilled hole is studied. The optimum parameter levels based on signal
to noise ratio plots are decided. The percentage contribution of each factor to the response is found out
by analysis of variance. Analysis of variance shows that, speed is the factor having major contribution
for the residual tensile strength followed by chisel edge width, drill point angle and feed rate. For the
surface roughness drill point angle has major contribution followed by speed, feed and chisel edge width.
Keywords: Analysis of variance, drilling, residual tensile strength, Taguchi method.
1. Introduction
The Composite materials are important, now a days, because these materials have performed role of
conventional solid metals in many applications in very efficient manner. The composites, which may
contain glass or carbon fibers have got wide use in automobile industry for making leaf springs, seats, body
panels etc. Composite materials are the combination of two or more constituent materials which gives
the final product to have properties, which are not identical to any of the constituent material. The
advantage of composite materials is that, they have higher strength and stiffness than conventional solid
materials for the same weight. The low weight of components made of composite materials is due to their
low density. Non-isotropic nature of composites makes it possible to tailor their properties according to
the design requirements. Due to which fiber orientation can be kept in the direction of major stresses. Aspect
ratio is a term defined as ratio of Length to diameter of a fiber. Continuous fibers have longer aspect ratios.
For the use of composite parts in various fields such as aircraft, space, automotive, sporting goods,
marine etc. they undergo manufacturing processes. At the same time these parts are to be assembled with
other body parts. Hence for assembly, drilling of composite parts is necessary. One among those composites
is carbon fiber reinforced plastic (CFRP) which has large application areas. The drilling operation causes
International Journal of Materials Science and Engineering
35 Volume 5, Number 1, March 2017

defects to the CFRP components in the form of delamination, micro-cracks, matrix burning, Fiber pull out
etc. [1]. The optimum machining parameters are required for minimum defects to the components in
drilling operation.
Because of the damage generated during such machining operations there is change in after machining
mechanical behavior of the composite product. R. A. Kishore et al. [1] studied drilling parameters to get
maximum after drilling tensile strength using the Taguchi method. The optimum levels of the drill point
geometry, the cutting speed and the feed rate have been determined. Drilling is the method which
accompanies 40% of all material removal processes. The drilling induced damage could be reduced with
the use of special drill bits. C. C. Tsao [2] conducted the drilling experiments with step-core drill to
investigate the thrust force. The delamination is related to the thrust force. The parameters taken were
diameter ratio, feed rate and spindle speed. Results shows that diameter ratio and feed rate have most
significant influence on thrust force. The geometrical parameters of drill have influence on the behavior
of drilled composites. The effect of all the forces acting on drill is represented by resisting torque and
thrust force. The action at the chisel edge is not truly a cutting action, but it is pushing action into material
like a wedge. The optimization of drilling parameters like cutting speed, feed, point angle and chisel edge
width in drilling of glass fiber reinforced polymer (GFRP) composites is done by Vinod Kumar Vankanti et
al. [3]. The aspects of the mathematical analysis and use of non- traditional methods in machining of
composites is reviewed by H. Hocheng et al. [4]. Among the various drill types twist drill causes larger
thrust force, but still it is most economical to use twist drills. As drilling induced thrust force increases
beyond critical thrust force the delamination occurs. The evaluation of delamination factor in drilling of
CFRP composites is done by C. C. Tsao et. al. with the use ultrasonic C-scan technique [5]. The technique of
acoustic emission for measurement of residual tensile strength of drilled composite was used by Navid
Zarif Karimi et al. [6]. This is most accurate method for determining mechanical properties of composite
materials. E. Kilickap [7] investigated the influence of the cutting parameters, such as cutting speed and
feed rate, and point angle on delamination produced when drilling a GFRP composite. There is concept of
‘Pooling’ in analysis of variance, which was referred from the study done by Prabodh B. Horambe et al. [8].
The results of first part of experimentation of the present work, which are to be continued in current
paper are given in Girish Pandit et al. [9]. The study of residual tensile strength after drilling in flax natural
fiber epoxy composite was done by Abdul Nasir, A. A. et al. [10]. And in this study, they found that feed rate
is the most significant parameter to affect the residual tensile strength.
2. Experimentation
2.1. CFRP Specimen and Cutting Tool
From the gaps observed in previous studies, it is decided to work on CFRP specimen which is
bi-directional fabric of carbon fiber and prepared by hand lay up using compression molding process. The
fiber orientation was kept at 0° and 90°. Phenolic resin bonding material was used. The specimen
specifications are given in Table 1.
Table 1. CFRP (Woven) Specimen Material Specification
Sr. No. Specification Value
1 Fiber orientation 0-90 degrees
2 Number of layers 8
3 Fiber strength 79
4 Fiber density 1.6 g/cm3
5 Resin density 1.15g/cm³ at 20°C
6 Fiber Volume fraction 6
International Journal of Materials Science and Engineering
36 Volume 5, Number 1, March 2017

The specimen geometry was taken as per the guidelines of ASTM D3039 standards as shown in Fig. 1.
The tools used for drilling process are HSS twist drills of 8mm diameter. The parameters and their levels
were decided after thorough literature survey and looking at their significance.
Fig. 1. Specimen geometry (As per ASTM D3039, all dimensions are in mm).
2.2. Experimental Set Up
The drilling was done on fully automatic 3-axis vertical milling machine of make BFW and model
BMV-40. The power rating of spindle motor is 3.7 KW and spindle speed range of 60-6000 rpm. The
machine has cutting feed rate range of 1-4000 mm/min. The geometry of specimen for drilling as per
ASTM D3039 is shown in Fig.1. For drilling experiments the four parameters having three levels each were
used. The process parameters taken were cutting speed and feed rate. Drill point angle and chisel edge
width were the geometrical parameters. The cutting speed was varied from 1500 to 2500 rpm while feed
rate values taken were 10, 15 and 20 mm/min. The drilling process on vertical milling machine is shown in
Fig. 2.
Fig. 2. Drilling process on vertical milling machine
3. Taguchi Method
A full factorial design results in large number of experiments. This full factorial design considers all the
possible combinations of factors and levels for the experiments. It is not practically possible every time to
conduct experiments for all possible combinations. So, in Taguchi method small set from all possible
combinations is taken and it is called as partial fraction experiment. Also Taguchi analysis provides special
set of general design guidelines for factorial experiments. Taguchi method gives following steps for
designing the experiments [1]: (1) establishment of objective function (2) identification of factors and
their levels (3) selection of appropriate orthogonal array (4) experimentation (5) analysis of data and
determination of optimal levels (6) the confirmation experimentation.
International Journal of Materials Science and Engineering
37 Volume 5, Number 1, March 2017

3.1. Establishment of Objective Function
The objective of Taguchi method is to produce high quality product in minimum cost to the
manufacturer. The main objective of this study is to determine optimal parameter levels which will give
maximum Residual Tensile Strength of the specimen and minimum surface roughness of the drilled hole.
The drilling is done in carbon fiber phenol composite specimens.
3.2. Identification of Factors and Their Levels
In Taguchi method the factors affecting the quality of process are divided as control factors and noise
factors. Control factors are set by manufacturer and can be adjusted. But these factors cannot be directly
changed by the customer. The noise factors are due to uncontrollable factors and these causes variation in
output. There are three categories of noise factors like Outer noise, Inner Noise and Product noise. Outer
noise depends on environment in which batches of products are treated. Inner noise is due to internal
factors like deterioration, wear, shrinkage etc. Product noise occurs due to variation among different parts.
Control factors are most important for quality of product characteristic [13]. In present study, the
parameters taken are cutting speed (rpm), feed rate (mm/min), drill point angle (degree) and chisel edge
width (mm) with having three levels each. The parameters and their levels are shown Table 2.
Table 2. Factors and Levels for Experiment
Factors
A:Speed (rpm)
B: Feed (mm/min.)
C:Drill point
angle(deg.)
D: Chisel edge
width(mm)
Le
ve
ls 1 1500 10 100 1
2 2000 15 118 2
3 2500 20 135 3
3.3. Selection of Taguchi Orthogonal Array
The Taguchi orthogonal array gives minimum number of experiments which could give full
information of all the factors that affect the performance [13]. There are many standard orthogonal
arrays available. In each array there are specific number of independent design parameters and levels. The
L9 orthogonal array is used in this study. Table 3 shows L9 orthogonal array.
Table 3. The L9 Orthogonal Array
Experiment No.
Speed (rpm)
Feed (mm/min)
Drill point angle
(degrees)
Chisel edge width (mm)
1 1500 10 100 1
2 1500 15 118 2
3 1500 20 135 3
4 2000 10 118 3
5 2000 15 135 1
6 2000 20 100 2
7 2500 10 135 2
8 2500 15 100 3
9 2500 20 118 1
International Journal of Materials Science and Engineering
38 Volume 5, Number 1, March 2017

3.4. Signal to Noise Ratio
The SN ratio or signal to noise ratio is measure of variation present. The SN ratio gives single value
consolidating several repetitions, which gives variation present. From plots of SN ratios one can find the
factor levels at which there is minimum effect of noise on response [13]. The different SN ratios depending
upon type of quality characteristic are: (1) Lower is better (2) Nominal is best (3) Higher is better. In
present work, for the first part, for which response is residual tensile strength, the objective is to maximize
residual tensile strength. Hence, for analysis higher is better quality characteristic is used. It is given as,
𝑆
𝑁= −10 log
1
𝑟
1
𝑦𝑖2
𝑟𝑖=1 (1)
Also for the case of surface roughness lower is better quality characteristic is used. And it is given as,
𝑆
𝑁= −10 log
1
𝑟 𝑦𝑖
2𝑟𝑖=1 (2)
where, r= number of repetitions and yi= reading at ith experiment.
4. Measurement
The residual tensile strength of drilled specimen was measured by Universal Testing Machine. The UTM
used was of 40 Tonnes maximum capacity. The width and thickness of each specimen were measured
before Tension test at three locations. The measurement of cross-sectional dimensions of the specimen
was carried out by outside micrometer having least count of 0.01mm. The surface roughness of drilled
hole is measured by surface tester of make Mitutoyo and SJ-400 model. Among Ra, Rz and Rq values
obtained from surface tester, the Ra value is considered for deciding hole quality. The surface roughness
results for experiment number 2, 3, 5 and 9 were given in [9]. Along with those results further part is
continued in this paper. Ra values for all specimens were measured. The experimental results for tensile
strength and surface roughness of the L9 orthogonal array experiment are shown in Table 4.
Fig. 3. Experimental testing: (a) Tensile test; (b) Specimen after tensile test; (c) Surface roughness
test.
(a) (b) (c)
International Journal of Materials Science and Engineering
39 Volume 5, Number 1, March 2017

Table 4. Experimental results of L9 Orthogonal Array
Experiment No.
Tensile Load
(KN)
Tensile Strength
(MPa)
Surface Roughness (µ m)
1 12.18 302.415 0.81
2 10.68 266.946 1.43
3 10.46 247.975 1.08
4 14.98 389.497 2.78
5 14.66 353.122 1.19
6 10.82 280.477 2.34
7 13.26 309.145 0.78
8 12.98 320.545 1.73
9 14.02 354.744 2.68
5. Result Analysis
5.1. Analysis of Residual Tensile Strength
The optimum parameters based on main effects plot for SN ratios for residual tensile strength are taken.
The main effects plot graphically represents the effect of factors on the response which helps to compare
the effect of each level of the control factor on the response under study [8]. The main effects plot gives
effect of chosen factors on output i.e. response from which the effect of each level of control factor on
response is compared.
The main effect plots for means and SN ratios as obtained from Minitab 17 software are given in Fig.4
and Fig.5. The reference line drawn is showing the average mean for overall response. From the main effect
plots it is clear that the residual tensile strength will be maximum at level 2 for speed (2000rpm), level 1 for
feed rate (10mm/min), level 2 of drill point angle (118degree) and level 1 of chisel edge width (1mm). The
larger is better quality characteristic has been set for SN ratio plot. One can verify the optimum parameter
levels by the main effects plot for means.
Fig.4 Main effects plot for SN ratio for residual
tensile strength.
Fig.5 Main effects plot for means for residual
tensile strength.
International Journal of Materials Science and Engineering
40 Volume 5, Number 1, March 2017

The percent contribution of factors is obtained from Analysis of variance (ANOVA) for obtained results as
shown in Table 4. Now in order to find out significant factors involved in the analysis determination of their
percent contribution F ratio is needed. Applying analysis of variance (ANOVA) it can be done. The percent
contribution is a function of sum of squares of each control factor. In L9 array which is chosen for analysis,
total degrees of freedom available are 9-1=8 [13]. Three levels of each factors are considered, so all four
factors are assigned with 2 degrees of freedom each.
Table 4. ANOVA Table Residual Tensile Strength Sr. No. Factor DOF SS MSS F-Ratio % Contribution
1 Speed (rpm) 2 7973 3986
47.492
2 Feed(mm/min) 2 2316 1158
13.796
3 DPA (deg.) 2 2427 1214
14.457
4 CEW (mm) 2 4072 2036
24.255
5 Error 0 0 -
-
6 Total 8 16788
As degrees of freedom was assigned to the error is coming as zero, it was not possible to calculate the
mean sum of square for error and hence the F ratio. The concept of pooling was used [13], in which one of
the controlling parameter having least percentage contribution can be 'pooled' to the error that means its
contribution is considered as an error and added into it. This allows to assign 2 degrees of freedom to the
error from which mean sum of square is calculated and ultimately F ratio can be obtained. The modified
ANOVA table after incorporating these conditions is shown in the Table 5. From Table 5 for the tensile
strength, it is clear that percent contribution of feed is minimum so it is pooled to error. The percent
contribution of all the factors along with error is shown graphically in Fig. 6.
Table 5. Modified ANOVA Table for Residual Tensile Strength
Sr. No. Factor SS DOF MSS F ratio %Contribution
1 Speed(rpm) 7973 2 3986 3.44 47.492
2 Feed(mm/min) Pooled
3 DPA (deg.) 2427 2 1214 1.04 14.457
4 CEW (mm) 4072 2 2036 1.75 24.255
5 Error 2316 2 1158 - 13.796
6 Total 16788 8
Fig. 6 Percent contribution of factors for Residual Tensile Strength.
47.492%
14.457%
24.255%
13.796%
Percent Contribution
Speed (rpm)
DPA (deg.)
CEW (mm)
Error
International Journal of Materials Science and Engineering
41 Volume 5, Number 1, March 2017

5.2. Analysis of Surface Roughness
The optimum parameters based on main effects plot for SN ratios for surface roughness are decided. The
graphs for main effects plot for SN ratios and mean are shown in Fig. 7 and Fig. 8 for surface roughness. The
main effects plot graphically represents the effect of factors on the response. The reference line drawn is
showing the average mean for overall response. From the main effect plots it is clear that the surface
roughness will be minimum at level 1 for speed (1500rpm), level 1 for feed rate (10mm/min), level 3 of drill
point angle (135 degree) and level 1 of chisel edge width (1mm).
Fig. 7 Main effects plot for means for SN ratios for surface roughness.
Fig. 8 Main effects plot for means for surface
roughness.
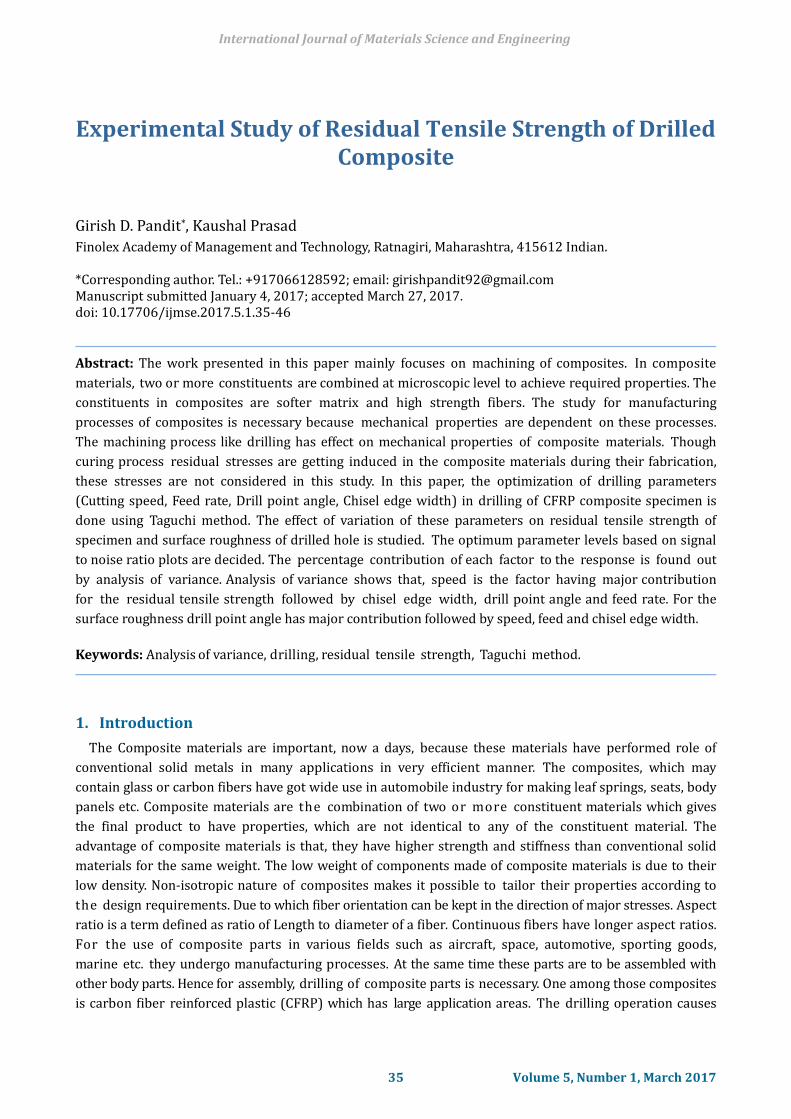
For determining percent contribution of each factor on response analysis of variance need to be done.
Table 6 and Table 7 gives ANOVA tables for surface roughness. Similar analysis is done for surface
roughness as that of residual tensile strength. In which chisel edge width is ‘pooled’ to error due to
inconvenience caused in calculating F-ratio. As can be seen from the Table 7 drill point angle is most
contributing factor followed by speed and feed.
Table 6. ANOVA Table for Surface Roughness
Sr. No. Factor SS DOF MSS F ratio % Contribution
1 Speed (rpm) 1.521 2 0.761
31.24
2 Feed (mm/min) 0.6729 2 0.336
13.82
3 DPA (°) 2.459 2 1.230
50.51
4 CEW (mm) 0.2141 2 0.107
4.40
5 Error 0 0 -
-
6 Total 4.868 8
100
Table 7. Modified ANOVA Table for Surface Roughness
Sr. No. Factor SS DOF MSS F ratio
% Contribution
1 Speed (rpm) 1.521 2 0.761 7.11 31.24
2 Feed(mm/min) 0.6729 2 0.336 3.14 13.82
3 DPA (deg.) 2.459 2 1.231 11.50 50.51
4 CEW (mm) Pooled
5 Error 0.2141 2 0.107 - 4.40
6 Total 4.868 8 100
International Journal of Materials Science and Engineering
42 Volume 5, Number 1, March 2017
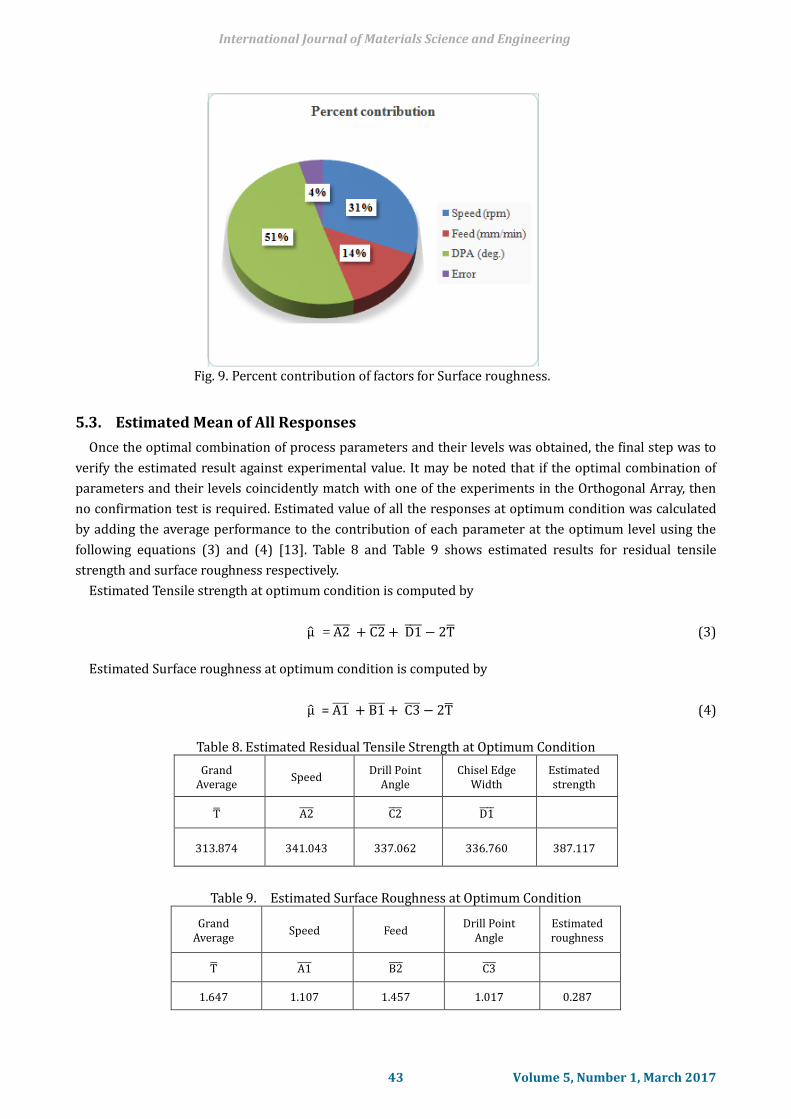
Fig. 9. Percent contribution of factors for Surface roughness.
5.3. Estimated Mean of All Responses
Once the optimal combination of process parameters and their levels was obtained, the final step was to
verify the estimated result against experimental value. It may be noted that if the optimal combination of
parameters and their levels coincidently match with one of the experiments in the Orthogonal Array, then
no confirmation test is required. Estimated value of all the responses at optimum condition was calculated
by adding the average performance to the contribution of each parameter at the optimum level using the
following equations (3) and (4) [13]. Table 8 and Table 9 shows estimated results for residual tensile
strength and surface roughness respectively.
Estimated Tensile strength at optimum condition is computed by
µ = A2 + C2 + D1 − 2T (3)
Estimated Surface roughness at optimum condition is computed by
µ = A1 + B1 + C3 − 2T (4)
Table 8. Estimated Residual Tensile Strength at Optimum Condition
Grand Average
Speed Drill Point
Angle Chisel Edge
Width Estimated strength
T A2 C2 D1
313.874 341.043 337.062 336.760 387.117
Table 9. Estimated Surface Roughness at Optimum Condition
Grand Average
Speed Feed Drill Point
Angle Estimated roughness
T A1 B2 C3
1.647 1.107 1.457 1.017 0.287
International Journal of Materials Science and Engineering
43 Volume 5, Number 1, March 2017

The estimated results by the formulae given by equations (3) and (4) earlier are only a point estimate
based on the averages of the results obtained from the experiments. While performing the confirmation
experiment it is better to have a range of value than having an exact value of predicted results within which
the observed values should fall at some percentage of confidence. This range is called as confidence interval
(C.I.) [13]. It has a maximum and minimum value between which the observed value should fall. The
statistical approach to calculate confidence interval is by using formula in equation (5),
C. I. = ± (F 1,n2 × Ve)/Ne (5)
where F (1, n2) is the F value from F table at a required confidence level at DOF 1 and error DOF n2, Ne =
Effective number of replications, Ve is the error variance which is mean sum of squares for error.
Using these equations confidence interval for responses is calculated which is shown in Table 8. The F
value is taken for 95% of confidence.
Table 8. Comparison between Experimental Results and Predicted Results
Sr. No.
Response Predicted
Results
Confidence
Interval (C. I.) limits Observed
Results Lower Upper
1 Tensile Strength
(MPa) 387.12 158.22 616.02 396.62
2 Surface Roughness
(µm) 0.287 -1.91 2.48 1.4
5.4. Confirmation Experiments
The confirmation experiments for optimum levels of parameters were performed. The results of
confirmation experiment for Residual tensile strength and Surface roughness were seem to be within the
limits of confidence interval. These results are given in Table 8 as observed results. Hence, in this
experimentation work the significant factors and their appropriate levels were properly chosen to obtain
desired results.
5.5. Regression Analysis
On the basis of available data of experiments, the empirical relation is developed between the response
and parameters used in experimentation. This empirical relation which defines response in terms of
parameters is called as regression model. In regression model response is dependent variable whereas
parameters are independent variables. When number of parameters are two or more, it is called
multiple regression. Regression models are used to predict data from unplanned experiments [12], [13].
The regression equation can be obtained by using Minitab software. The regression model for tensile
strength and surface roughness are as given in equations (6) and equation (7),
Tensile Strength = 269 + 0.0557 Speed − 3.93 Feed + 0.08 DPA − 8.7 CEW (6)
Surface roughness = 1.22 + 0.000623 Speed + 0.0577Feed− 0.0169DPA + 0.152CEW (7)
6. Conclusion
The tests for L9 orthogonal array for two types of responses, named as Residual Tensile strength and
International Journal of Materials Science and Engineering
44 Volume 5, Number 1, March 2017

Surface Roughness were taken for which results are as shown in Table 4. For analysis of experimental
results quality characteristic used for Residual Tensile strength was Larger is better, while that used for
Surface Roughness was Smaller is better. The maximum Residual Tensile Strength was observed at Speed
2000 rpm, Feed rate of 1 mm/min., and Drill point angle of 118 degrees and Chisel Edge width of 1mm.
From Anova Table 5. It is clear that, among chosen factors Speed has major contribution to the Residual
Tensile strength equal to 47.492 percent followed by Chisel edge with and Drill point angle having
contribution of 24.255 percent and 14.457 percent respectively. The factor feed rate is having least
contribution of 13.796 to the Residual tensile strength and is considered as error.
As speed has major contribution to the strength we can say that as speed increases the fibers are not
getting time to get attached with cutting lips, so there would be less fiber pull out. Also at higher speed the
fiber burning is there, so speed cannot be increased above certain maximum value.
The arithmetic average roughness (Ra) value is taken in to consideration for hole quality. For
Surface roughness, the minimum response value is observed at Speed 1500 rpm, Feed rate 10 mm/min.,
Drill point angle 135 degree and chisel edge width of 1mm. From Anova Table 7, it is clear that, among
chosen factors Drill point angle has major contribution to the Surface roughness equal to 50.51 percent
followed by Speed and Feed rate having contribution of 31.24 percent and 13.82 percent respectively. The
chisel edge width has least contribution to the surface roughness which is equal to 4.40 percent. So, it is
considered as error for Analysis of variance.
Optimum value of drill point angle is required, having major contribution to the surface roughness, for
minimum defects, because increase in DPA value will lead to chisel effect and decrease of DPA value causes
more cutting lip area in contact with material causing more heat generation and matrix burning.
References
[1] Kishore, R. A., Tiwari, R., Dvivedi, A., & Singh, I. (2009). Taguchi analysis of the residual tensile strength
after drilling in glass fiber reinforced epoxy composites. Materials and Design, 30(6), 2186–2190.
[2] Tsao, C. C. (2008). Experimental study of drilling composite materials with step-core drill. Materials
and Design, 29(9), 1740–1744.
[3] Vankanti, V. K., & Ganta, V. (2014). Optimization of process parameters in drilling of GFRP composite
using Taguchi method. J. Mater. Res. Technol., 3(1), 35–41.
[4] Hocheng, H., & Tsao, C. C. (2005). The path towards delamination-free drilling of composite materials.
Journal of Materials Processing Technology, 167(2-3), 251–264.
[5] Tsao, C. C., & Hocheng, H. (2004). Taguchi analysis of delamination associated with various drill bits in
drilling of composite material. International Journal of Machine Tools & Manufacture, 44(10),
1085–1090.
[6] Karimi, N. Z., Heidary, H., & Ahmadi, M. (2012). Residual tensile strength monitoring of drilled
composite materials by acoustic emission. Materials and Design, 40, 229–236.
[7] Kilickap, E. (2010). Optimization of cutting parameters on delamination based on Taguchi method
during drilling of GFRP composite. Expert Systems with Applications, 37(8), 6116-6122.
[8] Horambe, P. B., Prasad, K., & Mestry, S. S. (2016). Experimental parametric study of scarf adhesive joint
under static tensile load. International Journal of Materials Science and Engineering, 4(2), 69-79.
[9] Pandit, G. D., & Prasad, D. K. (2016). Optimization of drilling parameters for hole quality of composite
material. In proceedings of National Conference on Recent Advances in Science and Technology (pp.
39-41).
[10] Nasir, A. A. A., Azmi, A. I., & Khalil, A. N. M. (2015). Parametric study on the residual tensile strength of
flax natural fibre composites after drilling operation. In Procedia Manufacturing, 2nd International
International Journal of Materials Science and Engineering
45 Volume 5, Number 1, March 2017

Materials, Industrial, and Manufacturing Engineering Conference (97-101). Bali, Indonesia: Elsevier.
[11] Montgomery, D. C. (2013). Design and Analysis of Experiments. Chichester: John Wiley.
[12] Spiegel, M. R., & Stephens, L. J. (1972). Theory and Problems of Statistics. New York: McGraw-Hill
Publication.
[13] Ross, P. J. (1988). Taguchi Technique for Quality Engineering. New York: McGraw-Hill Publication.
Mr. Girish D. Pandit was born at Satara, Maharashtra, India on 13th august 1992. He has
graduated as B.E. in Automobile Engineering at Rajarambapu Institute of Technology
(Shivaji University), Sangli, Maharashtra, India in 2014. He has completed his
post-graduation as M.E. in Mechanical Engineering (Machine Design) at Finolex Academy
of Management and Technology (University of Mumbai ), Ratnagiri, Maharashtra, India in
2017. Machine design and Composite Materials are the major field of study for the Author.
He has worked at Finolex Academy of Management and Technology, Ratnagiri,
Maharashtra, India as lecturer in Mechanical Engineering Department from 13th Oct. 2014 to 7th Nov. 2016.
Currently he is working in mechanical industry as a design engineer at Pune, Maharashtra, India, since 2017.
Engineering drawing, computer aided engineering and computer aided drawing are the different topics of
his current interest.
International Journal of Materials Science and Engineering
46 Volume 5, Number 1, March 2017