experimental study of the energy and exergy performance ...nrl.northumbria.ac.uk/26844/1/hongwei...
TRANSCRIPT

Citation Zhu Jianqin Wang Kai Li Guoqing Wu Hongwei Jiang Zhaowu Lin Feng and Li Yongliang (2016) Experimental Study of the Energy and Exergy performance for a Pressurized Volumetric Solar Receiver Applied Thermal Engineering 104 pp 212-221 ISSN 1359-4311
Published by Elsevier
URL httpdxdoiorg101016japplthermaleng201605 lthttpdxdoiorg101016japplthermaleng201605075gt
This version was downloaded from Northumbria Research Link httpnrlnorthumbriaacuk26844
Northumbria University has developed Northumbria Research Link (NRL) to enable users to access the Universityrsquos research output Copyright copy and moral rights for items on NRL are retained by the individual author(s) andor other copyright owners Single copies of full items can be reproduced displayed or performed and given to third parties in any format or medium for personal research or study educational or not-for-profit purposes without prior permission or charge provided the authors title and full bibliographic details are given as well as a hyperlink andor URL to the original metadata page The content must not be changed in any way Full items must not be sold commercially in any format or medium without formal permission of the copyright holder The full policy is available online httpnrlnorthumbriaacukpolicieshtml
This document may differ from the final published version of the research and has been made available online in accordance with publisher policies To read andor cite from the published version of the research please visit the publisherrsquos website (a subscription may be required)
Accepted Manuscript
Experimental Study of the Energy and Exergy performance for a Pressurized
Volumetric Solar Receiver
Jianqin Zhu Kai Wang Guoqing Li Hongwei Wu Zhaowu Jiang Feng Lin
Yongliang Li
PII S1359-4311(16)30732-3
DOI httpdxdoiorg101016japplthermaleng201605075
Reference ATE 8290
To appear in Applied Thermal Engineering
Received Date 23 March 2016
Revised Date 13 May 2016
Accepted Date 13 May 2016
Please cite this article as J Zhu K Wang G Li H Wu Z Jiang F Lin Y Li Experimental Study of the Energy
and Exergy performance for a Pressurized Volumetric Solar Receiver Applied Thermal Engineering (2016) doi
httpdxdoiorg101016japplthermaleng201605075
This is a PDF file of an unedited manuscript that has been accepted for publication As a service to our customers
we are providing this early version of the manuscript The manuscript will undergo copyediting typesetting and
review of the resulting proof before it is published in its final form Please note that during the production process
errors may be discovered which could affect the content and all legal disclaimers that apply to the journal pertain
Experimental Study of the Energy and Exergy performance
for a Pressurized Volumetric Solar Receiver
Jianqin Zhua Kai Wang
b Guoqing Li
b Hongwei Wu
c
Zhaowu Jiangb Feng Lin
b Yongliang Li
d
a National Key Lab of Science and Technology on Aero-Engines
School of Energy and Power Engineering Beihang University Beijing 100191 China
b Institute of Engineering Thermophysics Chinese Academy of Sciences
Beijing 100190 China
c Department of Mechanical and Construction Engineering Faculty of Engineering and Environment
Northumbria University Newcastle upon Tyne NE1 8ST United Kingdom
d School of Chemical Engineering University of Birmingham
Edgbaston Birmingham B15 2TT United Kingdom
Corresponding author Email wang_kaiietcn Tel +86(10)82543147 Fax +86(10)82613328 Corresponding author Email hongweiwunorthumbriaacuk Tel +44(0)1913495365
Abstract
This article presents an experimental investigation of the heat transfer
characteristics as well as energy and exergy performance for a pressurised volumetric
solar receiver under variable mass flow rate conditions During a two-hour period of
continuous operation in the morning the solar irradiance is relatively stable and
maintained at approximately 600 Wm2 which is beneficial for analyzing the energy
and exergy performance of the solar receiver Experimental results show that the mass
flow rate fluctuation has insignificant effect on the solar receiver outlet temperature
whereas the mass flow rate plays an important role in the solar receiver power energy
efficiency and exergy efficiency The efficiency of the solar receiver is normally
above 55 with the highest efficiency of 87 and under steady state operating
conditions the efficiency is maintained at approximately 60 A very low value of the
heat loss factor (0014 kWK) could be achieved during the current steady state
operating conditions The highest exergy efficiency is approximately 36 In addition
as the temperature difference increases the impact of the exergy factor increases The
highest exergy factor is 041 during the entire test
Keywords solar receiver exergy energy efficiency heat transfer radiation
Nomenclature
Aap effective aperture area of dish [m2]
uncertainty of the receiver
exergy rate [-]
Ap project area [m2] G direct solar radiation [ ]
average specific heat capacity
[JkgK] mass flow rate [kgs]
Solid specific heat capacity
[JkgK]
parabolic dish combined
optical efficiency [-]
Df focus point diameter [m] rc concentration ratio
concentrated solar radiation power
[kW] inlet temperature of the air [K]
heat loss [kW] outlet temperature of the air[K]
receiver power [kW] average temperature of the
air[K]
solar radiation power on the dish
[kW]
surface temperature of the
sun[K]
rate of dish exergy concentrated
[kW] ambient temperature[K]
exergy factor [-] heat loss coefficient
[ ]
receiver exergy [kW] energy efficiency of the
receiver [-]
rate of solar exergy delivery [kW] exergy efficiency of the
receiver [-]
uncertainty of the receiver power[-]
1 Introduction
With rapidly increasing energy prices and globalization process industries seek
opportunities to reduce production costs and improve energy efficiency Among the
energy-efficient technologies Concentrated Solar Power (CSP) system is considered
as one of the most attractive ways to solve the energy crisis in the future [12] Many
developed countries like the United State and the European Commission have been
devoted to the solarized Brayton micro-turbines system over the past decades [3-5]
Compared to the traditional gas turbine solarized Brayton turbines use a solar
receiver to replace the combustion chamber in the traditional gas turbine [6] The
solar concentration part which is used to provide high temperature air is very crucial
for the entire solar power system The system efficiency and the cost of the power
generation are highly depended on the solar concentration conversion efficiency from
solar radiation to the thermal fluid Thus the solar concentration part has to be well
designed in order to achieve high efficiency and low pressure loss Many studies have
been devoted to the design and performance of the receiver Neber and Lee [7]
designed a high temperature cavity receiver using silicon carbide Then a scaled test
section was placed at the focal point of a parabolic dish collector and reached a
maximum temperature of 1248 K Lim et al [8] designed a tubular solar receiver with
a porous medium and found the optimal design point of the proposed solar receiver
concept to heat up compressed air The results of this study offer a valuable design
guideline for future manufacturing processes Wu et al [9] developed a novel particle
receiver concept for concentrating solar power (CSP) plants Special attention was
paid to the effect of rotation on convective flow in a cylindrical cavity with heated
side walls for solar applications Buck et al [10] introduced a receiver module
consisting of a secondary concentrator and a volumetric receiver unit which was
closed with a domed quartz window to transmit the concentrated solar radiation
Hischier et al [11 12] proposed a novel design of a high-temperature pressurized
solar air receiver for power generation via combined Brayton-Rankine cycles It
consists of an annular reticulate porous ceramic bounded by two concentric cylinders
The heat transfer mechanism was analyzed by the finite volume technique and by
using the Rosseland diffusion P1 and Monte-Carlo radiation methods It was found
that for a solar concentration ratio of 3000 suns the outlet air temperature can reach
1000 degC at 10 bars yielding a thermal efficiency of 78
It is recognized that the flow and heat transfer processes in the solar receiver are
very complicated Over the past years many studies have been devoted to the
optimization of the design using theoretical and numerical methods Nan Tu ea al [13]
studied a saturated watersteam solar cavity receiver with different depths by adopting
a combined computational model Various trends of thermal efficiency and heat loss
with depths were obtained A suitable cavity depth was finally found for the receiver
Wang and Siddiqui [14] developed a three-dimensional model of a parabolic
dish-receiver system with argon gas as the working fluid to simulate the thermal
performance of a dish-type concentrated solar energy system Wu et al [15] presented
and discussed temperature and velocity contours as well as the effects of aperture
position and size on the natural convection heat loss Their study revealed that the
impact of aperture position on the natural convection heat loss is closely related to tilt
angle while the aperture size has a similar effect for different tilt angles Hachicha et
al [16 17] proposed a numerical aerodynamic and heat transfer model based on
Large Eddy Simulation (LES) modelling of parabolic trough solar collectors (PTC)
and verified the numerical model on a circular cylinder in the cross flow The
circumferential distribution of the solar flux around the receiver was also studied Von
Storch et al [18] proposed a process for indirectly heated solar reforming of natural
gas with air as heat transfer fluid Different solar receivers were modeled and
implemented into the reforming process
On the other hand many numerical research works are also conducted to simulate
the detail heat transfer process Flesch et al [19] numerically analyzed the impact of
head-on and side-on wind on large cavity receivers with inclination angles ranging
from 0deg(horizontal cavity) to 90deg(vertical cavity) and compared with the data
published in the open literature Yu et al [20] performed a numerical investigation on
the heat transfer characteristics of the porous material used in the receiver of a CSP
with different structure parameters The effects of different boundary conditions were
revealed Tu et al [21] proposed a modified combined method to simulate the thermal
performance of a saturated watersteam solar cavity receiver Capeillere et al [22]
numerically studied the thermomechanical behavior of a plate solar receiver with
asymmetric heating The numerical results showed that the choice of the shape and
levels of the solar irradiance map is crucial The distribution of the most relevant
incident solar flux and the geometry compromise were determined Wang et al [23]
conducted a numerical study focusing on the thermal performance of a porous
medium receiver with quartz window Their results indicated that the pressure
distribution and temperature distribution for the condition of fluid inlet located at the
side wall was different from that for the condition of fluid inlet located at the front
surface Roldan et al [24] carried out a combined numerical and experimental
investigation of the temperature profile in the wall of absorber tubes of
parabolic-trough solar collectors using water and steam as the heat-transfer fluids A
good agreement between the measured and computed thermal gradient was achieved
Exergy analysis has been applied in various power studies In the authors earlier
studies [25 26] a coiled tube solar receiver had been designed and tested in the real
solar radiation condition But due to the limitation of the tube material the coiled tube
solar receiver could not achieve very high temperature Thus a pressurized
volumetric solar receiver using metal foam as thermal absorbing core is designed in
this work It appears from the previous investigation that the key point for the
solarized Brayton micro-turbines is to develop solar receivers which have exemplary
performance on the pressure loss and heat transfer To the best of the authorsrsquo
knowledge there is a lack of available experimental data under real concentrated solar
and variable mass flow conditions especially for the cases of extremely high heat flux
and high temperature To this end the present research is aimed to experimentally
analyze both the efficiency and heat loss of a pressurized volumetric solar receiver
under real solar radiation and variable mass flow conditions in more detail
2 Experimental apparatus and method
21 Experimental apparatus
The experimental study was conducted at a location with the geographical
position of 30deg36 latitude and 120deg22 longitude Hangzhou China The whole
system shown schematically in Fig 1 mainly consists of three components dish
compressor and receiver The dish used for the experimental tests of the developed
solar heat receiver is shown in Fig 2 All 40 trapezoidal pre-bent mirrors are resin
molded and laminated The reflective surface is applied as an adhesive foil At the
bottom of the dish a cut out is made for the tower The main dish parameters utilized
in the current study are illustrated in Table 1 which is provided by the dish reflector
manufacturer To make sure that the light reflected by the mirror focuses on the
aperture of the receiver each mirror was adjusted carefully
The dish is controlled by a solar tracker which is embedded in the inner program to
make the dish face the Sun automatically The inner program could accurately
calculate the attitude angle in terms of the dish location of the earth and the local time
As illustrated in Fig 1 the attitude angle is formed between the boom line and
horizon line A stepping motor can be well controlled to change the dish attitude angle
slowly When the dish is in operation during the morning the attitude angle is lower
than for the sun just rising over the horizontal line Whereas the dish is operated
in the noon the attitude angle is approximately It should be recognized that the
initial setting for the location and accurate time is very crucial during the test An
uninterruptible power supply (UPS) system is also adopted to assist the dish off the
solar direction in some emergency to further protect the receiver During the
experiments a 20 kW piston compressor driven by electricity is used to compress the
air The pressurized air is compressed at environmental temperature from
environmental pressure After the filter the air is pressurized into the air tank with
pressure of 08 Mpa (absolute pressure) to guarantee enough air flow during the
experiment process After that the pressurized air is supplied into the receiver Two
valves are installed at the receiver inlet and outlet to ensure the receiver works under
the designed pressure about 04 Mpa Because the light incident surface of the
receiver is made of quartz glass too high pressure could damage the receiver Hence
by adjusting this valve the pressure of the whole system as well as the portion of the
receiver can be well controlled The output mass flow rate is variable Thermocouple
and pressure sensor are placed at the inlet and outlet of the pipe respectively to obtain
the receiver efficiency and heat loss The receiver itself is mounted onto the cantilever
arm In the current study the heat flux of the focus power could achieve 1000 kWm2
for the dish concentrator with the concentrate ratio of 1750 It can be expected that
except for the receiver and protecting panel other components of the system would be
burned in a short time To protect other parts of the receiver from misaligned radiation
an additional protecting panel is mounted circumferentially to the receiver As shown
in Fig 3 the protecting panel is made of Calcium silicate board 10 mm in thickness
The diameter of the aperture in the protecting panel is 250 mm Four K-type
thermocouples with an accuracy of 05 degC are fixed on the back to monitor the
temperature of the protecting panel When the temperature is over it means
that the concentrated solar spot is not located into the aperture As a result the inner
program has to be reset to adjust the attitude angle in order to prevent fatal damage
22 Solar receiver set-up
For the current experimental evaluation as shown in Fig 4 the solar receiver is
designed as a type of pressurized volumetric solar receiver Fig 4(a) shows the 3D
view of the model and Fig 4(b) presents the cross section view of the receiver The
advantage of the pressurized volumetric solar receiver is high outlet air temperature
and high thermal efficiency It should be stressed here that the key point for the design
of the pressurized volumetric solar receiver is the cooling of the light incident glass
and the equally distributed mass flow in the heat absorbing core The light incident
glass is made of quartz glass which can endure a temperature up to 1200 But the
concentrated solar focuses on the quartz glass directly the glass cooling using the
inlet air could extend the life span of the receiver and make the receiver working
process more secure For this reason a large inlet tube is used with the diameter of 50
mm The pressurized air is injected into the inlet tube and then it is divided into three
small tubes with a diameter of 20 mm The three small tubes that are circumferentially
uniformly distributed are welded at the end of the pressure cavity which forms the
main part of the solar receiver The air flows along the edge of the cavity and is
injected onto the quartz glass providing cooling of the light incident glass The
diameter and the height of the main part of the receiver are 400 mm and 360 mm
respectively The concentrated solar radiation (CSR) passes through the quartz glass
and heats the absorbing core As shown in Fig 5 the material of the absorbing core is
Nickel foam which could endure a temperature up to 1453 To increase the
absorbing ability 65mm Nickel foam with the PPI (Pores per Inch) value of 75 is
selected PPI which is a common parameter is usually used in industry to indicate the
pore diameter of a metal foam The 75 PPM value means that the pore diameter is
about 034 mm One can imagine that the small pore diameter would enhance the heat
transfer coefficient and heat transfer area At last to minimize the heat loss the
receiver is surrounded by Aluminum silicate whose heat conductivity coefficient is
006
23 Energy and exergy analysis
Experimental energy and exergy parameters to characterize the thermal
performance of the receiver are presented in this section
231 Energy analysis [27 28]
The energy that the whole system receives comes from the solar radiation The
solar radiation power on the parabolic dish reflector can be expressed as
(1)
where is the solar radiation power on the dish is the effective aperture
area of the parabolic dish and G is the direct solar irradiation from the Sun to the dish
G is measured with a normal incidence pyrheliometer (NIP) Hukseflux DR01
attached to the solar tracker
The solar radiation is concentrated and delivered to the receiver by the parabolic
dish The concentrated solar radiation power (ED) can be expressed as
(2)
where is the concentrated solar radiation power from parabolic dish to the
receiver is the parabolic dish combined optical efficiency described in Table 1
The concentrated solar radiation on the receiver is absorbed by the heat-transfer
fluid flowing in the pressurized cavity of the receiver The energy rate that air absorbs
or receives power is given by
(3)
where is the mass flow rate of the air is the average specific heat
capacity of the air which is a function of the average air inlet temperature ( ) and air
outlet temperature ( The average temperature of the receiver (Tave) can be
defined by
(4)
Thus the relation between the average specific heat capacity of the air and the
average temperature can be obtained as
(5)
Eq (5) is fitted according to the air property table from to The
unit of is and the unit of is K
Based on energy conservation the receiver power is the difference between the
concentrated solar radiation power and the overall heat losses are relative low The
receiver power can also be described as
(6)
where is the rate of the heat loss from the receiver to the surroundings
which contains the convective heat losses conductive heat losses and radiative heat
losses can be expressed as
(7)
where is the total heat loss coefficient determined is the effective
receiver area and is the ambient temperature The product is referred as
the heat loss factor given by
(8)
Therefore combination of Eqs (2) (3) (6) and (7) can yield
(9)
The thermal energy efficiency of the receiver is defined as the ratio of the
receiver power to the concentrated solar radiation power from the parabolic dish to
the receiver which is expressed as
(10)
By dividing on both side of Eq (9) and combine with Eq (10) leads to
(11)
232 Exergy analysis [27 28 29]
The exergy rate of the receiver or the quality of the energy delivered to the
circulating fluid with reference to the surroundings can be expressed as
(12)
Substituting Eq (3) into Eq (12) yields
(13)
The rate of the solar exergy delivery by the Sun to the dish and then to the
concentrator is given by the Petela expression [30] and is expressed as
(14)
where is the surface temperature of the Sun which is approximately 5762 K
So the concentrated solar radiation exergy ( ) can be expressed as
(15)
The exergy efficiency is defined as the ratio of the receiver exergy rate to the rate
of the concentrated solar radiation exergy and can be determined as follows
(16)
The exergy factor is defined as the ratio of the receiver exergy rate to the
receiver energy rate and can be represented by Eq (17)
(17)
3 Uncertainty analysis
The uncertainties of the measurements in the experiment are dependent on the
experimental conditions and the measurement instruments An uncertainty analysis is
performed on the receiver power and the receiver exergy which are the
most important derived quantities from the measurements when using the propagation
of error method described by Moffat [31] The uncertainty of the receiver power could
be calculated by the following equation
(17)
While the uncertainty of the receiver exergy rate is given by
(18)
In the current study the main uncertainty parameters are the mass flow rate ( )
the inlet temperature ( ) and the outlet temperature ( ) The relative uncertainty
of the mass flow rate is given by the float flowmeter with the value of 2 Therefore
The uncertainty of the temperature is given by the
K-type thermocouple with the value of
The maximum experimental values for the receiver power and exergy rate are
around 185 kW and 728 kW respectively The uncertainty of the receiver power is
0372 kW and the uncertainty of the receiver exergy rate is 0147 kW Overall the
overall uncertainty of the receiver power and exergy rate are 201 and 202
respectively
4 Results and discussion
Fig 6 shows the variation of the solar irradiance (G) during a test period from
1000 am to 1330 pm The experimental data were collected on November 6th
2015
which falls in the local autumn season in Hangzhou China According to Fig 6 it is
shown that the solar irradiance fluctuates around 600 Wm2The solar irradiance data
increases slowly with time except two fast drops observed in the afternoon for about
15 mins The reason could be due to the fact that two short periods of passing cloud
occurred From this figure it can be seen clearly that the solar irradiance is almost
stable and maintained at around 600 Wm2 from 1000 am to 1200 pm It is obviously
that the stable solar irradiation condition is beneficial for analyzing the energy and
exergy performance of the solar receiver For this purpose a test period of continuous
2 h from 1000 am to 1200 pm was selected A dynamic acquisition system was used
to record the parameters automatically during the test The ambient temperature is
maintained at around 25 during the experimental process Fig 7 shows the
variation of the inlet pressure outlet pressure and mass flow rate As the design
pressure of the solar receiver is 04 Mpa the experiment should be conducted at the
same pressure Since the heating from the concentrated solar irradiation could lead to
the rising of the internal pressure the inlet valve is adjusted during the experimental
process to ensure the solar receiver is working safety Therefore the mass flow rate
fluctuates all the time The average value of the mass flow rate is about 0036 kgs In
the current study the main purpose is to test the energy and exergy performance of
the solar receiver under the fluctuating mass flow rate condition
Fig 8 presents the time series of air temperatures at the inlet and outlet of the
receiver The inlet temperature maintains nearly constant at about 42 o
C The outlet
temperature rises very quickly initially and achieves the highest temperature of 480
oC at the end of the experimental process From 1000 am to 1030 am it takes about
half an hour to raise the solar receiver outlet temperature from 42 oC to 430
oC After
1030 am the outlet temperature increases very slowly with the time The first half an
hour is used for preheating It is due to the fact that the receiver tubes are surrounded
by the insulation materials with high specific heat capability (Cp) It is noteworthy
that the rising speed of the receiver efficiency is very high within the first 30 mins
This phenomenon is very important and should be stressed here since the sunshine is
limited in the day time and a quick start up can make the overall solar power
generation system to generate more electricity Therefore the cost of the power
generation will be lower and the investment recovery period could be shorter There is
also another interesting phenomenon in that the mass flow rate fluctuation has little
effect on the solar receiver outlet temperature It may be due to the reason that the
porous metal is used as the heat absorbing core The pore size is very small with the
value about 034 mm This small size pore could increase the heat transfer coefficient
and area obviously The heat transfer between the porous metal and the air is strong
enough so that the air outlet temperature could be very close to the temperature of the
porous metal Therefore the effect of the mass flow rate fluctuation on the solar
receiver outlet temperature is very small
Fig 9 presents a comparison of the power for the concentrated solar radiation
and receiver power For the case of the nearly constant solar irradiance of 600 Wm2
the concentrated solar radiation power ( ) is maintained at around 225 kW with the
fluctuation lower than In addition the accurate control system can make sure
the reflection focus is located at the aperture of the receiver The red line shown in Fig
9 is the receiver power during the testing period For the first 10 mins the solar
receiver power ( ) rise quickly from nearly 0 kW to 12 kW After that the value of
has the same trend as the mass flow rate with the time In other words the mass
flow rate has a great influence on the solar receiver power This can be easily
explained by Eq (3) As previously mentioned the mass flow fluctuation has little
influence on the value of and so that the solar receiver power is
mainly affected by the mass flow rate especially after the starting stage The
maximum solar receiver power is achieved at about 1150am with the value of 185
kW
Fig 10(a) shows the time series of the solar receiver efficiency It is found that
when the solar receiver turns into steady state the efficiency of the solar receiver can
be above 55 The peak value of the efficiency is 87 and finally the efficiency is
maintained at around 60 And it is also found that the value of has the same
trend with the mass flow rate after the receiver entering into steady stage In other
words the energy efficiency is positively correlated with the mass flow rate as shown
in Fig 10(b) The main reason for this phenomenon can be explained by Eq (10) As
described above the concentrated solar radiation power ( ) is nearly maintained
constant at around 225 kW but the mass flow rate has great influence on the solar
receiver power ( ) Therefore the ratio of and has a positive relationship
with the mass flow rate This is a very beneficial conclusion Because in our
experiment the mass flow rate is obviously lower than the real solarized gas turbine
system So the efficiency of the real solarized gas turbine system will be very high
Correspondingly the usage of the gas will be lower and the investment recovery
period could be shorter
Fig 11 demonstrates the evolution of the heat loss factor ) At the starting
point is very high (117 kWK) because of the receiver preheating and then it
drops very quickly within the first 5 mins When the receiver works at steady state
the heat loss becomes lower and achieves the minimum value of 0014 kWK In
the current study the heat loss mainly consist of the conduction heat loss conviction
heat loss and radiative heat loss Conduction heat loss could be reduced by using
material with low thermal conductivity In the present work the receiver is
surrounded by Aluminum silicate whose thermal conductivity is 006 The
Aluminum silicate can act as the thermal insulator to minimize the heat lossThe
thermal convection between the solar receiver and ambient is very low as well this is
because the absorbing core is sealed in a pressurized cavity As a result only small
natural convection occurs around the external cavity of the receiver It is noted that
the use of the insulator could obviously reduce the natural convection The radiative
heat loss is also an important part of the heat loss but it can be reduced by using small
aperture as shown in Fig 4 In the design of solar receiver choosing an appropriate
aperture diameter is very important for the receiver performance
Fig 12 shows the comparison between the receiver exergy and the
concentrated solar energy as well as the receiver energy From this figure the exergy
rate and energy rate vary in a similar manner the mass flow rate also has the same
influence on the exergy rate It is noted that the highest value of the exergy rate during
the test period is around 728 kW whereas the maximum energy rate can reach 185
kW It can be concluded that the quality of the energy from the receiver is low due to
a large amount of irreversible energy changes such as heat losses and the transfer of
high quality solar energy to a fluid that is circulating at a relatively low temperature
From Eq (13) it can be concluded that under the same temperature difference
and the same energy rate condition increasing the receiver
inlet temperature can achieve higher exergy rate This will be very
helpful for the design of the solar power system As a result some recuperator or heat
exchanger should be used in the inlet of the solar receiver to recover the waste heat
and increase the solar inlet temperature
Fig 13 presents the comparison between the energy efficiency and exergy
efficiency It is shown from Fig 13 that similar trends in the exergy efficiency and the
energy efficiency are obtained The highest exergy efficiency is approximately 36
whereas the highest energy efficiency is around 87 This suggests that low quality
energy obtained from the receiver It is because the inlet temperature of the receiver is
lower than 316 K whereas the outlet temperature is very high and with the maximum
value of 850 K The temperature ratio (ToutTin) is very high so that too much exergy
loss is observed Fig14 shows the exergy efficiency calculated by Eq (16) varies with
the inlet temperature The calculating condition is
It is obvious that the exergy efficiency increases with the inlet
temperature raises Therefore increasing the inlet temperature could be a potential
way to increase the exergy efficiency
Fig 15 shows the exergy factor plotted as a function of the temperature
difference between the outlet and inlet temperature of the receiver with a linear
correlation fitted The exergy factor is also usually used as a measure of the
performance of the receiver Obviously as the temperature difference increases the
exergy factor also increases With the temperature difference achieves 450 K the
exergy factor could be higher than 04 And this plot also suggests that a higher
exergy factor can be obtained when high temperature difference is available As seen
from this figure the highest exergy factor is 041 during the entire test
5 Conclusions
This paper performed an experimental study to investigate the thermal
performance of a pressurized volumetric solar receiver under real solar radiation
conditions In order to design a high efficiency solar receiver some important
parameters such as different porous material the size of the quartz window the shape
of the cavity should be selected carefully In the current work a parabolic dish with
solar tracker system is well designed and the obtained results are analysed using
energy and exergy analyse method Experimental results reveal that the solar
irradiance is almost stable and maintained at around 600 Wm2 from 1000 am to
1200 pm It takes about half an hour to raise the solar receiver outlet temperature
from 42 o
C to 430 o
C After 1030 am the outlet temperature increases very slowly
with the time The mass flow rate fluctuation has little effect on the solar receiver
outlet temperature However the mass flow rate has great influence on the solar
receiver power energy efficiency and exergy efficiency The efficiency of the solar
receiver can be above 55 The peak value of the efficiency is 87 and finally the
efficiency is maintained at around 60 During the steady state the heat loss becomes
lower and achieves the minimum value of 0014 kWK The highest exergy
efficiency is approximately 36 whereas the highest energy efficiency is around
87 As the temperature difference increases the impact of the exergy factor
increases The highest exergy factor is 041 during the entire test
Acknowledgements
The authors would like to acknowledge the financial support from National Natural
Science Foundation of China (No 51206164)
References
[1] Steinfeld A 2005 Solar thermochemical production of hydrogen - a review
Solar Energy 78603-15
[2] Le Roux WG Bello-Ochende T Meyer JP 2011 Operating conditions of an
open and direct solar thermal Brayton cycle with optimised cavity receiver and
recuperator Energy 366027-36
[3] Uri Fisher Chemi Sugarmen Arik Ring Joseph Sinai 2004 Gas Turbine
ldquoSolarizationrdquo-Modifications for SolarFuel Hybrid Operation J Sol Energy
Eng 126(3) 872-878
[4] Peter Heller Markus Pfaumlnder Thorsten Denk Felix Tellez Antonio Valverde
Jesuacutes Fernandez Arik Ring 2006 Test and evaluation of a solar powered gas
turbine system Solar Energy 80(10) 1225-1230
[5] Peter Schwarzboumlzl Reiner Buck Chemi Sugarmen Arik Ring Ma Jesuacutes
Marcos Crespo Peter Altwegg Juan Enrile 2006 Solar gas turbine systems
Design cost and perspectives Solar Energy 80(10) 1231-1240
[6] Chen Lingen Zhang Wanlin Sun Fengrui 2007 Power efficiency
entropy-generation rate and ecological optimization for a class of generalized
irreversible universal heat engine cycles Appl Energy 84512-25
[7] Matthew Neber Hohyun Lee 2012 Design of a high temperature cavity receiver
for residential scale concentrated solar power Energy 47481-487
[8] Sehwa Lim Yongheack Kang Hyunjin Lee Seungwon Shin 2014 Design
optimization of a tubular solar receiver with a porous medium Appl Therm Eng
62 566-572
[9] Wei Wu Lars Amsbeck Reiner Buck 2014 On the influence of rotation on
thermal convection in a rotating cavity for solar receiver applications Appl
Therm Eng 70 694-704
[10] Buck R Brauning T Denk T Pfander M Schwarzbozl P Tellez F 2001
Solar-hybrid gas turbine-based power tower systems J Sol Energy Eng
124(1)2-9
[11] Hischier I Hess D Lipinski W Modest M Steinfield A 2009 Heat transfer
analysis of a novel pressurized air receiver for concentrated solar power via
combined cycles J Thermal Sci Eng Appl 11-6
[12] Hischier I Hess D Lipinski W Modest M Steinfield A 2009 Heat transfer
analysis of a novel pressurized air receiver for concentrated solar power via
combined cycles ASME J Therm Sci and Eng Appl Vol 1 041002-1
[13] Nan Tu Jinjia Wei Jiabin Fang 2014 Numerical study on thermal
performance of a solar cavity receiver with different depths Appl Therm Eng
72 20-28
[14] Wang M Siddiqui K 2010 The impact of geometrical parameters on the
thermal performance of a sola receiver of dish-type concentrated solar energy
system Renew Energy 352501-13
[15] Shuang-Ying Wu Lan Xiao You-Rong Li 2011 Effect of aperture position
and size on natural convection heat loss of a solar heat-pipe receiver Appl
Therm Eng 31 2787-2796
[16] Hachicha AA Rodriguez I Castro J Oliva A 2013 Numerical simulation of
wind flow around a parabolic trough solar collector Appl Energy107426-37
[17] Hachicha AA Rodriguez I Capdevila R Oliva A 2013 Heat transfer analysis
and numerical simulation of a parabolic trough solar collector Appl Energy
111581-92
[18] Storch HV Roeb M Stadler H Stadler H Sattler C Hoffschmidt B 2016
Available online Efficiency potential of indirectly heated solar reforming with
different types of solar air receivers Appl Therm Eng 92202-209
[19] Flesch R Stadler H Uhlig R 2014 Numerical analysis of the influence of
inclination angle and wind on the heat losses of cavity receivers for solar thermal
power towers Solar Energy 110427-37
[20] Yu Z Feng Y Zhou W Jin Y Li M Li Z Tao W 2013Study on flow and heat
transfer characteristics of composite porous material and its performance
analysis by FSP and EDEP Appl Energy 1121367-75
[21] Tu N Wei J Fang J 2015 Numerical investigation on uniformity of heat
flux for semi-gray surfaces inside a solar cavity receiver Solar Energy
112128-43
[22] Capeillere J Toutant A Olalde G Boubault A 2014 Thermomechanical
behavior of a plate ceramic solar receiver irradiated by concentrated sunlight
Solar Energy 110 174-87
[23] Wang F Tan J Ma L Shuai Y Tan H Leng Y 2014 Thermal performance
analysis of porous medium solar receiver with quartz window to minimize heat
flux gradient Solar Energy 108 348-59
[24] Roldan MI Valenzuela L Zarza E 2013 Thermal analysis of solar receiver
pipes with superheated steam Appl Energy 10373-84
[25] Jianqin Zhu Kai Wang Hongwei Wu Dunjin Wang Juan Du AGOlabi
2015 Experimental investigation on the energy and exergy performance of a
coiled tube solar receiver Applied Energy 156 519-527
[26] Kai Wang Hongwei Wu Dunjin Wang Yongsheng Wang Zhiting Tong
Feng Lin AG Olabi 2015 Experimental Study on a Coiled Tube Solar Receiver
under Variable Solar Radiation Condition Solar Energy 122 1080ndash1090
[27] Mawire A Taole S 2014 Experimental energy and exergy performance of a
solar receiver for a domestic parabolic dish concentrator for teaching purposes
Energy Sustain Dev 19162-9
[28] Macphee D Dincer I 2009 Thermal modeling of a packed bed thermal
energy storage system during charging Appl Therm Eng 29695-705
[29] Padilla RV Fontalvo A Demirkaya G Martinez A Quiroga AG 2014
Exergy analysis of parabolic trough solar receiver Appl Therm Eng
67579-586
[30] Petela R 2003 Exergy of undiluted thermal radiation Solar Energy
74469-88
[31] Moffat RJ 1988 Describing the uncertainties in the experimental results
Exp Therm Fluid Sci 13-17
Fig 1 Schematic drawing of experimental test rig
Receiver
Compressor
Filter
P T P T
Inlet
Outlet
Boom
Dish
Pedestal Control cabinet
Air tank
Flow meter
Fig 2 Parabolic dish
Fig 3 Protecting shield under the concentrated solar radiation
(a)
Inlet
Outlet
CSR
(b)
Fig 4 Pressurized volumetric solar receiver (a) 3D model (b) cross sectional view
Inlet tube
Outlet tubeExternal cavity
Heat absorbing core
Quartz glass
Internal cavity
Fig5 Nickel foam
Fig 6 Solar irradiance data during the day
1000 1030 1100 1130 1200 1230 1300 13300
100
200
300
400
500
600
700
800
So
lar i
rra
dia
cn
e (
Wm
2)
Time
G
Testing process
Fig 7 Variation of the inlet pressure outlet pressure and mass flow rate
1000 1030 1100 1130 120000
01
02
03
04
05
Ma
ss f
low
ra
te(k
gs
)
Press
ure(M
pa
)
Time
Pi
Po
m
000
002
004
006
008
010
Fig 8 Variation of the inlet temperature outlet temperature and mass flow rate
1000 1030 1100 1130 12000
50
100
150
200
250
300
350
400
450
500
Ma
ss f
low
ra
te(k
gs
)
Tem
pera
ture(
oC
)
Time
Tin
Tout
m
000
002
004
006
008
010
Fig 9 Variation of the dish power receiver power and mass flow rate
1000 1030 1100 1130 12000
5
10
15
20
25
Ma
ss f
low
ra
te(k
gs
)
Po
wer(k
W)
Time
ED
ER
m000
002
004
006
008
010
(a)
(b)
Fig 10 Efficiency results (a) during the test period (b) efficiency vs mass flow rate
1000 1030 1100 1130 1200
00
02
04
06
08
10
Efficiency
m
Time
Eff
icie
ncy
001
002
003
004
005
006
007
008
Ma
ss f
low
ra
te(k
gs
)
0015 0020 0025 0030 0035 0040 0045 005002
03
04
05
06
07
08
09
10
Eff
icie
ncy
Mass flow rate(kgs)
Efficiency
Fig 11 Heat loss factor profile during the test period
1000 1030 1100 1130 120000
02
04
06
08
10
12
Hea
t lo
ss f
acto
r U
L(k
wK
)
Time
U
L
Fig 12 Variation of the power for the receiver energy and exergy
during the test period
1000 1030 1100 1130 12000
5
10
15
20
25
Po
wer(k
w)
Time
ED
ER
ExR
Fig 13 Energy and Exergy efficiency profile during the test period
1000 1030 1100 1130 120000
01
02
03
04
05
06
07
08
09
10
Eff
icie
ncy
Time
Energy Efficiency
Exergy Efficiency
Fig 14 The exergy efficiency variation with inlet temperature
0 20 40 60 80 100 120 140 160 180 200025
030
035
040
045
050
Eff
icie
nc
y
Tin(
oC)
Exergy Efficiency
Fig 15 The effect of temperature difference on the exergy factor
0 100 200 300 400 500000
005
010
015
020
025
030
035
040
045
Ex
erg
y f
acto
r
Tout-Tin
Exergy factor
Ex=013194+0000649(Tout
-Tin)
Table 1
Dish design parameters
Parameters Value (unit)
Effective aperture area of dish (Aap) 44 m2
Project area (Ap) 90 m2
Focus length(Ld) 67m
Rim angle( ) 45deg
Focus point diameter (Df) 018 m
Concentration ratio (rc) 1750
Parabolic dish combined optical efficiency (nd) 85
Mirror number 40
Slop error 05 mrad

(b)
Fig 4 Pressurized volumetric solar receiver (a) 3D model (b) cross sectional view
Inlet tube
Outlet tubeExternal cavity
Heat absorbing core
Quartz glass
Internal cavity
Fig5 Nickel foam
Fig 6 Solar irradiance data during the day
1000 1030 1100 1130 1200 1230 1300 13300
100
200
300
400
500
600
700
800
So
lar i
rra
dia
cn
e (
Wm
2)
Time
G
Testing process
Fig 7 Variation of the inlet pressure outlet pressure and mass flow rate
1000 1030 1100 1130 120000
01
02
03
04
05
Ma
ss f
low
ra
te(k
gs
)
Press
ure(M
pa
)
Time
Pi
Po
m
000
002
004
006
008
010
Fig 8 Variation of the inlet temperature outlet temperature and mass flow rate
1000 1030 1100 1130 12000
50
100
150
200
250
300
350
400
450
500
Ma
ss f
low
ra
te(k
gs
)
Tem
pera
ture(
oC
)
Time
Tin
Tout
m
000
002
004
006
008
010
Fig 9 Variation of the dish power receiver power and mass flow rate
1000 1030 1100 1130 12000
5
10
15
20
25
Ma
ss f
low
ra
te(k
gs
)
Po
wer(k
W)
Time
ED
ER
m000
002
004
006
008
010
(a)
(b)
Fig 10 Efficiency results (a) during the test period (b) efficiency vs mass flow rate
1000 1030 1100 1130 1200
00
02
04
06
08
10
Efficiency
m
Time
Eff
icie
ncy
001
002
003
004
005
006
007
008
Ma
ss f
low
ra
te(k
gs
)
0015 0020 0025 0030 0035 0040 0045 005002
03
04
05
06
07
08
09
10
Eff
icie
ncy
Mass flow rate(kgs)
Efficiency
Fig 11 Heat loss factor profile during the test period
1000 1030 1100 1130 120000
02
04
06
08
10
12
Hea
t lo
ss f
acto
r U
L(k
wK
)
Time
U
L
Fig 12 Variation of the power for the receiver energy and exergy
during the test period
1000 1030 1100 1130 12000
5
10
15
20
25
Po
wer(k
w)
Time
ED
ER
ExR
Fig 13 Energy and Exergy efficiency profile during the test period
1000 1030 1100 1130 120000
01
02
03
04
05
06
07
08
09
10
Eff
icie
ncy
Time
Energy Efficiency
Exergy Efficiency
Fig 14 The exergy efficiency variation with inlet temperature
0 20 40 60 80 100 120 140 160 180 200025
030
035
040
045
050
Eff
icie
nc
y
Tin(
oC)
Exergy Efficiency
Fig 15 The effect of temperature difference on the exergy factor
0 100 200 300 400 500000
005
010
015
020
025
030
035
040
045
Ex
erg
y f
acto
r
Tout-Tin
Exergy factor
Ex=013194+0000649(Tout
-Tin)
Table 1
Dish design parameters
Parameters Value (unit)
Effective aperture area of dish (Aap) 44 m2
Project area (Ap) 90 m2
Focus length(Ld) 67m
Rim angle( ) 45deg
Focus point diameter (Df) 018 m
Concentration ratio (rc) 1750
Parabolic dish combined optical efficiency (nd) 85
Mirror number 40
Slop error 05 mrad
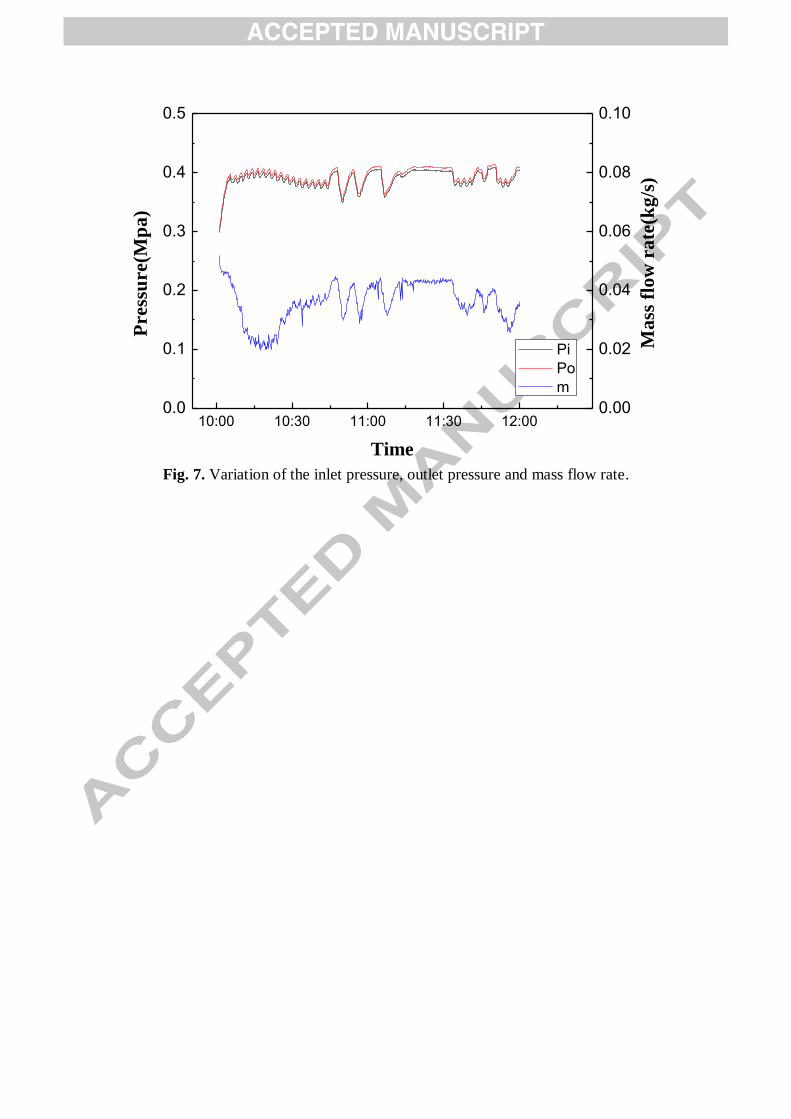
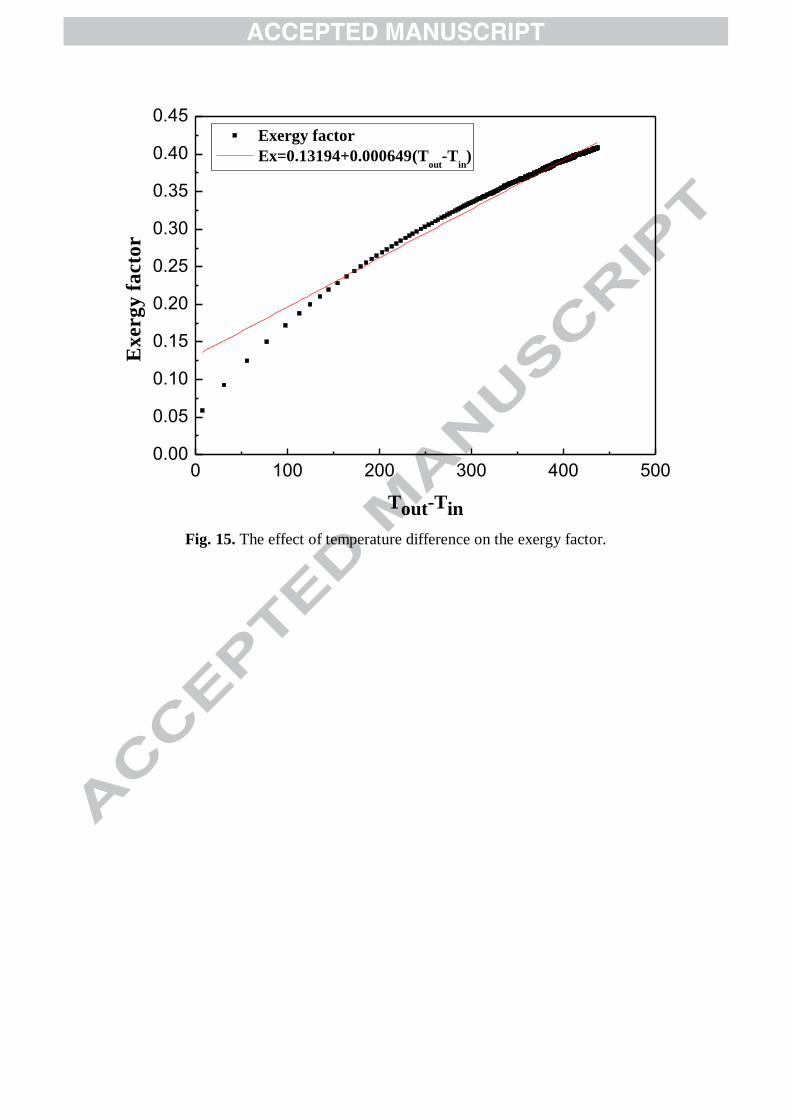