experimental study of the impact of wlan interference on ieee
TRANSCRIPT

Experimental Study of the Impact of WLANInterference on IEEE 802.15.4 Body Area
Networks ?
Jan-Hinrich Hauer, Vlado Handziski, and Adam Wolisz
Telecommunication Networks GroupTechnische Universitat Berlin, Germany
{hauer,handzisk,wolisz}@tkn.tu-berlin.de
Abstract. As the number of wireless devices sharing the unlicensed2.4 GHz ISM band increases, interference is becoming a problem ofparamount importance. We experimentally investigate the effects of con-trolled 802.11b interference as well as realistic urban RF interference onpacket delivery performance in IEEE 802.15.4 body area networks. Ourmulti-channel measurements, conducted with Tmote Sky sensor nodes,show that in the low-power regime external interference is typically themajor cause for substantial packet loss. We report on the empirical corre-lation between 802.15.4 packet delivery performance and urban WLANactivity and explore 802.15.4 cross-channel quality correlation. Lastly,we examine trends in the noise floor as a potential trigger for channelhopping to detect and mitigate the effects of interference.
Key words: Body Area Networks; IEEE 802.15.4; Interference
1 Introduction
Body Area Networks (BANs) allow monitoring of the human body with detailand pervasiveness that is opening new application opportunities in domains rang-ing from personalized health-care and assisted living to sport and fitness moni-toring [1]. In these domains the wireless telemetry was traditionally based eitheron proprietary communication technologies or on standardized solutions withsignificant licencing overhead and limited geographic availability. With the in-troduction of the IEEE 802.15.4 standard [8] and its focus on low data rates, lowpower consumption, reduced complexity and device size, an alternative emergedthat matches the specific requirement of a BAN platform quite well.
Although 802.15.4 technology has rapidly matured and become the basis ofseveral commercial products, there is still a level of uncertainty whether it canmeet the stringent QoS requirements typical for some BAN applications undermore challenging operating conditions. These concerns especially pertain to thecoexistence with other major users of the unlicensed 2.4 GHz ISM band, notably? This work has been partially supported by the European Commission under the
contracts FP7-2007-IST-2-224053 (CONET) and FP6-2005-IST-5-033506 (ANGEL).

2 Jan-Hinrich Hauer, Vlado Handziski, and Adam Wolisz
Fig. 1: IEEE 802.15.4 and 802.11 spectrum usage in the 2.4 GHz ISM band. The avail-ability of channels is regulated per country.
IEEE 802.11 (WLAN) [10] and IEEE 802.15.1 (Bluetooth) [9]. Due to theirvirtual omnipresence and comparably high transmit power (20 dBm in Europe)WLANs pose a particular challenge.
Fig. 1 shows the spectrum usage of the two technologies in the 2.4 GHz ISMband. Despite interference mitigation mechanisms like DSSS and “listen-before-send” incorporated in both standards, it is well established that their mutualinterference can result in notable deterioration of packet delivery performance.Although previous studies have treated this problem both from analytical andexperimental side (Sect. 6), none of them has taken into consideration the specificcharacteristics and operational features of the BAN domain in terms of topologyconfiguration, mobility and radio duty cycle under realistic interference scenariosin typical urban environments.
Our work targets this unexplored area. We present a measurement setup thatallows capturing of a large subset of the parameter space with detail that waspreviously not reported. It supports mobile long-term monitoring of interferenceeffects using symmetric communication and variable transmit power on all six-teen IEEE 802.15.4 channels in the 2.4 GHz band. We (1) report on multi-channelmeasurements from a controlled environment as well as from different urbanenvironments, (2) demonstrate empirical correlation between 802.15.4 packetdelivery performance and “real-life” WLAN activity and (3) explore 802.15.4cross-channel quality correlation and trends that may be used as a potentialtrigger for channel hopping.
We believe that our study is an important step towards a realistic assessmentof how WLAN interference can affect IEEE 802.15.4 BANs and towards thedevelopment of schemes for interference detection and mitigation.
The rest of the paper is structured as follows: in Sect. 2 we describe our ex-perimental setup and provide a definition of the relevant metrics. We present theresults of a set of baseline experiments in Sect. 3 and report on a representativesample of our dataset from an urban environment in Sect. 4. In a “first cut”evaluation we analyze in Sect. 5 the empirical traces for cross-channel qualitycorrelation and trends in the noise floor. In Sect. 6 we discuss related work andpresent our conclusions and plans for future work in Sect. 7.

Study of the Impact of WLAN Interference on IEEE 802.15.4 BANs 3
2 Experimental Setup
This section introduces our measurement platform and provides a definition ofthe relevant metrics.
2.1 Measurement Platform
Our measurements are performed with Tmote Sky [13] (Telos Rev. B) sensornodes, which are equipped with the IEEE 802.15.4-compliant Texas InstrumentsCC2420 transceiver [2]. The CC2420 operates in the 2.4 GHz ISM band, uses O-QPSK modulation and has a data rate of 250 kbps. A packet can be transmittedon one of 16 channels which are spaced 5 MHz apart and occupy frequencies2405 MHz - 2480 MHz as shown in Fig. 1.
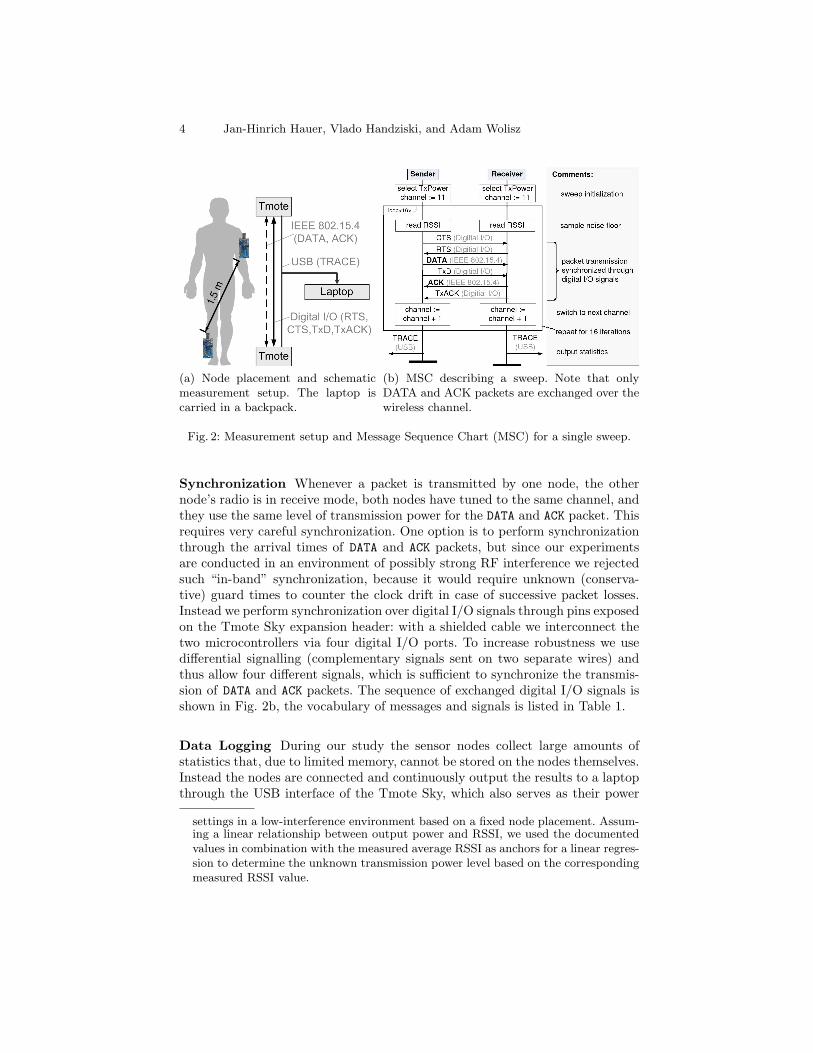
Our setup consists of two nodes, each node is placed in a thin plastic en-closure and strapped to a person: one to the left upper arm, the other on theright shin just above the ankle, resulting in a relative distance of about 1.5 m(Fig. 2a, left). When the person stands still both nodes have the same alignmentand both surface areas are facing in the same horizontal direction. However, inall experiments, the test person is walking at an even speed of about 1.2 m/s(common walking speed). Our setup introduces two auxiliary wired channels:one to synchronize the transmissions on the IEEE 802.15.4 channel; and a sec-ond for streaming measurement results to a laptop. This is schematically shownin Fig. 2a (right) and explained in the following.
Packet Transmission Our measurement software accesses the CC2420 radiodirectly, there is no MAC layer involved and all packets are sent immediately(without clear channel assessment, CCA). Both nodes continuously iterate overthe 16 channels, exchanging one DATA and acknowledgement (ACK) packet perchannel. We call an iteration over all 16 channels – involving 32 packets – asweep. During a sweep the roles of the nodes are fixed: one node sends the DATApackets, the other node sends the ACK packets; after every sweep the roles areswapped. We use acknowledgements, because this is common to many IEEE802.15.4 networks, and we let the nodes swap roles, because this allows us to(better) evaluate link (a)symmetry.
The CC2420 supports different transmission power levels, the datasheet doc-uments 8 discrete levels ranging from−25 dBm to 0 dBm [2]. The relevant TXCTRLregister of the radio, however, accepts 32 different values. The radio manufac-turer confirmed to us that all 32 values are valid, however, “the relation betweenthe register setting and the output power is not linear”. We experimentally de-termined an output power of roughly −42 dBm when the TXCTRL.PA LEVEL isset to the value of 2.1 In our study we then used three different output powerlevels of −10 dBm, −25 dBm and −42 dBm, alternating every sweep. The MSCin Fig. 2b shows the sequence of operations performed during a sweep.1 We chose 38 sender/receiver combinations from a batch of 10 Tmote Sky nodes
and measured RSSI for different documented as well as the undocumented register
4 Jan-Hinrich Hauer, Vlado Handziski, and Adam Wolisz
(a) Node placement and schematicmeasurement setup. The laptop iscarried in a backpack.
(b) MSC describing a sweep. Note that onlyDATA and ACK packets are exchanged over thewireless channel.
Fig. 2: Measurement setup and Message Sequence Chart (MSC) for a single sweep.
Synchronization Whenever a packet is transmitted by one node, the othernode’s radio is in receive mode, both nodes have tuned to the same channel, andthey use the same level of transmission power for the DATA and ACK packet. Thisrequires very careful synchronization. One option is to perform synchronizationthrough the arrival times of DATA and ACK packets, but since our experimentsare conducted in an environment of possibly strong RF interference we rejectedsuch “in-band” synchronization, because it would require unknown (conserva-tive) guard times to counter the clock drift in case of successive packet losses.Instead we perform synchronization over digital I/O signals through pins exposedon the Tmote Sky expansion header: with a shielded cable we interconnect thetwo microcontrollers via four digital I/O ports. To increase robustness we usedifferential signalling (complementary signals sent on two separate wires) andthus allow four different signals, which is sufficient to synchronize the transmis-sion of DATA and ACK packets. The sequence of exchanged digital I/O signals isshown in Fig. 2b, the vocabulary of messages and signals is listed in Table 1.
Data Logging During our study the sensor nodes collect large amounts ofstatistics that, due to limited memory, cannot be stored on the nodes themselves.Instead the nodes are connected and continuously output the results to a laptopthrough the USB interface of the Tmote Sky, which also serves as their power
settings in a low-interference environment based on a fixed node placement. Assum-ing a linear relationship between output power and RSSI, we used the documentedvalues in combination with the measured average RSSI as anchors for a linear regres-sion to determine the unknown transmission power level based on the correspondingmeasured RSSI value.

Study of the Impact of WLAN Interference on IEEE 802.15.4 BANs 5
Table 1: Messages and signals exchanged during the measurements.
Message/Signal
Channel Description
DATA 802.15.4 DATA packet (MPDU of 36 byte)ACK 802.15.4 ACK packet (MPDU of 5 byte)
RTS Digital I/O Sender requests to send a DATA packetCTS Digital I/O Receiver is ready to receive DATA packetTxD Digital I/O Sender has sent a DATA packetTxACK Digital I/O Receiver has sent an ACK packet
TRACE USB Measurement results for a sweep over 16 channels
supply. The laptop is carried in a backpack by the same person that wears thetwo sensor nodes and is also used to monitor 802.11b/g traffic on selected WLANchannels during the experiments.
Sweep-time Performance In our setup the time required for a sweep over 16channels is about 87 ms, which results in around 12 sweeps (384 packets) persecond including streaming the measurement results over USB. This is achiev-able because we increase the Tmote Sky CPU frequency to the maximum of8 MHz and because synchronization over digital I/O is very fast. We took par-ticular care to minimize the impact of streaming the statistics over the USBon the actual measurement and its periodic workflow: most operations relatedto the transmission of 802.15.4 packets and synchronization occur in interruptcontext, while sending serial packets over USB is divided in many small blocksof code that are executed in non-interrupt context. All outgoing/incoming pack-ets are timestamped. After the measurement we use the hardware generatedtimestamps of successful transmissions as anchors, perform a linear regressionto cancel out the clock drift, and obtain precise timing information to verifythat in our setup 802.15.4 data packets are indeed transmitted periodically withan average interarrival time of around 5.5 ms. For example, in the experimentdescribed in Sect. 4.1 we determine an average interarrival time of 5.43 ms (max-imum: 6.45 ms, minimum: 4.39 ms).
2.2 Additional Hardware
We use a portable Wi-Spy 2.4x USB spectrum analyzer to verify that the base-line measurements are conducted in an environment of negligible external RFinterference. The two laptops that generate controlled 802.11b traffic (Sect. 3.2)use Intel PRO/Wireless 2100 network interface cards. In some of our measure-ments we also monitor 802.11b/g traffic using a PC card based on an Atheroschipset plugged into the laptop that collects the measurement results.

6 Jan-Hinrich Hauer, Vlado Handziski, and Adam Wolisz
2.3 Metrics
In our study all 802.15.4 DATA packets are acknowledged and a transmission isdefined as successful if both, DATA and ACK packet, were received without errors.Correspondingly, a transmission has failed if either DATA or ACK packet (or both)were corrupted (CRC check failed). Whenever we report on moving averages,the average is calculated over either 10 or 100 transmissions for a particularchannel and transmission power level. Because a sweep takes about 87 ms andwe use three different transmission power levels alternating every sweep, thiscorresponds to a time window of about 2.6 s (10 transmissions) or 26 s (100transmissions).
The CC2420 radio adds to every received packet the Receive Signal StrengthIndicator (RSSI) level and a Link Quality Indication (LQI) value. We use theformula in the CC2420 datasheet [2] to convert the exported RSSI value todBm. The LQI value from the CC2420 “represents a measurement of correlationbetween the received [and the determined] chip”2 and we always report the rawLQI values ranging from about 110 (maximum quality) to 50 (worst quality).In addition to per-packet RSSI and LQI we measure the noise floor in betweentransmissions by reading the CC2420 RSSI register, which we hereafter callSSInoise.
3 Baseline Measurements
We begin our study with a set of baseline measurement conducted outdoors ina large park, an environment of negligible external RF interference, as verifiedwith the help of a portable spectrum analyzer. The results are intended to givesome confidence in the performance of our setup, to reveal that — at least inthis environment — the effects of mobility are virtually negligible and to showpossible effects of 802.11b interference on 802.15.4 link quality.
3.1 Low Interference
In our first measurement the test person takes a 35 minute walk while the BANmeasures packet loss, noise floor, RSSI and LQI over the 16 different channels.Out of the total 390.096 transmission only 2 failed (one at −42 dBm, the otherat −25 dBm). This is negligible and indicates that with our setup a transmissionpower of −42 dBm is in principle sufficient in this kind of environment. Weobserve only small variance in RSSI, the maximum standard deviation for RSSIon any channel for any out of three given transmission power was 1.54 dBm.However, at −42 dBm transmission power the RSSI is usually around −88 dBm,which is close to the −94 dBm sensitivity threshold specified in the CC2420datasheet. LQI varies a little more, in particular at −42 dBm transmission power,where we observe a maximum standard deviation of 3.10 for channel 11 on onenode. The noise floor was very stable at −99 dBm on both nodes.2 One 802.15.4 symbol is mapped to a sequence of 32 chips resulting in a nominal chip
rate of 2.0 Mchip/s.

Study of the Impact of WLAN Interference on IEEE 802.15.4 BANs 7
802.
15.4
chan
nel
11
16
21
26
802.
15.4
chan
nel
11
16
21
26
802.
15.4
chan
nel
time [seconds]
20 40 60 80 100 120 14011
16
21
26
100
50
0100
50
60
40
20
0
TxPower −10 dBm
TxPower −25 dBm
TxPower −42 dBm
0
faile
d tr
ans−
mis
sion
s (%
)fa
iled
tran
s−m
issi
ons
(%)
faile
d tr
ans−
mis
sion
s (%
)
Fig. 3: Failed 802.15.4 transmissions while walking past two 802.11b stations transmit-ting at maximum rate on 802.11 channel 7. For every 802.15.4 channel the transmissionsare averaged over a window of 10 transmissions, and 802.15.4 packets are transmit-ted with either −10 dBm (top), −25 dBm (middle) or −42 dBm (bottom) transmissionpower, alternating every sweep. The total distance covered is 180 m, the 802.11 networkis located at 100 m distance from the starting point.
3.2 Controlled 802.11b Interference
We are interested in how a nearby 802.11 network can affect the link quality ofthe 16 different 802.15.4 channels. In this experiment we set up two laptops toform an 802.11b ad-hoc network and start a large file transfer from one to theother. Both laptops are placed close to each other on the ground, and generateheavy traffic on 802.11 channel 7 at 11 Mbit/s. The experiment is simple: our testperson first stands 100 m away from the 802.11 network, at time t = 0 s startswalking on a straight line towards it, passes 1 m by the two laptops (at aboutt = 80 s) and continues walking on the same straight line. The BAN measuresthe number of failed 802.15.4 transmissions, the changes in noise floor and per-packet RSSI and LQI. After the experiment we sort the measurement results bythe transmission power level, and produce a contour plot, respectively, showingfailed transmission averaged over a window of 10 transmissions (2.6 s) for eachchannel. The result can be seen in Fig. 3.
The 802.11b network temporarily caused significant packet loss: at −10 dBmtransmission power transmissions failed only at close distance (a few meters),at −25 dBm losses occurred within about ± 10 m, and at −42 dBm the firsttransmissions failed at more than 75 m distance. However, packets were lost onlyon channels that are close to 2442 MHz, the center frequency of 802.11 channel 7,that is mainly on 802.15.4 channels 17 to 20 (compare Fig. 1). According to the802.11 standard, at ± 11 MHz from the center frequency, the radiated energymust be 30 dB lower than the maximum signal level; still, when the 802.15.4

8 Jan-Hinrich Hauer, Vlado Handziski, and Adam Wolisz
0 40 80 120−100
−80
−60
−40
time [seconds]
SS
I nois
e [dB
m]
0 40 80 120−100
−80
−60
−40
time [seconds]
RS
SI [
dBm
]
0 40 80 120
60
80
100
time [seconds]
LQI
−10 dBm
−25 dBm
−42 dBm
TxPower:
Fig. 4: Noise floor (left), RSSI (middle) and LQI (right) on channel 18 over time,extracted from the traces belonging to the experiment shown in Fig. 3.
network transmitted at −42 dBm even channels 15, 16, 21 and 22 suffered short-term losses at close distance.
The results can be interpreted in line with the SINR model: from the per-spective of the 802.15.4 BAN the 802.11b laptops generate interference, whichdecays (non-linearly) with distance. When approaching the interferers, at a cer-tain distance the ratio of received power in the 802.15.4 signal to the power ofthe interference is too low for the CC2420 radio to correctly decode the symbolsand packets are lost.
Fig. 4 shows the dynamics in the noise floor, RSSI and LQI. The figure onlyshows the results for 802.15.4 channel 18, because it was one of the most affectedby packet loss. Naturally RSSI and LQI are only available for received packets,but the respective graphs (middle and right in Fig. 4) give some first insight intemporal trends around the losses.
As expected, the noise floor increases with smaller distance to the 802.11bnetwork; however, even at very close distance (around t = 80 s), we see a range ofdifferent SSInoise values, some as low as −99 dBm. A possible explanation is thatthe 802.11 stations are not permanently transmitting. For example, there are atleast short Inter-Frame Spaces (IFS) between 802.11 packets during which thechannel is idle. The CC2420 averages a single SSInoise reading over 128µs, andit can thus happen that a sample is taken while the channel is (partially) idle.This indicates that a single SSInoise value is rather unreliable for determiningpresence of an interferer.
RSSI seems almost unaffected by the 802.11 traffic, but LQI shows highervariance as distance to the 802.11 network decreases, especially at −42 dBmtransmission power. This is understandable since LQI represents a measure ofcorrelation between 802.15.4 chips: single chips may be corrupted by 802.11interference while the symbols are still correctly decoded.
4 Urban Measurement Campaign
We made measurements in three different environments in the city of Berlin,Germany: at a shopping street, in a central residential area and in an officearea. During all measurements the test person was walking outdoors on the

Study of the Impact of WLAN Interference on IEEE 802.15.4 BANs 9
802.
15.4
chan
nel
16
21
11
26
802.
15.4
chan
nel
16
21
11
26
802.
15.4
chan
nel
19:05h 19:15h 19:25h19:00h 19:10h 19:20h 19:30h
16
21
11
26
100
50
0
0
20
40
60
3
2
1
TxPower −42 dBm
TxPower −25 dBm
faile
d tr
ans−
mis
sion
s (%
)fa
iled
tran
s−m
issi
ons
(%)
TxPower −10 dBm
faile
d tr
ans−
mis
sion
s (%
)
Fig. 5: Failed 802.15.4 transmissions while walking along an urban shopping street. Forevery 802.15.4 channel the transmissions are averaged over a window of 100 trans-missions (26 s), and packets are sent with three different transmission power levels:−10 dBm (top), −25 dBm (middle) or −42 dBm (bottom), alternating every sweep.
urban streets using the same setup as described previously. A single measurementtypically lasted around 30 minutes. As a case study in this section we report onone such measurement in detail, in the next Sect. 5 we present an evaluation ofthe empirical traces from all measurements.
The measurement described in the rest of this section was made at a centralurban shopping street. Buildings were located on either side of the roughly 30 mwide street, which was moderately frequented by cars and other pedestrians ona weekday evening at 7 p.m. The test person took a 30 minute walk outdoorsalong the pavement passing by shops, coffee bars and offices as well as otherpedestrians. The walk was one-way and close to straight-line at even walkingspeed (stopping only at red traffic lights).
4.1 Transmission Failures
Fig. 5 shows failed 802.15.4 transmissions averaged over 100 transmissions perchannel (about 26 s) sorted by transmission power.
The losses for −10 dBm transmission power (top) are negligible, even at−25 dBm (middle) we never see more than 60 % loss within a window of 26 son any channel. At −42 dBm (bottom) transmissions failed more frequently andsome channels were temporarily completely blocked. The figure suggests thatlosses were not completely random. Instead they showed some correlation intime and frequency, sometimes lasting for a few tens of seconds up to multipleminutes and spanning over multiple consecutive 802.15.4 channels.
Fig. 6 shows a 2 minute excerpt of the bottom Fig. 5 at around 19:03 h. In thisfigure transmissions are averaged over a window of 10 transmissions (2.6 s) as inthe baseline measurement shown in Fig. 3. When comparing these two figureswe find that in Fig. 6 the pattern at around 19:03 h to 19:04 h on channels 13closely resembles the 802.11b “footprint” in Fig. 3, which suggests that theselosses might have been caused by 802.11 traffic.

10 Jan-Hinrich Hauer, Vlado Handziski, and Adam Wolisz
802.
15.4
chan
nel
19:02:45h 19:03:25h 19:04:05h 19:04:45h11
16
21
26
100
50
0
faile
d tr
ans−
mis
sion
s (%
)
Fig. 6: Two minute excerpt from bottom Fig. 5, averaged over 10 transmissions.
19:00h 19:05h 19:10h 19:15h 19:20h 19:25h 19:30h100
80
60
40
20
0
faile
d tr
ansm
issi
ons
(%)
on
IEE
E 8
02.1
5.4
chan
nel 1
8
19:00h 19:05h 19:10h 19:15h 19:20h 19:25h 19:30h0
80
160
240
320
traf
fic o
n 80
2.11
b/g
cha
nnel
7
(pac
kets
per
sec
ond)
IEEE 802.15.4
IEEE 802.11
Fig. 7: 802.15.4 transmission failures on channel 18 using transmission power −42 dBm(left Y-Axis) and 802.11b/g traffic on WLAN channel 7 (right Y-Axis) averaged overa window of about 26 s.
4.2 Correlation with 802.11b/g Traffic
During the experiments the 802.11b/g card of the laptop that collected thestatistics from the nodes was set to passive monitoring mode so that all 802.11traffic on a given channel was captured. We tuned the card to 802.11 channel7, because it is one of the most commonly used. In this way we measured twothings in parallel: 802.15.4 failures on all channels and 802.11b/g traffic on 802.11channel 7.
In Fig. 7 one can see both, failures on 802.15.4 channel 18 using transmissionpower −42 dBm and the number of received 802.11 packets on channel 7, aver-aged over 100 transmissions in the 802.15.4 network (26 s). As shown in Fig. 1,802.11 channel 7 completely overlaps with 802.15.4 channel 18. The results ap-pear (negatively) correlated both, visually and statistically. The empirical cor-relation coefficient is r = -0.89, which when squared is 0.79 and describes theproportion of variance in common between the number of 802.15.4 failures andreceived 802.11 packets when averaged over a window of 26 s. This suggests thatin this experiment 802.11 was indeed the cause for considerable packet loss, atleast on channel 18.
When we repeated the measurement at other locations we observed less cor-relation (correlation coefficients around r = -0.4). It must be noted, however,that the correlation coefficients indicate only linear dependency and that thenumber of received 802.11 packets is a rather coarse metric because it does nottake, for example, packet size or signal strength into consideration.

Study of the Impact of WLAN Interference on IEEE 802.15.4 BANs 11
19:00h 19:05h 10:10h 19:15h 19:20h 19:25h 19:30h4
10
16
succ
essf
ul tr
ans−
m
issi
ons
per
swee
p
TxPower −42 dBm
TxPower −25 dBm
TxPower −10 dBm
Fig. 8: Successful transmissions per sweep for the measurements described in Sect. 4.1.
5 Evaluation of Selected Aspects
The measurement results from three different urban environments provided uswith a large dataset to explore. In the following we analyze this dataset todetermine (1) the interrelation of the transmission quality on different channelsat a given point in time, and (2) whether trends in the noise floor can indicate a(future) decrease of transmission quality. The first helps understanding to whatextent channel hopping could improve transmission quality, the second givesinsight in a potential (dynamic) trigger for channel switching.
Our evaluation is an important starting point, but also has its limitations: itis trace-driven and therefore the results are applicable only for the particular en-vironments, the specific mobility pattern and node placement. Our measurementsetup also allows us to abstract from many practical issues such as schedulingperiodic noise sampling so that transmissions of other nodes do not interfere.
5.1 Cross-channel Quality Correlation
We are interested in the correlation of transmission failures over different chan-nels at (roughly) the same time. Little correlation would mean that they sharelittle variance and thus there is a greater probability that a “good” channel isavailable at a given point in time. In the following we first examine the fractionof good channels over time, then report on the empirical correlation betweenthe channels and finally evaluate post factum how many hops an ideal frequencyhopping scheme would have required to achieve 0 % transmission failures.
Fig. 8 shows the number of successful transmissions per sweep over timefor the measurement described in Sect. 4.1 (it was the environment where weobserved most transmission failures). At −10 dBm and −25 dBm transmissionpower for the majority of time the transmissions succeeded on almost all chan-nels. Even for −42 dBm the number of good channels rarely dropped below 10,only at around 19:07 h temporarily 13 out of the 16 available channels wereblocked. This means that in principle there were enough good channels at anypoint in time.
From the figure one cannot conclude how much variance the different chan-nels have in common. We calculated the empirical correlation coefficients forthe number of failed transmissions over time between all channels and foundthat they are often very low (typically around zero). For example, for −42 dBmtransmission power the maximum correlation coefficients for any two channels

12 Jan-Hinrich Hauer, Vlado Handziski, and Adam Wolisz
802.
15.4
chan
nel
11
16
21
26
100
50
0
faile
d tr
ans−
mis
sion
s (%
)
802.
15.4
chan
nel
18:15h 18:20h 18:25h 18:30h 18:35h 18:40h 18:45h11
16
21
26
−95
−90
−85
−80
−75
SS
I nois
e [dB
m]
Fig. 9: Failed 802.15.4 transmissions at −42 dBm transmission power while walkingthrough a central urban residential area (top). The bottom figure shows the noise floormeasured during the same experiment. The results are averaged over a window of 100transmissions per channel (26 s).
in the three measurements were r2 = 0.1844, r2 = 0.1052, and r2 = 0.0336,respectively.
We are interested in the minimum number of channel switches that wouldhave been required to achieve 0 % transmission failures. In other words, theminimum number of hops that an ideal channel hopping scheme with preciseknowledge of the future channel conditions would have taken to guarantee thatall transmissions succeeded. We implemented a simple greedy algorithm thatreplays the empirical traces, starting from the first transmission and proceedingin time. The algorithm examines all transmissions and chooses the channel thatprovides 0 % transmission failures for the maximum time ahead. It proceedsin time on this channel until a transmission failure occurs and switches thechannel during this very sweep, again by choosing the channel that provides 0 %transmission failures for the maximum time ahead (from the previous evaluationwe know that there is always a “good” channel). It repeats this step until itreaches the end of the empirical trace and then outputs the overall (minimum)number of channel switches (hops).
When the algorithm replayed the traces from the three measurements thetotal number of channel switches for −10 dBm transmission power was zerofor all three empirical traces, which means there was at least one channel onwhich no failures occurred, respectively. At −25 dBm transmission power twoor three hops were required. And at −42 dBm the measurement described inSect. 4.1 required 50 hops (note that Fig. 5 shows moving averages over 100transmissions), resulting in an average hopping frequency of about 2 Hz. Theempirical results from the residential and office area corresponded to 27 and 38channel switches, respectively.
5.2 Prediction of the Link Quality Degradation
A brief examination of the measurement results revealed that a substantial in-crease in noise floor is typically accompanied by heavy packet loss, in particular

Study of the Impact of WLAN Interference on IEEE 802.15.4 BANs 13
−120 −90 −60 −30 0 +30 +60 +90 +120−100
−95
−90
−85
−80
−75
−70
−65
time [seconds]
SS
I nois
e [dB
m]
TxPower −42 dBm
(a) −42 dBm transmission power: between0 s and 26 s ≥ 90 % transmissions failed.
−120 −90 −60 −30 0 +30 +60 +90 +120−100
−95
−90
−85
−80
−75
−70
−65
time [seconds]
SS
I nois
e [dB
m]
TxPower −25 dBm
(b) −25 dBm transmission power: between0 s and 26 s ≥ 50 % transmissions failed.
Fig. 10: Noise floor within a window of ±2 minutes around heavy transmission failures(starting at 0s). SSInoise is arithmetically averaged over the past 26 s (prior movingaverage).
at −42 dBm transmission power. For example, Fig. 9 shows failed transmissionsover time (top) together with a contour plot of the noise floor (bottom) averagedover 100 transmissions; this measurement was made in an urban residential areaon a Friday afternoon.
We are interested in the dynamics of SSInoise around the point in timewhen the quality of a communication link experiences significant degradation.For −42 dBm transmission power we define the threshold as ≥ 90 % transmissionfailures within 100 transmissions on a given channel, that means ≥ 90 % failureswithin 26 s. An analysis of the empirical traces reveals 8 (shopping street), 11(residential area) and 2 (office area) = a total of 21 occurrences of significantlink quality degradation. For every occurrence we extract SSInoise on the givenchannel within a window of ±2 minutes (roughly 1000 noise floor samples andcorresponding to a SSInoise sampling frequency of 4 Hz). Note that in our anal-ysis we count only the first occurrence per channel (otherwise there was a totalof 26 occurrences) and we ignore channels that already had significant losses atthe beginning of the measurement, because for them the previous 2 minutes arenot available.
Fig. 10a shows the results for −42 dBm transmission power. Since we are in-terested in general trends independent of the environment or a particular channelit includes the results from all measurements, one graph for every occurrence oflink quality degradation. Each graph is aligned relative to the beginning of sig-nificant link quality degradation, which is represented by the vertical dashed lineat time t = 0 s. This means, starting from t = 0 s the next 90 or more out of100 transmissions failed, respectively. SSInoise is arithmetically averaged overthe past 26 s (prior moving average). A single point on one of the 21 graphs thusincludes the current as well as the history of 99 previous noise floor samples.
At −25 dBm output power transmission failures were less frequent and wetherefore reduced the threshold to ≥ 50 % transmission failures within a window

14 Jan-Hinrich Hauer, Vlado Handziski, and Adam Wolisz
of 26 s. This resulted in a total of 5 occurrences of link quality degradation asshown in Fig. 10b.
Discussion The graphs show similar trends: at time t = −120 s the average(past) noise floor is typically below −95 dBm, respectively. Between t = −120 sand t = 0 s it increases slightly and the most substantial increases are observablearound and especially short after t = 0 s, which is also the start of significanttransmission failures. Right-shifting the dashed line by 13 s as well as left-shiftingthe noise floor graphs by 13 s, respectively, establishes temporal alignment be-tween the moving averages. It is then clearly observable that significant linkquality degradation corresponds with a simultaneous increase in average noisefloor, which strongly suggests that external RF interference is indeed causing thepacket loss. The graphs are typically bell-shaped, which is likely a result fromwalking past a stationary interferer (for example, a WLAN access point).
The results suggest also that (the history of) noise floor observations may bevaluable input to a link estimator. Especially at lower transmission frequencytrends in the noise floor may be observable before a communication link ex-periences significant degradation. Increasing the noise floor sampling frequencyand using more elaborated statistical techniques than a simple moving averageare likely to have better predictive quality. We consider these topics part of ourfuture work.
6 Related Work
The problem of coexistence between IEEE 802.11 and IEEE 802.15.4 networkshas received significant interest from the research community. Most early workconcentrated on developing probabilistic models that capture the dependence ofinterference-related packet loss in a 802.15.4 network based on frequency overlapand duty cycle, transmit power and distance of an 802.11 interferer [18]. Othersanalyzed the reverse problem, that is the impact of 802.15.4 networks on 802.11devices [7], concluding that it is little to non-existing. A recent experimentalstudy comes to a different conclusion, reporting that 802.15.4 devices may causesignificant packet loss in an 802.11 network under specific conditions [16]. Priorwork assessing the impact of WLAN interference on static 802.15.4 networksin lab environments typically reported on severe packet loss at small distancesbetween the interfering devices [5].
Recently several 802.15.4 radio chip manufacturers have published guidelinesto mitigate interference effects between the two technologies [11, 17, 4], for ex-ample, through minimal frequency offset of 20 MHz , spatial separation of 2 mand the use of the complete protocol stack (using ARQ to translate losses intolatency) [17]. Acknowledging the problem, the IEEE 802.15 Task Group 4e cur-rently investigates how to incorporate frequency hopping in the MAC layer.Meanwhile, recent revisions of standards that build on top of the 802.15.4, al-ready incorporate simple frequency agility methods like periodic random channelhopping [19, 6].

Study of the Impact of WLAN Interference on IEEE 802.15.4 BANs 15
There is not so much experimental work on the specific challenges and oppor-tunities of 802.15.4 BANs. Some recent studies have examined the performanceof mobile 802.15.4 person-to-person communication, as well as with static re-ceivers [3, 12]. This work targets the impact of the human body on an inter-BANcommunication link under specific mobility patterns, rather than external RF in-terference. Despite their static setup, the study presented in [14] is closest to ourwork: it focuses on detecting and mitigating the WLAN interference impact on802.15.4 networks in an office setting. Targeting stationary networks, their mea-surement setup is optimized for more stable interference configurations, which isalso reflected in the significantly higher duration of the sweep time compared toour setup (1.6 s vs. 85 ms). Their results confirm the correlation between 802.15.4packet loss and 802.11 activity, as well as the suitability of noise-based predictorsof WLAN interference.
7 Conclusions and Future Work
The effects that we observed in the isolated baseline measurements could, tosome extent, also be recognized in the urban environments: transmission failuressometimes span over multiple consecutive 802.15.4 channels, are often correlatedin time and substantial losses are typically accompanied by an increase in thenoise floor. This suggests that external interference, in particular the virtuallyomnipresent WLAN, can be a major cause for substantial packet loss in IEEE802.15.4 body area networks. However, in our configuration this is true only forthe very low-power regime: already at −10 dBm transmit power transmissionfailures were negligible.
An obvious conclusion for the design of BAN protocols is to use higher trans-mission power (the IEEE 802.15.4 default is 0 dBm). On the other hand, thereare several arguments for using low transmission power in BANs: less interfer-ence for other networks; less absorption of electromagnetic energy by the humanbody; less energy spent by the transceiver and thus longer lifetime (especiallyimportant for implanted sensors); less susceptibility for eavesdropping.
Adaptive transmission power control seems a promising approach to unitethese requirements. Investigating the overhead of more effective interference eva-sion mechanisms, more intelligent noise “probing” approaches, combined withlearning algorithms, as presented in [15], seem to be another promising directionof research that warrants experimental validation.
References
1. G.-Z. Yang, editor. Body Sensor Networks. Springer Verlag, 2006.2. Texas Instruments. CC2420 2.4 GHz IEEE 802.15.4 / ZigBee-ready RF
Transceiver. http://www.ti.com/lit/gpn/cc2420, Apr. 2002.3. J. Espina, T. Falc, and O. Mulhens. Body Sensor Networks, chapter Network
Topologies, Communication Protocols, and Standards, pages 145–182. SpringerVerlag, 2006.

16 Jan-Hinrich Hauer, Vlado Handziski, and Adam Wolisz
4. Freescale Semiconductor. Mc1319x coexistence - application note. http://www.
freescale.com.5. N. Golmie, D. Cypher, and O. Rebala. Performance analysis of low rate wireless
technologies for medical applications. Computer Communications, 28(10):1255–1275, 2005.
6. HART field communication protocol specifications: TDMA data link layer specifi-cation. HCF SPEC-75, 2008.
7. I. Howitt and J. Gutierrez. IEEE 802.15.4 low rate - wireless personal area networkcoexistence issues. Wireless Communications and Networking, 2003. WCNC 2003.2003 IEEE, 3:1481–1486 vol.3, March 2003.
8. IEEE standard for information technology - telecommunications and informationexchange between systems - local and metropolitan area networks specific require-ments part 15.4: wireless medium access control (MAC) and physical layer (PHY)specifications for low-rate wireless personal area networks (LR-WPANs). IEEEStd 802.15.4-2003, pages 1–670, 2003.
9. IEEE standard for information technology - telecommunications and informationexchange between systems - local and metropolitan area networks - specific re-quirements. - part 15.1: Wireless medium access control (MAC) and physical layer(PHY) specifications for wireless personal area networks (WPANs). IEEE Std802.15.1-2005 (Revision of IEEE Std 802.15.1-2002), pages 1–580, 2005.
10. IEEE standard for information technology-telecommunications and informationexchange between systems-local and metropolitan area networks-specific require-ments - part 11: Wireless LAN medium access control (MAC) and physical layer(PHY) specifications. IEEE Std 802.11-2007 (Revision of IEEE Std 802.11-1999),pages C1–1184, 12 2007.
11. Jennic Ltd. Co-existence of IEEE 802.15.4 at 2.4 GHz - application note. http:
//www.jennic.com/.12. E. Miluzzo, X. Zheng, K. Fodor, and A. T. Campbell. Radio characterization of
802.15.4 and its impact on the design of mobile sensor networks. In Proc. of 5thEuropean Workshop on Wireless Sensor Networks (EWSN), Bologna, Italy, Jan.2008. Springer.
13. Moteiv Corporation. Tmote sky datasheet. http://www.sentilla.com/pdf/eol/
tmote-sky-datasheet.pdf.14. R. Musaloiu-E. and A. Terzis. Minimising the effect of WiFi interference in 802.15.4
wireless sensor networks. Int. J. Sen. Netw., 3(1):43–54, 2008.15. S. Pollin, M. Ergen, M. Timmers, A. Dejonghe, L. van der Perre, F. Catthoor,
I. Moerman, and A. Bahai. Distributed cognitive coexistence of 802.15.4 with802.11. Cognitive Radio Oriented Wireless Networks and Communications, 2006.1st International Conference on, pages 1–5, June 2006.
16. S. Pollin, I. Tan, B. Hodge, C. Chun, and A. Bahai. Harmful coexistence be-tween 802.15.4 and 802.11: A measurement-based study. Cognitive Radio OrientedWireless Networks and Communications, 2008. CrownCom 2008. 3rd InternationalConference on, pages 1–6, May 2008.
17. G. Thonet, P. Allard-Jacquin, and P. Colle. ZigBee - WiFi coexistence, white paperand test report. Technical report, Schneider Electric, 2008.
18. D. G. Yoon, S. Y. Shin, W. H. Kwon, and H. S. Park. Packet error rate analysis ofIEEE 802.15.4 under IEEE 802.11b interference. Vehicular Technology Conference,2006. VTC 2006-Spring. IEEE 63rd, 3:1186–1190, May 2006.
19. ZigBee Alliance. ZigBee specification. ZigBee Document 053474r17, 2008.