interference impact in wlan performance evaluation
TRANSCRIPT
Interference Impact in WLAN Performance
Evaluation
Bachelor Thesis
Supervisor: Prof.Dr.-Ing Javier Rodriguez Fonollosa
Assistants: Dipl.-Ing. Dr.techn. Philipp Svoboda
Dipl.-Ing. Blanca Ramos
Bachelor's degree in Telecommunications Systems Engineering
By
Enric Serra Perramon
Wien, October 2017

Enric Serra Perramon Page 2 of 39 Student ID: 46363947H Interference Impact in WLAN Performance Evaluation
Abstract
The main objective of this document is to develop a model and study the impact of the
interference produced by microwave ovens into the widely deployed Wi-Fi networks in residential
places. We study the interference of a real Microwave Oven (MWO) signal in the 2.4 GHz band,
in terms of data-rate, jitter and delay, considering different Access Points (AP). For the sake of
repeatability, we simulate a MWO signal and we compare the performance with the real
Microwave signal. Afterwards, we evaluate different indoor scenarios. First of all, we will explain
the main characteristics of Wi-Fi networks and how they work. As we will see in this thesis,
results presented were carried out in an antenna chamber. Results show the need to properly
perform more experiments in this field in order to provide more information in a future, seeing the
quickness and growth of the technologies in wireless communications.

Enric Serra Perramon Page 3 of 39 Student ID: 46363947H Interference Impact in WLAN Performance Evaluation
To Schäffergasse team, who believed in me
Enric Serra Perramon Page 4 of 39 Student ID: 46363947H Interference Impact in WLAN Performance Evaluation
Acknowledgements
This document wouldn't be the same without the help and perseverance of Blanca Ramos, Phd
student in TU Wien and also Philipp Svoboda. Also special mention to the Technology University
of Vienna, where I had the great opportunity to take part of an Erasmus mobility program.

Enric Serra Perramon Page 5 of 39 Student ID: 46363947H Interference Impact in WLAN Performance Evaluation
Revision history and approval record
Revision Date Purpose
0 25/02/2017 Document creation
1 19/05/2017 Document revision
2 26/06/2017 Document revision
3 03/10/2017 Document revision
4 06/10/2017 Final Revision
DOCUMENT DISTRIBUTION LIST
Name e-mail
Enric Serra [email protected]
Philipp Svoboda [email protected]
Blanca Ramos [email protected]
Javier Rodriguez Fonollosa [email protected]
Written by: Reviewed and approved by:
Date 06/10/2017 Date 06/10/2017
Name Enric Serra Name Blanca Ramos
Position Project Author Position Assistant

Enric Serra Perramon Page 6 of 39 Student ID: 46363947H Interference Impact in WLAN Performance Evaluation
Table of contents
Abstract ........................................................................................................................................................ 2
Acknowledgements ..................................................................................................................................... 4
Revision history and approval record ................................................................................................... 5
Table of contents ......................................................................................................................................... 6
List of Figures ............................................................................................................................................. 7
List of Abbreviations ................................................................................................................................. 8
1. Introduction ....................................................................................................................................... 9
1.1. 802.11 Standard and its history ........................................................................ 10
1.2. State of the art and motivation .......................................................................... 13
1.3. Outline .............................................................................................................. 14
2. Setup-Antenna room ..................................................................................................................... 15
2.1. Wavemoon tool ................................................................................................ 17
2.2. Attenuator ......................................................................................................... 19
2.3. SMU ................................................................................................................. 19
3. Signal generation ........................................................................................................................... 22
3.1. MWO signal description .................................................................................... 22
3.2. MWO signal generated ..................................................................................... 25
4. Measurements ................................................................................................................................. 27
4.1. Measurements with the microwave oven signal ................................................ 28
4.2. Measurements with the Matlab generated signal .............................................. 33
4.3. Comments ........................................................................................................ 36
5. Budget ................................................................................................................................................ 36
6. Conclusions and future development ..................................................................................... 37
7. Bibliography .................................................................................................................................... 38
Enric Serra Perramon Page 7 of 39 Student ID: 46363947H Interference Impact in WLAN Performance Evaluation
List of Figures
Figure 1: Global number of public hotspots ..................................................................................... 9
Figure 2: Gantt diagram ................................................................................................................. 10
Figure 3: 2.4 GHz frequency bands ................................................................................................ 12
Figure 4: Global Public Wi-Fi Hotspots ......................................................................................... 13
Figure 5: Distribution of the experimenting ................................................................................... 16
Figure 6: Distance between router and antenna ............................................................................. 17
Figure 7: Antenna setup .................................................................................................................. 17
Figure 8: Wavemon control screen ................................................................................................ 18
Figure 9: Model of the attenuator ................................................................................................... 19
Figure 10: SMU 200A ..................................................................................................................... 21
Figure 11: Signal model .................................................................................................................. 24
Figure 12: Matlab signal ................................................................................................................ 25
Figure 13: Generated signal in frequency domain ......................................................................... 26
Figure 14: Original microwave signal ............................................................................................ 26
Figure 15: Generated signal in time domain .................................................................................. 27
Figure 16: DV2220 device results with MWO at 700 W ................................................................. 29
Figure 17: DV2220 device results with MWO at 250 W ................................................................. 30
Figure 18: FB7390 device results with MWO at 700 W ................................................................. 30
Figure 19: FB7390 device results with MWO at 250 W ................................................................. 31
Figure 20: DV2210 device results with MWO at 700 W ................................................................. 31
Figure 21: DV2210 device results with MWO at 250 W ................................................................. 32
Figure 22: DV2220 device results with generated signal at 700 W ................................................ 33
Figure 23: DV2220 device results with generated signal at 250 W ................................................ 33
Figure 24: FB7390 device results with generated signal at 700 W ................................................ 34
Figure 25: FB7390 device results with generated signal at 250 W ................................................ 34
Figure 26: DV2210 device results with generated signal at 700 W ................................................ 35
Figure 27: DV2210 device results with generated signal at 250 W ................................................ 35
Figure 28: Project Budget ............................................................................................................... 37

Enric Serra Perramon Page 8 of 39 Student ID: 46363947H Interference Impact in WLAN Performance Evaluation
List of Abbreviations
AP Access Point
CSMA/CA Carrier Sense Multiple Access with Collision Avoidance
DL Downlink
IEEE Institute of Electrical and Electronics Engineers
ISM Industrial, Scientific and Medical
LAN Local Area Network
MAC Media Access Control
MWO Microwave Oven
PC Personal Computer
PHY Physical Layer
RSSI Received Signal Strength Indicator
UL Uplink
WLAN Wireless Local Area Network

Enric Serra Perramon Page 9 of 39 Student ID: 46363947H Interference Impact in WLAN Performance Evaluation
1. Introduction
There are many technologies that we all use every day and influence our daily life. In particular,
Wi-Fi networks are widely extended due to its simplicity in terms of use at the client side, as well
as the convenience of having any wire between the device we are using and the network in which
we are connected. Therefore this document is focused in such technology. One of the main
problems with such technology is that there is no current central control coordinator among Wi-Fi
networks. If we look back in the past ten years we can see on Figure 1 how the use of this kind of
technologies has been rising abruptly [1]. We are going to deepen in a Wi-Fi network environment.
As technologies will grow massively in the next years, most of them are going to work wirelessly
and of course the number of devices that are going to be working at the same time will
substantially increase. All those devices will interfere each other, but with help of cancellation
algorithms, such interference could be mitigated. Nevertheless, some other devices are interfering
in the same working band. In particular, many residential and industrial devices radiate in the 2.4
GHz band.
To analyze, for example, how residential microwaves that most people have in their kitchen or in a
office can interfere with WLAN networks and how can affect the streaming of a video or the
Figure 1: Global number of public hotspots

Enric Serra Perramon Page 10 of 39 Student ID: 46363947H Interference Impact in WLAN Performance Evaluation
transmission of a message or file. We will study the impact by analysing the data rate at the client
side. We have used Matlab software and knowledge about telecommunications systems related
with antennas and with Wi-Fi networks. The first part has taken almost two months to be
completed while the second part has been performed among the last three months including July
2017. In the following image we can see the Gantt diagram that I have been following during the
realization of this project. We can see that there have been difficulties with the second part, just
because some delays during the correct functionality of the antenna room and its availability. Also,
final months of the project have been used in order to analyze results obtained and to write the
thesis.
1.1. 802.11 Standard and its history
First of all we are going to focus on the 802.11 standard which has very to do with the project that
we are going to develop. The 802.11 standard is one of the most used and well-known IEEE
standards. It is used in many applications due to its very easy way of working and dealing with
regulations. There are many devices which work with Wi-Fi technology, such as printers, laptops,
game consoles, digital cameras or tablets. It is important also to define the OSI1 model and how it
concerns our communications.
The OSI model refers to a conceptual model which standardizes the functions of every each
communications systems. The original version of this model was created considering seven
different layers. Each layer has the function to communicate with the other ones as an
1 OSI model: Open System Interconnection Model
Figure 2: Gantt diagram

Enric Serra Perramon Page 11 of 39 Student ID: 46363947H Interference Impact in WLAN Performance Evaluation
interoperability protocol. In order to make easier to integrate different technologies, the IEEE2
started working in 802 family standards. The aim of this family standards was to make all the
technologies work together. All these standards deal with local area networks and metropolitan
area networks. One of the most important characteristics that these standards have in common is
the fact that they use variable-size packets. It was 1991 when a company which now it worldly
known as Nokia, but that time was known as NCR Corporation, developed a kind of precursor to
802.11. It was only used for cashier systems. The first products developed had data rates between
1 Mbps and 2 Mbps. Later on, speeds were significantly growing as a result of the cooperation and
the investigation. So we could find speeds up to 11 Mbps only about two years later after NCR
Corporation started the research in that field.
Nowadays, Victor Hayes is considered one of the fathers of the Wi-Fi technology, due to his work
in the IEEE 802.11 Standards Working Group for Wireless Local Area Networks. In 1999, IEEE
802.11b specification was created and the WECA3 was formed. It was the creation of the Wi-Fi
Alliance which allowed the world-spread of the technology. The Wi-Fi Alliance is a non-profit
organization that has the main objective to promote and to certify the Wi-Fi technology worldwide.
The standard 802.11 was created in 1997 by the IEEE and since then it has been one of the most
useful standards ever used in wireless communications. This standard regards to two layers: MAC4
and PHY5. The PHY and MAC layers are the ones that take into account de lowest levels of any
telecommunication transmission. The first one (Medium Access Control) is the layer where two or
more devices agree to start a communication through a shared medium, for example, an Etherent
network. On the other hand, the PHY label takes into account the specific physical transmission of
the bits. As this standard has been very used over the last years there have been many updates of it.
So we can find for example the 802.12 or 802.13.
The MAC layer refers to the layer that has the function to address and to provide the channel
access, using some protocols and mechanisms to do that. The PHY, in the other hand, has the main
function to implement electronically and to provide the circuitry necessary to implement physical
layers. Both layers take a very huge responsibility in the implementation of the WLAN devices, so
with that, wireless communications can work properly.
2 Institute of Electrical and Electronic Engineers
3 WECA: Wireless Ethernet Comptability Alliance
4 MAC: Medium Access Control
5 PHY: Physical Layer

Enric Serra Perramon Page 12 of 39 Student ID: 46363947H Interference Impact in WLAN Performance Evaluation
The 802.11 standard created by the IEEE shows different frequency ranges available to be used.
Each range is then divided in different channels, and every country or competent entity has its own
regulations and decisions about each channel, for example when power levels are considered and
taken into account. Industrial, Scientific and Medical bands, on the contrary, are frequency bands
which that are worldwide reserved for non-commercial uses, so they are used in areas such as
Industrial, Scientific and Medical purposes [2]. In Europe, ETSI6 is responsible for governing ISM
bands. The 802.11 standard has achieved an agreement to document use in five different range of
frequencies, which the most crowded is 2.4 GHz. The 2.4 GHz band is divided in different
channels of approximately 20-22 MHz [2]. Normally the availability of the channels depends on
the regulations and laws of each particular country. Also the band can be divided in channels of 40
Mhz, so the interference between channels is much more intensive.
We can see in Figure 3 that most of the channels overlap between them, so interferences are
present. It is really common to use channels 1,6 and 11. The reason, of course, is because they
don't overlap between them, as they work in different frequency ranges. Despite of this fact,
sometimes, the real problem is not if they overlap at all, but if there are other devices that are
working in some near channels. So the fact is, that we should avoid another device which works
on the adjacent channel. If this happens, the interference will be much higher. As we said before,
device such an oven microwave could interfere. Also it could be thought following the common
sense to use some channels that have partial overlapping between them rather than using two
channels which are the same one, so of course they have a total overlapping. But here is where
there is an crucial element of the technology which takes part. It is called the CDMA protocol.
This is considered as a mechanism which tries to be a referee between both devices that try to be
on the same frequency. Devices need to listen to the channel, this means they have to check if the
channel is free, so there is no other one connected so they can use it. If there is somebody already
6 ETSI: European Telecommunication Standards Institute
Figure 3: 2.4 GHz frequency bands

Enric Serra Perramon Page 13 of 39 Student ID: 46363947H Interference Impact in WLAN Performance Evaluation
using it, then we are not going to use that channel. The aim is to avoid collisions, but also the main
disadvantage is the appearance of delays in the transmission of the information.
1.2. State of the art and motivation
There is a lot of research done by many universities and professional people that dedicate their
entire life in studying in such a subject like wireless communications [3], [4]. For sure it is a very
deep field and needs also lot of research to be done. It is one of the main areas where its success
will definitely chance our lives and the way we conceive nowadays telecommunications. The
project we are dealing with has of course many applications and it is not new, there is lot of
scientific and engineer people that are working and doing almost the same as we are carrying out
[5]. Investigating in this field can help a lot many following generations and considering the future
devices that are going to appear on the market on the next 25 years, we should take it seriously
talking about interferences. This role that nowadays wireless communications have cannot be
underestimated [7].
According to Cisco Visual Networking Index (VNI)7 in the following years, concretely in 2021,
the monthly traffic global mobile data traffic will be 49 exabytes8 [1]. On the following image we
can see the number of Wi-Fi hotspots available worldwide and the growth that is expected to be in
the following years. We can see how fast lots of countries all over the world will grow in
technology aspects, in general, in Asia and Africa continents, the growth will be very huge.
7 This company tries to track and forecast the impact of visual networking applications on global
networks. 8 1 exabyte=10
18 bytes
Figure 4: Global Public Wi-Fi Hotspots

Enric Serra Perramon Page 14 of 39 Student ID: 46363947H Interference Impact in WLAN Performance Evaluation
That's why we need to study and know very well this technology. Many people will want
information about such technology in the future. And if the expectations of world traffic data reach
the levels that are expected to be, we will need to find any kind on solution in order to avoid as
much as we can interferences between wireless devices. This is the aim of this project and this is
how I planned at first when I started working on it.
1.3. Outline
The document is organized as follows. We have already seen an introduction of this project where
some information related with wireless devices have been carefully explained. Chapter 2 presents
the scenario where the measurements are carried out while in Chapter 3 we present how is our
generated signal and how we have modelled it in order to simulate a microwave oven signal. After
that, in Chapter 4 we will present some measurements carried in the anechoic chamber.
We could say that the project has two different parts where on the first part we give an overview of
Wi-Fi networks, microwaves signals and how we should simulate them analytically and also on
the real life using a signal generator. On the other part we are going to focus on the practical part
where we are going to test in the antenna room the microwave signal that we have generated and
also try to relate the data-rate that we obtain on the uplink and downlink transmission with the
interferences that we have created.

Enric Serra Perramon Page 15 of 39 Student ID: 46363947H Interference Impact in WLAN Performance Evaluation
2. Setup-Antenna room
All experiments carried out in this project were developed inside an antenna room or anechoic
chamber. The antenna room used in this project is located in the A1 Telekom Austria company's
headquarters in Vienna city, Austria. A1 Telekom Austria company is a telecommunications
services provider leading in Central and Eastern Europe with more than 24 million users. It is one
of the industrial partners of the Vienna University of Technology, and thanks to that this project
could be carried out in the facilities of the company.
The reason why we use an antenna room, also named anechoic chamber, is because we need some
way to mitigate or to reduce all possible reflexion of the signal with any object, like a wall. So
according to the main structure of an anechoic chamber, the signal is absorbed by the walls that
have got a sharp form so the wave is not reflected, it doesn't propagates another wave coming back
to the source. The room is used to absorb all the reflections of sound or electromagnetic waves.
Antenna rooms are also named free-field conditions rooms. Free field because the conditions are
supposed to be the natural ones, without any possible extern object interfering in any situation.
A wall in a anechoic chamber needs to be different to reduce the mitigation of the wave's reflexion.
So, we usually find walls consisting in wedges ending with a sharp form. After the impact of the
wave into the wall, this wave will reflect in the same opposite direction but bouncing up and down
in the gap of air between wedges. This bouncing between each wedge is the key of antenna rooms,
and that is why they are very useful and powerful in areas such as acoustics or antenna
configuration. The bounce of this process may produce an standing wave, so the acoustic energy
gets easily dissipated. So, at the end, there is no bounce of the original wave, the rebound is
practically gone. Also, the material which wedges are normally constructed may help in this
process. They are usually done by foam, this material helps in the dissipation during the wave and
wall interaction.
It is also really important that an antenna room should dissipate or at least mitigate energy in all
possible directions, not only on one particular direction. But sometimes, it could be possible that
we find an anechoic chamber with a solid floor surface, which means that we are inside a semi-
anechoic chamber. Most of them have this name because, most of the antennas we would
experiment with, are supported by a solid structure like a car, a plane or an industrial machine. But
they need buffers or shock absorbers to mitigate external possible vibrations on the floor.
Our experiments will be conducted in a semi-anechoic chamber and we are going to use three
antennas that will be connected all the time to our main computer which is going to monitor all the

Enric Serra Perramon Page 16 of 39 Student ID: 46363947H Interference Impact in WLAN Performance Evaluation
processes that are happening. We are going to propose a KPI-based performance assessment which
is going to interact with a signal coming from a microwave and the interaction with the waves
provided by the antennas and the waved from a Wi-Fi device.
So the main idea is to see how the data-rate from the Wi-Fi device gets degraded because of the
existence of a microwave signal in the proximity. The antennas are used to get this interaction
between both signals. As using a microwave all the time is not feasible neither repeatable for
scientific purposes, one of our goals is also to provide a possible external signal trying to simulate
a microwave signal. So we have both goals in here. First of all, we need to generate a signal
similar to a microwave, and after that we are going to see the impact and how the data rate is
affected by the interaction between a microwave (real one or simulated one) and a Wi-Fi device.
Also we will have different access points (APs) to see the main differences between them, since
each of them will have a different antenna configuration [2].
As we can see in Figure 5 there are three antennas pointing directly to the DUT (Device Under
Test). In our case we have two different devices that we want to experiment with. First of all, we
have a commercial microwave that everybody could have in their kitchen or in their office. This
microwave is filled in with a container with some water inside in order to avoid the microwave
oven operation without anything inside. It will be more easy and suitable for our experiments. The
antennas pointing directly to the microwave are located approximately 2 metres away from it.
There is one table in the middle where we are going to place our Wi-Fi device. Also in another
table in front of the router, we are going to place our microwave. In Figure 7 we can see the main
distribution of our setup antenna room.
Figure 5: Distribution of the experimenting

Enric Serra Perramon Page 17 of 39 Student ID: 46363947H Interference Impact in WLAN Performance Evaluation
2.1. Wavemoon tool
Once we have setup the experiment in the antenna room, with the generated signal or with the
microwave oven signal, it's time to fully monitor our Wi-Fi network using an application very
useful in the field, whose name is Wavemon. It is developed only for Linux operating systems. It
is very useful and easy to use and it shows lot of information related to our Wi-Fi network. As we
have to deal with active measurements it is a suitable tool to be used.
Figure 7: Antenna setup
Figure 6: Distance between router and antenna
2 m
Enric Serra Perramon Page 18 of 39 Student ID: 46363947H Interference Impact in WLAN Performance Evaluation
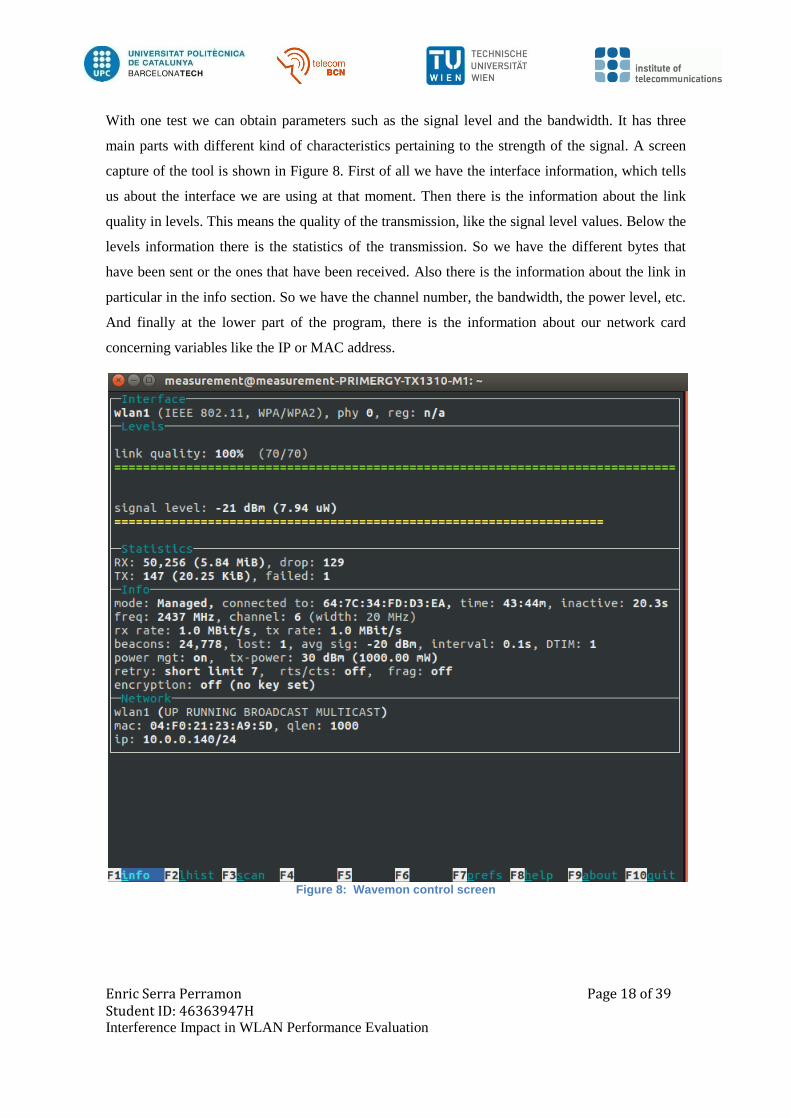
With one test we can obtain parameters such as the signal level and the bandwidth. It has three
main parts with different kind of characteristics pertaining to the strength of the signal. A screen
capture of the tool is shown in Figure 8. First of all we have the interface information, which tells
us about the interface we are using at that moment. Then there is the information about the link
quality in levels. This means the quality of the transmission, like the signal level values. Below the
levels information there is the statistics of the transmission. So we have the different bytes that
have been sent or the ones that have been received. Also there is the information about the link in
particular in the info section. So we have the channel number, the bandwidth, the power level, etc.
And finally at the lower part of the program, there is the information about our network card
concerning variables like the IP or MAC address.
Figure 8: Wavemon control screen

Enric Serra Perramon Page 19 of 39 Student ID: 46363947H Interference Impact in WLAN Performance Evaluation
2.2. Attenuator
We are going to simulate also that we are transmitting as we would be in a real situation, so it
would be appropriate to have some attenuation between the power of the microwave towards the
router. To properly test our experiments in a very real environment we will simulate a wall that
would eventually have a common place where a wireless device would be found. So, in this case
an attenuator will be used to perform as a wall. The attenuator used is the model Aeroflex
Weinschel 10114-6 DC-6GHz Programmable Attenuator 6 Channel 103dB SN398.
Figure 9: Model of the attenuator
2.3. SMU
In order to create a signal simulating a microwave wave we are going to use a SMU, which is a
vector signal generator very useful in this project. The idea is to generate a signal and to store it in
the memory of the vector signal generator and afterwards to convey this signal in the antenna room
to make it interfere with the Wi-Fi device.
The SMU used is called R&S ® SMU 200A Vector Signal Generator. Between its main
characteristics we can find the following ones:
Frequency
Frequency range RF path A
100 kHz to 2.2/3/4/6 GHz

Enric Serra Perramon Page 20 of 39 Student ID: 46363947H Interference Impact in WLAN Performance Evaluation
Frequency
Frequency range RF path B
100 kHz to 2.2/3 GHz
Setting time SCPI mode
List mode
<2 ms, typ. 1.5 ms
<450 µs, typ. 300 µs
Level
Maximum level (standard) f≤3 GHz
f>3 GHz
+13 dBm (PEP)
+11 dBm (PEP)
Maximum level (with high-
power option)
f≤3 GHz
f>3 GHz
+19 dBm (PEP)
+17 dBm (PEP)
Setting time SCPI mode
List mode
<2 ms, typ. 1.5 ms
<450 µs, typ. 300 µs
Spectral purity
SSB phase noise (with
option)
f = 1 GHz, carrier offset = 20
kHz,
1 Hz measurement bandwidth
<-135 dBc (typ. -139 dBc)
Wideband noise
200 MHz ≤ f ≤ 1500 MHz, CW
carrier offset > 10 MHz,
1 Hz meas. bandwidth
<-150 dBc (typ. -153 dBc)
ACLR 3GPP test model 1, 64 DPCH, 5
MHz offset typ. 70 dB
I/Q modulation
I/Q modulation bandwidth (in
RF)
external wideband mode
internal baseband mode
200 MHz
80 MHz
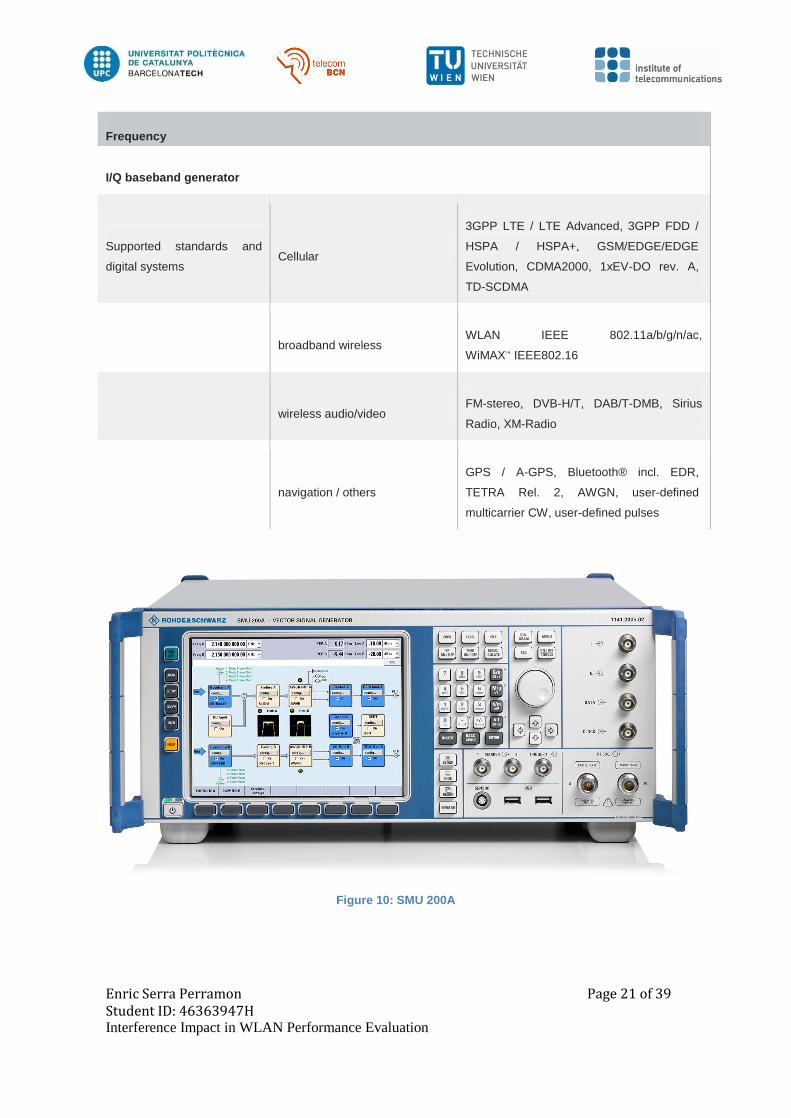
Enric Serra Perramon Page 21 of 39 Student ID: 46363947H Interference Impact in WLAN Performance Evaluation
Frequency
I/Q baseband generator
Supported standards and
digital systems Cellular
3GPP LTE / LTE Advanced, 3GPP FDD /
HSPA / HSPA+, GSM/EDGE/EDGE
Evolution, CDMA2000, 1xEV-DO rev. A,
TD-SCDMA
broadband wireless WLAN IEEE 802.11a/b/g/n/ac,
WiMAX™ IEEE802.16
wireless audio/video FM-stereo, DVB-H/T, DAB/T-DMB, Sirius
Radio, XM-Radio
navigation / others
GPS / A-GPS, Bluetooth® incl. EDR,
TETRA Rel. 2, AWGN, user-defined
multicarrier CW, user-defined pulses
Figure 10: SMU 200A

Enric Serra Perramon Page 22 of 39 Student ID: 46363947H Interference Impact in WLAN Performance Evaluation
3. Signal generation
In order to simulate the MWO signal, the signal generator presented in the previous section will be
used, so it will be one of the main parts of this project. The idea is to create a signal that has
similar characteristics as the one that is radiated from a real microwave, a commercial one. A
microwave signal has two main cycles, one where it is OFF and another one where is ON. So we
have to create a signal with a power peak in 2.45 GHz and then make repetitions of it in time
duration.
3.1. MWO signal description
In this section we are going to provide an overview of MWO operation. A residential microwave
acts as a two mode operational transmitters. One is a ON cycle and the other one is an OFF cycle.
The ON cycle is very similar to a frequency modulated signal, or more accurately, it approaches
the same form as a frequency modulated signal (FM). A MWO varies its carrier frequency in time.
So in our case we can say that the centre frequency lays between the range 2.45GHz and 2.46 GHz.
There are different microwaves oven that we can find, so it is interesting to discern between both
of them. The main difference between them is how they use the power in their entrance, if they use
directly the voltage from the external source or if there is a conversion of the power transfer from
the AC source. There is the one that we could find in almost all households and offices, which is
worldwide used and then we have the one which is named inverted microwave which is more used
in commercial purposes not for having it at home. Furthermore it is usually more expensive.
The first one, the transformer microwave, is the one that increases or decrease AC electricity from
one voltage level to another, as a transformer. So we are going to focus in the one that is more
used and that we could more easily find in a environment of a Wi-Fi network plus a microwave
oven in its close proximity: the transformer microwave. A microwave signal has its main peak
level approximately at 2.4 GHz as we were expecting because it works at same ranges as Wi-Fi
networks.
A normal microwave oven has two main parts, the heating cavity where the food or the element
we want to heat is located and then the control part, where the user selects the power and also the
time we want to heat that element. There are different studies carried out which clearly verify that
the main radiation that we obtain in a microwave oven is located in the front part of it. One very
logical answer to this fact is because the sealing door is located at such place. In the other hand,

Enric Serra Perramon Page 23 of 39 Student ID: 46363947H Interference Impact in WLAN Performance Evaluation
the back part of the microwave is the part of the microwave which radiates at its minimum. In our
experiments we are going to heat all the time the same amount of water [3].
It is beyond our reach to do experiments heating some other elements rather than water. It is
possible that our configuration or our experiments would be different depending on the quantity of
food or water we place inside the microwave. In our case we are always going to heat water from a
0.5L recipient.
Now we are going to explain a little bit more accurately the structure and the main characteristics
of a MWO. We will talk about frequency-sweeping phenomena and also about the transient
signals that exist, despite the fact that are often overlooked and not always taken into account. A
microwave contains a single magnetron that periodically gets from ON mode to OFF mode. A
magnetron is an element that has the main function to transform electrical energy into
electromagnetic energy in microwave form. This is achieved by the interaction of a stream of
electrons with a magnetic field. A residential microwave oven, in its ON mode, it is really similar
or could be modelled as a frequency modulated signal (FM). Then we have a fixed carrier
frequency while the instantaneous frequency changes with time. The centre frequency can be
different between different models of microwave but it is usually close to the range of 2.45 GHz.
Also we have seen that a MWO signal gets repetitive in natural conditions with a single period of
16.66 ms. This period comes from the frequency's inverse of the AC supply line that is powering
the MWO, which is 60 Hz [4]. A combined FM-AM waveform will serve as a basis for the
frequency sweeping part of the signal. During the ON cycle, the envelope of the signal also
changes considerably and the amplitude of the MWO signal can be modelled as a sinusoidal
waveform when we are in an ON cycle. Remember that an envelope of a signal is referred to the
smooth curve outlining its extremes. The MWO is ON only half of the 60 Hz cycle. And there are
some transient signals in the beginning and end of each ON cycle. Thus, to sum up, we finally
would obtain a MWO radiated signal by mixing these transients with also the frequency sweeping
signal.
Let's see how we would perform it analytically in order to compute this signal by using Matlab
tool. An analytical model can be modelled, taking into account all the concerns discussed before.
As we said, we should model two different parts.
The first one is the frequency-swept signal which we will model it as an AM-FM signal and then
the transient signals which will be modelled as the sum of two different sinc waveforms modulated

Enric Serra Perramon Page 24 of 39 Student ID: 46363947H Interference Impact in WLAN Performance Evaluation
at different carrier frequencies. The AM-FM signal, with sinusoidal modulation, can be expressed
as the following [4]:
where
In this case, fc refers to the centre frequency of the magnetron, while fac=60 Hz, it means the
inverse of the period T=1/fac=16.66 ms. And is the modulation index.
In the other hand, the ON cycle wave-shape could be written as:
where A1 and A2 are the amplitudes of the power of the transients; ta is the time location of the
transient. Also f1 and f2 are the carrier frequencies and b1 and b2 are referred to the bandwidths of
the transients.
We define p(t;b)=sinc(bt) where |t|<0.5 Tp, where Tp is the duration of the transient pulse [6].
Figure 11: Signal model
Enric Serra Perramon Page 25 of 39 Student ID: 46363947H Interference Impact in WLAN Performance Evaluation
3.2. MWO signal generated
Now that we have studied a MWO signal and that we can clearly differentiate its intrinsic parts,
we are going to try to develop an analytical part, so the idea is to develop our own MWO signal in
order to simulate it. We will use Matlab as the main tool to develop it, as it has most of the
mathematical operators and functions that will properly simulate our signal. Using Matlab tool, we
have managed to model this signal, as a function of many variables. One of the most importat part
to take into account is the fact that we need to generate a signal and repeat it in time, but our signal
generator will assume this role to repeat it. So we just need to make the signal and only do it by
one cycle. So by using Matlab we also need to use the mathematical tools like the sinc function or
the cosines function in order to simulate the equation before explained in the previous chapter.
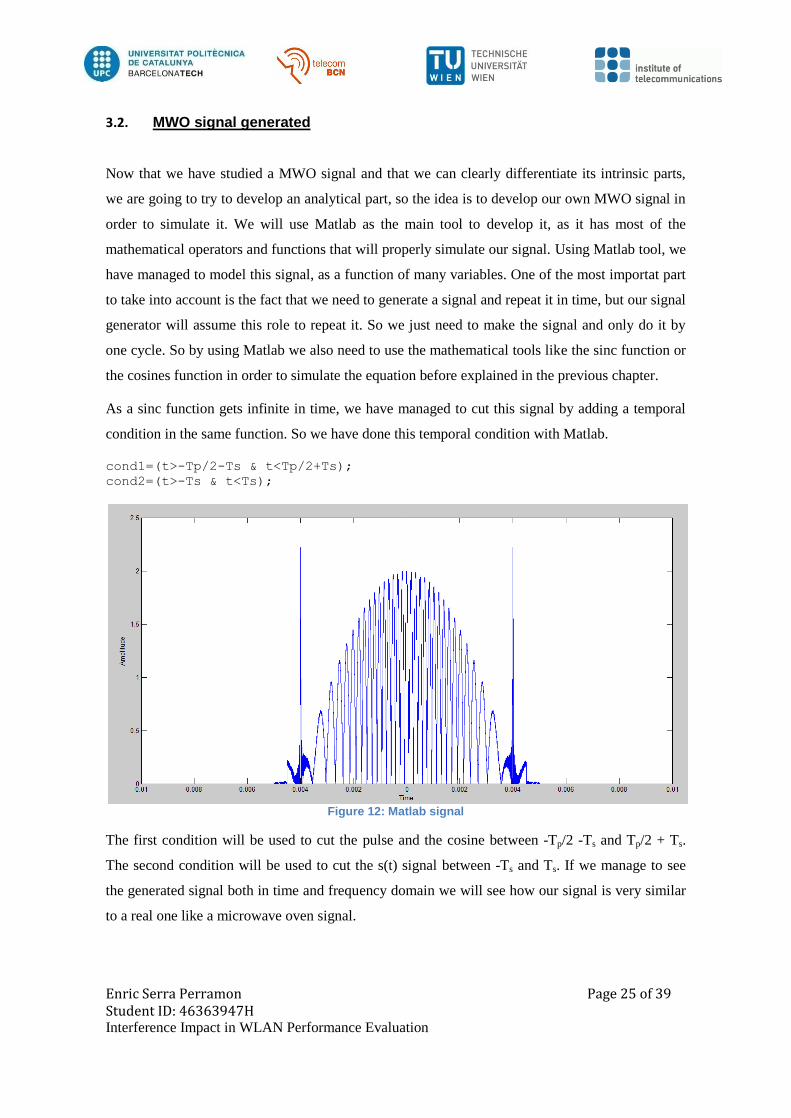
As a sinc function gets infinite in time, we have managed to cut this signal by adding a temporal
condition in the same function. So we have done this temporal condition with Matlab.
cond1=(t>-Tp/2-Ts & t<Tp/2+Ts); cond2=(t>-Ts & t<Ts);
Figure 12: Matlab signal
The first condition will be used to cut the pulse and the cosine between -Tp/2 -Ts and Tp/2 + Ts.
The second condition will be used to cut the s(t) signal between -Ts and Ts. If we manage to see
the generated signal both in time and frequency domain we will see how our signal is very similar
to a real one like a microwave oven signal.

Enric Serra Perramon Page 26 of 39 Student ID: 46363947H Interference Impact in WLAN Performance Evaluation
In the following image we can see the signal we obtain:
Figure 13: Generated signal in frequency domain
Figure 14: Original microwave signal

Enric Serra Perramon Page 27 of 39 Student ID: 46363947H Interference Impact in WLAN Performance Evaluation
In Figure 13 we can see the shape of the signal consisting in the microwave oven. We can see that
this signal is centred in 2.45 GHz.
In Figure 15 we can see the same wave of the microwave oven in time. We can see approximately
the same signal we have described in Chapter 4. We can see the frequency-swept signal and also
the transient signals at the beginning and end of the cycle. We can also see perfectly the cycles
where the microwave is ON and the cycles where it is OFF.
4. Measurements
The measurements performed have been taken place in the laboratory from A1 Telekom Austria
Technologiezentrum Arsenal. This company, as we have already said in this document, is one of
the industrial partners of the Vienna University of Technology, therefore both students and
academic staff can use it.
The measurements take place in the antenna room of this company. The anechoic chamber is a
room where 3 antennas are located pointing at the access point (AP) that we want to test, all
Figure 15: Generated signal in time domain

Enric Serra Perramon Page 28 of 39 Student ID: 46363947H Interference Impact in WLAN Performance Evaluation
antennas the same distance far from the router. We have the microwave inside the antenna room
and also our signal generator, which is remotely controlled by the PC outside the antenna room.
As one of the goals of this project is to emulate a signal as close as a real microwave oven signal,
once we calibrate our generated signal, we will use the generated signal in all experiments so we
don't need to use a real microwave, which is much more practical since the microwave oven has a
limited working time, and we would have to turn it on periodically.
It would be ideal to explain some features about the link quality and how we can test the good
quality of a wireless network while using the iperf3 tool. The link quality can be tested analyzing
link parameters such as latency, jitter and datagram loss.
The latency or response time9 is the time it takes for the signal to be sent and the time it takes for
the receiver to receive such signal. When we talk about the jitter, we refer to the noise that impacts
on the digital signal and deteriorates it. It is defined as a deviation from true periodicity of a
periodic signal. Finally, the datagram loss is referred to the amount of data that is lost in a
transmission between two ends.
In the graphics that we are going to obtain, we consider the RSSI10
value measured in dBm and
also the data-rate measured in Mbit/s. The RSSI is defined as the measurement of the power of the
signal in terms of dBm. It is not related with the quality of the signal but the strength of the signal.
In a good range that we would accept the signal we could establish a minimum value to consider
there is a signal available to be recognised and received. This minimum could be a value of -80
dBm. Above this value, that means values of -70, -60, -50 dBm, we could say that the signal is
getting better and better, until having a RSSI of 0 dBm which is actually an ideal result, very
difficult to obtain in real life experiment.
4.1. Measurements with the microwave oven signal
First we have placed a microwave in a table behind the Wi-Fi device, as shown in Figure 6. With
the iPerf3 tool running on the PC inside the antenna room, we generate traffic test in both uplink
and downlink. The AP will send out such data, that will be captured by the antennas which are
surrounding the AP. The antennas are connected to the network card of the computer outside the
antenna room through the attenuator. For the measurements shown in this section, no attenuation is
set.
9 Also receives the name as RTT (Round Trip Time)
10 Received Signal Strenght Indicator

Enric Serra Perramon Page 29 of 39 Student ID: 46363947H Interference Impact in WLAN Performance Evaluation
On the PC side, we use the ifstat (Report InterFace STATistics) to monitor the link. In order to
make all the experiments, we connect our PC to the network created by the AP, and we set a
bandwidth of 20 MHz and the channel 9, since it is the one more close to 2.45 GHz, so the one is
closer to the maximum peak of the microwave oven.
Once we have the setup described above and we carry out the measurements, theoretically, we
would expect to obtain a higher transmission data rate in one link than the other one, i.e., we
should have a higher data rate transmission in the downlink rather than the uplink.
In the following figure we can see in time domain how the data rate is evolving during the
operability of the microwave while the Wi-Fi device is also working. With the tool iperf3 we
measure the transmission rate and how gets affected. In this case, we can see the devices used are
DV2220, FB7390 and DV2210.
Figure 16: DV2220 device results with MWO at 700 W

Enric Serra Perramon Page 30 of 39 Student ID: 46363947H Interference Impact in WLAN Performance Evaluation
Figure 17: DV2220 device results with MWO at 250 W
Figure 18: FB7390 device results with MWO at 700 W

Enric Serra Perramon Page 31 of 39 Student ID: 46363947H Interference Impact in WLAN Performance Evaluation
Figure 19: FB7390 device results with MWO at 250 W
Figure 20: DV2210 device results with MWO at 700 W

Enric Serra Perramon Page 32 of 39 Student ID: 46363947H Interference Impact in WLAN Performance Evaluation
Figure 21: DV2210 device results with MWO at 250 W

Enric Serra Perramon Page 33 of 39 Student ID: 46363947H Interference Impact in WLAN Performance Evaluation
4.2. Measurements with the Matlab generated signal
Figure 22: DV2220 device results with generated signal at 700 W
Figure 23: DV2220 device results with generated signal at 250 W

Enric Serra Perramon Page 34 of 39 Student ID: 46363947H Interference Impact in WLAN Performance Evaluation
Figure 24: FB7390 device results with generated signal at 700 W
Figure 25: FB7390 device results with generated signal at 250 W

Enric Serra Perramon Page 35 of 39 Student ID: 46363947H Interference Impact in WLAN Performance Evaluation
Figure 26: DV2210 device results with generated signal at 700 W
Figure 27: DV2210 device results with generated signal at 250 W

Enric Serra Perramon Page 36 of 39 Student ID: 46363947H Interference Impact in WLAN Performance Evaluation
4.3. Comments
The data rate is the relation between the bits we are transmitting and the time it takes to properly
achieve its destination, so we can say that the data rate defines perfectly our transmission and the
way we can analyze its quality. It is also named as bit rate, so it is defined as the number of bits
that are transmitted or processed per unit of time. We have two different types of transmission, the
ones that goes from the router to the antenna and the opposite one, that goes from the antenna to
the router. So we define these two types of transmission as downlink and uplink transmission.
Usually there is one (the downlink) which has higher data rate characteristics.
Once presented the results obtained, for example, a comparison between Figure 17 and Figure 23
can be made. It is very clear how the cycles of the microwave oven are present and how both
signals are very similar. Both signals are referred to a microwave oven, Figure 17 with an original
one and Figure 23 with a simulated Matlab signal.
Also a comparison can be made between original signal in Figure 18 and Figure 24. They are also
similar, at power 700 W. In Figure 18, where the simulation is performed with an original
microwave oven, we can see how at the beginning there is a little deviation of the data rate. This
can be due to the microwave oven that when starts working has a little delay in its performance.
In general, we can see how both signals are pretty similar either with the original microwave oven
or the generated signal.
5. Budget
This project deals with wireless communications and needs equipment really high qualified to do
some measurements. That is why this project wouldn't be possible without the collaboration not
only of the TU Wien but also the collaboration of A1 telekom. The equipment required as well as
the antenna room is very expensive. To build an antenna room is not cheap, therefore most
universities all around the world only have one antenna room and not even one, since the costs of
maintenance are not affordable for every university.
The number of hours worked by the student who has done this project extend up to five hours a
day during five months, from March until July 2017, so this takes into account almost 500 hours of
work. If one hour of work is paid as the minimum required for the UPC (Universitat Politècnica de
Catalunya), that is 8€ per hour, this would require a total amount of money of 4000€.
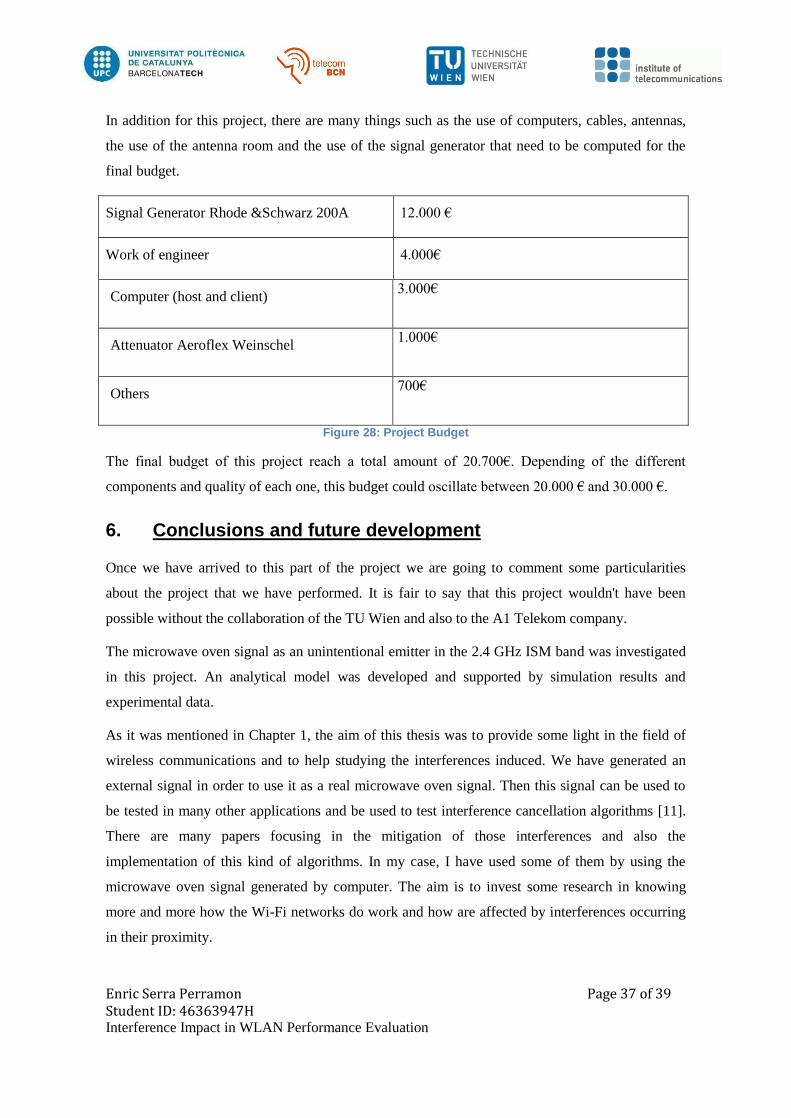
Enric Serra Perramon Page 37 of 39 Student ID: 46363947H Interference Impact in WLAN Performance Evaluation
In addition for this project, there are many things such as the use of computers, cables, antennas,
the use of the antenna room and the use of the signal generator that need to be computed for the
final budget.
Signal Generator Rhode &Schwarz 200A 12.000 €
Work of engineer 4.000€
Computer (host and client) 3.000€
Attenuator Aeroflex Weinschel 1.000€
Others 700€
Figure 28: Project Budget
The final budget of this project reach a total amount of 20.700€. Depending of the different
components and quality of each one, this budget could oscillate between 20.000 € and 30.000 €.
6. Conclusions and future development
Once we have arrived to this part of the project we are going to comment some particularities
about the project that we have performed. It is fair to say that this project wouldn't have been
possible without the collaboration of the TU Wien and also to the A1 Telekom company.
The microwave oven signal as an unintentional emitter in the 2.4 GHz ISM band was investigated
in this project. An analytical model was developed and supported by simulation results and
experimental data.
As it was mentioned in Chapter 1, the aim of this thesis was to provide some light in the field of
wireless communications and to help studying the interferences induced. We have generated an
external signal in order to use it as a real microwave oven signal. Then this signal can be used to
be tested in many other applications and be used to test interference cancellation algorithms [11].
There are many papers focusing in the mitigation of those interferences and also the
implementation of this kind of algorithms. In my case, I have used some of them by using the
microwave oven signal generated by computer. The aim is to invest some research in knowing
more and more how the Wi-Fi networks do work and how are affected by interferences occurring
in their proximity.

Enric Serra Perramon Page 38 of 39 Student ID: 46363947H Interference Impact in WLAN Performance Evaluation
The idea is to make it more efficient or more easy for next wireless generations to coexist with all
this devices that, for sure, are going to bounce into the field that we are dealing with.
One of the solutions [6] to mitigate interferences can be developed using spectrum sensing, which
consist in detecting the characteristics of the MAC and PHY signal so we can select different
transmission parameters that would use the most suitable channel. The results of this study are
applicable to wireless network simulation studies and in cognitive radio devices for interference
mitigation.
7. Bibliography
[1] 2. W. P. Cisco Visual Networking Index: Global Mobile Data Traffic Forecast Update,
"Cisco," 28 03 2017. [Online]. Available:
https://www.cisco.com/c/en/us/solutions/collateral/service-provider/visual-networking-
index-vni/mobile-white-paper-c11-520862.html.
[2] N. Golmie i F. Mouveaux, «Interference in the 2.4 GHz ISM band: Impact in the
Bluetooth Access Control Performance,» 2001.
[3] J. Li, Z. Zhou, C. Zhang, L. Yin i L. M.Ni, «BEP: Bit Error Pattern Measurement and
Analysis in IEEE 802.22,» 2015.
[4] C. F. Chiasserini i R. R.Rao, «Coexistance Mechanisms for Interference Mitigation
between 802.11 WLANs and Bluetooth,» 2002.
[5] Y. Zhao, B. G.Agee i J. H.Reed, «Simulation and Measurement of Microwave Oven
Leakage for 802.11 WLAN Interference Management,» 2005.
[6] A. Kemermam i N. Erkoçevic, «Microwave Oven Interference in Wireless LANs
operating in the 2.45 GHz ISM band,» Netherlands.
[7] D. K. Sung, S. M. Kim i M. J. Kim, «Experiments in interferences and coexistance
between Zigbee and Wlan devices operating in the 2.45 Ghz ISM band,» November
2005.
[8] S. Homayouni, C. Midoglu i P. Svoboda, «Empirical KPIs for Interfered WLAN».
[9] W. Yinghong, Z. Linchang, L. Chen i Z. Xiaodong, «Measurement and Calculation of
the Radiation Characteristics».

Enric Serra Perramon Page 39 of 39 Student ID: 46363947H Interference Impact in WLAN Performance Evaluation
[10] T. M. Taher, A. Z. Al-Banna, D. R. Ucci i J. L. LoCicero, «Characterization of an
Unintentional Wi-Fi Interference Device-The Residential Microwave Oven».
[11] T. M. Taher, M. J. Misurac, J. L. LoCicero i D. R. Ucci, «Microwave oven signal
modelling,» 2008.
[12] R. Musaloiu-E i A. Terzis, «Minimising the effect of WiFi interference in 802.15.4».
[13] S. Srikanteswara i C. Maciocco, «Interference Mitigation Using Spectrum Sensing,»
2007.
[14] W. Guo, W. M.Hely i M. Zhou, «Performance measurement and analysis of low data
rate wireless communications under interference sources in buildings,» 2010.
[15] B. Bellalta, «Throughput Analysis in High Density WLANs,» 2016.