experimental test site for small wind turbines of...
TRANSCRIPT

Experimental Test Site for Small Wind Turbines of Narbonne Test report n° 18.5 april, 28 2010
AirDolphin Z-1000-250 Grid connected page 1 / 54
Experimental Test Site for Small Wind Turbines of Narbonne
Test report n° 18 version 5 of April, 28 2010
AirDolphin Z-1000-250 Grid Connected
Manufacturer Zephyr Corporation
Reference AirDolphin Z-1000-250
Rotor shaft axe horizontal
Number of blades 3
Rotor diameter 1.80 m
Regulation type Electronic rotational speed control
+ aerodynamic stall
Nominal output 1100W at 12.5m/s
Grid connection SMA inverter : SunnyBoy 3800
Tower type guyed tubular
Importer Eden Importateur Zephyr Montpellier
Test period November 2008 – February , 8r 2010
Test duration November, 29 2009 - February, 8 2010

Experimental Test Site for Small Wind Turbines of Narbonne Test report n° 18.5 april, 28 2010
AirDolphin Z-1000-250 Grid connected page 2 / 54
Summary
1 Manufacturer Data ................................................................ 4
2 Objectives ............................................................................. 6
3 Installations .......................................................................... 7
4 Test site environmental data ............................................... 11
5 Operation and safety test .................................................... 15
5.1 Test objectives ............................................................................. 15
5.2 Operation and safety tests ............................................................. 15
5.2.1 observation of yawing at various wind speeds ............................... 15
5.2.2 Start-up and stop test sequences following the protocols
recommended by the manufacturer ............................................. 15
5.2.3 Emergency stop by action on the main circuit breaker. .................. 15
5.2.4 Checking of the generated power compared to the manufacturer data15
5.2.5 Checking of the rotational speed limitation system ........................ 15
5.2.6 Simulations of grid loss network (micro cut and normal cut) ........... 16
5.2.7 Test of preventions against not authorized parameters system changes ................................................................................... 16
5.2.8 checks of equipment and safety procedures (mechanical, electrical) for installation and maintenance ................................................. 16
5.2.9 Checking of the grounding system and lightning protection. ........... 16
6 Reliability tests ................................................................... 17
6.1 Test objectives ............................................................................. 17
6.2 Reliability test .............................................................................. 17
6.2.1 Production for at least 1500 hours at unspecified wind speed ......... 17
6.2.2 Production lasting at least 250 hours at higher or equal wind speed of 1.2 times the wind speed corresponding to the nominal power output
(data manufacturer data) ........................................................... 17
6.2.3 Production lasting at least 25 hours at higher or equal wind speed of 1.8 times the wind speed corresponding to the nominal power output
(data manufacturer data) ........................................................... 17
6.2.4 Measured energy higher than 80% of expected energy (according to
data manufacturer) ................................................................... 17
6.2.5 Structural damage .................................................................... 20
7 Power curve measurement .................................................. 21
7.1 Measured power curve .................................................................. 23
7.2 Manufacturer power curve ............................................................. 26
7.3 Power coefficient .......................................................................... 27
8 Acoustic noise measurments ............................................... 28

Experimental Test Site for Small Wind Turbines of Narbonne Test report n° 18.5 april, 28 2010
AirDolphin Z-1000-250 Grid connected page 3 / 54
8.1 Objectives ................................................................................... 29
8.2 Principle ...................................................................................... 29
8.3 Measurements ............................................................................. 30
8.4 Analysis ...................................................................................... 31
8.5 Point 1 (page 39) ......................................................................... 32
8.6 Point 3 (page 43). ........................................................................ 33
8.7 Point 5 (page 47). ........................................................................ 34
8.8 Point 7 (page 51). ........................................................................ 35
8.9 Conclusion. .................................................................................. 36
8.10 Measurement point implementation ................................................ 37
9 Annexe ................................................................................ 38
9.1 Point N°1 ..................................................................................... 39
9.2 Point N°3 ..................................................................................... 43
9.3 Point N°5 ..................................................................................... 47
9.4 Point N°7 ..................................................................................... 51

Experimental Test Site for Small Wind Turbines of Narbonne Test report n° 18.5 april, 28 2010
AirDolphin Z-1000-250 Grid connected page 4 / 54
1 Manufacturer Data
SPECIFICATIONS Zephyr AirDolphin Z-1000-250
Model Number
Wind Turbine Type
Rotor Diameter
Mass
Tower Diameter
Number of Blades
Blade ConstructionBlade Mass (per
piece)
Blade Method
Body Material
Product Finish
Power Generator
Control System
(Built-in original
Intelligent Power
Management)
5. Data Communication
Synchronous-type, three-phase power generator with
permanent neodymium iron boron magnet
1. Power-Assist Function
2. Inverter Stand-by Function
3. Safety Control
4. Peak Power Management
Aluminum diecast
Body Construction
Bolt-less joints
(based on traditional Japanese craftmanship)
Powder coat finish
48.6mm (1-15/16")
3
Carbon fiber laminate over solid foam core
380g (13 oz)
Interlock hub mounting
Airdolphin GTO
Z-1000-250
Horizontal axis, up-wind
1,800mm (5'10-7/8")
19.5kg (38.5 lbs)

Experimental Test Site for Small Wind Turbines of Narbonne Test report n° 18.5 april, 28 2010
AirDolphin Z-1000-250 Grid connected page 5 / 54
Protection Circuit
Data Logger
Yaw Control
Direction Control
Start-up Wind Speed
Cut-in Wind Speed
Peak PowerMaximum Rotor
Speed
Output Voltage
Braking SystemCommunication
System
(Signal Output)
Inverter type
Warranty
250VDC
Regenerative electromagnetic braking system
RS-485
PV Inverter (CV mode; Constant Voltage mode)
Five years
Original Swing-Rudder System
0m/s (Power-Assist Function)
2.5m/s, 5.6mph
4.0kW (20m/s, 44.7 mph)
1,280rpm (20m/s, 44.7 mph)
Built-in
Built-in (Total energy production)
Free yaw (360 degrees)
Source :
http://www.zephyreco.co.jp/en/products/product/air-dolphin_gto/index.html

Experimental Test Site for Small Wind Turbines of Narbonne Test report n° 18.5 april, 28 2010
AirDolphin Z-1000-250 Grid connected page 6 / 54
2 Objectives
The Experimental Test Site for Small Wind Turbines of Narbonne is intended
to observe the behaviour and the performances of small wind turbines with a rotor diameter smaller or equal to 7 meters (or generated power smaller than
approximately 10kVA) proposed to the test within the framework of a voluntary program by a manufacturer or an official distributor.
The following points are studied:
o evaluation of operation, safety, quality, reliability and integrity of the wind turbine and associated systems, according to the protocol of
measurements defined in this document and approaching as far as possible to the rules and procedures of the IEC WT01 and IEC61400-2 standards
o measurements of the power curve and production of electrical energy of the machine according to the wind resource, and according to the
protocol of measurements defined in this document and approaching as far as possible to the IEC61400-12 standard
o measurements of noise levels at audio frequencies (acoustic noise) near
the wind turbines
o evaluation of the quality of the electrical current produced, according to
a protocol of measurements of grid disturbances defined by EDF R&D Department
o measurements of environmental conditions at the test site (speed,
direction and turbulence of the wind, temperature, pressure and relative humidity)
o appreciation of the visual impact (investigation carried out with visitors of the experimental test site)
The recording and the process of the measurements were carried out on the
test site during the period of operation of the equipment installed.

Experimental Test Site for Small Wind Turbines of Narbonne Test report n° 18.5 april, 28 2010
AirDolphin Z-1000-250 Grid connected page 7 / 54
3 Installations
The test site is equipped:
with a technical building where are gathered:
o equipment to accesses the grid for each wind turbine, with room
reserved for the installation of the manufacturer grid connection equipment for each machine
o safety equipments and energy meters:
safety equipment to disconnect the sources of energy in the event of disturbance on the grid
meters for generated and consumed energy measurement of the grid disturbances (LEM QWave
parameterized according to NF-EN-50160 standard)
o equipments for power measurement in grid connection systems:
power measurement transducers (single-phase or three-phase current balanced or not, Lumel N10A)
acquisition of current information by current transformers
output of power information by analog signal 4-20mA visualization of the grid parameters (tension, current, frequency,
active and reactive power …)
o equipment for power measurement of battery charging systems:
3 phase active power transducer (Load Controls Inc. UPC) variable voltage and variable frequency
frequency transducer (Lumel P12O) DC voltage transducer (Lumel P12U) Hall effect DC current transducer (NKT DT)
o equipments for measurement of environmental parameters:
ambient temperature transducer (Prosensor 700PT100) atmospheric pressure transducer (NRG BP20) relative humidity transducer (NRG RH5)
insulating transducers (Phoenix Contact MCR-C-UI-UI-DCI)
o equipments for data recording
dedicated desktop PC computer
USB data logger (IOTech Personal DAQ/56 and PDQ2 extension) remote access by ADSL modem on telephone line

Experimental Test Site for Small Wind Turbines of Narbonne Test report n° 18.5 april, 28 2010
AirDolphin Z-1000-250 Grid connected page 8 / 54
with 4 positions for installations for the wind turbines:
o 1 concrete base which can accept a wind turbine with a 7m rotor
diameter maximum (approximately 10kVA), the wind turbine can be installed on guyed or free standing tower with a maximum
height of 18m
o 1 concrete base which can accept a wind turbine with a 5m rotor diameter maximum (approximately 5kVA), the wind turbine can be
installed on guyed or free standing tower with a maximum height of 18m
o 2 concrete bases which can accept a wind turbine with a 5m rotor diameter maximum (approximately 5kVA), the wind turbine can be installed on guyed tower only with a maximum height of 18m
o each concrete base is intended to receive a mechanical adaptation plate for each tower from each manufacturer
of a 20m guyed measurement tower, equipped with:
o 3 anemometers placed at 16, 18 and 20m (NRG # 40H including 1 calibrated)
o wind vanes placed at 16 and 20m (NRG # 200P)
o 5 signal transducers with 4-20mA output (Lumel P120 and P12U)
equipment for noise measurement (on site only during the noise measurement campaigns)

Experimental Test Site for Small Wind Turbines of Narbonne Test report n° 18.5 april, 28 2010
AirDolphin Z-1000-250 Grid connected page 9 / 54
Unless otherwise specified for a particular test, the tests will follow the following procedures:
recording of all the data every 2 seconds
statistical processing on 1mn (average, standard deviation, min and
max values)
data recording in a computer file
periodic visual inspection of the test site (any anomaly will be recorded
and reported)
in the event of change of equipment (measurement equipment or
equipment under test) the test will be re-started
data recorded under particular operating conditions (heavy rain, snow,
ice…) will be validated in a special data base, the criteria of selection of the data will be specified in the measurement report
throughout the measurement campaign, the data will be checked
periodically to ensure the quality and the repetitiveness of the results

Experimental Test Site for Small Wind Turbines of Narbonne Test report n° 18.5 april, 28 2010
AirDolphin Z-1000-250 Grid connected page 10 / 54
a logbook will be maintained up to date on all the important events which have occurred during the measurement period
all the data recorded during the periods of unavailability of the
equipment under test will be ignored

Experimental Test Site for Small Wind Turbines of Narbonne Test report n° 18.5 april, 28 2010
AirDolphin Z-1000-250 Grid connected page 11 / 54
4 Test site environmental data
December
2004 à November
2005
Temperature
(°C)
Relative
Humidity(%)
Atmosph.
Pressure
(mBar)
Maximum 38.8 83 1029
Average (1mn)
14.9 67 1011
Minimum -6.3 33 988
December 2004 to March 2005
Wind speed at 19m (m/s)
Wind speed at 15m (m/s)
Maximum gust 30.5 - 30.2
Max
Average(1mn)
24.3 - 22.9
Average on
the total duration
7.1 - 6.0
May 2005 to
November 2005
Wind speed at
20m (m/s)
Wind speed
at 18m (m/s)
Wind speed
at 16m (m/s)
Maximum gust 26.4 25.9 25.4
Max Average(1mn)
17.7 17.4 16.8
Average on the total duration
- 5.7 5.6

Experimental Test Site for Small Wind Turbines of Narbonne Test report n° 18.5 april, 28 2010
AirDolphin Z-1000-250 Grid connected page 12 / 54
Jan, 1 2008 to
june, 30 2008
Wind speed at 20m (m/s)
Wind speed at 18m (m/s)
Wind speed at 16m
(m/s)
Max gust 29.7 30.0 29.9
Max average (10mn)
18.9 18.5 18.0
Average on the total duration
5.64 5.50 5.44
Mean turbulence intensity on the total duration
18.96 % 19.12 % 19.11 %
Jan, 1 2009 à
december, 31 2009
Wind speed at
20m (m/s)
Wind speed
at 18m (m/s)
Wind speed
at 16m (m/s)
Max gust * 39.60 39.0
Max average
(10mn)
* 24.57 23.98
Average on the total duration
* 5.48 5.42
Mean turbulence intensity on the
total duration
* 19.23 % 19.27 %
* anemometer anomaly

Experimental Test Site for Small Wind Turbines of Narbonne Test report n° 18.5 april, 28 2010
AirDolphin Z-1000-250 Grid connected page 13 / 54
Exemple de Données Météo - Semaine du 10 au 16 Janvier 2005
-2
0
2
4
6
8
10
12
14
16
18
1
Pres Atm (mBar/100) Temp (°C) Humid (%/10) Vent (m/s)
Décomposition par secteur : V1 / D1
15 45 75 105 135 165 195 225 255 285 315 345 375
Direction (°)
2
4
6
8
10
12
14
16
18
Vit
esse
m/s

Experimental Test Site for Small Wind Turbines of Narbonne Test report n° 18.5 april, 28 2010
AirDolphin Z-1000-250 Grid connected page 14 / 54
Distribution par secteur
0
20 %
40 %
60 % 30
60
90
120
150
180
210
240
270
300
330
VentEnergie
Distribution des Vitesses de Vent et Intensité de turbulence à 20m
0
5
10
15
20
25
0 2 4 6 8 10 12 14 16 18 20
Vitesse de Vent (m/s)
Vale
ur
en %
Distribution Brute Distribution Corrigée A=6.33 K=1.96 Intensité de turbulence

Experimental Test Site for Small Wind Turbines of Narbonne Test report n° 18.5 april, 28 2010
AirDolphin Z-1000-250 Grid connected page 15 / 54
5 Operation and safety test
5.1 Test objectives
o to check that the wind turbine shows a operational behaviour in conformity with its design
o to check that provisions related to people safety are correctly put in practice
o to test that the control and protection systems are functioning with
satisfaction
o to check the good dynamic behaviour of the wind turbine with at
least 1.8 times the wind speed corresponding to its nominal power output (data from manufacturer)
5.2 Operation and safety tests
5.2.1 observation of yawing at various wind speeds
o Yawing is fluent for all wind speed.
5.2.2 Start-up and stop test sequences following the protocols recommended by the manufacturer
o validated operation
5.2.3 Emergency stop by action on the main circuit breaker.
o validated operation
5.2.4 Checking of the generated power compared to the manufacturer data
o The generated power is just below 80 % of the power given in the manufacturer data sheet for all the wind speed, but at 13 m/s this
generated power is equal to 81 % of the one given by the manufacturer. The performance data provided by the manufacturer
are taken directly from the DC output of the generator, the electrical losses caused by the inverter are not taken into account. This may explain partially or completely the discrepancy between
the data given by the manufacturer and the measurements made by SEPEN which take into account the inverter, however we have
no precise indication of the proportion of loss to put on the account of this inverter.
5.2.5 Checking of the rotational speed limitation system
o data not directly checked, but the instantaneous measures presented as a cloud of points shows clearly the two modes of
operation of the AirDolphin: normal operation and stall operation

Experimental Test Site for Small Wind Turbines of Narbonne Test report n° 18.5 april, 28 2010
AirDolphin Z-1000-250 Grid connected page 16 / 54
for high wind speed. So we see, not directly, a control of the rotational speed by the electronic of the wind turbine.
5.2.6 Simulations of grid loss network (micro cut and normal cut)
o validated operation: the wind turbine stops very quickly thanks to the low inertia of the rotor. This wind turbine is equipped with a
smart electronic system, giving each minute a little spin to the rotor in order to test if the wind speed is high enough to allow power generation, if the wind is too low the rotor stop.
5.2.7 Test of preventions against not authorized parameters system changes
o The user isn't allowed to change the operational parameters of the
wind turbine
5.2.8 checks of equipment and safety procedures (mechanical, electrical) for installation and maintenance
o The guyed mast provided by the installer was not equipped with the traditional gin pole to tilt up the tower, without this gin pole
the operation is much less safe. The gin pole has been added since installation.
5.2.9 Checking of the grounding system and lightning protection.
o Not checked

Experimental Test Site for Small Wind Turbines of Narbonne Test report n° 18.5 april, 28 2010
AirDolphin Z-1000-250 Grid connected page 17 / 54
6 Reliability tests
6.1 Test objectives
o to check structural integrity and temporal deterioration of the system, the components or the materials (cracks, deformations,
wears…)
o to check the quality of environmental protections (corrosion, paintings and joints …)
o to check the dynamic behaviour of the wind turbine and its grid connection system over the test period
6.2 Reliability test
Preliminary remark:
The first period of the Airdolphin test was disrupted by a series of technical
problems related to an act of vandalism that required the replacement of the machine and a malfunction of the measurement device. The measures of
performance selected for this report were conducted on the period from nov,24 2009 to feb, 8 2010. During this period the wind speed distribution has allowed a power curve, but this period being too short to confirm the
series of reliability test, they have been validated with the machine in operation during the year 2009.
6.2.1 Production for at least 1500 hours at unspecified wind speed
o Validated test
6.2.2 Production lasting at least 250 hours at higher or equal wind speed of
1.2 times the wind speed corresponding to the nominal power output (data manufacturer data)
o we considered testing for reliability, power 1100 W at 12.5 m/s.
not validated
6.2.3 Production lasting at least 25 hours at higher or equal wind speed of
1.8 times the wind speed corresponding to the nominal power output (data manufacturer data)
wind speed 22.5 m/s (12.5 x 1.8) : not validated.
6.2.4 Measured energy higher than 80% of expected energy (according to data manufacturer)
The calculation of the energy from the measured power curve and a Weibull distribution with a shape factor K = 2 (Rayleigh
distribution), is less than 80% of the expected energy. Energy

Experimental Test Site for Small Wind Turbines of Narbonne Test report n° 18.5 april, 28 2010
AirDolphin Z-1000-250 Grid connected page 18 / 54
production depends directly on the performance of the installation, the remark made in § 5.2.4 also applies here.
0
1000
2000
3000
4000
5000
6000
3.0 4.0 5.0 6.0 7.0 8.0 9.0
An
nu
al o
utp
ut (
kWh
)
Annual average wind speed (m/s)
AirDolphin Z-1000-250 annual energy output
Output SEPEN measures
Output manufacturer data
Figure 6-1 Energy output SEPEN - manufacturer

Experimental Test Site for Small Wind Turbines of Narbonne Test report n° 18.5 april, 28 2010
AirDolphin Z-1000-250 Grid connected page 19 / 54
Annual wind speed [m/s]Output SEPEN measures
[kWh/an]
Output manufacturer data
[kWh/an]
3.50 156.0 400
4.00 290.4 800
4.50 474.3 1000
5.00 706.3 1250
5.50 979.0 1600
6.00 1279.3 2100
6.50 1591.1 2550
7.00 1898.4 3100
7.50 2187.3 3800
8.00 2447.3 4600
8.50 2672.2 5200
9.00 2859.0 5900
Table 6-1 Annual energy output
Figure 6-2 Airdolphin energetic output (manufacturer data)

Experimental Test Site for Small Wind Turbines of Narbonne Test report n° 18.5 april, 28 2010
AirDolphin Z-1000-250 Grid connected page 20 / 54
6.2.5 Structural damage
No structural damage observed, except the last machine tested in 2010
on which the gelcoat of a blade has been damaged on the pressure side. Only the coating (gelcoat) is affected by this problem, no damage of the
internal structure of the blade has been found
View 6-1 Damaged blade

Experimental Test Site for Small Wind Turbines of Narbonne Test report n° 18.5 april, 28 2010
AirDolphin Z-1000-250 Grid connected page 21 / 54
7 Power curve measurement
The data were recorded uninterrupted, with a sampling rate of two seconds:
o wind speed at 16, 18 and 20m
o wind direction at 16 and 20m
o temperature on the ground
o atmospheric pressure on the ground
o relative humidity on the ground
o active power at grid connection point (technical building)
The data are sorted out by:
o validated values compared to the sensor range
o plausible values compared to the considered site
o incomplete series on the 1mn measurement averaging period (30 data)
o values outside the validated wind direction sector
To calculate validated wind direction sector for the measurement of each
machine, it is necessary to take into account the neighbouring obstacles, which can be: another wind turbine, trees, measurements mast … The
IEC61400-12 standard gives a calculation defining the disturbed sectors by neighbouring wind turbines according to their diameter and hub height.
Disturbed sector : α = 2Arctan (2Dn/Ln + 0.25)
where Dn is the diameter of the neighbouring machine
Ln is the distance between the 2 machines
This formula has been applied for each wind turbine tower position, the following table summarizes the characteristics of the obstacles taken into
account, and the limits of the disturbed sectors calculated.
The height and the width of the obstacles other than the close machines
(trees) not having been measured, the calculation was not applied for these obstacles. However, the final selected disturbed sectors are rather strongly penalizing, since they include in fact all the disturbed sectors of each
machine, as represented on the following diagram.
One can notice that, compared to the Northern direction, the 2 large
disturbed sectors correspond to the alignment of the 4 towers. The machines were installed so that they are facing undisturbed prevailing winds (wind of
the North-West and wind of south-east).
The data processing software eliminates all the data with wind direction inside one of the 2 disturbed sectors.

Experimental Test Site for Small Wind Turbines of Narbonne Test report n° 18.5 april, 28 2010
AirDolphin Z-1000-250 Grid connected page 22 / 54
Site Obstacle Diameter
Dn
Distance
Ln Angle
Lower
limit
Higher
limit
1 Plot 2 2.9 m 23.4 m 52.6° 12.7° 65.3°
1 trees not calculated
not calculated
not calculated
not calculated
not calculated
2 Plot 1 6.4 m 23.4 m 77.1° 180.5° 257.6°
2 Plot 3 1.4 m 23.4 m 40.3° 41.8° 82.2°
3 Plot 2 2.9 m 23.4 m 52.6° 215.7° 268.3°
3 Plot 4 3.6 m 23.9 m 57.7 ° 44.1° 101.9°
4 Plot 3 1.4 m 23.9 m 40.1° 233° 273°
4 trees not calculated
not calculated
not calculated
not calculated
not calculated
Summary table of the characteristics of the obstacles for the calculation of the disturbed sectors.
Secteurs perturbés
101.85 °
180.45
273.04 °
Nord
12.69 °

Experimental Test Site for Small Wind Turbines of Narbonne Test report n° 18.5 april, 28 2010
AirDolphin Z-1000-250 Grid connected page 23 / 54
The data are processed to extract the following information by 1mn steps:
o average value
o standard deviation
o maximum value
o minimum value
The data are corrected according to the wind gradient
The series are normalized for the average air density measured on the test site
The power curve:
o the normalized power curve is established according to the bin method (see standard IEC61400-12 §5.2)
o the 0.5m/s bins are contiguous and aligned on the multiple of 0.5m/s
o for each bin one records:
the number and values of the normalized wind speeds (representing the 1mn normalized averages)
the number and values of normalized active power (representing the 1mn normalized averages)
o for each bin one calculates:
the total average the wind speed on the interval (total number of values divided by their number)
the total average of the power on the interval (total number of the values divided by their number)
7.1 Measured power curve
in red the calculated points of the average power curve,
in green the dispersion indicators of the measures, the horizontal lines
indicates the limits at plus and minus one standard deviation .
en blue number of measures points

Experimental Test Site for Small Wind Turbines of Narbonne Test report n° 18.5 april, 28 2010
AirDolphin Z-1000-250 Grid connected page 24 / 54
0
100
200
300
400
500
600
700
800
900
1000
1100
1200
1300
1400
0 1 2 3 4 5 6 7 8 9 10 11 12 13 14 15 16 17 18 19
Act
ive
po
we
r (
W)
-d
ata/
bin
Wind speed (m/s)
AirDolphin Z-1000-250 from 12-24-2009 to 2-8-2010
Electrical power
data number per bin
Figure 7-1 Power curve o the AirDolphin Z-1000-250
o Calculation parameters for the power curve:
Sampling rate : 2 seconds
integration interval : 1 minute
Bin width: 0.5 m/s
Direction : from 180 to 360 °
Filtering range for vertical wind gradient: -0.0 à 0.10
Filtering range for turbulence intensity: from 0.0 to 15.0 %
Corrected power according to air density and brought to the standard density of 1.225 kg/m3

Experimental Test Site for Small Wind Turbines of Narbonne Test report n° 18.5 april, 28 2010
AirDolphin Z-1000-250 Grid connected page 25 / 54
There is a wide dispersion of power for high speeds due to the low number of data, but we can see also the mode of regulation of the machine with the
cloud of points on the drawing below:
0
200
400
600
800
1000
1200
1400
1600
0 2 4 6 8 10 12 14 16 18 20
Pu
issa
nce
(W
)
Vitesse vent (m/s)
AirDolphin points mesure (2 secondes)
Figure 7-2 Instantaneous power data
We can see at 10 m/s the power curve is divided into two branches, one
growing until 1200 W at 14 m/s and the other one with a relatively constant power to 450 W up to 18 m / s

Experimental Test Site for Small Wind Turbines of Narbonne Test report n° 18.5 april, 28 2010
AirDolphin Z-1000-250 Grid connected page 26 / 54
7.2 Manufacturer power curve
Figure 7-3 Manufacturer power curve Airdolphin Z-1000-250

Experimental Test Site for Small Wind Turbines of Narbonne Test report n° 18.5 april, 28 2010
AirDolphin Z-1000-250 Grid connected page 27 / 54
7.3 Power coefficient
0%
5%
10%
15%
20%
25%
30%
35%
0 1 2 3 4 5 6 7 8 9 10 11 12 13 14 15 16 17 18 19
Po
we
r co
eff
icie
nt
Wind speed (m/s)
AirDolphin power coefficient
Figure 7-4 AirDolphin Z-100-250 power coefficient
The power coefficient rises 30.7% at 11 m/s and remains within the range of 25 to 30% for the speed range from 8 to 14 m/s. This ratio remains above
20% for the speed range of 6 to 10 m/s considered the most productive for small wind energy.

Experimental Test Site for Small Wind Turbines of Narbonne Test report n° 18.5 april, 28 2010
AirDolphin Z-1000-250 Grid connected page 28 / 54
8 Acoustic noise measurments
PHILIPPE ZULIANI
938, chemin des Dames Noires
82000 Montauban
Tél : 05 63 63 38 61
Portable : 06 07 14 76 61
Adresse électronique : [email protected]
Date: 28 September 2009
Réf: AnalysePhase3Mat3.doc

Experimental Test Site for Small Wind Turbines of Narbonne Test report n° 18.5 april, 28 2010
AirDolphin Z-1000-250 Grid connected page 29 / 54
8.1 Objectives
Our intervention aims at specifying the acoustic impact of wind turbine on
the environment. The selected site is the small wind turbine test site of Montplaisir in Narbonne.
8.2 Principle
The Montplaisir site includes 4 masts to support 4 windmills simultaneously. The figure on Page 37, shows the relative arrangement of these structures.
The analysis of this noise impact is based on the law of 18 April 1995 , decree 95-408 "Combatting neighbourhood noise". It fixes the maximum
noise aggravation: 5 dB(A) during the day (7am - 10pm) and 3 dB(A) during the night (10pm - 7am). The aggravation is the difference in noise levels noted when the installation is operating (ambient noise) and when it is
stopped (background noise).
For each mast, and thus for each of the windmills fixed to them, we
considered 4 points, Points 1,3,5,7, respectively located at distances of 5m, 10m, 20m and 35m from the mast.
For each of these points, we measured the ambient noise, the background
noise and by subtraction determined the aggravation.
The reading, determination of the ambient or background noise for one
analysis point, consisted in taking five samples of 10 s during a period of 5 minutes.. These 10s measurements are made via frequency analysis based on one third octave.
The study is conducted mast by mast. With only one windmill in operation, for these 4 points, we measured the ambient noise, then stopped the
windmill being studied to measure the level of background noise for these 4 points. The approach was repeated for the three other windmills.
Associated with these acoustic measurements are wind speed measurements
determined using an anemometer placed on a weather mast located in the centre of the site.
In order to measure the variability of the windmills' noise emissions, we conducted 3 measurement campaigns. By campaign we mean a characterisation of ambient noise and background noise on all site points, for
a given wind speed.
Following the analysis by windmill, a summary sheet is inserted to give an
overall appreciation of its noise impact. For the three campaigns, its specifies the levels of ambient noise, of background noise, the corresponding
aggravation. All these characteristics are expressed in dB(A). A campaign, wind speed determined, may be accompanied by an index, indicating an occasional aggravation greater than 5 dB(A) in a specific third octave band:
if this band is located in the frequency field defined by the octaves 125 Hz and 250 Hz, this index is L,

Experimental Test Site for Small Wind Turbines of Narbonne Test report n° 18.5 april, 28 2010
AirDolphin Z-1000-250 Grid connected page 30 / 54
if this band is located in the frequency field defined by the octaves 500 Hz and 1,000 Hz, this index is M,
if this band is located in the frequency field defined by the octaves
2,000 Hz and 4,000 Hz, this index is H,
This document only examines the acoustic impact of the windmill located on
site mast no. 1 on 06.06.09
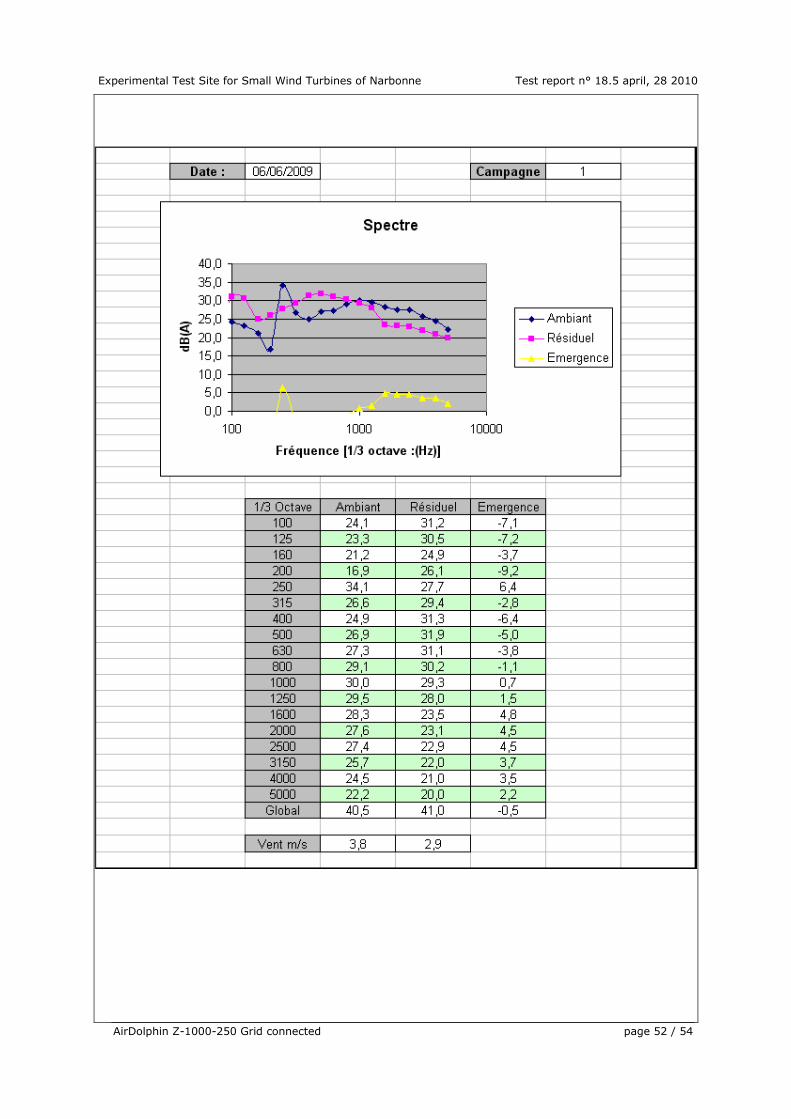
8.3 Measurements
Equipment used: CESVA real time analyzer, type RC-401.
The table below specifies the characteristics of these arrangements indicating:
the windmill type, Windmill,
the installation mast, Mast,
the measurement campaigns conducted, by date, Campaign,
Wind turbine
Mast
Campaign
06/06/2009
7H30
06/06/2009
10H30
06/06/2009
13H00
AirDolphin Z-1000-250
3 X X X
All the results are presented in appendix.

Experimental Test Site for Small Wind Turbines of Narbonne Test report n° 18.5 april, 28 2010
AirDolphin Z-1000-250 Grid connected page 31 / 54
8.4 Analysis
The first three campaigns correspond to three wind configurations: for the
first two campaigns, the wind was from the land (downwind of the windmill), for the third campaign it was from the sea (upwind of the windmill): for
campaigns 1 and 2, it may be considered weak. For the following campaign, it was average.
The force associated with the wind direction has an immediate impact on the
background noise perceived, depending on motorway traffic, surrounding vegetation, the presence of pines, scrub type vegetation, and the
topography.
It can be seen that the background noise varies from 49 dB(A) to 37 dB(A), higher at the crest, (points 1 and 3) than on the slope (points 5 and 7). This
is especially true when the wind is from the land (screen effect due to the topography in relation to the A61). During sea winds, the A9, and the
National Road, being the two main sources, the impact is not reduced by this phenomenon, as they are in direct line of the Montplaisir site. However, being further away, the atmospheric absorption, especially at high frequencies
(2,000 Hz and 4,000 Hz) is greater: characteristic curves obtained with a plateau reaching the 1,000 Hz octave, then a drastic drop for the higher
octaves.
Experimental Test Site for Small Wind Turbines of Narbonne Test report n° 18.5 april, 28 2010
AirDolphin Z-1000-250 Grid connected page 32 / 54
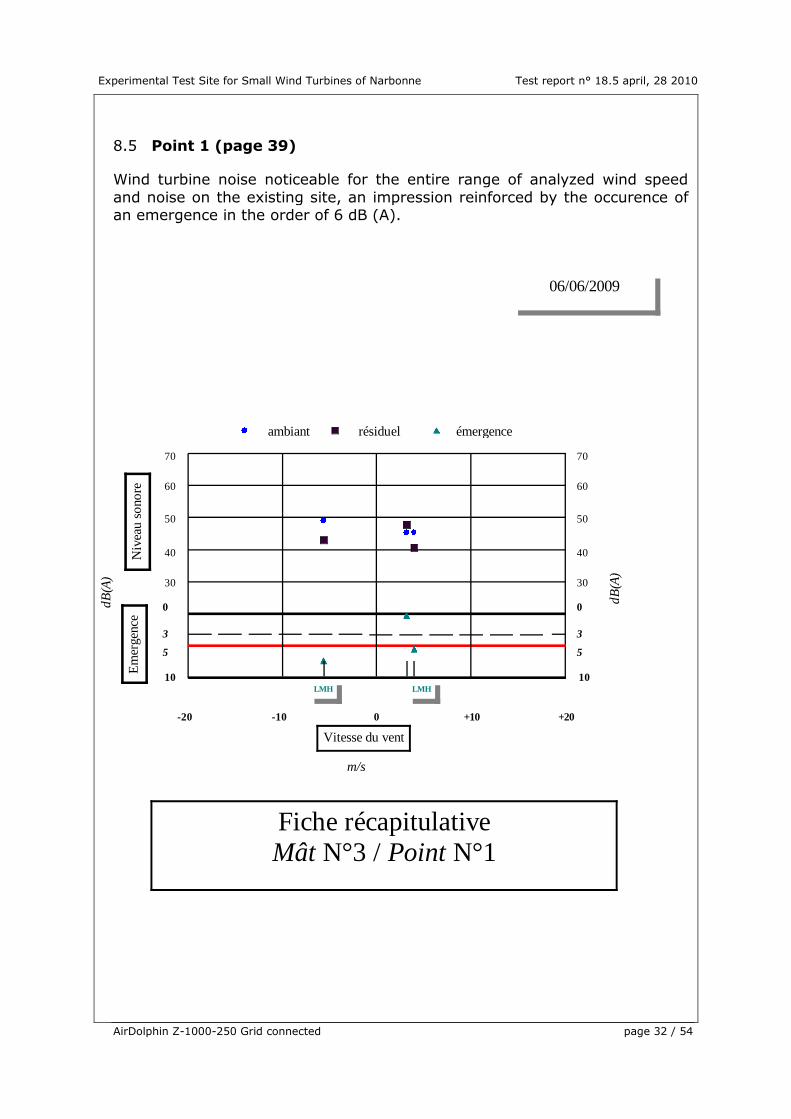
8.5 Point 1 (page 39)
Wind turbine noise noticeable for the entire range of analyzed wind speed
and noise on the existing site, an impression reinforced by the occurence of an emergence in the order of 6 dB (A).
70
60
50
40
30
0
10
70
60
50
40
30
dB
(A)
dB
(A)
Niv
eau
so
no
reE
mer
gen
ce
-20 -10 0 +10 +20
Vitesse du vent
m/s
ambiant résiduel émergence
5
3
0
10
5
3
Fiche récapitulative
Mât N°3 / Point N°1
06/06/2009
LMHLMH

Experimental Test Site for Small Wind Turbines of Narbonne Test report n° 18.5 april, 28 2010
AirDolphin Z-1000-250 Grid connected page 33 / 54
8.6 Point 3 (page 43).
As with the previous point, the perception of the wind turbine is clear.
Getting emergence up to 5 dB (A).
70
60
50
40
30
0
10
70
60
50
40
30
dB
(A)
dB
(A)
Niv
eau
so
no
reE
mer
gen
ce
-20 -10 0 +10 +20
Vitesse du vent
m/s
ambiant résiduel émergence
5
3
0
10
5
3
Fiche récapitulative
Mât N°3 / Point N°3
06/06/2009
MH LMH

Experimental Test Site for Small Wind Turbines of Narbonne Test report n° 18.5 april, 28 2010
AirDolphin Z-1000-250 Grid connected page 34 / 54
8.7 Point 5 (page 47).
The distance from the mast (measurement point 20 m from it), reduces the
perception of the wind turbine noise. This sensation is materialized through a reduction in emergence observed, the latter being about 2 dB (A).

Experimental Test Site for Small Wind Turbines of Narbonne Test report n° 18.5 april, 28 2010
AirDolphin Z-1000-250 Grid connected page 35 / 54
8.8 Point 7 (page 51).
The trend observed in the previous point is confirmed:
o Reduced perception. The spectral difference between the ambient noise and may explain,
o Low emergence, not exceeding 3 dB (A) with upwind (-6 m / s).
70
60
50
40
30
0
10
70
60
50
40
30
dB
(A)
dB
(A)
Niv
eau
so
no
reE
mer
gen
ce
-20 -10 0 +10 +20
Vitesse du vent
m/s
ambiant résiduel émergence
5
3
0
10
5
3
Fiche récapitulative
Mât N°3 / Point N°7
06/06/2009
HLMH LH

Experimental Test Site for Small Wind Turbines of Narbonne Test report n° 18.5 april, 28 2010
AirDolphin Z-1000-250 Grid connected page 36 / 54
8.9 Conclusion.
This series of measurements validated the meteorological protocol
implemented specifying certain site characteristics which are interesting due to the many possible observation possibilities: upwind or downwind,
significant variation in background noise depending on direct or indirect exposure of the points to the motorway environment. . This type of investigation also enables the noise emissions of windmills to be examined
practically according to a wind range of configurations, for their impact on the environment.

Experimental Test Site for Small Wind Turbines of Narbonne Test report n° 18.5 april, 28 2010
AirDolphin Z-1000-250 Grid connected page 37 / 54
8.10 Measurement point implementation
20 m20 m20 m
Au
toro
ute
5 m
10
m
20
m 35
m
1234
Position Mât
Point de référence
Point Distance
Implantation des points de mesure
Mer Méditerranée
Point 1
Point 3
Point 5
Point 7

Experimental Test Site for Small Wind Turbines of Narbonne Test report n° 18.5 april, 28 2010
AirDolphin Z-1000-250 Grid connected page 38 / 54
9 Annexe
Characterization of noise dispersion of the AirDolphin Z-1000-250, mast 3.

Experimental Test Site for Small Wind Turbines of Narbonne Test report n° 18.5 april, 28 2010
AirDolphin Z-1000-250 Grid connected page 39 / 54
9.1 Point N°1
20 m20 m20 m
Au
toro
ute
5 m
10
m
20
m
35
m
1234
Position Mât
Point de référence
Point Distance
Implantation des points de mesure
Mer Méditerranée
Point 1
Point 3
Point 5
Point 7

Experimental Test Site for Small Wind Turbines of Narbonne Test report n° 18.5 april, 28 2010
AirDolphin Z-1000-250 Grid connected page 40 / 54

Experimental Test Site for Small Wind Turbines of Narbonne Test report n° 18.5 april, 28 2010
AirDolphin Z-1000-250 Grid connected page 41 / 54

Experimental Test Site for Small Wind Turbines of Narbonne Test report n° 18.5 april, 28 2010
AirDolphin Z-1000-250 Grid connected page 42 / 54

Experimental Test Site for Small Wind Turbines of Narbonne Test report n° 18.5 april, 28 2010
AirDolphin Z-1000-250 Grid connected page 43 / 54
9.2 Point N°3
20 m20 m20 m
Au
toro
ute
5 m
10
m
20
m
35
m
1234
Position Mât
Point de référence
Point Distance
Implantation des points de mesure
Mer Méditerranée
Point 1
Point 3
Point 5
Point 7

Experimental Test Site for Small Wind Turbines of Narbonne Test report n° 18.5 april, 28 2010
AirDolphin Z-1000-250 Grid connected page 44 / 54

Experimental Test Site for Small Wind Turbines of Narbonne Test report n° 18.5 april, 28 2010
AirDolphin Z-1000-250 Grid connected page 45 / 54

Experimental Test Site for Small Wind Turbines of Narbonne Test report n° 18.5 april, 28 2010
AirDolphin Z-1000-250 Grid connected page 46 / 54

Experimental Test Site for Small Wind Turbines of Narbonne Test report n° 18.5 april, 28 2010
AirDolphin Z-1000-250 Grid connected page 47 / 54
9.3 Point N°5

Experimental Test Site for Small Wind Turbines of Narbonne Test report n° 18.5 april, 28 2010
AirDolphin Z-1000-250 Grid connected page 48 / 54

Experimental Test Site for Small Wind Turbines of Narbonne Test report n° 18.5 april, 28 2010
AirDolphin Z-1000-250 Grid connected page 49 / 54

Experimental Test Site for Small Wind Turbines of Narbonne Test report n° 18.5 april, 28 2010
AirDolphin Z-1000-250 Grid connected page 50 / 54

Experimental Test Site for Small Wind Turbines of Narbonne Test report n° 18.5 april, 28 2010
AirDolphin Z-1000-250 Grid connected page 51 / 54
9.4 Point N°7
20 m20 m20 m
Au
toro
ute
5 m
10
m
20
m
35
m
1234
Position Mât
Point de référence
Point Distance
Implantation des points de mesure
Mer Méditerranée
Point 1
Point 3
Point 5
Point 7
Experimental Test Site for Small Wind Turbines of Narbonne Test report n° 18.5 april, 28 2010
AirDolphin Z-1000-250 Grid connected page 52 / 54

Experimental Test Site for Small Wind Turbines of Narbonne Test report n° 18.5 april, 28 2010
AirDolphin Z-1000-250 Grid connected page 53 / 54

Experimental Test Site for Small Wind Turbines of Narbonne Test report n° 18.5 april, 28 2010
AirDolphin Z-1000-250 Grid connected page 54 / 54